Article

Last-Mile Capacity Constraints in Online Grocery Fulfilment in Great Britain

1
School of Geography, University of Leeds, Leeds LS2 9JT, UK
2
Leeds Institute for Data Analytics, University of Leeds, Leeds LS2 9JT, UK
3
MRC/CSO Social and Public Health Sciences Unit, School of Social and Political Science, University of Glasgow, Glasgow G12 8QQ, UK
*
Author to whom correspondence should be addressed.
J. Theor. Appl. Electron. Commer. Res. 2022, 17(2), 636-651; https://doi.org/10.3390/jtaer17020033
Submission received: 21 March 2022 / Revised: 5 May 2022 / Accepted: 9 May 2022 / Published: 10 May 2022

Abstract

:
Forecast growth in e-commerce home-delivery demand provides retailers with opportunities for expansion and increased levels of investment. To maximise these growth opportunities, retailers face operational and logistical challenges related to order fulfilment and the last mile. In contrast to other sectors, many grocers operate a store-based delivery model rather than a separate distribution channel. Under this model, orders are picked from store shelves and store-based fleets of delivery vehicles are used for last-mile fulfilment (delivery to the consumers’ home). With very rare access to commercial data from Sainsbury’s, the second largest grocer in Great Britain, we analyse the geographical variations of online groceries fulfilment capacity at store, region, and rural–urban geography levels, exploring the interrelated impact of capacity constraints related to storage and delivery in limiting the further growth of these services. The spatial extent of delivery service areas are found to considerably vary between stores and the existing store network presents barriers to further capacity expansion in some regions. We argue factors associated with the last mile are an important capacity constraint/enabler in the e-groceries sector and suggest that the effective expansion of these services requires further research into online service area delineation to maximise delivery efficiency and capacity. The approach used here is readily transferable to other online service delivery providers in both GB and elsewhere.

1. Introduction

E-commerce is commonplace in the grocery retail industry in Great Britain (GB) with the major players in this sector having offered the service for an excess of twenty years. Already established as one of the fastest growing grocery sectors in the world [1,2], e-commerce in the GB grocery industry experienced a dramatic growth as a result of the COVID-19 pandemic, taking the market share for online grocery sales from 6.2% in 2019 to 8.9% in 2021 [3]. Industry forecasts point towards a sustained growth of 21.4% over the next five years, equating to GBP 1 for every GBP 11 spent on groceries flowing through the online channel by 2026 [3].
These forecasts represent tremendous growth and expansion opportunities for retailers who face the considerable challenge of optimising their online offerings in search of profitability in a saturated and competitive market [4]. Grocery e-commerce in GB operates as an ‘omnichannel’ market place—where multiple channels are available for the consumer to use interchangeably [5]. These channels comprise: (i) ordering online for home delivery; (ii) ordering online to collect in-store and (iii) ordering online to collect from a non-store-based pick-up point (with ii and iii often referred to as ‘click and collect’). The home-delivery channel dominates the grocery e-commerce landscape [2]. Whilst offering greater convenience for consumers, it transfers the cost of the ‘last mile’ to the retailer who must face the logistical and cost implications of transporting perishable, bulky and temperature-controlled goods to the consumer, typically allowing the consumer to choose a timed delivery slot.
Rather than using a separate distribution channel as in many other retail sectors, the modal method for e-commerce distribution for GB groceries is through store-based fulfilment [6]. Orders placed online are picked from the shelves of supermarkets (fulfilment stores) that are proximate to the delivery address, minimising last-mile costs and enabling grocers to upscale their e-commerce offering by utilising existing infrastructure. However, this model restricts online delivery to those localities where existing store-based infrastructure is present or requires considerable last-mile costs if delivery vehicles are used to provide home-delivery coverage across a large service area extending well-beyond the fulfilment store.
With no physical stores, retailers, such as Ocado, operate technologically advanced online fulfilment centres (‘dark stores’). This allows them to enter new geographical markets without a physical store presence. At the time of analysis, Ocado provided coverage to 75% of the GB population from a handful of large-format dark stores [7]. The high costs associated with this fulfilment model may restrict its usage to localities where economies of scale can be achieved. However, even in these markets, major grocers have closed dark stores in favour of order fulfilment from existing stores, cutting last-mile costs associated with delivery (since these stores are more proximate to the consumer) and maximising use of redundant in-store space [8].
More recently, major grocers have also introduced e-commerce services in collaboration with third-party delivery partners (such as Deliveroo), drawing on their network of smaller-format town and city centre stores to offer local rapid home delivery, including Tesco ‘Whoosh’, Sainsbury’s ‘Chop Chop’ and Ocado ‘Zoom’, but these typically have restricted geographical availability and are designed for smaller orders. Additionally, on-demand groceries supplied and delivered by pure-play retailers, including Getir, Zapp and Jiffy, rely on much smaller dark stores, each serving smaller groups of neighbourhoods, with over 150 dark stores estimated to have opened by these retailers in the period 2019–2021 [9]. Whichever fulfilment method is used, the retailers’ ability to meet e-commerce demand within a given locality is dependent upon matching the e-commerce capacity to consumer demand. This was highlighted in the early stages of the COVID-19 pandemic when many consumers faced considerable difficulties in securing a delivery slot, highlighting capacity constraints within the system. These constraints are predominantly driven by the volume of orders that can be picked, packed and stored in-store, along with a finite number of delivery vehicles and drivers.
The rapid introduction of additional delivery slots by the major retailers at the start of the COVID-19 pandemic [10,11,12,13,14] made use of additional capacity that could be accessed quickly (e.g., acquisition of additional delivery vehicles/allocation of more in-store space to order storage). The addition of additional e-commerce capacity at the start of the pandemic capitalised on ‘easy wins’—utilising existing slack in the system. Longer-term ongoing capacity growth requires robust capacity planning and infrastructure investment to ensure that online demand can be met utilising store-based order fulfilment.
Whilst conceptually straightforward—the greater the e-commerce capacity of a store, the more orders it is able to fulfil in a given period—the range of factors determining capacity are complex and interlinked. Store-level e-commerce capacity is driven by the size of the store; availability of staff for order picking and packing; storage and loading space for deliveries; and the number of delivery vehicles that can operate from that store. Depending on the sub-channel used by the consumer, it may also be driven by the capacity of click-and-collect facilities or the time taken to deliver those orders to consumers’ homes, which is itself influenced by the distance travelled, the degree of traffic congestion, the ease of gaining access to the delivery address and the geographical spread of consumers.
Given the importance of geographical factors in driving e-commerce capacity at the store level, it is surprising that the geographical studies of online groceries from a supply-side perspective are notably absent from the literature. Whilst the demand side is well studied (see Hood et al. [4] for an overview), the supply side is underrepresented and reliant on data from retailers related to their e-commerce provision. With the exception of Newing et al. [7], who web-scraped online grocery delivery coverage in GB, we are aware of no studies that analyse the geographical aspects of online groceries capacity or provision, which we address in this paper.
To do so, we utilise rarely available commercial data supplied by Sainsbury’s, the second largest grocery retailer in Great Britain (by market share). Two research questions are addressed: (i) How does e-commerce capacity vary across their store network in relation to underlying geography?; and (ii) How does the service area used in last-mile order fulfilment vary between stores in the network and how is this related to underlying geography? The following section discusses the existing research on grocery e-commerce operations in the context of capacity and coverage. We then introduce our data and outline the analysis conducted, which is presented fully in the penultimate section, prior to a concluding discussion of the practical implications and future research.

2. Literature Review

There is a considerable body of established applied geographical research focused on the grocery retail sector, most notably on the interaction between retail supply and demand. This includes the development of retail location models to support site selection, impact assessment and network planning [15]. The academic literature reports on a number of studies that added demand-side sophistication to those models, often in conjunction with commercial sector partners [16,17,18,19]. These studies tend to focus exclusively on consumer interactions with the physical store network, rather than the online channel, within which the drivers of consumer store-choice and expenditures are different. With the exception of Beckers et al. [20], there are a dearth of studies that consider the spatial and logistical implications of groceries e-commerce from a geographical and supply-side perspective. This is surprising given the relatively abundant body of literature focusing solely on the online proponents of running the service, e.g., see [21,22].
The gap in the research related to the geographical components of the groceries e-commerce supply side is not driven by lack of knowledge of the demand side. The literature recognises a range of area-based and socio-demographic factors, which drive the consumer uptake of groceries e-commerce [2,23,24]. The relationship between groceries e-commerce uptake and the physical grocery retail supply side is also well-documented, with evidence that geographic theories related to consumer propensity to shop online [25] hold true in the GB groceries sector [2,26].
Whilst the demand side is well-researched, an understanding of the groceries e-commerce supply side are more limited and typically considered from a logistics perspective. The literature commonly focusses on vehicle routing [27], on-demand logistics (near-instant delivery) [28] or the design of infrastructure (such as collection lockers) to reduce environmental impacts [29,30]. This is unsurprising given that the costs associated with the ‘last mile’ are estimated to account for as much as 50% of total supply chain costs in this channel [5], with list-mile delivery representing the least efficient stage of groceries e-commerce order fulfilment [31]. These costs and inefficiencies are partially driven by the spatial fragmentation that results from stores acting as distribution centres [32]. As a result, it is widely reported that grocers struggle to break even on their e-commerce services [10], with international examples of e-grocers whose overall failure can be attributed with logistical and cost challenges associated with the last-mile act of delivery to the consumer [33].
The earliest example of grocery home delivery utilising store-based fulfilment was Tesco, developing their near-national online groceries coverage in the late 1990s and early 2000s using their physical store network for warehousing, order picking, packing and delivery. This enabled rapid geographic expansion with relatively low levels of infrastructure investment, alongside lower last-mile costs driven by shorter delivery distances between fulfilment centre (store) and delivery address [34]. Whilst those retailers with an extensive store network experimented with online fulfilment centres (OFCs) (‘dark stores’) in order to try to reach a wider consumer base [35], focus for most retailers has been on the optimisation of the in-store fulfilment method [8]. Those retailers predominantly utilising their store network for order fulfilment tend to have a near-national coverage, with Tesco, Asda and Sainsbury’s all offering online groceries coverage to in excess of 98% of households in 2019 [7]. By contrast, Ocado (and retailers using the Ocado platform, such as M&S) and Amazon Fresh, which do not benefit from a network of fulfilment stores, provide online groceries coverage to approx. 75% and 15% of GB households, respectively, with ‘Amazon Fresh’ (akin to the home-delivery offer provided by the major grocers) available only to consumers based within London [7].
The typical home-delivery approach applied in the GB groceries sector enables the consumer to select a timeslot for their delivery, with retailers needing to minimise costs in the last mile, whilst also offering consumers timely delivery in order to maximise customer satisfaction [27]. Most online grocers offer consumers the option to pay per delivery, or to subscribe to a ‘delivery pass’, unlocking free unlimited delivery, subject to qualifying minimum order values. Whilst delivery passes may reduce food waste (encouraging consumers to order food more frequently, meeting their needs for the next few meals) [36], smaller and more frequent orders pass increased last-mile costs onto the retailer, whilst also increasing environmental costs [37]. This drive to meet customer satisfaction in relation to delivery speed and cost exacerbates inefficiencies with complex and costly last-mile vehicle routing required [5,38]. Alternative models exist for delivery—for example, the use of collection points and refrigerated lockers, commonplace in mainland Europe, transfers some last-mile costs back onto the consumer and reduces logistical requirements and environmental costs faced by the retailer [30,39]. Whilst GB retailers introduced collection points as an attempt to shift some of the last-mile costs back onto the consumer [40,41], the uptake of these services remains notably behind that of home-delivery services, with consumers exhibiting a preference for home delivery [2].
Following the COVID-19 pandemic, the demand for grocery e-commerce spiked [3,10]. Grocery retailers quickly accelerated their expansion plans in order to meet this demand through the expansion of capacity, increasing delivery slots and hiring staff [2,8,14,15]. The notion of investing in infrastructure to increase capacity is also a common theme related to home-delivery logistics outside of grocery retail. For example, parcel delivery company DPD have recently created 6500 jobs in order to scale up delivery operations [42] and The Royal Mail have moved to pilot Sunday deliveries to increase the number of orders that can be fulfilled per week [43].
Whilst notions of capacity are conceptually straightforward, there remains a gap in the academic research concerning the role of capacity in a grocery e-commerce context, which we begin to address in this paper using rarely available commercial data supplied by Sainsbury’s. Sainsbury’s provided online groceries coverage to 98% of GB households at the time of analysis [7]. Sainsbury’s have invested heavily in their online home-delivery and click-and-collect operations since launch in 1996, and 234 stores operated as online groceries fulfilment centres at the time of analysis. The retailer has previously engaged with the academic sector to derive new insights into the aspects of their e-commerce offering, including the impact of delivery slot availability and delivery slot price on customer demand for home delivery [44] and utilisation of store-based click and collect [41]. This study is the first to geographically analyse order-fulfilment capacity.
Sainsbury’s have a dedicated head office team responsible for capacity planning for their e-groceries operation, managing the balance between consumer demand and the number of orders that can be met within their network. This balance between demand and capacity can fluctuate on a week-by-week basis based on order volumes and is primarily experienced at the store level, with no easy mechanism to re-allocate capacity (e.g., delivery vehicles) between stores on a short-term basis. Underused capacity (lack of orders) or a lack of capacity (too many orders) at a store level can result in inefficient usage of resources or customer dissatisfaction.
Alongside the fluctuations of consumer demand (the volume of orders and the number of items ordered), store-level capacity for order fulfilment fluctuates and is driven by a number of factors that include:
  • The number of delivery vans and drivers available on a given day/shift;
  • The number of staff available for in-store order picking and packing;
  • Productivity of delivery vans—the number of orders that can be delivered during a single shift, which is influenced by the distance travelled between delivery addresses and the size of each customer order (larger orders take up more space and can restrict the number of orders carried by a single vehicle).
The distance travelled in delivering customer orders is thus an important factor influencing delivery capacity at the store level. The delineation of store service areas—the geographic area over which a given store is able to deliver orders—is an intensive process that attempts to match demand to capacity in spite of neither factor being static. Whilst store-level service areas are designed to be as compact as possible, operational requirements often mean that delivery vehicles make inefficient journeys, which have knock-on cost, efficiency and sustainability implications for the retailer. Commercial sensitivities in this highly competitive sector restrict the extent to which we can fully elaborate on the drivers of these delivery inefficiencies. However, given that the store-level balance between demand and capacity is not static, proximate stores often share delivery capacities. For a given customer order, capacity limitations at their most proximate store may result in order fulfilment being undertaken by an alternative store in the vicinity. This results in delivery vehicles travelling into a neighbouring stores’ service areas, increasing journey times and associated costs (time, financial and environmental), reducing the number of orders that can be delivered, thus affecting the overall capacity.
Some store-level service areas may also be inefficient by design, especially where local capacity has grown via the introduction of additional new fulfilment stores. Without ongoing re-organisation of store-level service areas, the introduction of new stores and the subsequent overlap or splitting of service areas may result in dysfunctional or detached service areas. These contribute to inefficient vehicle routing, time-consuming delivery routes and resultant reduced capacity. These store-level capacity constraints are recognised as key barriers to efficient grocery e-commerce operations [12]. As such, capacity should be considered at a local level and recognised as a geographical and logistical challenge, as examined in the following sections, beginning with an overview of the commercial-capacity data provided to support this research.

3. Materials and Methods

3.1. Data

In support of this research, Sainsbury’s have provided rarely available data on the supply side of their e-commerce operations, facilitating an insight into store-level e-commerce order capacity across the network and the logistical implications (e.g., in-store storage space) of fulfilling orders through a store-based model. Data used for this research relate to the 2019 calendar year prior to the COVID-19 pandemic. Data are provided for all 234 stores that acted as fulfilment sites for online groceries at the time, with a range of geographic and attribute information provided for each fulfilment store, with example data outlined in Table 1.
The capacity data represent a store’s ability to fulfil home-delivery orders. The academic literature commonly uses store floor space as a proxy for e-commerce capacity [20,26] and so the provision of more detailed capacity data are novel and a key strength of this research. In order to preserve commercial data sensitivity, all indicators of capacity presented in this paper are a relative value, with higher values identifying greater capacity within the order-fulfilment system, enabling higher order volumes to be fulfilled. This enables us to analyse relative capacity in different geographical locations, at different store types and within different parts of the system in a consistent manner whilst preserving the confidential nature of these data.
We present a number of measures of e-commerce capacity, as supplied by Sainsbury’s, from their in-house store-level operational data. Store-based capacity refers to store-level ability to operate an e-commerce service, including a measure of the capacity of the storage space available for e-commerce orders (which comprise chilled, frozen and ambient (non-temperature-controlled) goods). The store-based capacity values that we present are a relative value that is indicative of the level of capacity at a given store, enabling a comparison between stores, but is not directly translatable into a count of orders or a physical storage space. Delivery capacity relates to the capacity to handle orders in the ‘last-mile’ stage of order fulfilment, with our reported relative capacity values driven by the availability of loading space, and delivery-vehicle availability at each fulfilment store. Delivery-vehicle availability is directly related to the time taken to complete deliveries, influenced by the distance vehicles are required to travel to reach customer delivery addresses. These data are used in our analysis in the format supplied by Sainsbury’s, we are not able to drill down further into the factors driving those capacities, with the exception of constraints on expansion, explored below.
As highlighted in Table 1, these data also capture the major constraints on capacity experienced at each fulfilment store (barriers to short-term capacity expansion). There are three possible constraints within our data, limited ambient storage space, limited chilled storage space, or mitigating loss factors (MLFs), the latter related to wider unspecified constraints in the store network that limit that stores ability to handle further e-commerce orders. These are directly drawn from Sainsbury’s in-house data as compiled by their e-commerce, property and store-based teams. Example stores 2 and 3 are constrained by store-based factors, even though their potential delivery capacity is far greater. This applies to 49 stores in our dataset, for whom the expansion of store-based capacity would enable these stores to fulfil a greater number of customer orders as additional delivery capacity already exists. Barriers to expansion also include delivery constraints, which is the focus of this research—these capture limitations in the number of deliveries that can be made by a given store due to factors associated with the last mile, including vehicle availability. Store-level delivery capacity is analysed in Section 4.1, including aggregation by region and area type, utilising the ONS rural–urban classification of small areas in Great Britain [45,46].

3.2. Methodology

Given the importance of the last mile (specifically the time taken to deliver orders to customers who are not geographically proximate to the store) as a potential capacity limitation at the store level, we calculated the inferred maximum distance travelled to undertake deliveries on a store-by-store basis. Taking account of each fulfilment store’s location, we constructed distance-based delivery service areas, adopting the assumption that each consumer placing a home-delivery order will be served by the nearest physical fulfilment store. Whilst our discussion with industry partners recognised that this is not always the case, it acts here as a readily available proxy for delivery-service areas. In keeping with in-house network planning at Sainsbury’s, the analysis uses postal geography to unpick the spatial patterns of delivery service areas. Using the Euclidean (straight line) distance, each postcode sector (akin to a large neighbourhood containing an average of 3000 addresses) [47] is assigned to its nearest fulfilment store, developing service areas using a Voronoi region approach.
At the time of analysis, Sainsbury’s offered geographical coverage to 98% of all GB households. The 2% of households not served are predominantly outlying rural areas in Scotland and Wales [7]. For the purposes of this analysis, all postcode sectors were included within these distance calculations. We also re-calculated these service areas for all large-format stores, irrespective of whether they currently act as online groceries fulfilment centres. We defined a large-format store as a store with a floorspace greater than 15,069 square feet, in keeping with the Competition and Markets Authority (CMA). All existing Sainsbury’s fulfilment stores are large-format stores, with this format offering the product ranges and storage space required to undertake online groceries fulfilment. Delineating service areas for all large-format stores enables us to assess the future potential for online order fulfilment and the potential geographical constraints associated with the home-delivery service.
The following section presents and discusses our findings, beginning with an overview of capacity across the network, with a focus on geographical constraints to further delivery-capacity expansion at a store level and urban–rural influences on capacity. We then explore the geographical factors associated with the last mile based on our service-area analysis.

4. Results

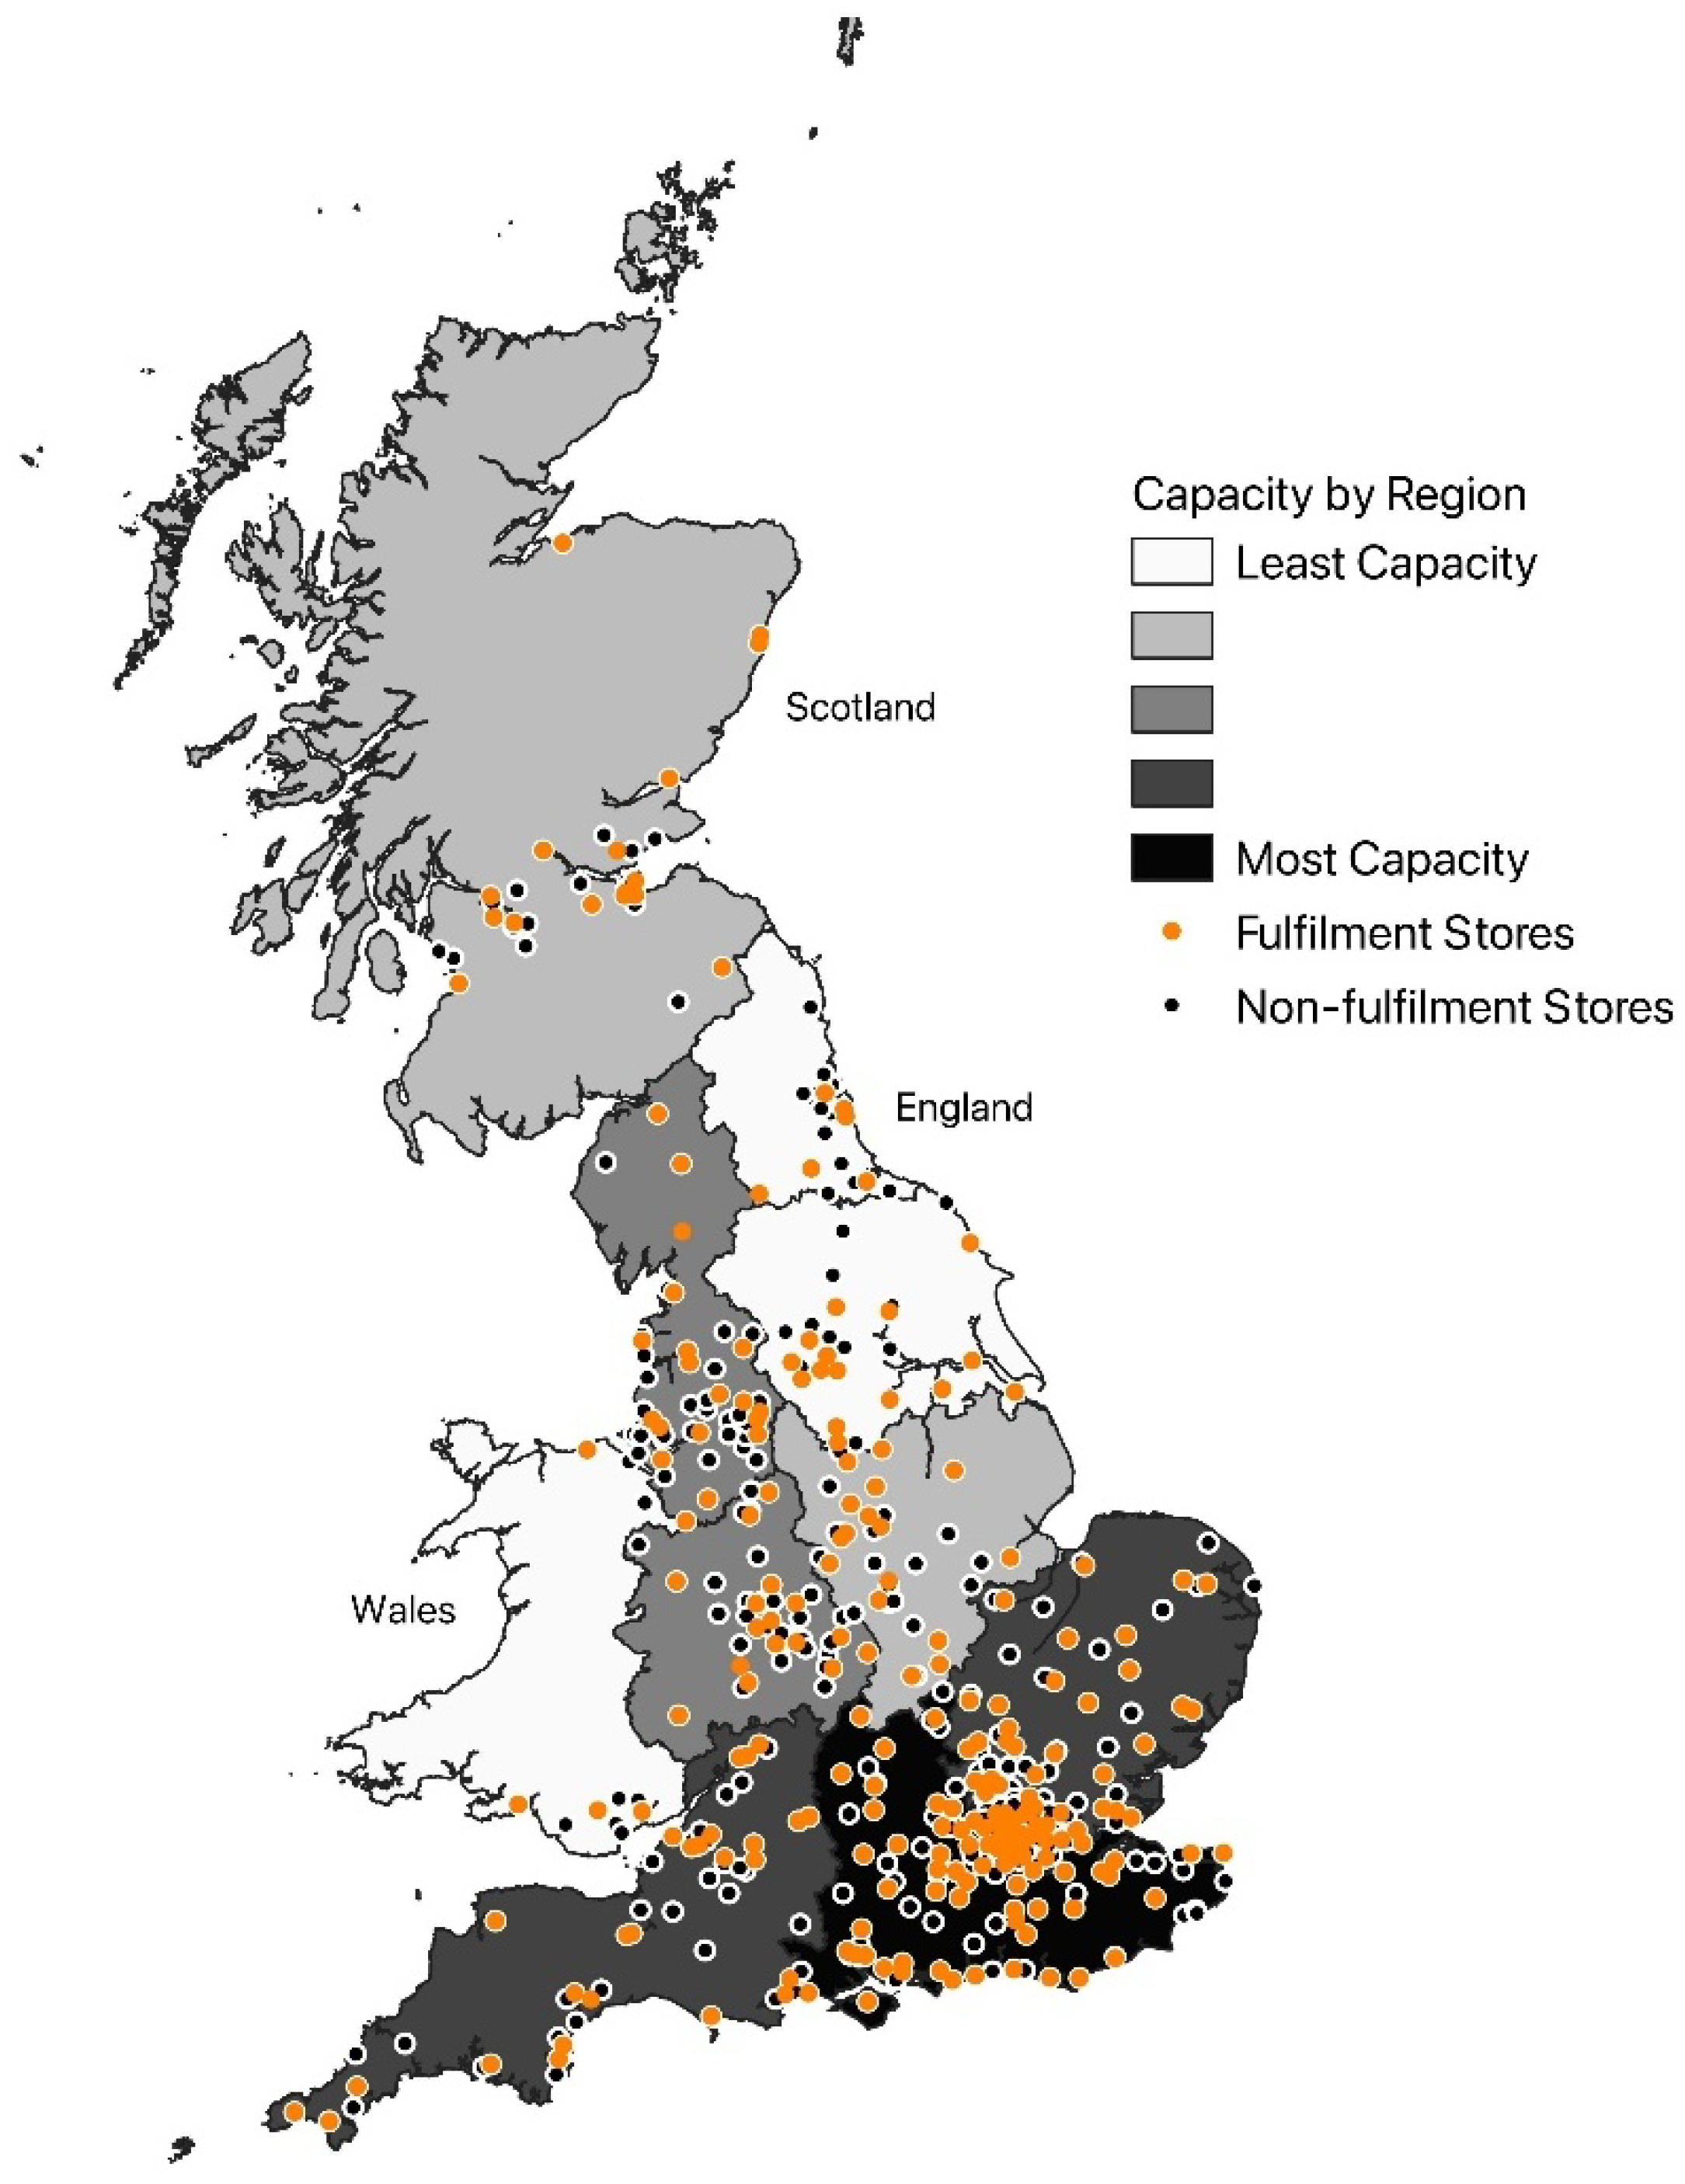
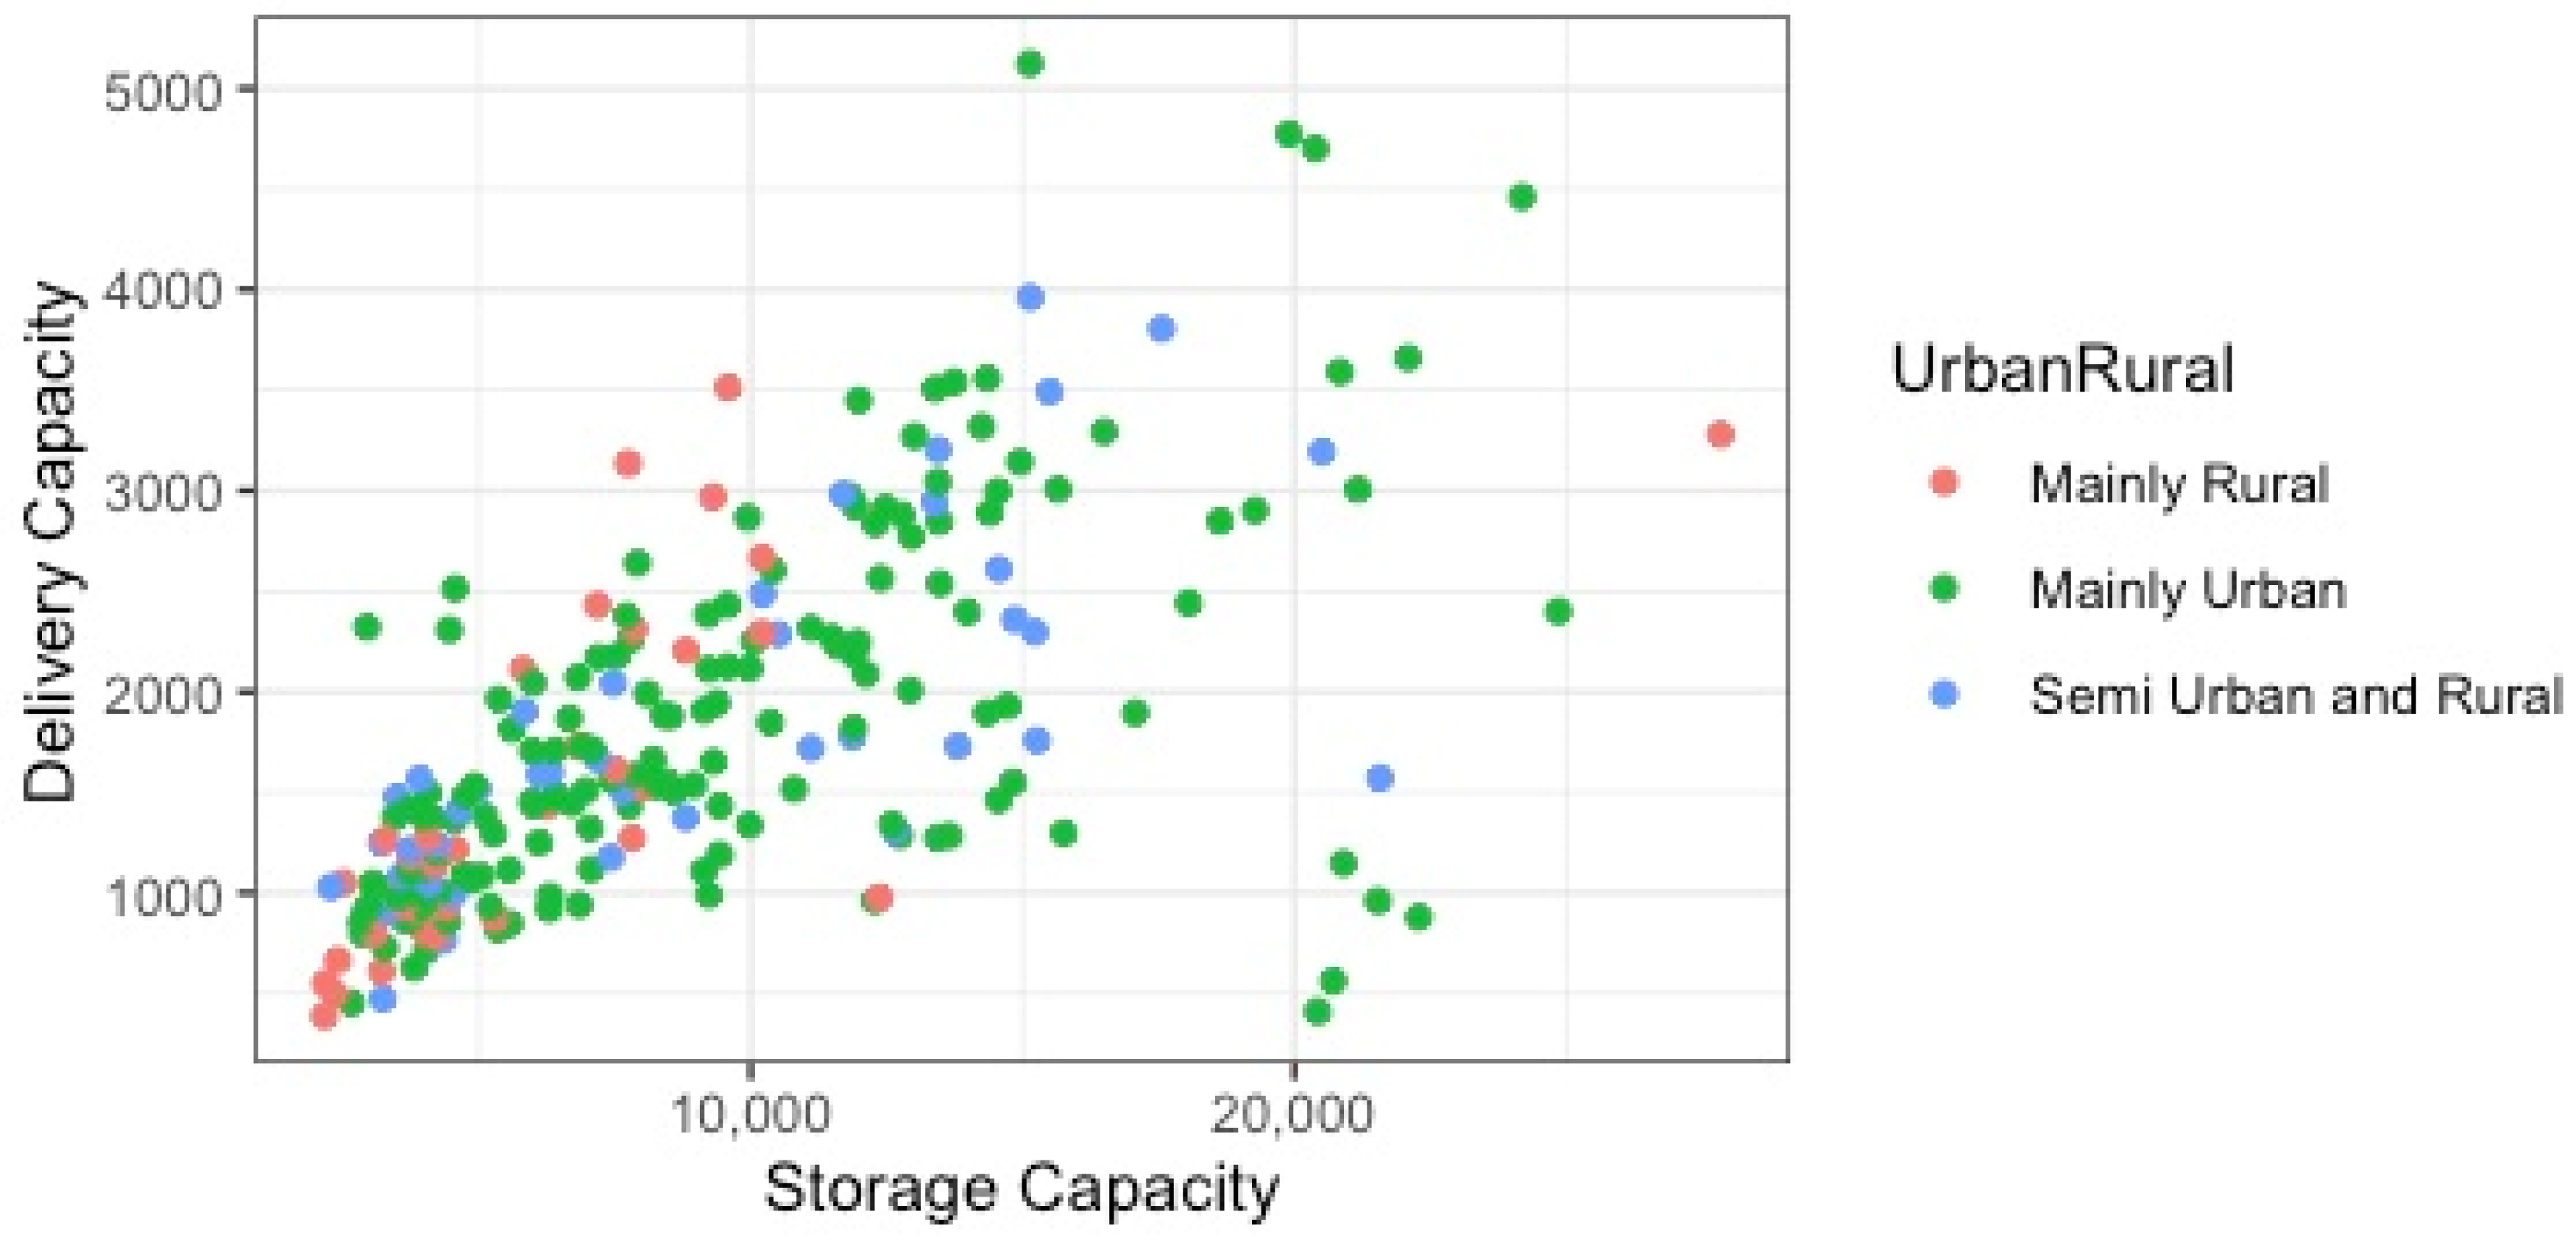
4.1. Geographical Distribution of Delivery Capacity

Table 2 and Figure 1 illustrate the distribution of fulfilment stores across GB alongside the reported delivery capacity for e-commerce order fulfilment, aggregated by region. There is a presence of fulfilment stores across GB, with a concentration of capacity in London and the South East. Collectively, the 85 fulfilment stores in London and the South East contribute 42% of the total e-commerce order-fulfilment capacity across GB. By contrast, the four fulfilment stores in Wales contribute negligibly towards the overall e-commerce capacity within the network, in spite of their important role in providing online groceries across Wales. The concentration of capacity within London and the South East reflects the historical investment in larger format stores by Sainsbury’s in this region, with a total of 170 large-format stores potentially available for order fulfilment across these regions. By contrast, Wales has just 11 large-format stores, which could potentially act as fulfilment sites, limiting the expansion of these services.
Figure 1 highlights the fact that, whilst fulfilment stores exist in all regions, these stores exhibit a predominantly urban distribution, with fulfilment stores concentrated around major urban centres and densely populated areas, including London, Birmingham, Manchester and Leeds. Large areas of northern Scotland, mid-Wales, North-East England and parts of South West England are geographically distant from fulfilment stores. These areas are characterised by dispersed rural populations and thus present the greatest challenges for order fulfilment, with online groceries coverage in these areas (where offered) requiring delivery vehicles to travel considerable distances from fulfilment stores to reach these consumers, adding to last-mile costs and reducing vehicle availability for other orders. Interestingly, these areas are also largely devoid of non-fulfilment stores (large-format stores not currently used for order fulfilment), and therefore there is limited scope to expand e-commerce operations in these areas by utilising the existing store network. The geographical distribution of non-fulfilment stores (potential candidate stores for the introduction of these services) exhibit a similar distribution to the existing fulfilment stores (Figure 1). Thus, the introduction of these services at additional stores could present a viable mechanism for increasing the capacity in areas that already benefit from a relatively higher capacity, but would not necessarily improve the geographical distribution of that capacity.
Table 3 breaks down the store-level delivery capacity by the rural–urban classification of each store’s locality [45,46], enabling an analysis of how store-level capacity varies by urban and rural geography. The majority of fulfilment stores (67%) are in urban areas. In these areas, high-density populations present the potential for very efficient last-mile logistics, enabling stores to deliver to a large number of online customers in close proximity to the fulfilment store, benefiting from shorter delivery distances and travel times than their rural counterparts. Fewer fulfilment stores (just 17%) are found in the semi-urban/rural areas. Those stores located in rural areas tend to exhibit a lower overall capacity, with the 37 rural fulfilment stores contributing just 13% of the total e-commerce fulfilment capacity within the network.
The most common capacity constraint reported at the store level relates to delivery, with 175 stores (74% of all fulfilment stores) flagged within Sainsbury’s in-house data as having this as the primary constraint to the expansion of e-commerce capacity. This is especially true for the largest stores, with these data suggesting that comparatively smaller large-format stores (with a floorspace between 15,069 and 30,000 square feet) are almost as equally likely to report non-delivery constraints (e.g., storage limitations) as their capacity-limiting factors. Figure 2 illustrates the relationship between storage capacity (a combination of ambient, chilled and frozen storage) and delivery capacity at a store level. The results suggests that the storage and delivery capacities generally increase linearly, with stores that exhibit a greater storage capacity also typically benefitting from a greater delivery capacity.
This relationship is shown in greater detail in Table 4, which presents the correlations between the storage and delivery capacities by store characteristics (location and size).
We found a strong overall association between the storage and delivery capacities, which is most pronounced for semi-urban and rural stores, where additional storage capacity can translate to a greater delivery capacity—and marginally weaker for urban stores (which are typically larger-format stores), where the increased storage space does not always translate to a greater delivery ability. This suggests that the issues related to delivery, such as the number of vehicles that can be hosted at urban stores, may be a limiting factor. This is the case for a number of stores that exhibit relatively high storage capacities, yet are constrained by a below-average delivery capacity. Moreover, we found a stronger association between the storage and delivery capacities for larger stores, although the association was statistically insignificant for smaller stores. These findings support the notion that the last-mile act of delivering orders to the consumer generates operational challenges that can restrict the capacity for e-commerce order fulfilment. The following sub-section considers this further, from a geographical perspective, analysing the distance associated with delivery based on the fulfilment store network.

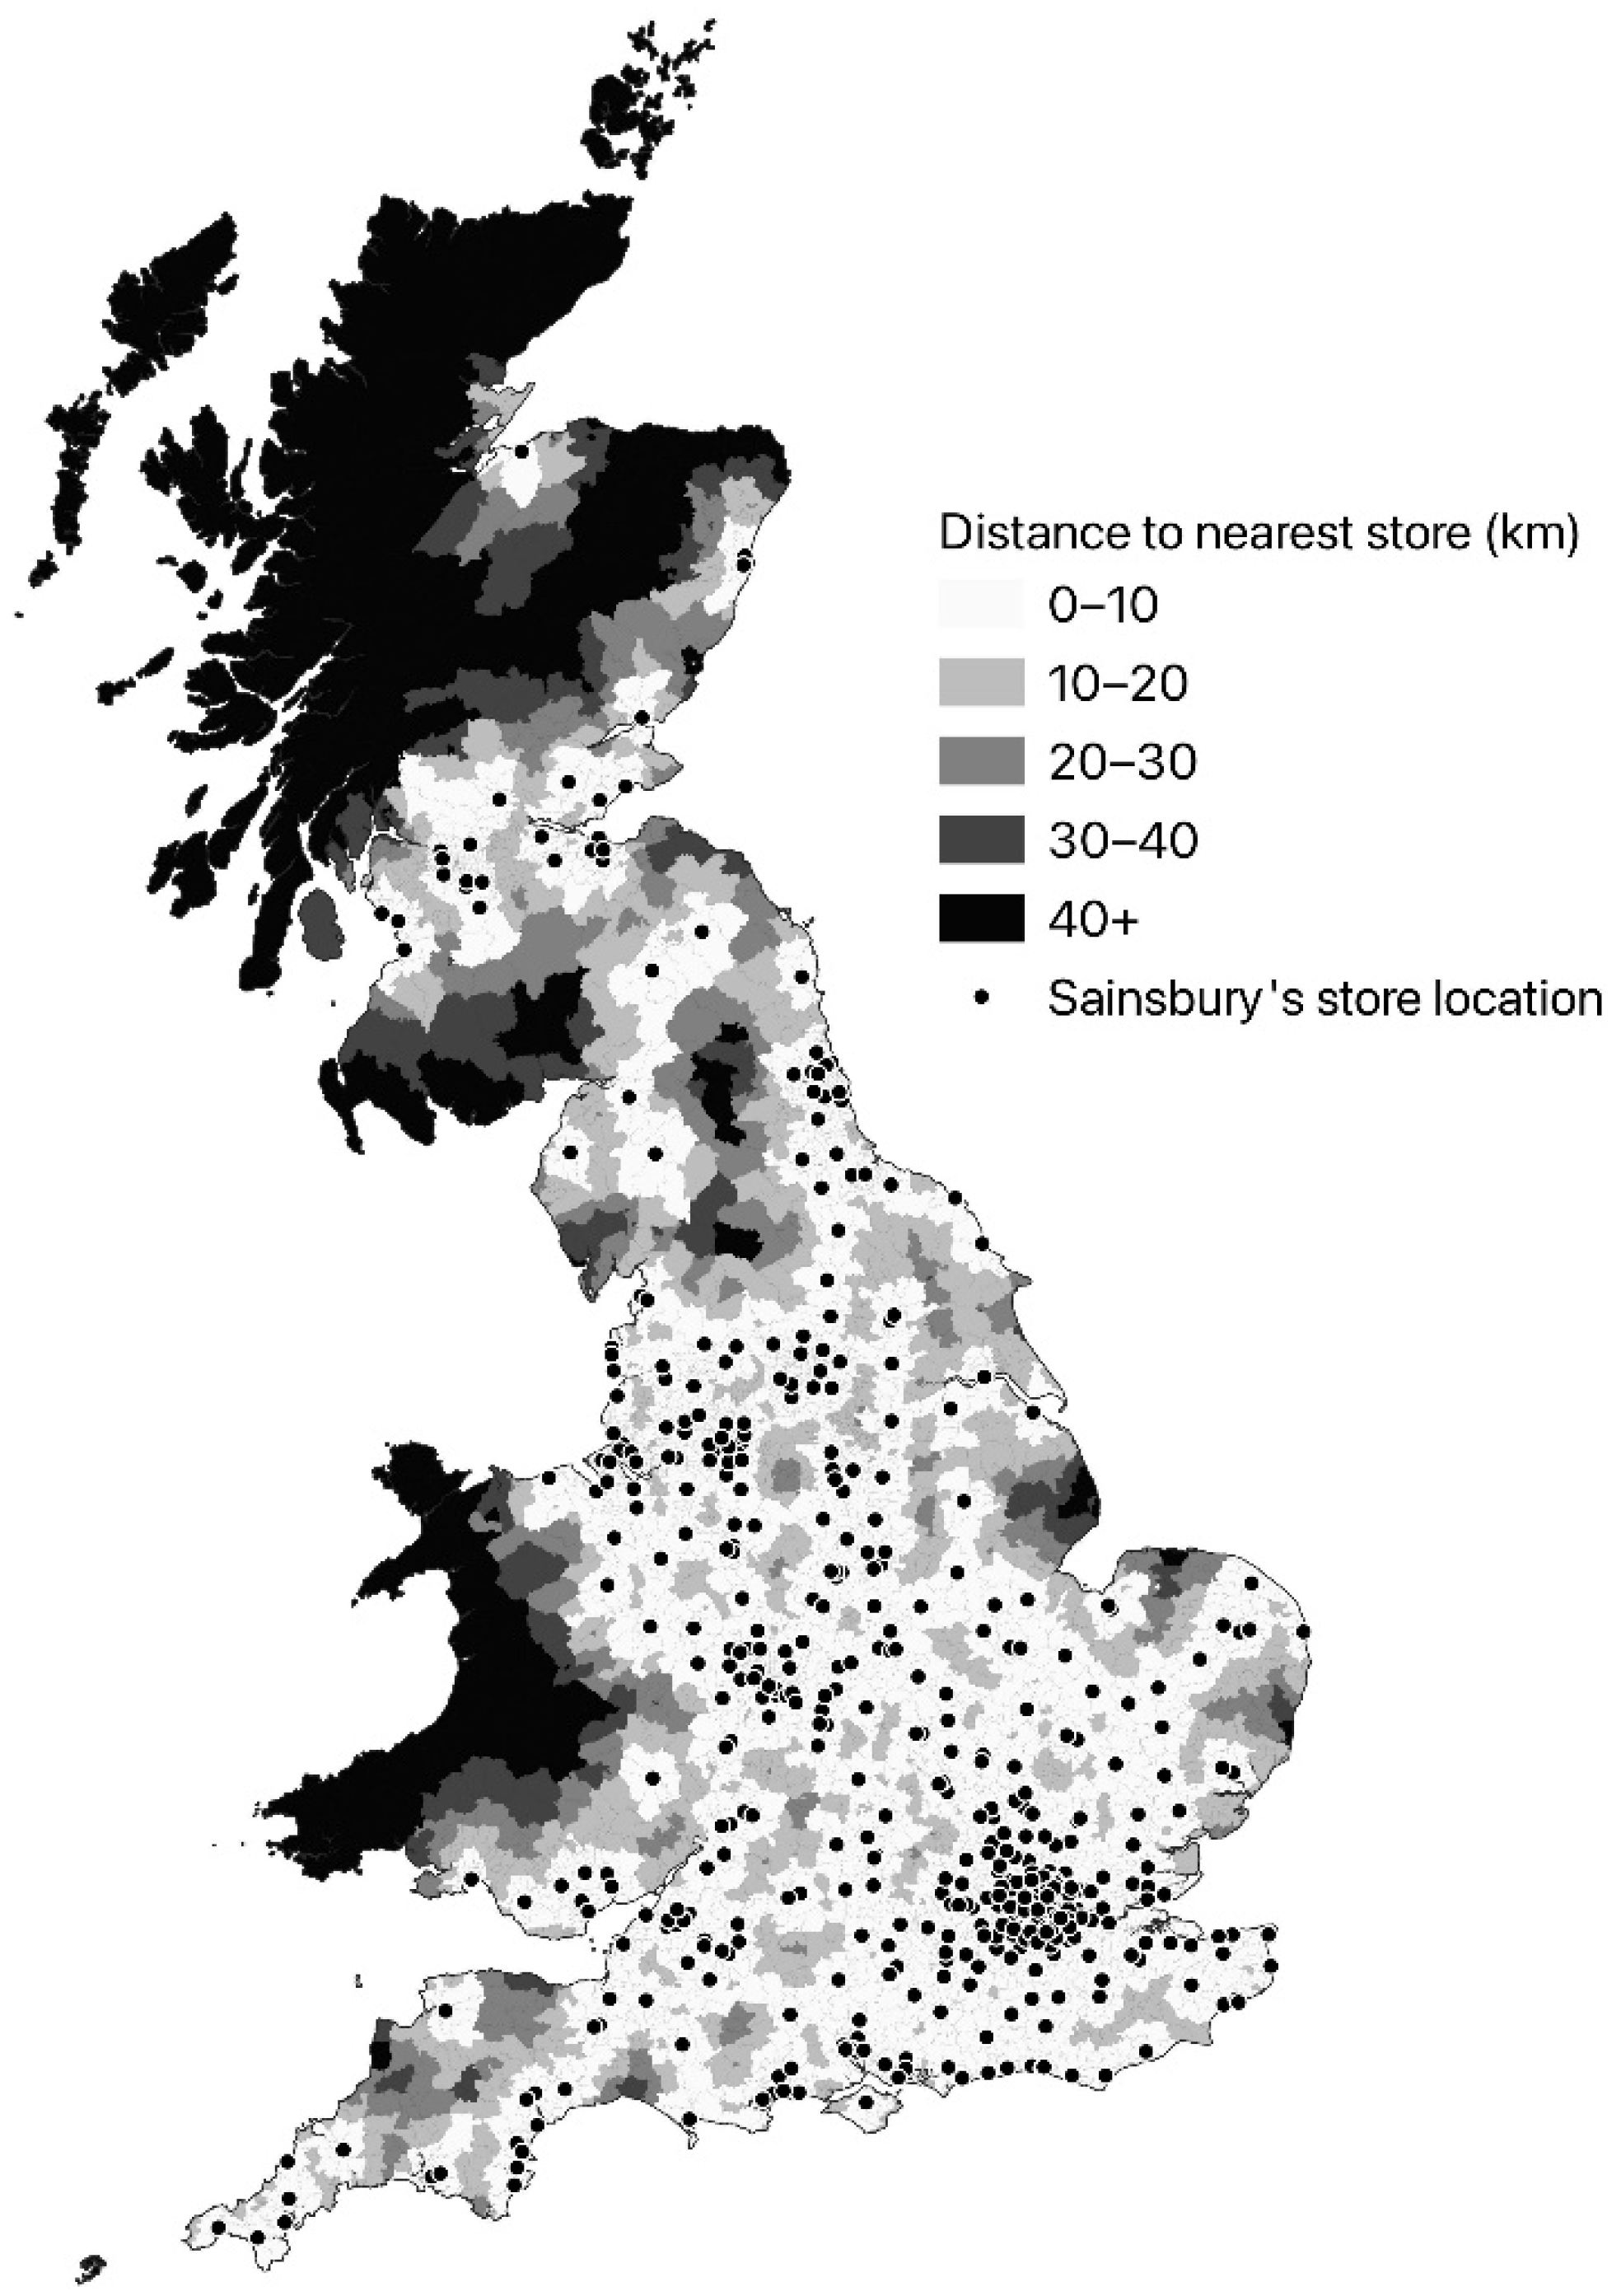
4.2. The Last Mile—Delivery to the Consumer

As noted above, 74% of fulfilment stores have a constraint—as specified by Sainsbury’s in-house data—associated with delivery restricting further capacity growth. The geographic factors associated with the last mile are one barrier, which we analyse here in relation to the fulfilment-store delivery service area (the geographic extent over which a given store delivers orders). Whilst we did not have access to commercially sensitive data on the specific territory over which each store provides delivery coverage (see the literature review for a discussion of the non-fixed nature of these territories), our analysis inferred the service area for each fulfilment store.
As summarised in Table 5, we assumed that each postal sector was served by its most proximate fulfilment store. Inferred store-level service areas derived through this approach varied considerably in size, with some urban stores (especially those in Greater London) delivering over a service area extending no more than a few kilometres from the store. By contrast, some stores in Wales and Scotland were inferred to deliver across a service area that extended to over 120 km in Wales and to almost 340 km in Scotland. We recognised that this was unrealistic—and indeed delivery coverage was not provided within those areas that were the most remote from fulfilment stores [7]—but important for assessing the future growth potential of these services, as is explored further, later on in the present paper. We also recognised that the current fulfilment network may not afford sufficient capacity to meet the demands within those service areas, but, without data on the order volumes or forecast demand, the current analysis is beyond the scope of this paper.
The median service area extent is just over 5 km in England, but considerably higher in both Scotland and Wales. Over 70% of postal sectors in England are within 10 km of their closest fulfilment store, extending to over 90% within a 20 km threshold. Whilst our aim was not to assess the coverage of the online groceries service, this does suggest that the current network of fulfilment stores could enable Sainsbury’s to provide coverage to a considerable proportion of English neighbourhoods without the need for excessively large store service areas, thus maximising the last-mile efficiency. This was not the case in parts of Wales and Scotland, with less than 25% of Welsh neighbourhoods falling within a 10 km threshold of their nearest fulfilment store. Whilst we found some evidence that those stores with the largest service areas had a lower delivery capacity than those with smaller service areas (Table 6), there was no evidence that those stores were more likely to have delivery as their major constraint, when compared to the stores with a more compact service area, as summarised in Table 6.
Subsequently, we considered the theoretical last-mile efficiency gains that could be realised if additional stores from the Sainsbury’s network were used for online groceries fulfilment. We illustrated the hypothetical impact of using all existing large-format stores (over 15,069 square feet) as fulfilment stores. Given the high density of these stores in some localities (see Figure 1), these stores could offer the potential to considerably increase the capacity in some regions. Assuming that these potential fulfilment stores offered the mean e-commerce store-level capacity for their region, capacity in London and the South East would more than double. Considerable capacity could also be added in the West Midlands and the North West. Table 5 finds that the utilisation of additional fulfilment stores could notably increase the proportion of neighbourhoods within 10 km of their nearest fulfilment store, which could offer considerable benefits to the retailer in the form of shorter drive distances, which enable more efficient and environmentally friendly last-mile logistics. The utilisation of all potential fulfilment stores places almost 50% of Scottish and Welsh postal sectors within 10 km of their nearest fulfilment store, and over 80% for England.
Whilst the investment in the infrastructure of e-groceries for these stores would be costly in the short term (and indeed there may be store-level constraints—such as storage capacity—that prevent this), the utilisation of additional fulfilment stores could add considerable capacity to e-groceries and reduce the costs associated with the last mile. The last-mile savings would be realised by the shorter drive distances and times between the store and delivery addresses, enabling a greater order volume or providing consumers with more choices for their delivery-slot times. It may also enable retailers to condense deliveries to fewer vehicles, each serving a more compact area, with environmental benefits. Nevertheless, Figure 3 highlights that, even in a scenario whereby all large-format stores are used for online order fulfilment, there remain many areas of Wales and Scotland that are remote from fulfilment stores. This either limits the availability of online groceries in these areas or creates inefficiencies on the supply side, including excessively long (and costly) journey times for delivery vehicles, reduced order capacity as a result of delivery vehicles undertaking inefficient journeys, and limited delivery-slot availability for the consumer.
Figure 3 highlights the fact that a single fulfilment store in northeast Scotland theoretically provides delivery coverage across the entire Highlands and Islands region. Much of this region is currently unserved by Sainsbury’s online groceries [7], and no alternative fulfilment stores exist within this region (as shown in Figure 3). This holds true for a number of postal sectors in rural-mid Wales and a more limited number of remote neighbourhoods in England. Thus, in order to provide effective national coverage in an efficient and sustainable manner, retailers, such as Sainsbury’s, may have to consider alternative delivery models for those localities that are the most remote from the existing store network.

5. Conclusions

Store-based order fulfilment enables retailers, such as Sainsbury’s, to develop localised an online groceries fulfilment capacity in order to meet consumer demands. This is the modal operating model in GB for retailers with a physical store network, providing a relatively low cost and low-risk opportunity for expansion, requiring less investment than dedicated online fulfilment centres [8]. Store-based fulfilment requires the careful management of capacity at a local level, ensuring that the fulfilment network can handle the anticipated demand (volume and size of orders), with the overall capacity driven by in-store (principally storage space) and delivery constraints (the number of orders that can be handled at the last-mile stage of fulfilment). At the time of analysis, Sainsbury’s operated 234 store-based fulfilment sites in GB. Whilst these do offer a near-national coverage, we highlighted that online fulfilment capacity is concentrated to London and the South East, and clustered around major urban centres. Whilst this likely reflects the distribution of demand (which is itself concentrated to major urban centres), it is also driven by a legacy of investment in large-format out-of-town supermarkets—which, for Sainsbury’s, was concentrated to the South East [48]—with these store formats typically offering sufficient in-store space for e-groceries operations.
Retailers, including Sainsbury’s, demonstrated that they can quickly realise additional capacity (e.g., during the COVID-19 pandemic) through increased supply-side capacity, enabled via ‘quick wins’, hiring additional pickers and delivery drivers, and increasing the number of delivery vehicles available [10,11]. For Sainsbury’s, this resulted in the capacity increasing from a potential 350,000 orders per week in 2019 to around 850,000 orders per week in 2021 [14]. A discussion with our industry partners suggests that many in-store capacity constraints (especially storage) were addressed as part of the move to increase capacity during the pandemic. Further capacity gains at existing fulfilment stores will likely be achieved by addressing the constraints associated with delivery, which this paper has found to be the principal constraint for three quarters of fulfilment stores.
Despite this, investment, staff hours and delivery vehicle availability are finite, meaning that delivery distance is a fundamental consideration for service efficiency, highlighting the importance of the ‘last mile’ [4,5]. The designation of stores as fulfilment centres and the design and delineation of their service areas have a key impact on capacity across the network and determines whether demands can be met at a local level. With forecasts indicating continued growth in the groceries e-commerce market [3], we argue that there is a growing need for capacity planning in this sector, especially in relation to delivery efficiency and the last mile. We highlight that the introduction of additional fulfilment stores could reduce the areal extent over which many fulfilment stores make deliveries, bringing the order fulfilment closer to the final delivery address, subject to sufficient store-level capacity for order picking, packing and storage.
However, this approach is limited by the distribution of existing stores that could function as online fulfilment centres. That store network is the result of legacy investments, many made at a time when groceries e-commerce was non-existent or within its infancy. They were optimised for in-store shopping and may lack the space, configuration or operational needs for online groceries fulfilment, especially in terms of their spatial distribution relative to the underlying demand. As our analysis highlights, even with hypothetical investment to offer online groceries fulfilment at all large-format stores, there would remain large geographical extents—especially across rural Wales and Scotland—which would require prohibitively large online delivery service areas in order to offer effective coverage.
Whilst the constraints associated with delivery could be addressed by a greater usage of collection points (shifting many last-mile costs back to the consumer), these services still require in-store order fulfilment capacity for picking, packing and storage. Nevertheless, unless non-store-based collection points are utilised, the geographical extent and spatial distribution of capacity for click-and-collect services is driven by capacity within the fulfilment store network. In keeping with many grocers, Sainsbury’s have trialled the use of third-party delivery providers, including Deliveroo and Uber Eats, to offer near-instant delivery of smaller orders, picked from the shelves of convenience stores. Whilst these may boost customer satisfaction and add marginal additional capacity—these services are focused on major urban areas and typically utilise small-format stores, which have very limited order picking, packing and storage capacity, often coming at substantial costs per item to the consumer.
We therefore argue that effective online capacity management and online capacity growth for retailers, such as Sainsbury’s, require ongoing investment in optimising the fulfilment store network, especially in relation to store service area delineation, to maximise the efficiency of the last mile. Whilst this may include day-to-day operational decisions (e.g., should postal sector A be served by store X?), this must also consider wider strategic decision making that links in-store capacity to service area delineation (e.g., based on its capacity, what is the optimum service area for store Y?) and the future development of the fulfilment network (does store Z need to be redeveloped to offer online fulfilment in 5 years’ time). We hope this paper serves to highlight these issues and sparks a range of collaborations between academia and industry within this domain. This is the first paper that presents an ambitious plan of research in this area, which hopes to address the questions raised above.

Author Contributions

Conceptualisation, A.N., N.H. and A.H.; methodology, R.U., A.N., N.H. and A.H.; formal analysis, R.U.; resources, A.N., N.H. and A.H.; writing—original draft preparation, R.U., A.N. and N.H.; writing—review and editing, A.N., N.H. and A.H.; funding acquisition, A.N., N.H. and A.H. All authors have read and agreed to the published version of the manuscript.

Funding

This research was funded by the Economic and Social Research Council (ESRC), grant numbers ES/P000401/1 and ES/S007164/1. The APC was funded by the University of Leeds Open Access Fund. A.H. was supported by grants from UKPRP (MR/S037578/2), the Medical Research Council (MC\_UU\_00022/5) and Scottish Government Chief Scientist Office (SPHSU20).

Institutional Review Board Statement

Not applicable.

Informed Consent Statement

Not applicable.

Data Availability Statement

The data used in this publication are commercial data as supplied by our external partner. They are not available for wider reuse.

Acknowledgments

The authors are grateful for the support from the ESRC funded Centre for Doctoral Training in New Forms of Data (Data Analytics and Society) at the University of Leeds.

Conflicts of Interest

The authors declare no conflict of interest.

References

  1. IGD. Uk Food and Grocery Market to Grow 10% by 2022. Available online: https://www.igd.com/articles/article-viewer/t/uk-food-and-grocery-market-to-grow-10-by-2022/i/26531 (accessed on 19 January 2022).
  2. Hood, N.; Urquhart, R.; Newing, A.; Heppenstall, A. Sociodemographic and spatial disaggregation of e-commerce channel use in the grocery market in great britain. J. Retail. Consum. Serv. 2020, 55, 102076. [Google Scholar] [CrossRef]
  3. IGD. Uk Retail Food and Grocery Market Growth to Slow Sharply in the Short Term, According to Latest Igd Market Forecasts. Available online: https://www.igd.com/articles/article-viewer/t/uk-retail-food-and-grocery-market-growth-to-slow-sharply-in-the-short-term-according-to-latest-igd-market-forecasts/i/28369 (accessed on 19 January 2022).
  4. Verhoef, P.C.; Kannan, P.K.; Inman, J.J. From multi-channel retailing to omni-channel retailing. J. Retail. 2015, 91, 174–181. [Google Scholar] [CrossRef]
  5. Hübner, A.; Kuhn, H.; Wollenburg, J. Last mile fulfilment and distribution in omni-channel grocery retailing. Int. J. Retail. Distrib. Manag. 2016, 44, 228–247. [Google Scholar] [CrossRef]
  6. Wollenburg, J.; Hübner, A.; Kuhn, H.; Trautrims, A. From bricks-and-mortar to bricks-and-clicks: Logistics networks in omni-channel grocery retailing. Int. J. Phys. Distrib. Logist. Manag. 2018, 48, 415–438. [Google Scholar] [CrossRef]
  7. Newing, A.; Hood, N.; Videira, F.; Lewis, J. Sorry we do not deliver to your area’: Geographical inequalities in online groceries provision. Int. Rev. Retail. Distrib. Consum. Res. 2021, 32, 80–99. [Google Scholar] [CrossRef]
  8. Masters, B. Stores still matter when it comes to online groceries. Financial Times, 10 March 2021. Available online: https://www.ft.com/content/ce6aa47e-9096-4952-933b-08385609a581(accessed on 10 March 2021).
  9. Sleeman, J. Impact of the Pandemic on the Demand for Logistics and Distribution Capacity. Presentation Delivered at the Society for Location Analysis Event ‘Logistics and the Future of Retail Real Estate’, 10 February 2022; Jones Lang LaSalle: London, UK, 2022. [Google Scholar]
  10. Eley, J.; McMorrow, R. Why supermarkets are struggling to profit from the online grocery boom. Financial Times, 23 July 2020. Available online: https://www.ft.com/content/b985249c-1ca1-41a8-96b5-0adcc889d57d(accessed on 23 July 2020).
  11. Sainsbury’s. Sainsbury’s Dials up Digital, Doubling Capacity and Extending Delivery Times. Available online: https://www.about.sainsburys.co.uk/news/latest-news/2020/28-09-20-sainsburys-dials-up-digital (accessed on 19 January 2022).
  12. Butler, S. Uk Online Grocery Sales Likely to Surge by a Quarter Amid Lockdown. Available online: https://www.theguardian.com/business/2020/may/05/uk-online-grocery-sales-lockdown-internet-coronavirus (accessed on 19 January 2022).
  13. Smithers, R. Pandemic Prompts Doubling of Online Grocery Shoppers in UK. Available online: https://www.theguardian.com/business/2020/aug/20/pandemic-prompts-doubling-of-online-grocery-shoppers-in-uk (accessed on 19 January 2022).
  14. Pilbeam, D. Understanding Post-Pandemic Food Retail Location Dynamics. Presentation Given at Spatial Data Secience in Cpg & Retail Summit, 21 May 2021. Available online: https://www.youtube.com/watch?v=ivaJY_819lg&ab_channel=CARTO (accessed on 19 January 2022).
  15. Birkin, M.; Clarke, G.P.; Clarke, M. Retail Location Planning in an era of Multi-Channel Growth; Routledge: London, UK, 2017. [Google Scholar]
  16. Newing, A.; Clarke, G.P.; Clarke, M. Visitor expenditure estimation for grocery store location planning: A case study of cornwall. Int. Rev. Retail. Distrib. Consum. Res. 2013, 23, 221–244. [Google Scholar] [CrossRef]
  17. Berry, T.; Newing, A.; Davies, D.; Branch, K. Using workplace population statistics to understand retail store performance. Int. Rev. Retail. Distrib. Consum. Res. 2016, 26, 375–395. [Google Scholar] [CrossRef] [Green Version]
  18. Waddington, T.; Clarke, G.P.; Clarke, M.C.; Newing, A. Exploring spatiotemporal fluctuations in uk grocery store sales. Int. Rev. Retail. Distrib. Consum. Res. 2017, 28, 1–26. [Google Scholar]
  19. Sturley, C.; Newing, A.; Heppenstall, A. Evaluating the potential of agent based modelling to capture consumer store choice behaviours. Int. Rev. Retail. Distrib. Consum. Res. 2017, 28, 27–46. [Google Scholar] [CrossRef]
  20. Beckers, J.; Birkin, M.; Clarke, G.; Hood, N.; Newing, A.; Urquhart, R. Incorporating e-commerce into retail location models. Geogr. Anal. 2021, 54, 274–293. [Google Scholar] [CrossRef]
  21. Teller, C.; Kotzab, H.; Grant, D.B. The consumer direct services revolution in grocery retailing: An exploratory investigation. Manag. Serv. Qual. Int. J. 2006, 16, 78–96. [Google Scholar] [CrossRef] [Green Version]
  22. Grant, D.B.; Fernie, J.; Schulz, B. Enablers and barriers in german online food retailing. Supply Chain. Forum Int. J. 2014, 15, 4–11. [Google Scholar] [CrossRef]
  23. Clarke, G.; Thompson, C.; Birkin, M. The emerging geography of e-commerce in british retailing. Reg. Stud. Reg. Sci. 2015, 2, 371–391. [Google Scholar] [CrossRef]
  24. Singleton, A.; Alexiou, A.; Savani, R. Mapping the geodemographics of digital inequality in great britain: An integration of machine learning into small area estimation. Comput. Environ. Urban Syst. 2020, 82, 101486. [Google Scholar] [CrossRef]
  25. Anderson, W.P.; Chatterjee, L.; Lakshmanan, T. E-commerce, transportation, and economic geography. Growth Chang. 2003, 34, 415–432. [Google Scholar] [CrossRef]
  26. Kirby-Hawkins, E.; Birkin, M.; Clarke, G. An investigation into the geography of corporate e-commerce sales in the uk grocery market. Environ. Plan. B Urban Anal. City Sci. 2018, 46, 1148–1164. [Google Scholar] [CrossRef] [Green Version]
  27. Azadiamin, S.; Masel, D. Last mile delivery route planning for grocery stores. In Proceedings of the 2021 IISE Annual Conference, Washington, DC, USA, 25 May 2021; Ghate, A., Krishnaiyer, K., Paynabar, K., Eds.; 2021; pp. 1106–1111. [Google Scholar]
  28. Siddhartha, P.; Goda, D. Simulation and optimization framework for on-demand grocery delivery. In 2021 Winter Simulation Conference (WSC); 2021; pp. 1–12. [Google Scholar]
  29. Liu, D.; Deng, Z.; Zhang, W.; Wang, Y.; Kaisar, E.I. Design of sustainable urban electronic grocery distribution network. Alex. Eng. J. 2021, 60, 145–157. [Google Scholar] [CrossRef]
  30. Leyerer, M.; Sonneberg, M.-O.; Heumann, M.; Breitner, M.H. Shortening the last mile in urban areas: Optimizing a smart logistics concept for e-grocery operations. Smart Cities 2020, 3, 585–603. [Google Scholar] [CrossRef]
  31. Maltese, I.; Le Pira, M.; Marcucci, E.; Gatta, V.; Evangelinos, C. Grocery or @grocery: A stated preference investigation in rome and milan. Res. Transp. Econ. 2021, 87, 101096. [Google Scholar] [CrossRef]
  32. Cardenas, I.; Borbon-Galvez, Y.; Verlinden, T.; Van de Voorde, E.; Vanelslander, T.; Dewulf, W. City logistics, urban goods distribution and last mile delivery and collection. Compet. Regul. Netw. Ind. 2017, 18, 22–43. [Google Scholar] [CrossRef]
  33. Aspray, W.; Royer, G.; Ocepek, M.G. Anatomy of a dot-com failure: The case of online grocer webvan. In Food in the Internet Age; Aspray, W., Royer, G., Ocepek, M.G., Eds.; Springer: Boston, MA, USA, 2013; pp. 25–35. [Google Scholar]
  34. Clark, T.; Ping Chang, S. A History of Tesco: The Rise of Britain’s Biggest Supermarket. Available online: https://www.telegraph.co.uk/finance/markets/2788089/A-history-of-Tesco-The-rise-of-Britains-biggest-supermarket.html (accessed on 19 January 2022).
  35. Cope, N. Asda Joins the Battle for Home Shoppers. Available online: https://www.independent.co.uk/news/business/asda-joins-the-battle-for-home-shoppers-1167607.html (accessed on 19 January 2022).
  36. Belavina, E.; Girotra, K.; Kabra, A. Online grocery retail: Revenue models and environmental impact. Manag. Sci. 2017, 63, 1781–1799. [Google Scholar] [CrossRef] [Green Version]
  37. Siragusa, C.; Tumino, A. E-grocery: Comparing the environmental impacts of the online and offline purchasing processes. Int. J. Logist. Res. Appl. 2021, 1–27. [Google Scholar] [CrossRef]
  38. Brown, J.R.; Guiffrida, A.L. Carbon emissions comparison of last mile delivery versus customer pickup. Int. J. Logist. Res. Appl. 2014, 17, 503–521. [Google Scholar] [CrossRef]
  39. Buldeo Rai, H.; Verlinde, S.; Macharis, C. The “next day, free delivery” myth unravelled: Possibilities for sustainable last mile transport in an omnichannel environment. Int. J. Retail. Distrib. Manag. 2019, 47, 39–54. [Google Scholar] [CrossRef]
  40. Beck, N.; Rygl, D. Categorization of multiple channel retailing in multi-, cross-, and omni-channel retailing for retailers and retailing. J. Retail. Consum. Serv. 2015, 27, 170–178. [Google Scholar] [CrossRef]
  41. Davies, A.; Dolega, L.; Arribas-Bel, D. Buy online collect in-store: Exploring grocery click & collect using a national case study. Int. J. Retail. Distrib. Manag. 2019, 47, 278–291. [Google Scholar]
  42. DPD. 6000 New UK Jobs as Dpd Scales-Up to Meet ‘New Normal’ Demand from Online Retailers. Available online: https://www.dpd.co.uk/content/about_dpd/6000-new-uk-jobs-as-dpd-scales-up-to-meet-new-normal-demand-from-online-retailers.jsp (accessed on 19 January 2022).
  43. Espiner, T. Royal Mail to Pilot Sunday Parcel Delivery, BBC News. Available online: https://www.bbc.co.uk/news/business-56362491 (accessed on 19 January 2022).
  44. Cao, Y.; Strauss, A.; Pratt, M. Estimate Impact of Slot Availability on Customer Demand by using Choice-Based Demand Models. Masters Research Dissertation Programme Case Studies 2017; Consumer Data Research Centre: London, UK, 2017. [Google Scholar]
  45. ONS. 2011 Local Authority Rural Urban Classification. Available online: https://www.ons.gov.uk/methodology/geography/geographicalproducts/ruralurbanclassifications (accessed on 19 July 2021).
  46. Scottish Government. Scottish Government Urban Rural Classification 2016. Available online: https://www.gov.scot/publications/scottish-government-urban-rural-classification-2016/pages/2/#:~:text=2.-,Overview,and%20rural%20areas%20across%20Scotland.&text=This%20is%20done%20by%20calculating,Large%20and%20Other%20Urban%20Areas) (accessed on 16 July 2019).
  47. MRS. Postcode Format; Market Research Society London Undated. Available online: https://www.mrs.org.uk/pdf/postcodeformat.pdf (accessed on 10 March 2021).
  48. Poole, R.; Clarke, G.; Clarke, D. The battle for safeway. Int. J. Retail. Distrib. Manag. 2003, 31, 280–289. [Google Scholar] [CrossRef]
Figure 1. Sainsbury’s online groceries delivery capacity by region (2019), with fulfilment stores shown alongside large-format Sainsbury’s stores not currently utilised for order fulfilment.
Jtaer 17 00033 g001
Figure 2. Capacity constraints associated with storage (combining ambient and chilled) and delivery at the store level, by area type.
Jtaer 17 00033 g002
Figure 3. Distance between each postal sector and its nearest fulfilment store under a hypothetical scenario whereby all large-format stores offer online fulfilment.
Jtaer 17 00033 g003
Table 1. Example capacity data provided by Sainsbury’s, related to their store network in 2019. ‘Store-based Capacity’ is reported as a relative value ranging from 388 to 3500, capturing store-level e-commerce storage and fulfilment capability. Delivery capacity is also a relative value (range 388–5124), capturing capacity associated with the last mile, and is not directly translatable into a count of orders that can be fulfilled.
Store NameGeographic
Coordinates
Store-Based
Capacity
Delivery
Capacity
Capacity
Constraints
Example store 1Latitude and longitude
(e.g., 53.80433, 1.550997796)
21001820Delivery
Example store 29021047Chilled
Example store 311264456Ambient
Example store 4989989MLFs
Table 2. Online delivery capacity, fulfilment stores and potential for store-based fulfilment by region.
Region/NationFulfilment Stores (Count)Total Delivery Capacity (Relative Value)Non-Fulfilment Stores 1
South East52100,78839
Greater London3376,67646
East of England3052,62727
South West2749,31125
West Midlands1731,48928
North West1823,54729
Scotland1623,05614
East Midlands1622,90717
Yorkshire and the Humber1522,54312
North East6903912
Wales466857
1 Large-format stores that could potentially act as future fulfilment stores.
Table 3. Delivery capacity by urban–rural classification of stores.
Area Classification 1Store CountMean Delivery
Capacity by Store
Sum of Delivery Capacity
Predominantly rural37146554,145
Urban with significant rural 40185874,324
Predominantly urban1571848290,199
1 Classification taken directly from the 2011 rural–urban classification of Local Authority Districts [45,46] capturing the general degree of urbanity or rurality in the Local Authority District (local governmental administrative area) that each store falls within.
Table 4. Correlations between storage and delivery capacities by store characteristic.
Store CharacteristicCorrelationSignificancen
LocationMainly urban0.5850.000157
Semi urban and rural0.7300.00040
Mainly rural0.7020.00037
SizeSize A0.6500.000218
Size B0.2950.26716
All stores0.6350.000234
Table 5. Summary of the distances to the nearest fulfilment store on a store-by-store basis.
EnglandScotlandWales
% of Postal Sectors within Distance (km)Current Fulfilment StoresPotential Fulfilment StoresCurrent Fulfilment StoresPotential Fulfilment StoresCurrent Fulfilment StoresPotential Fulfilment Stores
0–1072.287.037.449.124.746.1
10–2019.69.621.316.022.316.7
20–305.22.310.36.918.46.4
30–401.80.77.16.67.14.5
40+1.20.423.921.427.526.3
Median service area extent5.32.715.610.321.312.3
Maximum service area extent94.394.3339.4339.4128.2128.2
Table 6. Delivery capacity and limiting factors by inferred service area extent.
Service Area
Extent
Count of StoresMean Delivery Capacity% of Stores with
Delivery Capacity as a Limiting Factor
Less than 10 km45191471%
10–20 km79186281%
20–30 km51160769%
30–40 km22195073%
Over 40 km37163470%
Publisher’s Note: MDPI stays neutral with regard to jurisdictional claims in published maps and institutional affiliations.

