
A Two-Stage SEM–Artificial Neural Network Analysis of Mobile Commerce and Its Drivers


Abstract
1. Introduction
2. Theoretical Background
3. Materials and Methods
3.1. Sample Selection and Variables
3.2. Hypothesis and Methods
4. Results
5. Discussion
6. Conclusions, Limitations, and Further Research
Author Contributions
Funding
Institutional Review Board Statement
Informed Consent Statement
Data Availability Statement
Conflicts of Interest
References
- eMarketer (Ed.) Worldwide Ecommerce will Approach $5 Trillion This Year. Available online: https://www.emarketer.com/content/worldwide-ecommerce-will-approach-5-trillion-this-year?ecid=NL1014 (accessed on 10 May 2021).
- Wurmser, Y. Mobile Shopping Gains Are Likely to Stick in the Future. Available online: https://www.emarketer.com/content/mobile-shopping-gains-likely-stick-future (accessed on 7 April 2021).
- De Best, R. Mobile Payments Worldwide-Statistics & Facts. Available online: https://www.statista.com/topics/4872/mobile-payments-worldwide/ (accessed on 16 March 2021).
- Holmes, A.; Byrne, A.; Rowley, J. Mobile shopping behaviour: Insights into attitudes, shopping process involvement and location. Int. J. Retail. Distrib. Manag. 2014, 42, 25–39. [Google Scholar] [CrossRef]
- Kuo, T.; Tsai, G.Y.; Lu, I.Y.; Chang, J.S. Relationships among service quality, customer satisfaction and customer loyalty: A case study on mobile shopping APPs. In Proceedings of the 17th Asia Pacific Industrial Engineering and Management System Conference, Taipei, Taiwan, 7–10 December 2016; pp. 7–10. [Google Scholar]
- Marinkovic, V.; Kalinic, Z. Antecedents of customer satisfaction in mobile commerce. Online Inf. Rev. 2017, 41, 138–154. [Google Scholar] [CrossRef]
- Chung, K.C. Transaction Utility Perspective of Customer Satisfaction towards M-Commerce in Taiwan. In Proceedings of the 2019 5th International Conference on E-business and Mobile Commerce-ICEMC 2019, Taichung, Taiwan, 22–24 May 2019; Association for Computing Machinery (ACM): New York, NY, USA, 2019; pp. 1–5. [Google Scholar] [CrossRef]
- Kalinic, Z.; Marinkovic, V.; Djordjevic, A.; Liebana-Cabanillas, F. What drives customer satisfaction and word of mouth in mobile commerce services? A UTAUT2-based analytical approach. J. Enterp. Inf. Manag. 2020, 33, 71–94. [Google Scholar] [CrossRef]
- Thakur, R. The moderating role of customer engagement experiences in customer satisfaction-loyalty relationship. Eur. J. Mark. 2019, 53, 1278–1310. [Google Scholar] [CrossRef]
- Marinao-Artigas, E.; Barajas-Portas, K. Precedents of the satisfaction of mobile shoppers. A cross-country analysis. Electron. Commer. Res. Appl. 2020, 39, 100919. [Google Scholar] [CrossRef]
- Ghose, A.; Han, S.P.; Xu, K. Mobile commerce in the new tablet economy. In Proceedings of the International Conference on Information Systems, ICIS 2013, Milano, Italy, 15–18 December 2013; pp. 2591–2608. [Google Scholar]
- Seth, A.; Osei, A.M.; Dzaka, D. Re-Defining the Future of Commerce: Mobile Commerce and the Emergence of Sixth Sense Technology. Sing. J. Bus. Econ. Manag. Stud. 2015, 3, 1–8. [Google Scholar] [CrossRef][Green Version]
- Dumanska, I.; Hrytsyna, L.; Kharun, O.; Matviiets, O. E-commerce and M-commerce as Global Trends of International Trade Caused by the Covid-19 Pandemic. WSEAS. Trans. Environ. Dev. 2021, 17, 386–397. [Google Scholar] [CrossRef]
- Kim, E.-A. Social Distancing and Public Health Guidelines at Workplaces in Korea: Responses to Coronavirus Disease-19. Saf. Health Work 2020, 11, 275–283. [Google Scholar] [CrossRef]
- Sardjono, W.; Selviyanti, E.; Mukhlis, M.; Tohir, M. Global issues: Utilization of e-commerce and increased use of mobile commerce application as a result of the covid-19 pandemic. J. Phys. Conf. Ser. 2021, 1832, 012024. [Google Scholar] [CrossRef]
- Saritas, O.; Bakhtin, P.; Kuzminov, I.; Khabirova, E. Big data augmented business trend identification: The case of mobile commerce. Scientometrics 2021, 5, 1–27. [Google Scholar] [CrossRef]
- We Are Social and Hootsuite. Global Digital Report. Available online: https://wearesocial.com/blog/2019/01/digital-2019-global-internet-use-accelerates (accessed on 23 June 2021).
- Hew, J.J. Hall of fame for mobile commerce and its applications: A bibliometric evaluation of a decade and a half (2000–2015). Telemat. Inform. 2017, 34, 43–66. [Google Scholar] [CrossRef]
- Kaushik, D.; Gupta, A.; Gupta, S. E-Commerce Security Challenges: A Review. In Proceedings of the International Conference on Innovative Computing & Communications (ICICC) 2020, New Delhi, India, 21–23 February 2020. [Google Scholar] [CrossRef]
- Khan, S.W. Cyber security issues and challenges in E-commerce. In Proceedings of the 10th International Conference on Digital Strategies for Organizational Success, Gwalior, India, 5–7 January 2019. [Google Scholar] [CrossRef]
- Kaabi, S.; Jallouli, J. Overview of E-commerce Technologies, Data Analysis Capabilities and Marketing Knowledge. In Proceedings of the International Conference on Digital Economy; Springer: Cham, Switzerland, 2019. [Google Scholar] [CrossRef]
- Katsikeas, C.; Leonidou, L.; Zeriti, A. Revisiting international marketing strategy in a digital era. Int. Mark. Rev. 2019, 37, 405–424. [Google Scholar] [CrossRef]
- Fouskas, K.; Tsitiridou, O.-G.; Chatziharisto, C. A Systematic Literature Review on E-Commerce Success Factors. In Strategic Innovative Marketing and Tourism; Springer: Cham, Switzerland, 2020. [Google Scholar] [CrossRef]
- Zarmpou, T.; Saprikis, V.; Markos, A.; Vlachopoulou, M. Modeling users’ acceptance of mobile services. Electr. Comm. Res. 2012, 12, 225–248. [Google Scholar] [CrossRef]
- Ozturk, O.; Rızvanoglu, K. M-Commerce usability: An explorative study on turkish private shopping apps and mobile sites. In Proceedings of the International Conference of Design, User Experience, and Usability; Springer: Berlin/Heidelberg, Germany, 2013; pp. 623–630. [Google Scholar] [CrossRef]
- Jakimoski, K. Analysis of the Usability of Mcommerce Applications. Int. J. U Eser. Sci. Tech. 2014, 7, 13–20. [Google Scholar] [CrossRef]
- Sanz, L.F.; Pérez, J.G.; Martinez, C.A.; Misra, S. Analysis of Mobile Commerce in the SMEs of the European Union. Tech. Gaz. 2020, 27, 2062–2071. [Google Scholar] [CrossRef]
- Wu, J.H.; Wang, Y.M. Development of a tool for selecting mobile shopping site: A customer perspective. Electr. Comm. Res. Appl. 2006, 5, 192–200. [Google Scholar] [CrossRef]
- Nilashi, M.; Ibrahim, O.; Mirabi, V.R.; Ebrahimi, L.; Zare, M. The role of Security, Design and Content factors on customer trust in mobile commerce. J. Retail. Cons. Serv. 2015, 26, 57–69. [Google Scholar] [CrossRef]
- Pousttchi, K.; Tilson, D.; Lyytinen, K.; Hufenbach, Y. Introduction to the special issue on mobile commerce: Mobile commerce research Yesterday, Today, Tomorrow—What remains to be done? Int. J. Electr. Comm. 2015, 19, 1–20. [Google Scholar] [CrossRef]
- Tang, A.K. A systematic literature review and analysis on mobile apps in m-commerce: Implications for future research. Electr. Comm. Res. Appl. 2019, 37, 100885. [Google Scholar] [CrossRef]
- Duch-Brown, N.; Grzybowski, L.; Romahn, A.; Verboven, F. The impact of online sales on consumers and firms. Evidence from consumer electronics. Int. J. Ind. Organ. 2017, 20, 30–62. [Google Scholar] [CrossRef]
- Zhu, K.; Kraemer, K.L. Post-adoption variations in usage and value of e-business by organizations: Cross-country evidence from the retail industry. Inf. Syst. Res. 2005, 16, 61–84. [Google Scholar] [CrossRef]
- Oh, L.B.; Teo, H.H.; Sambamurthy, V. The Effects of Retail Channel Integration Through the Use of InformationnTechnologies on Firm Performance. J. Oper. Manag. 2012, 30, 368–381. [Google Scholar] [CrossRef]
- Jehangir, M.; Dominic, P.D.D.; Downe, A.G.; Naseebullah. Technology Resources and E-Commerce Impact on Business Performance. Commun. Comput. Inf. Sci. 2011, 189, 440–447. [Google Scholar]
- Kareem, T.S.; Owomoyela, S.K.; Oyebamiji, F.F. Electronic Commerce and Business Performance: An Empirical Investigation of Business Organizations. Int. J. Acad. Res. Bus. Soc. Sci. 2014, 4, 215–223. [Google Scholar]
- Sobihah, A.H.M.; Munir, A.; Embat, M.S.; Aziz, W.A.; Amin, B.W.M.; Muda, M.S. The Relationship between E-Commerce Adoption and Organization Performance. Int. J. Bus. Manag. 2014, 9, 56–62. [Google Scholar] [CrossRef]
- Falk, M.; Hagsten, E. E-commerce trends, and impacts across Europe. Int. J. Prod. Econ. 2015, 170, 357–369. [Google Scholar] [CrossRef]
- Salwani, M.I.; Marthandan, G.; Norzaidi, M.D.; Chong, S.C. E-commerce usage and business performance in the Malaysian tourism sector: Empirical analysis. Inf. Manag. Comput. Secur. 2009, 17, 166–185. [Google Scholar] [CrossRef]
- Fuchs, M.; Hopken, W.; Foger, A.; Kunz, M. E-Business Readiness, Intensity, and Impact: An Austrian Destination Management. Organ. Study J. Travel Res. 2010, 49, 165–178. [Google Scholar] [CrossRef]
- Changa, B.Y.; Magobeb, M.J.; Kimc, Y.B. E-commerce applications in the tourism industry: A Tanzania case study. South Afr. J. Bus. Manag. 2015, 46, 53–64. [Google Scholar] [CrossRef]
- Sobihah, A.H.M.; Lukman, Z.M. Organizational Culture Mediate Between E-Commerce Adoption and Hotel Performance. Mediterr. J. Soc. Sci. 2015, 6, 61–66. [Google Scholar] [CrossRef]
- Jahanshahi, A.A.; Razaei, M.; Nawaser, K.; Ranjbar, V.; Pitamber, B.K. Analyzing the effects of electronic commerce on organizational performance: Evidence from small and medium enterprises. Afr. J. Bus. Manag. 2012, 6, 6486–6496. [Google Scholar]
- Pantelimon, F.V.; Georgescu, T.M.; Posedaru, B.S. The Impact of Mobile e-Commerce on GDP: A Comparative Analysis between Romania and Germany and how Covid-19. Influences the e-Commerce activity Worldwide. Info Econ. 2020, 24, 27–41. [Google Scholar] [CrossRef]
- United States Census Bureau (USCB). Estimated Annual U.S. Retail Trade Sales—Total and E-Commerce. Available online: https://www2.census.gov/programs-surveys/arts/tables/2019/ecommerce.xlsx (accessed on 24 May 2021).
- United States Census Bureau (USCB). Estimated Quarterly U.S. Retail Sales: Total and E-commerce. Available online: https://www.census.gov/retail/mrts/www/data/excel/21q1table1.xls (accessed on 24 May 2021).
- Statista. U.S. Mobile Retail Commerce Revenue 2013–2020. Available online: https://www.statista.com/statistics/249855/mobile-retail-commerce-revenue-in-the-united-states/ (accessed on 26 May 2021).
- Fulgoni, G. Mobile and the Path to Purchase. Available online: https://www.slideshare.net/Planimedia/state-of-themobilemarketfinal?from_action=save (accessed on 27 May 2021).
- Statista. Share of Adults in The United States Who Use the Internet. Available online: https://www.statista.com/statistics/185700/percentage-of-adult-internet-users-in-the-united-states-since-2000/ (accessed on 26 May 2021).
- Pew Research Center (PRC). Mobile Fact Sheet. Available online: https://www.pewresearch.org/internet/fact-sheet/mobile/ (accessed on 30 May 2021).
- Bureau of Economic Analysis (BEA). National Income and Product Accounts. Table 1.1.4. Price Indexes for Gross Domestic Product; Table 1.1.5. Gross Domestic Product. Available online: https://apps.bea.gov/iTable/iTable.cfm?reqid=19&step=2#reqid=19&step=2&isuri=1&1921=survey (accessed on 29 May 2021).
- Liébana-Cabanillas, F.; Marinkovic, V.; Ramos de Luna, I.; Kalinic, Z. Predicting the determinants of mobile payment acceptance: A hybrid SEM-neural network approach. Tech. Forecast. Soc. Chang. 2018, 129, 117–130. [Google Scholar] [CrossRef]
- Abubakar, A.M. Using hybrid SEM–Artificial intelligence: Approach to examine the nexus between burnout, generation, career, life and job satisfaction. Pers. Rev. 2020, 29, 67–86. [Google Scholar] [CrossRef]
- Yakubu, M.N.; Dasuki, S.I.; Abubakar, A.M.; Kah, M.M. Determinants of learning management systems adoption in Nigeria: A hybrid SEM and artificial neural network approach. Ed. Inf. Tech. 2020, 25, 3515–3539. [Google Scholar] [CrossRef]
- Oday, A.; Ozturen, A.; Ilkan, M.; Abubakar, A.M. Do eReferral, eWOM, familiarity and cultural distance predict enrollment intention? An application of an artificial intelligence technique. J. Hosp. Tour. Tech. 2021, 12, 471–488. [Google Scholar] [CrossRef]
- Kalinić, Z.; Marinković, V.; Kalinić, L.; Liébana-Cabanillas, F. Neural network modeling of consumer satisfaction in mobile commerce: An empirical analysis. Exp. Syst. Appl. 2021, 175, 114803. [Google Scholar] [CrossRef]
- Akgül, Y. An Integrated SEM-Neural Network Approach for Predicting Mobile Banking Determinants of Adoption in Turkey. In Applications of Artificial Neural Networks for Nonlinear Data; Patel, H.A., Kumar, V.S., Eds.; IGI Global: Hershey, PA, USA, 2021; pp. 154–179. [Google Scholar]
- Hew, T.-S.; Leong, L.-Y.; Ooi, K.-B.; Chong, A.Y.-L. Predicting Drivers of Mobile Entertainment Adoption: A Two-Stage SEM-Artificial-Neural-Network Analysis. J. Comput. Inf. Syst. 2016, 56, 352–370. [Google Scholar] [CrossRef]
- Bollen, K.A.; Noble, M.D. Structural equation models and the quantification of behavior. Proc. Natl. Acad. Sci. USA 2011, 108, 15639–15646. [Google Scholar] [CrossRef]
- Ngubelanga, A.; Duffett, R. Modeling Mobile Commerce Applications’ Antecedents of Customer Satisfaction among Millennials: An Extended TAM Perspective. Sustainability 2021, 13, 5973. [Google Scholar] [CrossRef]
- Du, S.; Li, H. The Knowledge Mapping of Mobile Commerce Research: A Visual Analysis Based on I-Model. Sustainability 2019, 11, 1580. [Google Scholar] [CrossRef]
- Zhang, S.; Wu, Q.; Xu, S.; Li, G.Y. Fundamental Green Tradeoffs: Progresses, Challenges, and Impacts on 5G Networks. IEEE Commun. Surv. Tutor. 2017, 19, 33–56. [Google Scholar] [CrossRef]
- Wu, Q.; Li, G.Y.; Chen, W.; Ng, D.W.K.; Schober, R. An Overview of Sustainable Green 5G Networks. IEEE Wirel. Commun. 2017, 24, 72–80. [Google Scholar] [CrossRef]
- Alsharif, M.H.; Nordin, R.; Abdullah, N.F.; Kelechi, A.H. How to make key 5G wireless technologies environmental friendly: A review. Trans. Emerg. Telecommun. Technol. 2018, 29, 3254. [Google Scholar] [CrossRef]
- Alaimo, L.S.; Fiore, M.; Galati, A. How the Covid-19 Pandemic Is Changing Online Food Shopping Human Behaviour in Italy. Sustainability 2020, 12, 9594. [Google Scholar] [CrossRef]
- Thongpapanl, N.; Ashraf, A.R.; Lapa, L. The Potential Benefits of Offering Suitable Mobile Commerce Experience to Your Customers: An Abstract. In Back to the Future: Using Marketing Basics to Provide Customer Value. AMSAC. Developments in Marketing Science: Proceedings of the Academy of Marketing Science; Krey, N., Rossi, P., Eds.; Springer: Cham, Switzerland, 2017. [Google Scholar] [CrossRef]
- Ali Taha, V.; Pencarelli, T.; Škerháková, V.; Fedorko, R.; Košíková, M. The Use of Social Media and Its Impact on Shopping Behavior of Slovak and Italian Consumers during COVID-19 Pandemic. Sustainability 2021, 13, 1710. [Google Scholar] [CrossRef]


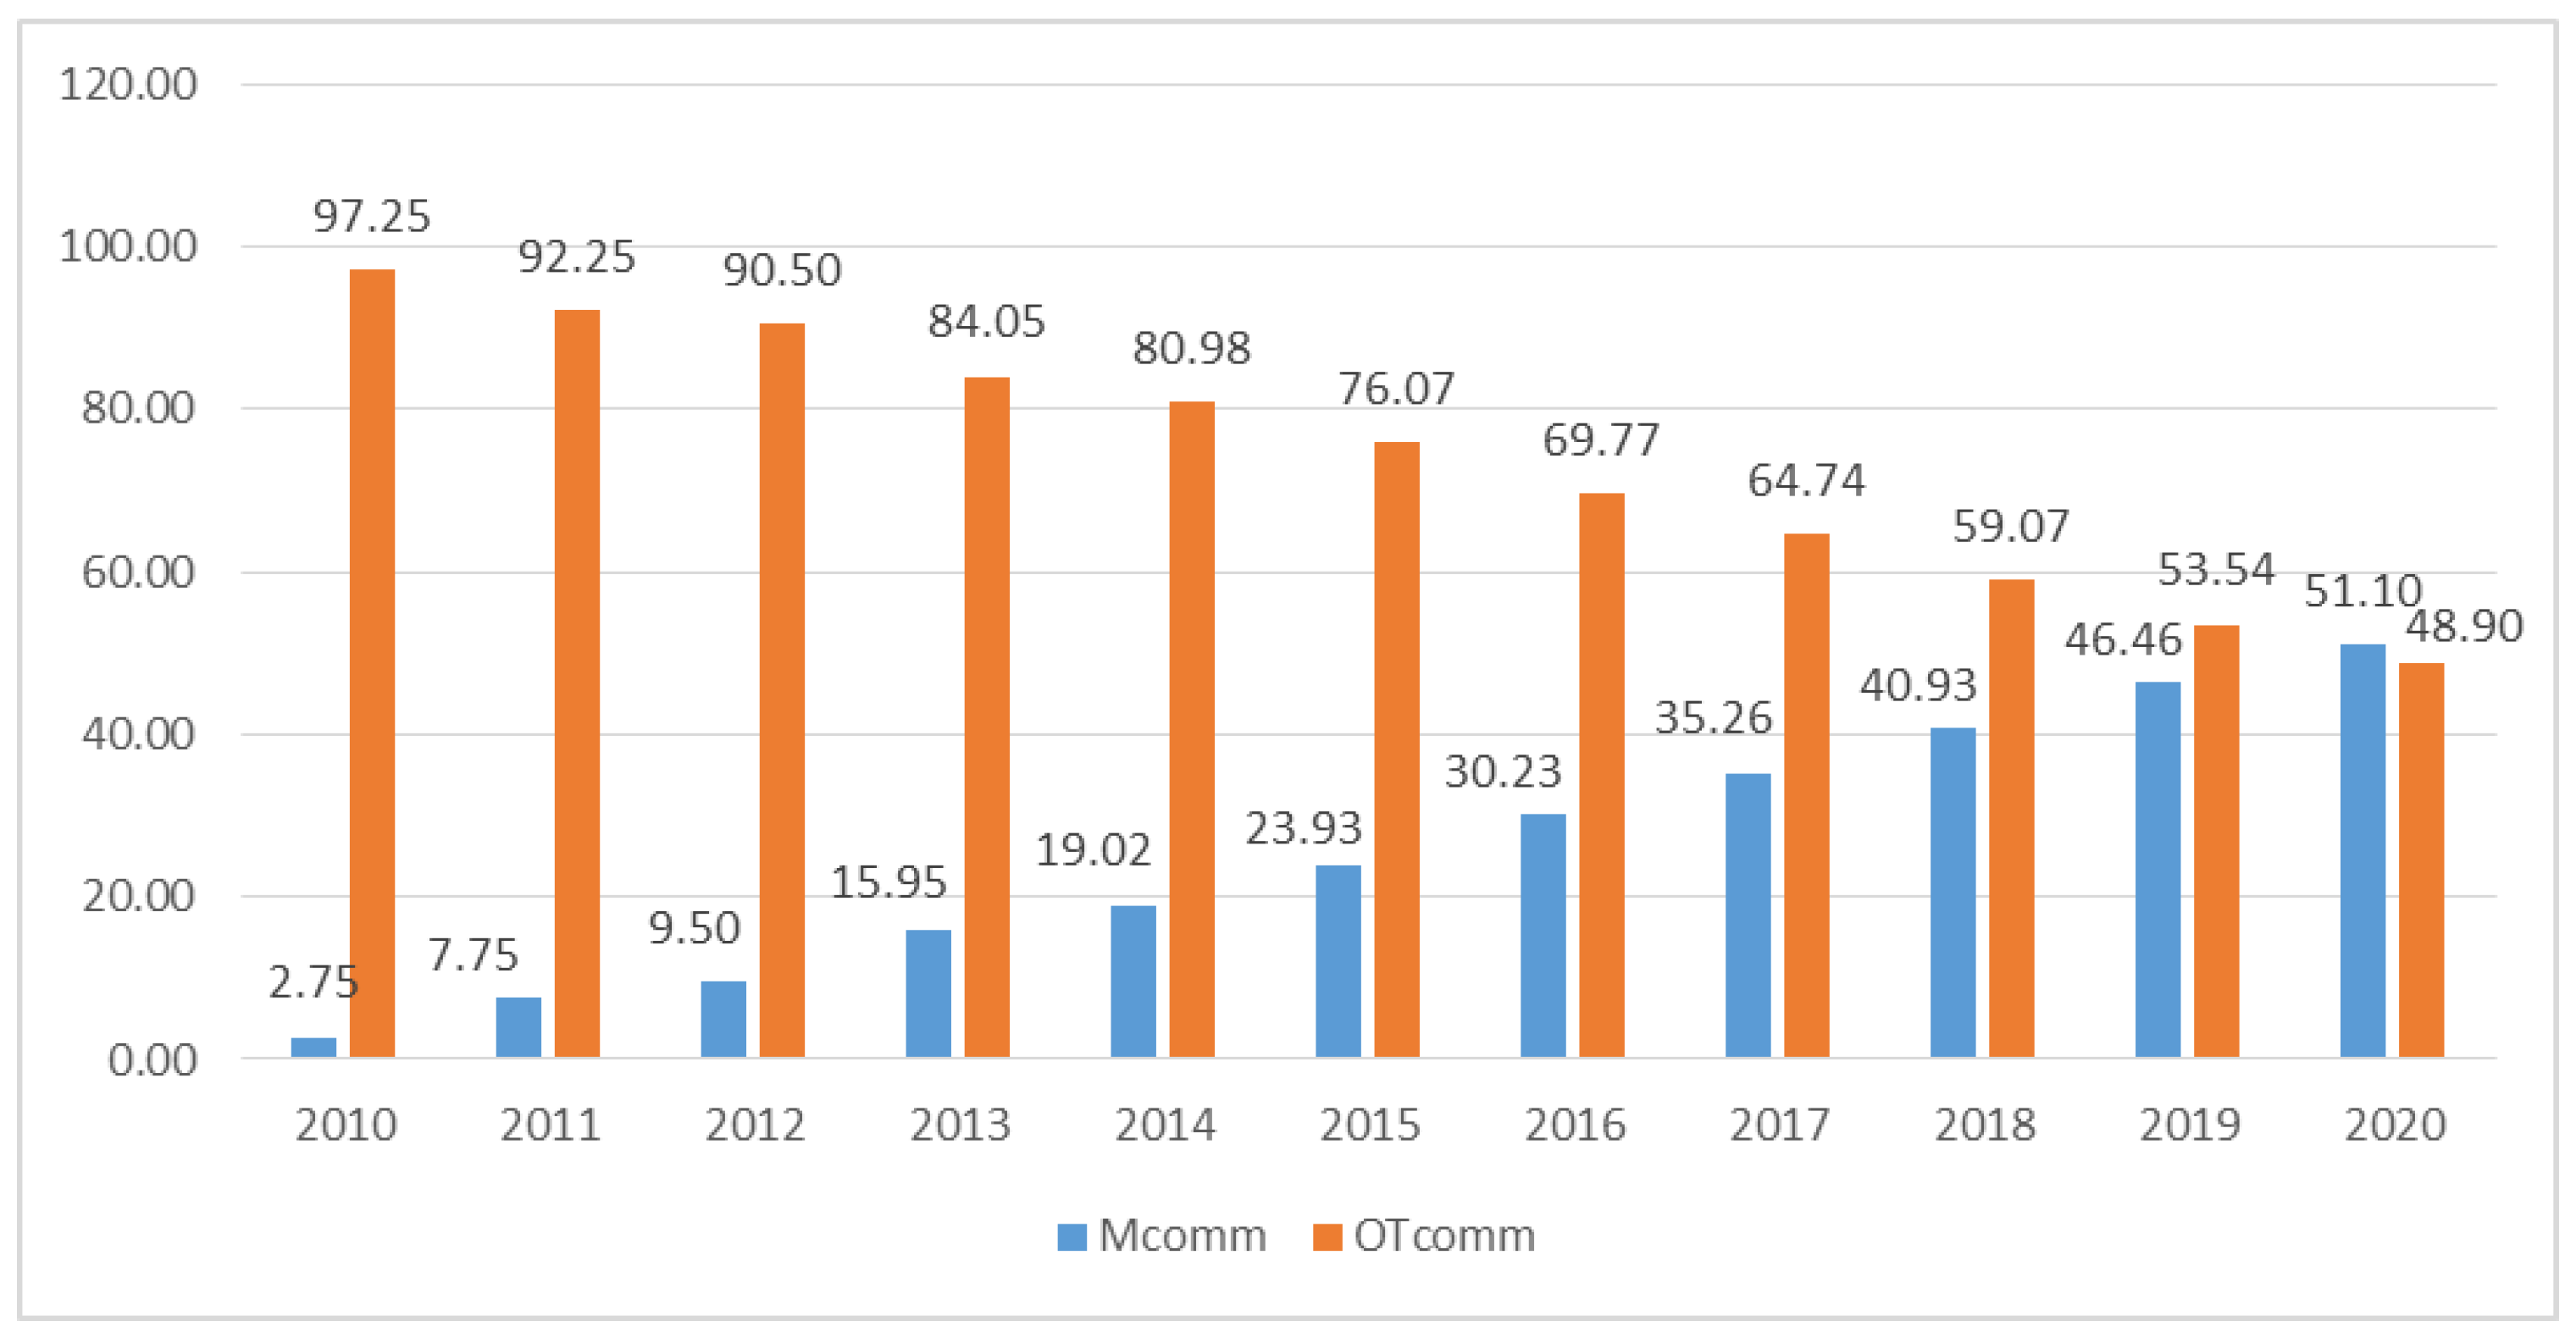
| Year | T.sales (Millions USD, $) | Sh.ecomm (%) | Sh.mcomm (%) | Sh.i_Use (%) | Sh.m_Dev (%) |
|---|---|---|---|---|---|
| 2011 | 3,818,048 | 4.45 | 2.75 | 76 | 22 |
| 2012 | 4,102,952 | 4.88 | 7.75 | 79 | 35 |
| 2013 | 4,302,229 | 5.4 | 9.5 | 83 | 46 |
| 2014 | 4,459,848 | 5.86 | 15.95 | 84 | 55 |
| 2015 | 4,641,927 | 6.42 | 19.02 | 84 | 58 |
| 2016 | 4,728,119 | 7.15 | 23.93 | 84 | 69 |
| 2017 | 4,848,213 | 7.91 | 30.23 | 86 | 70 |
| 2018 | 5,040,214 | 8.79 | 35.26 | 88 | 73 |
| 2019 | 5,253,037 | 9.63 | 40.93 | 89 | 77 |
| 2020 | 5,411,037 | 10.69 | 46.46 | 90 | 81 |
| Mcomm | T.sales | Ecomm | OT.comm | GDP | ||
|---|---|---|---|---|---|---|
| Mcomm | Correlation | 1 | 0.928 ** | 0.995 ** | 0.955 ** | 0.909 ** |
| Sig. (2-tailed) | 0.000 | 0.000 | 0.000 | 0.000 | ||
| N | 11 | 11 | 11 | 11 | 11 | |
| T.sales | Correlation | 0.928 ** | 1 | 0.955 ** | 0.983 ** | 0.986 ** |
| Sig. (2-tailed) | 0.000 | 0.000 | 0.000 | 0.000 | ||
| N | 11 | 11 | 11 | 11 | 11 | |
| Ecomm | Correlation | 0.995 ** | 0.955 ** | 1 | 0.980 ** | 0.932 ** |
| Sig. (2-tailed) | 0.000 | 0.000 | 0.000 | 0.000 | ||
| N | 11 | 11 | 11 | 11 | 11 | |
| OT.comm | Correlation | 0.955 ** | 0.983 ** | 0.980 ** | 1 | 0.952 ** |
| Sig. (2-tailed) | 0.000 | 0.000 | 0.000 | 0.000 | ||
| N | 11 | 11 | 11 | 11 | 11 | |
| GDP | Correlation | 0.909 ** | 0.986 ** | 0.932 ** | 0.952 ** | 1 |
| Sig. (2-tailed) | 0.000 | 0.000 | 0.000 | 0.000 | ||
| N | 11 | 11 | 11 | 11 | 11 |
| T.sales | Ecomm | Mcomm | GDP | |
|---|---|---|---|---|
| 2011 | 7.46 | 17.93 | 232.35 | 3.67 |
| 2012 | 12.68 | 36.65 | 372.06 | 8.04 |
| 2013 | 16.81 | 53.93 | 792.61 | 11.96 |
| 2014 | 21.58 | 75.37 | 1112.76 | 16.91 |
| 2015 | 23.84 | 99.06 | 1632.14 | 21.65 |
| 2016 | 26.98 | 125.67 | 2380.73 | 25.03 |
| 2017 | 32.01 | 160.84 | 3244.44 | 30.36 |
| 2018 | 37.58 | 197.85 | 4333.08 | 37.49 |
| 2019 | 41.72 | 240.45 | 5651.98 | 42.96 |
| 2020 | 46.20 | 346.92 | 8203.97 | 39.65 |
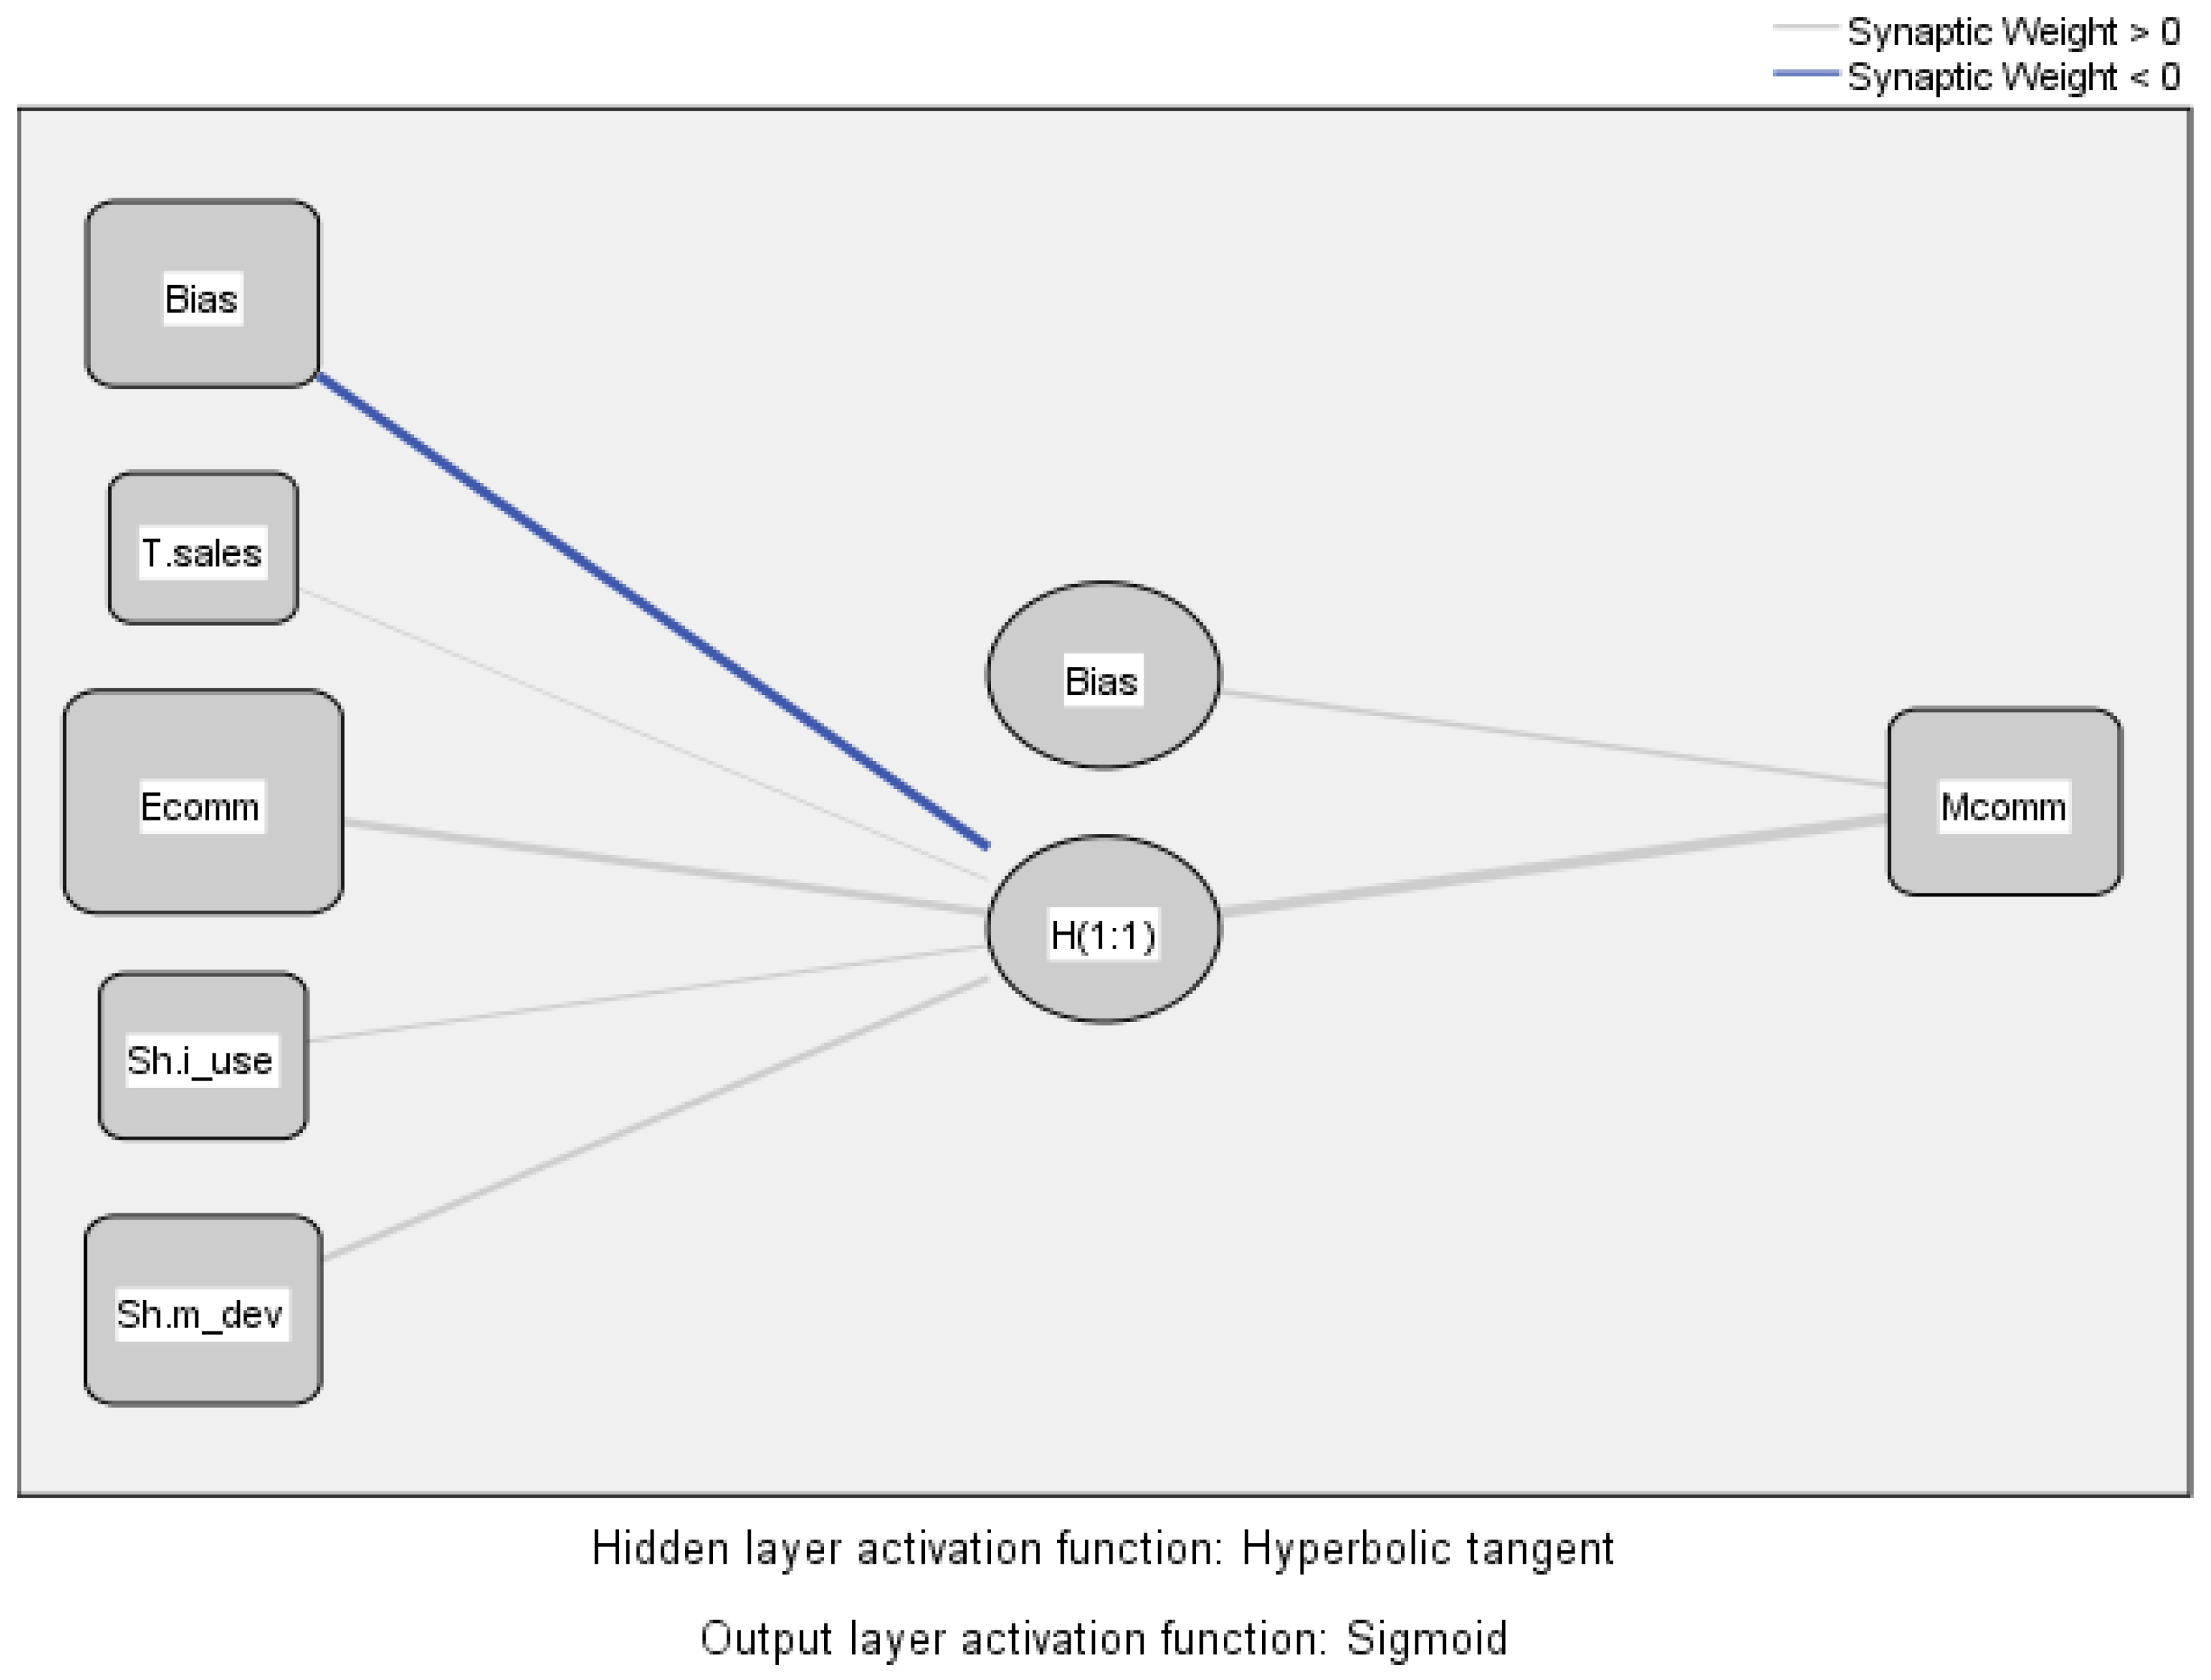
| Predictor | Predicted | ||
|---|---|---|---|
| Hidden Layer 1 | Output Layer | ||
| H (1:1) | Mcomm | ||
| Input Layer | (Bias) | −0.579 | |
| T.sales | 0.014 | ||
| Ecomm | 0.484 | ||
| Sh.i_use | 0.134 | ||
| Sh.m_dev | 0.356 | ||
| Hidden Layer 1 | (Bias) | 0.250 | |
| H(1:1) | 2.798 | ||
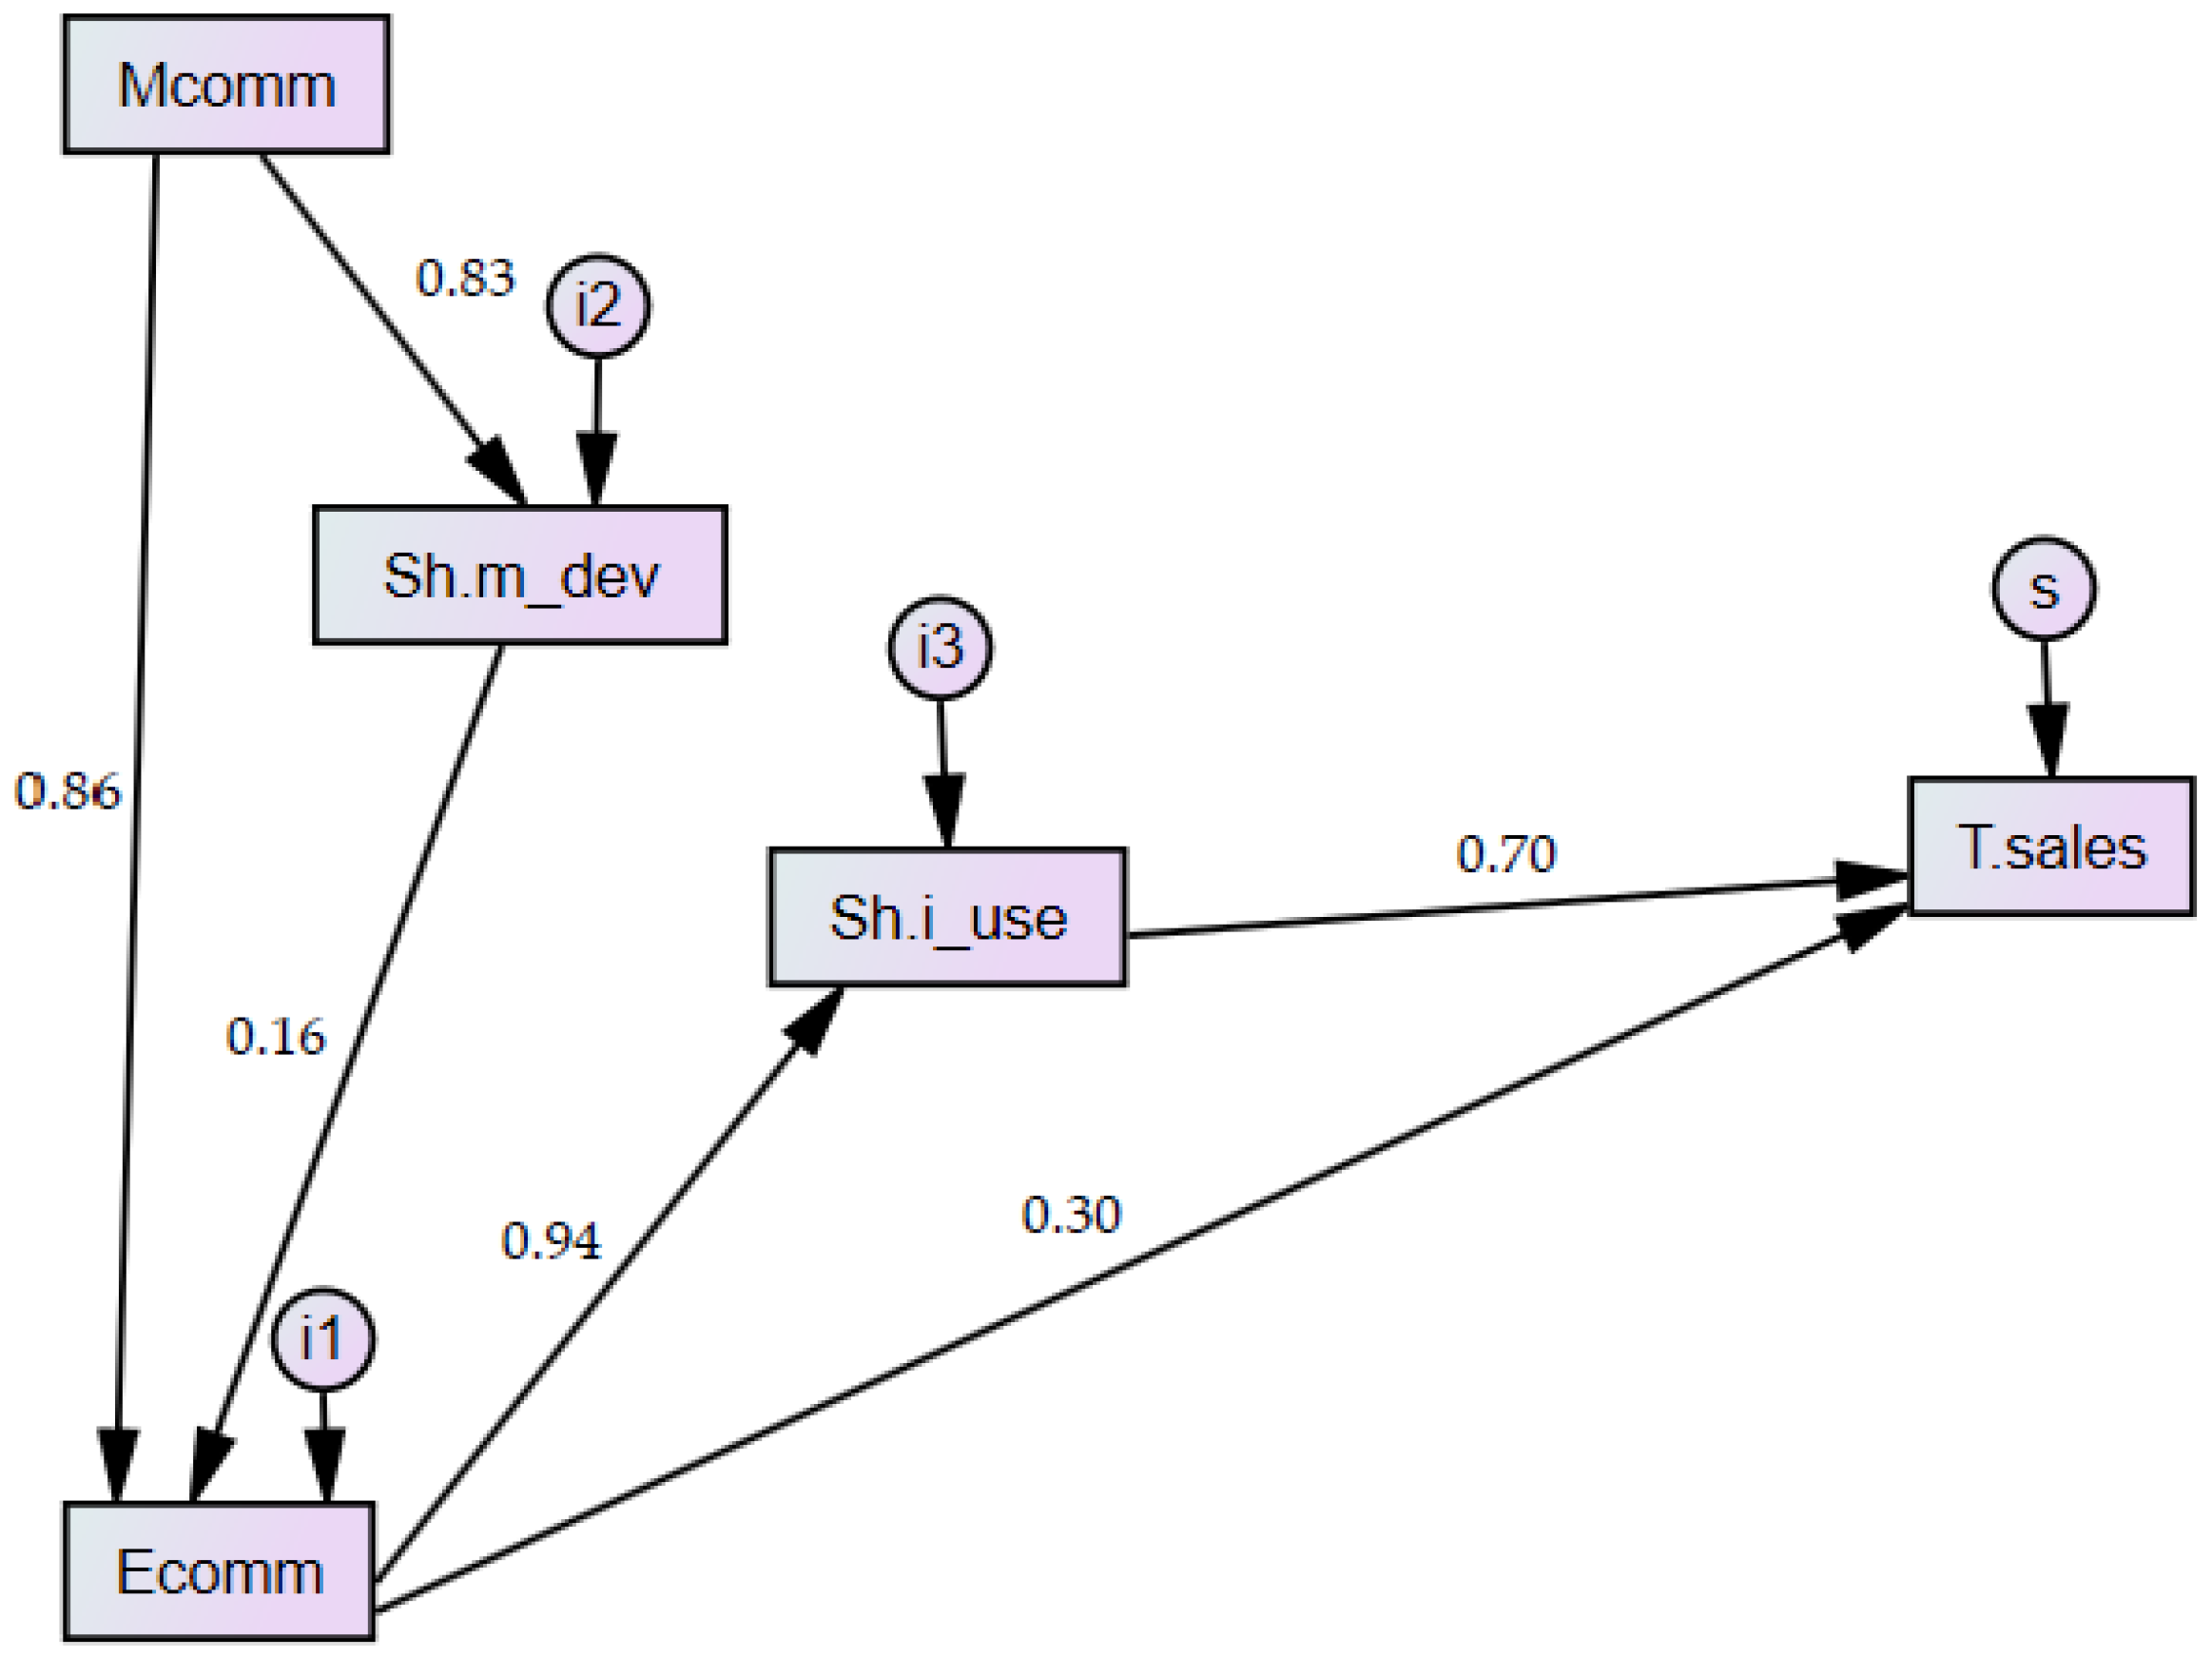
| Total Standardized Effects | ||||
| Mcomm | Sh.m_dev | Ecomm | Sh.i_use | |
| Sh.m_dev | 0.832 | 0.000 | 0.000 | 0.000 |
| Ecomm | 0.995 | 0.165 | 0.000 | 0.000 |
| Sh.i_use | 0.931 | 0.154 | 0.936 | 0.000 |
| T.sales | 0.951 | 0.157 | 0.955 | 0.702 |
| Direct Standardized Effects | ||||
| Mcomm | Sh.m_dev | Ecomm | Sh.i_use | |
| Sh.m_dev | 0.832 | 0.000 | 0.000 | 0.000 |
| Ecomm | 0.858 | 0.165 | 0.000 | 0.000 |
| Sh.i_use | 0.000 | 0.000 | 0.936 | 0.000 |
| T.sales | 0.000 | 0.000 | 0.298 | 0.702 |
| Indirect Standardized Effects | ||||
| Mcomm | Sh.m_dev | Ecomm | Sh.i_use | |
| Sh.m_dev | 0.000 | 0.000 | 0.000 | 0.000 |
| Ecomm | 0.137 | 0.000 | 0.000 | 0.000 |
| Sh.i_use | 0.931 | 0.154 | 0.000 | 0.000 |
| T.sales | 0.951 | 0.157 | 0.657 | 0.000 |
Publisher’s Note: MDPI stays neutral with regard to jurisdictional claims in published maps and institutional affiliations. |
© 2021 by the authors. Licensee MDPI, Basel, Switzerland. This article is an open access article distributed under the terms and conditions of the Creative Commons Attribution (CC BY) license (https://creativecommons.org/licenses/by/4.0/).
Share and Cite
Vărzaru, A.A.; Bocean, C.G. A Two-Stage SEM–Artificial Neural Network Analysis of Mobile Commerce and Its Drivers. J. Theor. Appl. Electron. Commer. Res. 2021, 16, 2304-2318. https://doi.org/10.3390/jtaer16060127
Vărzaru AA, Bocean CG. A Two-Stage SEM–Artificial Neural Network Analysis of Mobile Commerce and Its Drivers. Journal of Theoretical and Applied Electronic Commerce Research. 2021; 16(6):2304-2318. https://doi.org/10.3390/jtaer16060127
Chicago/Turabian StyleVărzaru, Anca Antoaneta, and Claudiu George Bocean. 2021. "A Two-Stage SEM–Artificial Neural Network Analysis of Mobile Commerce and Its Drivers" Journal of Theoretical and Applied Electronic Commerce Research 16, no. 6: 2304-2318. https://doi.org/10.3390/jtaer16060127
APA StyleVărzaru, A. A., & Bocean, C. G. (2021). A Two-Stage SEM–Artificial Neural Network Analysis of Mobile Commerce and Its Drivers. Journal of Theoretical and Applied Electronic Commerce Research, 16(6), 2304-2318. https://doi.org/10.3390/jtaer16060127