Article

Transcriptomic Landscape of Circulating Extracellular Vesicles in Heart Transplant Ischemia–Reperfusion

1
Translational Immunology Research Program, Transplantation Laboratory, University of Helsinki, 00014 Helsinki, Finland
2
Institute for Molecular Medicine Finland FIMM, EV and HiPREP Core, University of Helsinki, 00014 Helsinki, Finland
3
Heart and Lung Center, Helsinki University Hospital, University of Helsinki, 00014 Helsinki, Finland
*
Author to whom correspondence should be addressed.
Genes 2023, 14(11), 2101; https://doi.org/10.3390/genes14112101
Submission received: 13 October 2023 / Revised: 14 November 2023 / Accepted: 16 November 2023 / Published: 18 November 2023
(This article belongs to the Section Molecular Genetics and Genomics)

Abstract

:
Ischemia–reperfusion injury (IRI) is an inevitable event during heart transplantation, which is known to exacerbate damage to the allograft. However, the precise mechanisms underlying IRI remain incompletely understood. Here, we profiled the whole transcriptome of plasma extracellular vesicles (EVs) by RNA sequencing from 41 heart transplant recipients immediately before and at 12 h after transplant reperfusion. We found that the expression of 1317 protein-coding genes in plasma EVs was changed at 12 h after reperfusion. Upregulated genes of plasma EVs were related to metabolism and immune activation, while downregulated genes were related to cell survival and extracellular matrix organization. In addition, we performed correlation analyses between EV transcriptome and intensity of graft IRI (i.e., cardiomyocyte injury), as well as EV transcriptome and primary graft dysfunction, as well as any biopsy-proven acute rejection after heart transplantation. We ultimately revealed that at 12 h after reperfusion, 4 plasma EV genes (ITPKA, DDIT4L, CD19, and CYP4A11) correlated with both cardiomyocyte injury and primary graft dysfunction, suggesting that EVs are sensitive indicators of reperfusion injury reflecting lipid metabolism-induced stress and imbalance in calcium homeostasis. In conclusion, we show that profiling plasma EV gene expression may enlighten the mechanisms of heart transplant IRI.

1. Introduction

Heart transplantation (HTx) remains the ultimate therapeutic option for patients with end-stage heart failure. Although outcomes have improved due to advances in immunosuppressive care and organ preservation methods, the short- and long-term survival of the allograft is negatively affected by factors such as ischemia–reperfusion injury (IRI). This inevitable complication after HTx is induced by periods of cold and warm ischemia during preservation and surgical procedure, followed by reperfusion and concomitant reoxygenation after implantation, altogether eventually causing exacerbation of cellular damage and primary graft dysfunction (PGD) [1,2]. Therefore, studies and strategies for the prevention of this phenomenon are of high clinical significance.
Extracellular vesicles (EVs) are a heterogeneous group of nanosized membranous vesicles secreted by all cell types. EVs play a role in cell-to-cell communication in various physiological processes as they carry, e.g., proteins, carbohydrates, lipids, messenger RNAs (mRNAs), and microRNAs that can interact with target cells [3]. In the regulation of inflammation, they have now been recognized as potential biomarkers and immune mediators in organ transplantation [4].
Ischemia–reperfusion-induced EV release may worsen myocardial injury by promoting inflammation [5]. However, their role in IRI after cardiac transplantation remains poorly understood. We aimed to characterize the transcriptomic landscape of plasma-derived EVs during IRI in human HTx using RNA sequencing. We compared gene expression changes in EVs derived from the plasma of heart transplant recipients before and at 12 h after reperfusion. Furthermore, we correlated clinical data with the plasma EV transcriptome to identify EV transcripts that are strongly linked to IRI-related myocardial injury and the development of PGD.

2. Materials and Methods
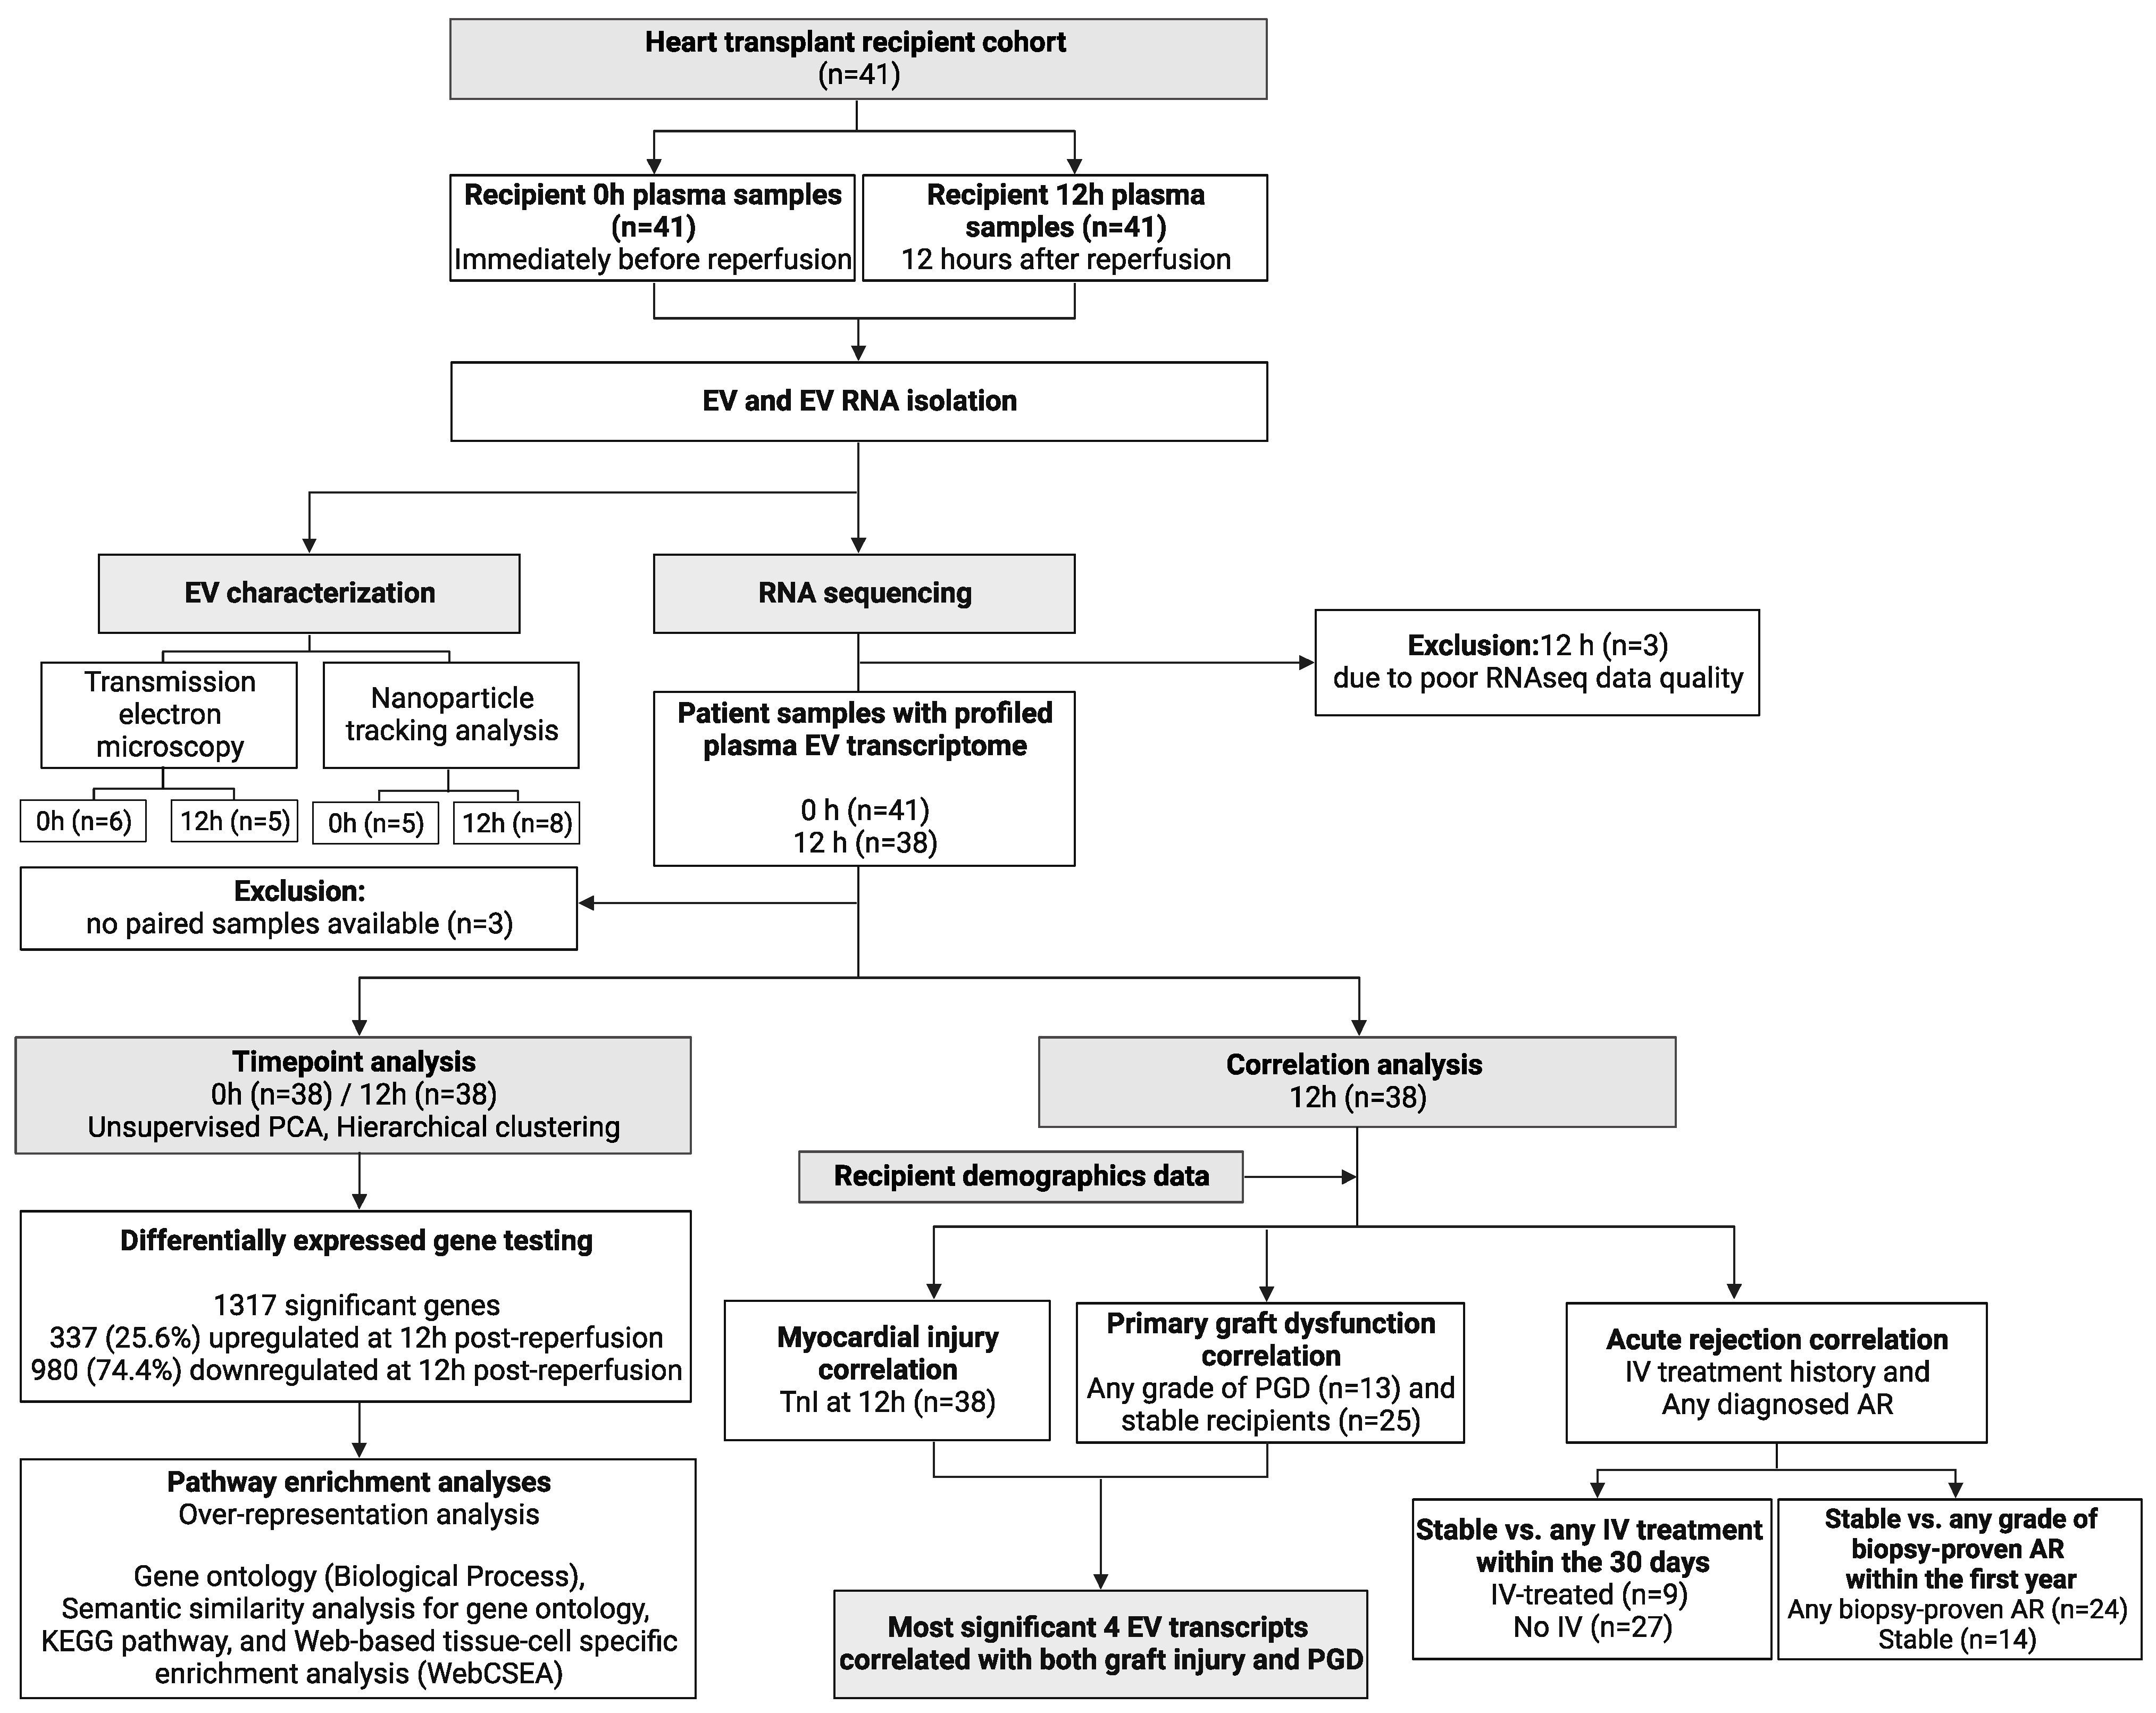
2.1. Study Design

This study was designed to characterize the recipient plasma EV transcriptome during ischemia–reperfusion in human HTx. In addition, we integrated the clinical data of the recipients to identify significant correlations between the EV transcriptome and occurrences of myocardial injury and PGD at 12 h after reperfusion. The patient cohort was initially designed for a clinical trial on donor simvastatin treatment [6,7] and was conducted as a prospective, double-blind, randomized single-center study at the Helsinki University Hospital between 2010 and 2016. The study was approved by the Ethical Committee Board (permission number 358/13/03/02/2009), and it was conducted in accordance with the principles of the Declaration of Helsinki. The blood samples used in this study were collected at two timepoints: immediately before reperfusion (0 h) and at 12 h (12 h) after reperfusion. Using next-generation sequencing technology, we profiled the whole EV transcriptome in an unbiased approach to thoroughly understand expression changes within the EV transcriptomic landscape. The classification of PGD grades was made within 24 h after the transplantation, in accordance with the ISHLT guidelines [8]. For transcriptomic profiling and subsequent correlation analyses with clinical data, we initially used paired plasma samples from 41 recipients. Following stringent sequencing data control, the finally analyzed dataset consisted of paired plasma samples from 38 recipients.

2.2. Sample Collection and Processing

Blood samples from 41 heart transplant recipients were collected into lithium heparin BD Vacutainer blood tubes (Becton Dickinson, Franklin Lakes, NJ, USA) immediately before reperfusion (0 h) and at 12 h after reperfusion (12 h) during the HTx procedure. Blood was centrifuged at 1600× g for 10 min at RT. Plasma was transferred to cryotubes (Nunc Thermo Scientific, Waltham, MA, USA) and stored at −80 °C. Upon analysis, 900 μL of thawed plasma was diluted at a 1:1 ratio with 0.22 μm filtered PBS and filtered with 0.8 μm Millex AA syringe filters (Millipore Sigma, Burlington, MA, USA). To isolate EV, diluted plasma was ultracentrifuged using SW 55 Ti rotor and Polypropylene Thickwall tubes (Beckmann-Coulter, Brea, CA, USA) at 40,000 rpm at +4 °C for 90 min. EV pellets were washed with 2 mL of PBS and ultracentrifuged, resuspended in 100 μL of filtered PBS, and stored in DNALobind tubes (Eppendorf, Hamburg, Germany). To eliminate heparin residues, heparinase I (New England Biolabs, Ipswich, MA, USA) was added to the EV resuspension (0.1 U/μL) and incubated at 37 °C for 1 h. RNA was isolated from EVs by using a Qiagen miRNeasy micro kit (Qiagen, Hilden, Germany). The quality and concentration of EV RNA were measured using the Bioanalyzer Pico kit (Agilent, Santa Clara, CA, USA).

2.3. Transmission Electron Microscopy and Nanoparticle Tracking Analysis

To examine the presence and morphology of isolated EV, representative samples were prepared for transmission electron microscopy (0 h, n = 6 and 12 h, n = 5) [9]. To analyze the concentration and size distribution of isolated EV, 20 μL of the representative eluted EV samples (0 h, n = 5, and 12 h, n = 8) were diluted in Dulbecco’s PBS and analyzed on NanoSight LM14C (Nanosight, Salisbury, UK) and Zetaview PMX-120 model (ParticleMetrix, Ammersee, Germany) equipped with a blue laser (404 nm and 488 nm, respectively) and a high sensitivity CMOS camera. EV size and concentration data were obtained with the NanoSight instrument by recording 90 s of 3 videos, and EV size and concentration data analyzed with Zetaview were captured by scanning 11 positions with 30 frames and 12.41 μS/cm sensed conductivity. To determine the concentration and the size of isolated EV, data obtained were analyzed using NTA software 3.0 and ZetaView software (Version 8.05.12 SP2).

2.4. RNA Sequencing

EV RNA samples from 17 recipients were sequenced on Illumina HiSeq 2500 and samples from 21 recipients were sequenced on Illumina NovaSeq 6000 (Illumina, San Diego, CA, USA). Pair-ended cDNA libraries were prepared using SMARTseqv4 Ultra Low Input RNA kit (Takara Bio Inc., Kusatsu, Shiga, Japan). One hundred picograms of amplified cDNA were tagmented and indexed using the Nextera XT DNA library prep kit (Illumina). Finally, cDNA libraries were sequenced using a sequencing v4 kit (Illumina) to obtain at least 15 million reads on the HiSeq and 25 million reads on the NovaSeq platform.

2.5. Bioinformatics

RNAseq raw data were processed with the Trimmomatic software (version 0.39) [10] and were aligned to the Human Genome (GRCh38) with the STAR software (version 2.7.10a) [11]. Gene expression read counts were calculated by using the Rsubread software (version 2.16.0) [12]. Sequencing data were normalized with the TMM normalization method prior to the statistical analysis to avoid differences between sequencing platforms and batches. Raw counts, normalized CPM, and RPKM values are given in supplementary data (Table S1). Outliers were identified by generating a principal component analysis (PCA) plot from counts per million (CPM) values for each gene in the sample. Analyses such as PCA and unsupervised hierarchical clustering were performed with the ropls (version 1.34.0) [13] and factoextra R packages (version 1.0.7). Differential gene expression testing was performed using edgeR (version 4.0.1) [14]. Protein-coding genes presenting absolute log-change greater than 1.5 and q-value (FDR-adjusted p-value) less than 0.05 were considered to be significant. In addition, the R package CombiROC (version 0.3.4) and pROC (version 1.18.5) were used to calculate the power of discrimination for 1317 differentially expressed genes (DEGs). Heatmaps of dDEGs were visualized by the pheatmap R package (version 1.0.12) [15]. Functional annotations of DEGs were investigated with the clusterProfiler (version 4.4.4) using its functions enrichGO and enrichKEGG. Enriched terms with a q-value (FDR-adjusted p-value) of less than 0.05 were considered significant. Outputs of enrichment analyses were visualized using the dotplot function in the clusterProfiler R package [16]. We summarized and reduced the redundant enriched gene ontology terms by using the Revigo-based [17] R package RRVGO (version 1.10.0) [18]. Summarized terms were visualized using the scatterplot function included in the same package. To examine the protein network of the genes, we used the STRING analysis tool (https://string-db.org/, version 12.0, last accessed on 2 October 2023) [19]. Furthermore, we used Web-based cell-specific enrichment analysis (WebCSEA, https://bioinfo.uth.edu/webcsea/, last accessed on 6 October 2023) [20] to elucidate the cell types that may be associated with the significant 1317 protein-coding genes found at 12 h post-reperfusion when compared to 0 h. This tool enables the enrichment of systematic gene sets for human tissue cell-type expression signatures. The most significant cell types were identified and visualized based on the −log10 fold change combined with the p-value. For correlation analysis of high-sensitivity plasma troponin I level (TnI), PGD, and AR with EV transcriptome, we used the Wilcox rank sum test. The final set of significant genes was determined with a p-value cutoff of less than 0.005.

3. Results

3.1. Recipient Characteristics

Plasma EV RNA was extracted from 41 heart transplant recipients, from samples taken immediately before and at 12 h after reperfusion and then subjected to next-generation RNA sequencing. Three recipients were excluded due to the low RNA quality of their samples. Of the remaining 38 recipients, the median age was 60 (range 27–67), and 9 (23.7%) of them were female. The most common cause for HTx was dilated cardiomyopathy (46.2%). A total of 26.2% of patients were bridged to transplantation with mechanical circulatory support (Table 1). A CONSORT flowchart describes the study flow (Figure 1).

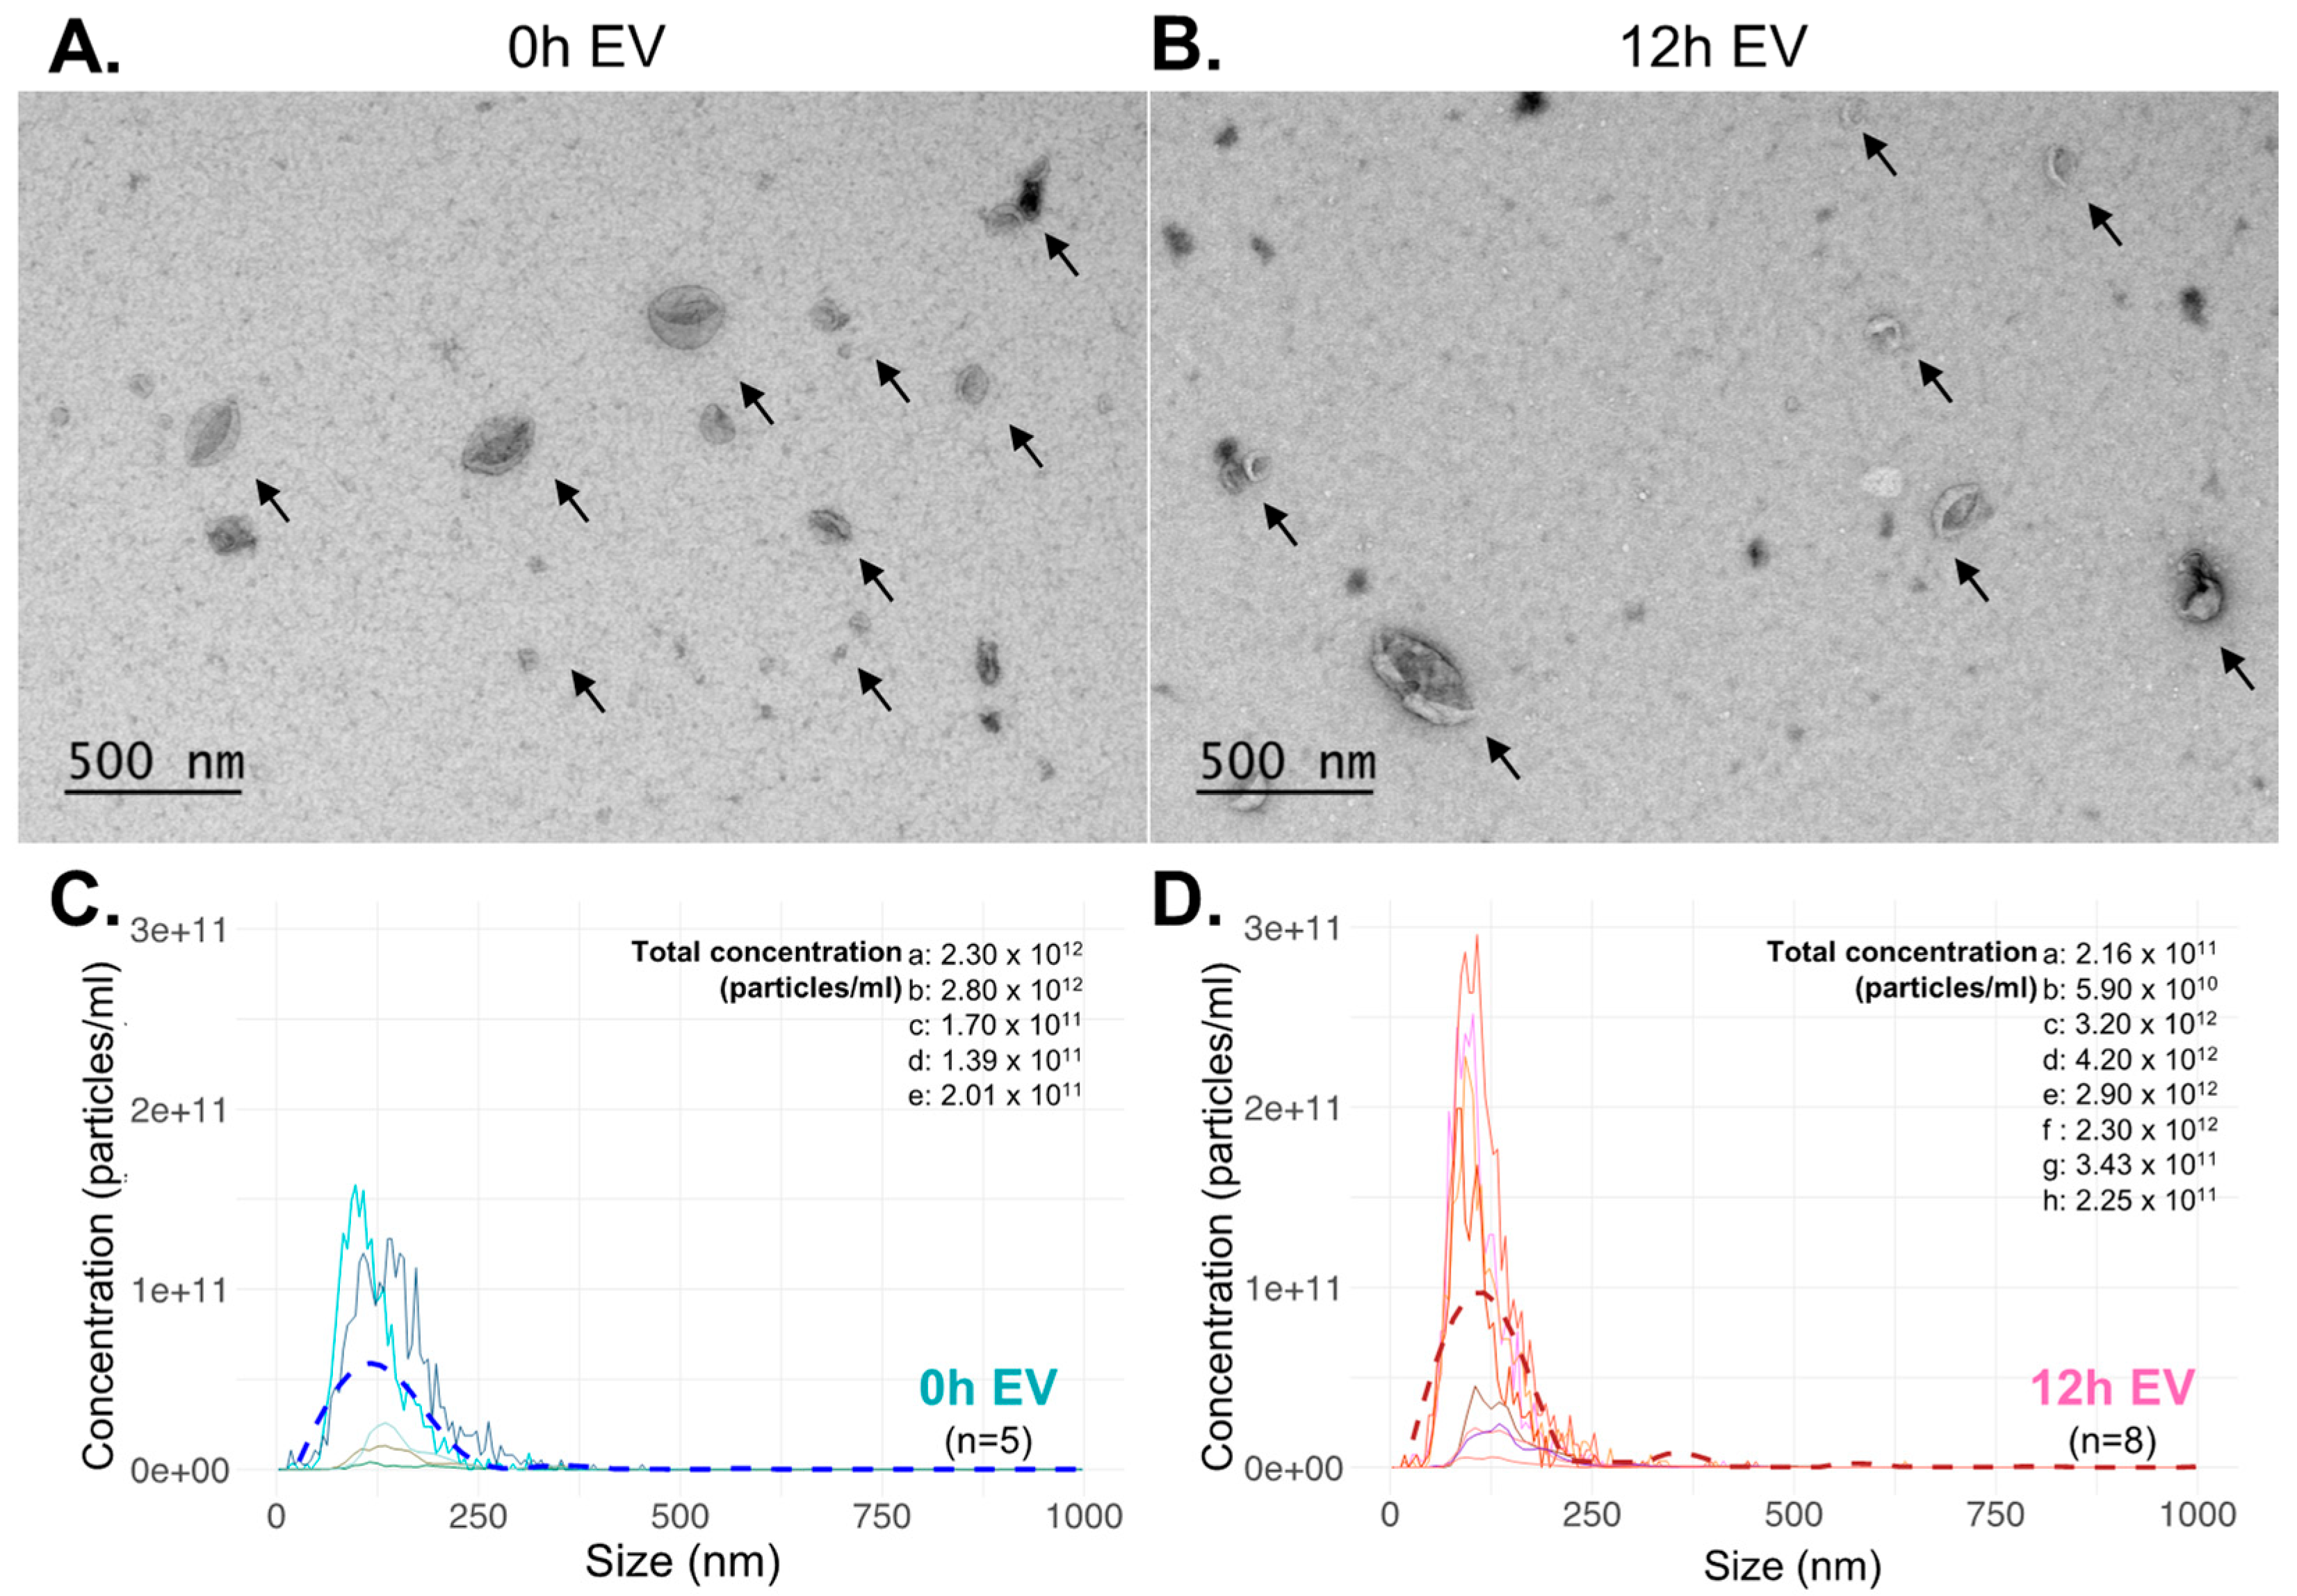
3.2. EV Characterization

Plasma EVs showed a typical cup-shaped morphology in the electron microscopic images (0 h, n = 6 and 12 h, n = 5) (Figure 2A,B). Nanoparticle tracking analysis revealed that the size distribution of isolated EVs from 0 h (n = 5) and 12 h (n = 8) samples ranged within approximately 50 nm to 1355 nm and 50 nm to 1095 nm, respectively. The plasma EV concentration was similar at both timepoints (Figure 2C,D).

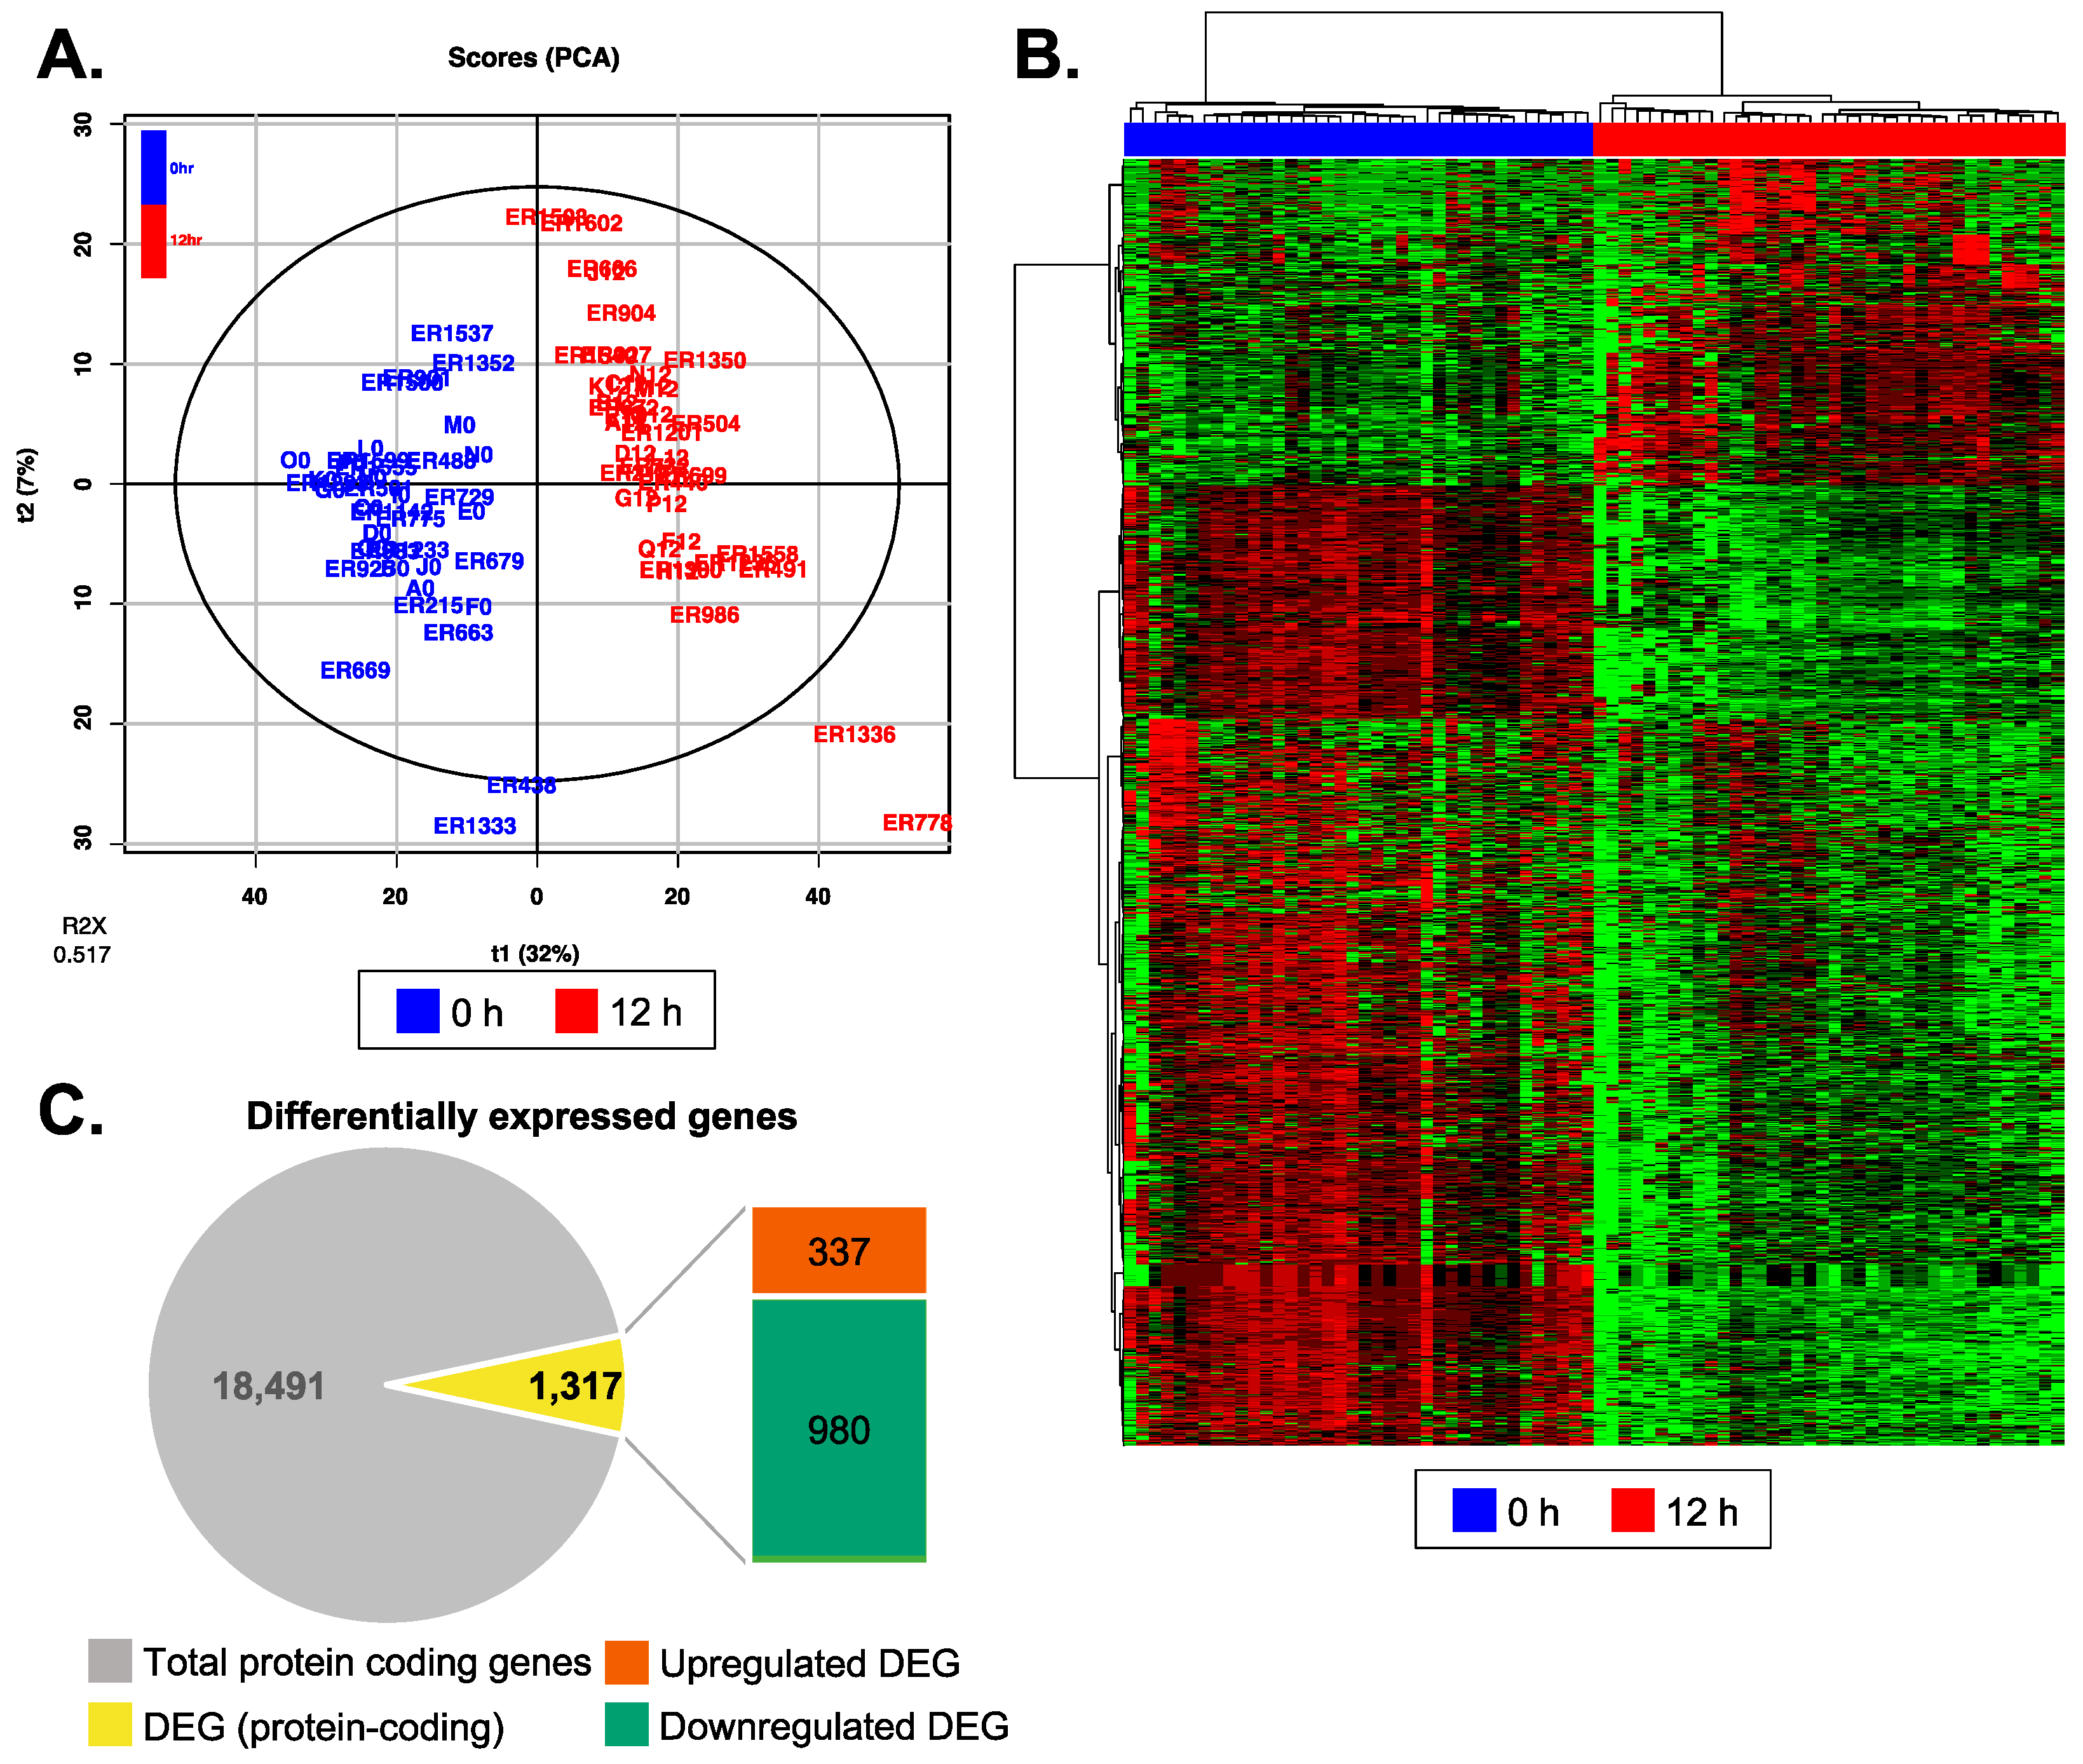
3.3. Reperfusion Altered mRNA Expression Profiles of Recipient Plasma EV

Unsupervised PCA showed distinct plasma EV transcriptomic profiles at 12 h after heart transplant reperfusion compared to 0 h before reperfusion (Figure 3A,B). Raw counts, normalized CPM, and RPKM values are given in supplementary data (Table S1). DEG analysis, with a cut-off of log-fold change greater than 1.5 and a q-value less than 0.05, revealed a total of 1317 (3.4%) protein-coding genes. Among these, 25.6% of the genes were found to be upregulated, while 74.4% were downregulated (Figure 3C and Table S2). We additionally conducted ROC analysis to assess different powers of discrimination for DEGs (Table S3). When applied minimum specificity of 80% and sensitivity of 80% for high-power discrimination, 27% of DEGs (357 out of 1317) at 12 h passed the cutoff criteria (Table S4). These genes exhibited similar biological functions to those we observed in pathway analyses when using 1317 DEGs (Figure S1).

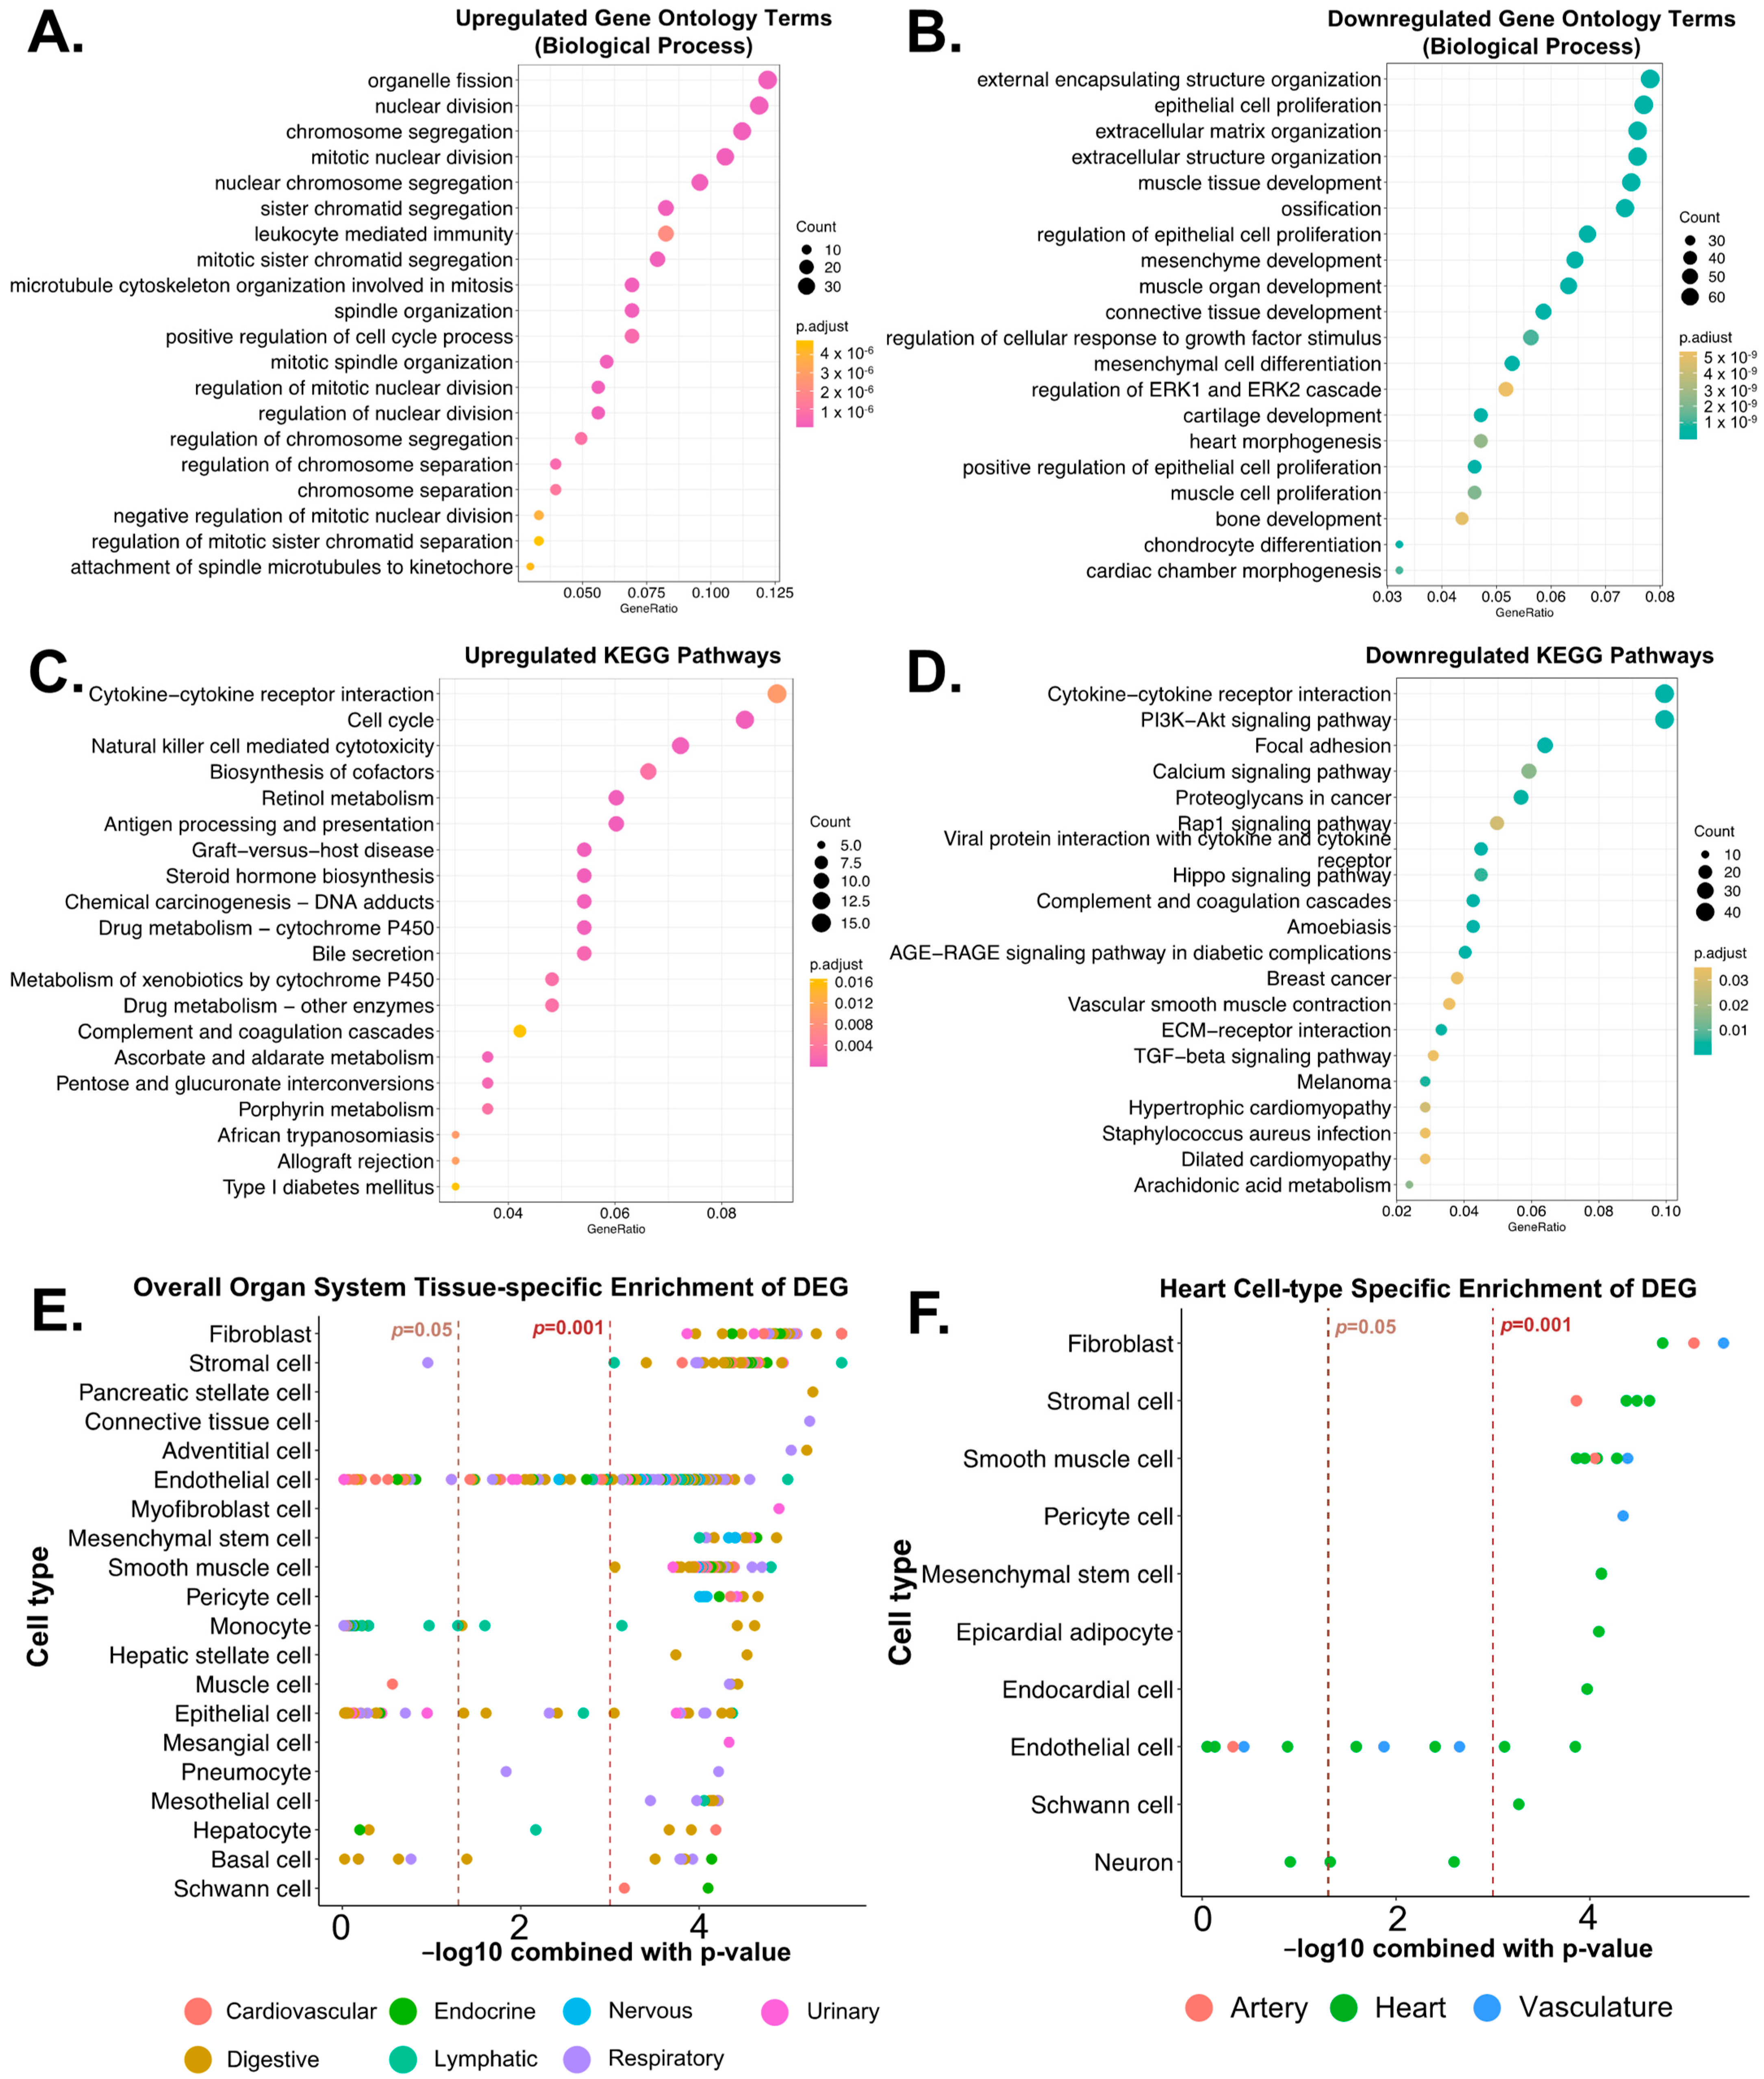
3.4. Biological Functions Related to the Differentially Expressed Genes after Reperfusion

To gain a better understanding of the impact of heart transplant reperfusion injury on the plasma EV transcriptome, we investigated the 1317 DEGs by enriching biological annotations. Firstly, we performed gene ontology enrichment over-representation analysis to explore relevant biological processes. Upregulated genes at 12 h after reperfusion were mainly linked to cell division, leukocyte-mediated immunity, and metabolic processes (Figure 4A), whereas downregulated genes were related to extracellular structure, tissue development, and cell proliferation (Figure 4B). To refine and reduce possible redundant enriched gene ontology terms, we summarized those terms based on a semantic similarity score by the Relevance method [21]. The calculated scores thus yielded more precise terms related to biological processes. We found that upregulated genes were related to leukocyte-mediated immunity, acute-phase response, regulation of coagulation, lipid metabolic processes, and mitosis (Figure S2A), while downregulated genes were linked to complement activation, cell chemotaxis, wound healing, response to oxygen levels, organ development, and collagen processes (Figure S2B). Next, we conducted a KEGG pathway enrichment analysis to explore possible biological pathways related to the DEGs. In alignment with the findings in the gene ontology analysis, upregulated genes were associated with cytokine receptor interaction, cell cycle, natural-killer-cell-mediated cytotoxicity, retinol metabolism, antigen processing and presentation, allograft rejection, and complement and coagulation cascades (Figure 4C and Table S5). Downregulated genes were related to cytokine interaction, cell signaling pathways (e.g., PI3K-Akt, AGE-RAGE, Rap1, Hippo, and TGF-β), focal adhesion, complement and coagulation cascades, and ECM–receptor interaction (Figure 4D and Table S5). Lastly, we performed WebCSEA analysis to get a better insight into the possible origin of EV transcripts, based on the tissue cell-specific signatures. The results suggested that DEGs at 12 h after reperfusion showed various immune cell and organ tissue cell-type signatures in the overall organ system (Figure 4E). Since we analyzed plasma samples from heart transplant recipients, we specifically investigated whether the DEGs were related to heart tissue. The results suggested that DEGs at 12 h after reperfusion showed cell-type-specific signatures associated with fibroblasts, stromal cells, smooth muscle cells, pericytes, mesenchymal stem cells, epicardial adipocytes, endocardial cells, endothelial cells, and Schwann cells in the heart, based on the Tabula Sapiens database [22] (Figure 4F and Table S6). Although Tabula Sapiens contains hepatocytes in the heart tissue cell signatures, we excluded hepatocytes from our results due to their irrelevance to heart histology. In addition, with detailed analysis by separating upregulated and downregulated genes, we observed heart-related immune cells were mainly upregulated and cell structure component genes were downregulated (Figure S3).

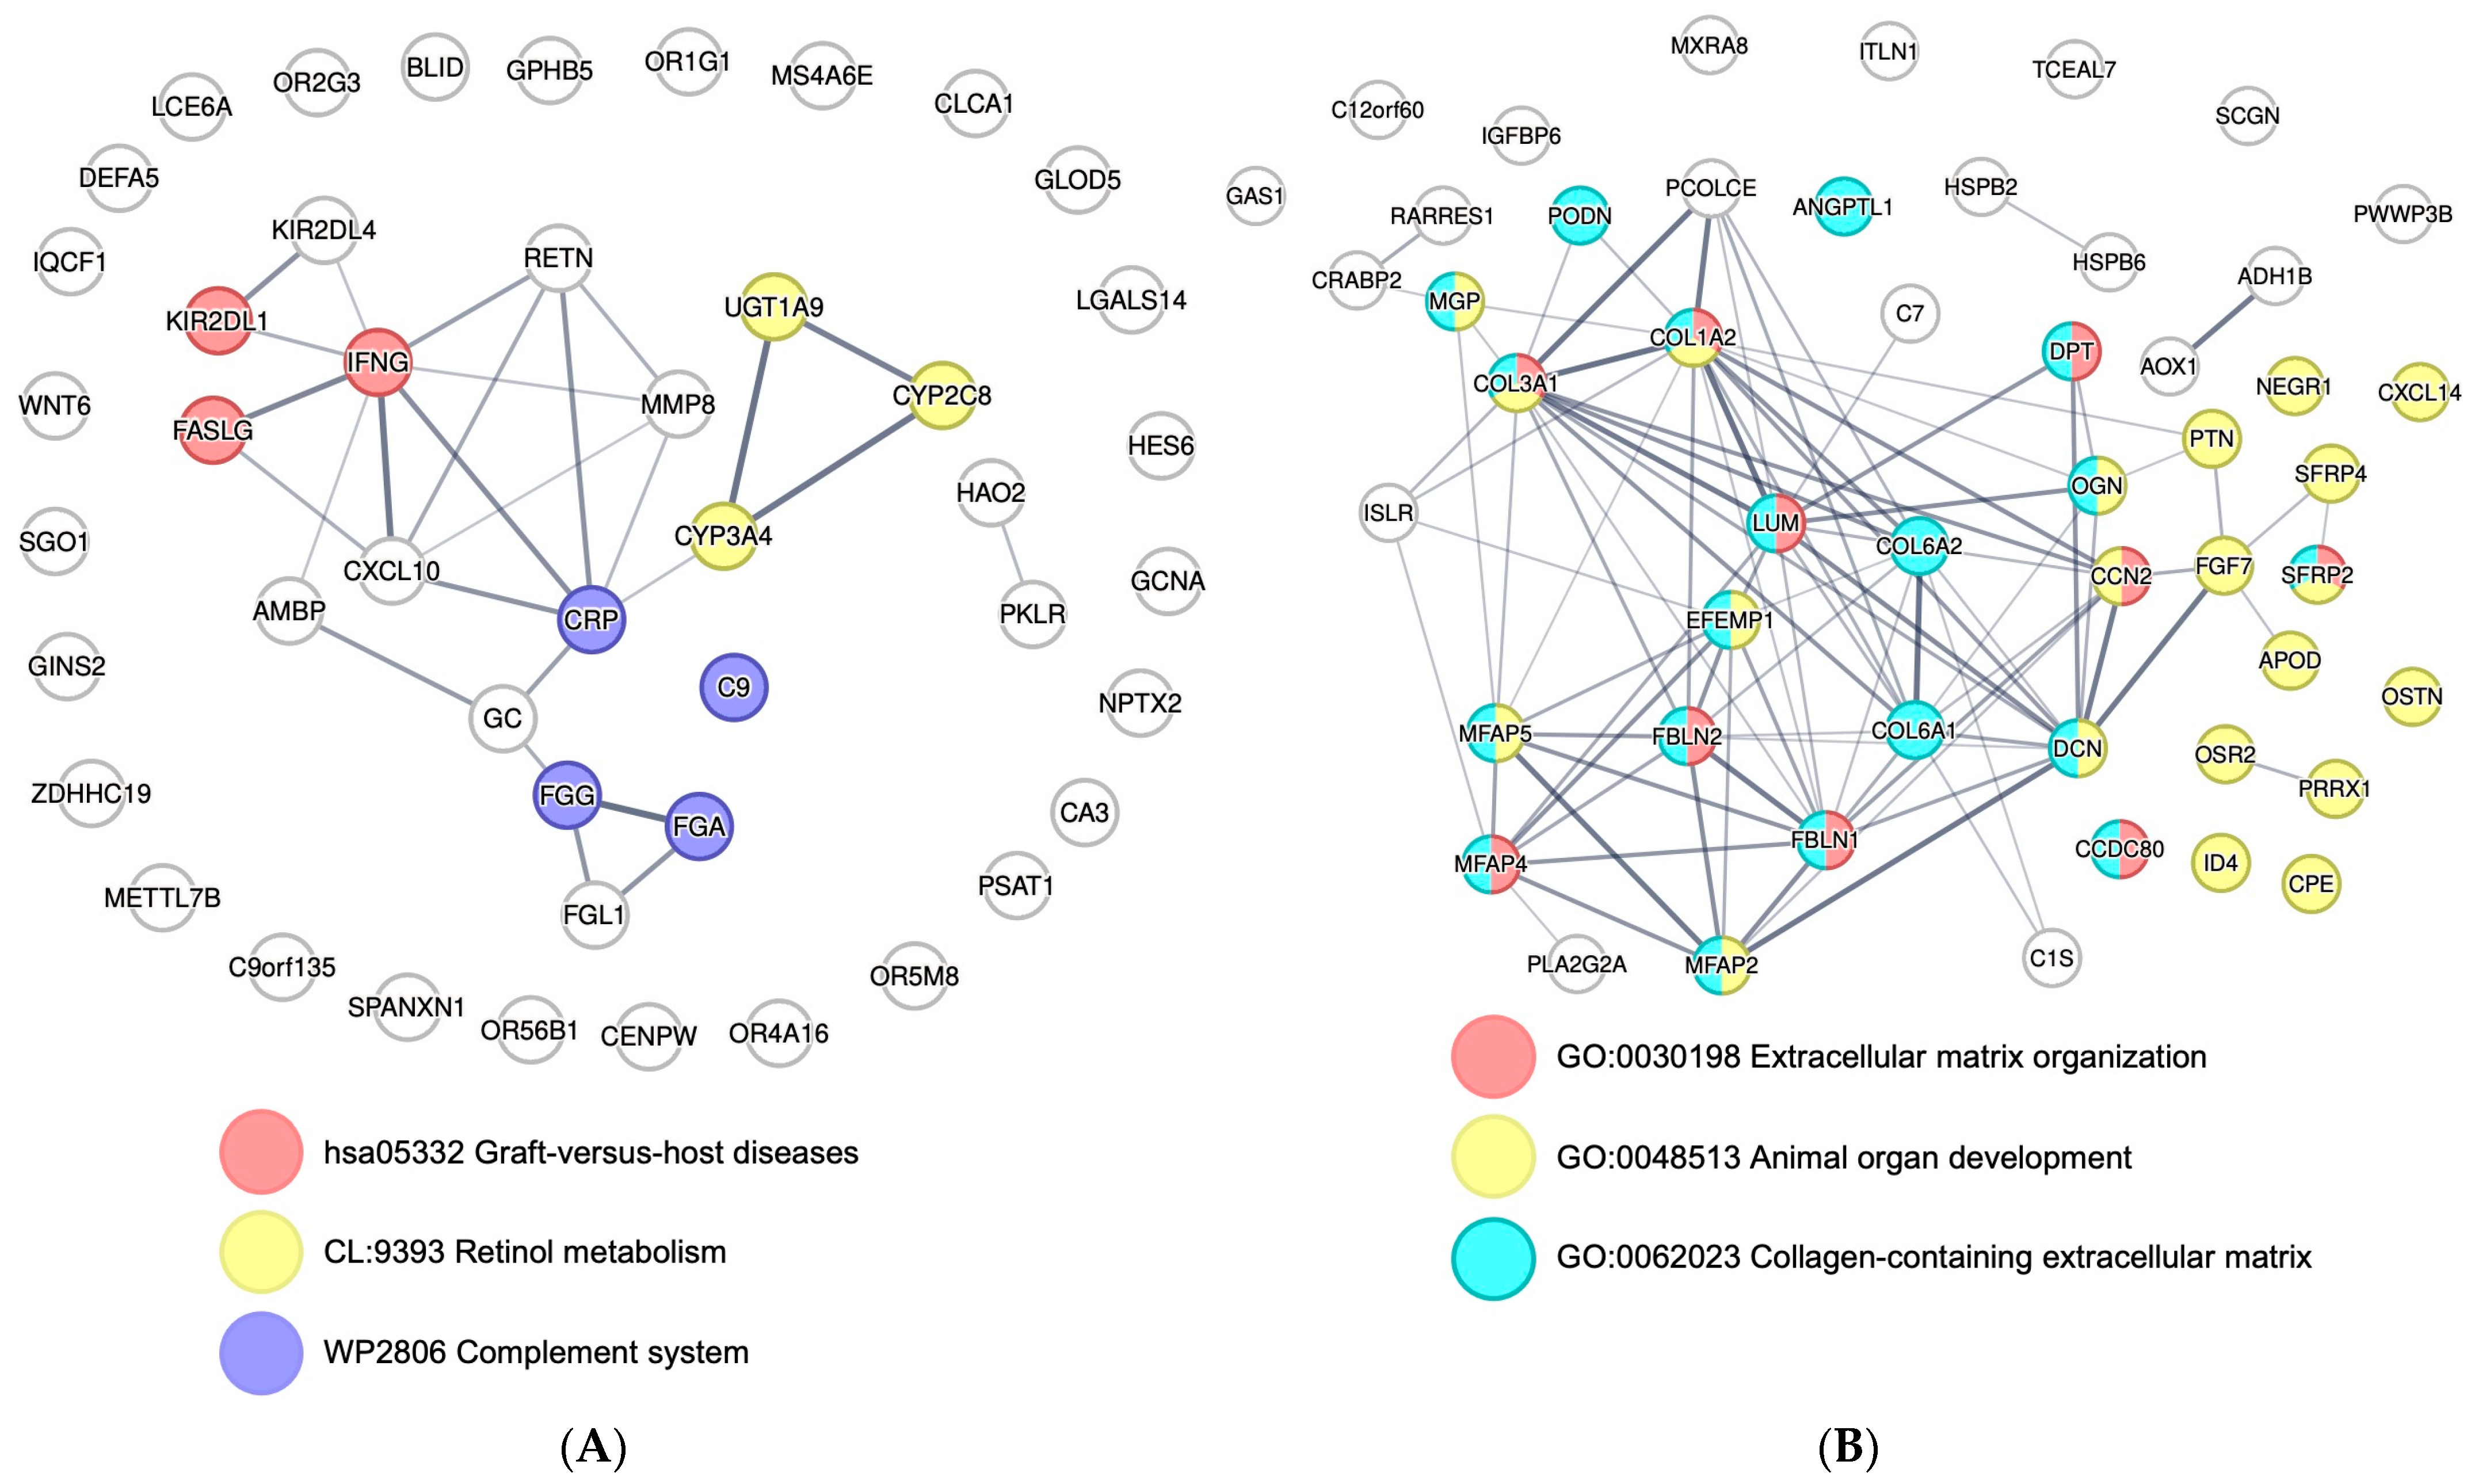
3.5. Post-Reperfusion EVs Carry More Adaptive Immunity-Related Genes but Less Extracellular Matrix Component Protein-Coding Genes

Furthermore, we hypothesized that the genes with higher log-fold changes may represent the most significant biological functions related to those genes. Therefore, we filtered the DEGs based on the log fold-change and selected 50 upregulated and 50 downregulated genes for STRING analysis, rather than focusing on genes related to the most significantly enriched GO and pathway terms to avoid biased interpretation of established gene networks. STRING analysis was performed to explore the protein–protein network of DEGs, as well as relevant biological annotations of these genes. The most upregulated 50 genes were associated with retinol metabolism, complement system, and graft-versus-host disease, sharing a gene set related to allograft rejection (Figure 5A). Downregulated genes showed well-established protein–protein networks, and the abundantly enriched biological annotations were related to extracellular matrix organization, including collagen-containing extracellular matrix, and organ development (Figure 5B).

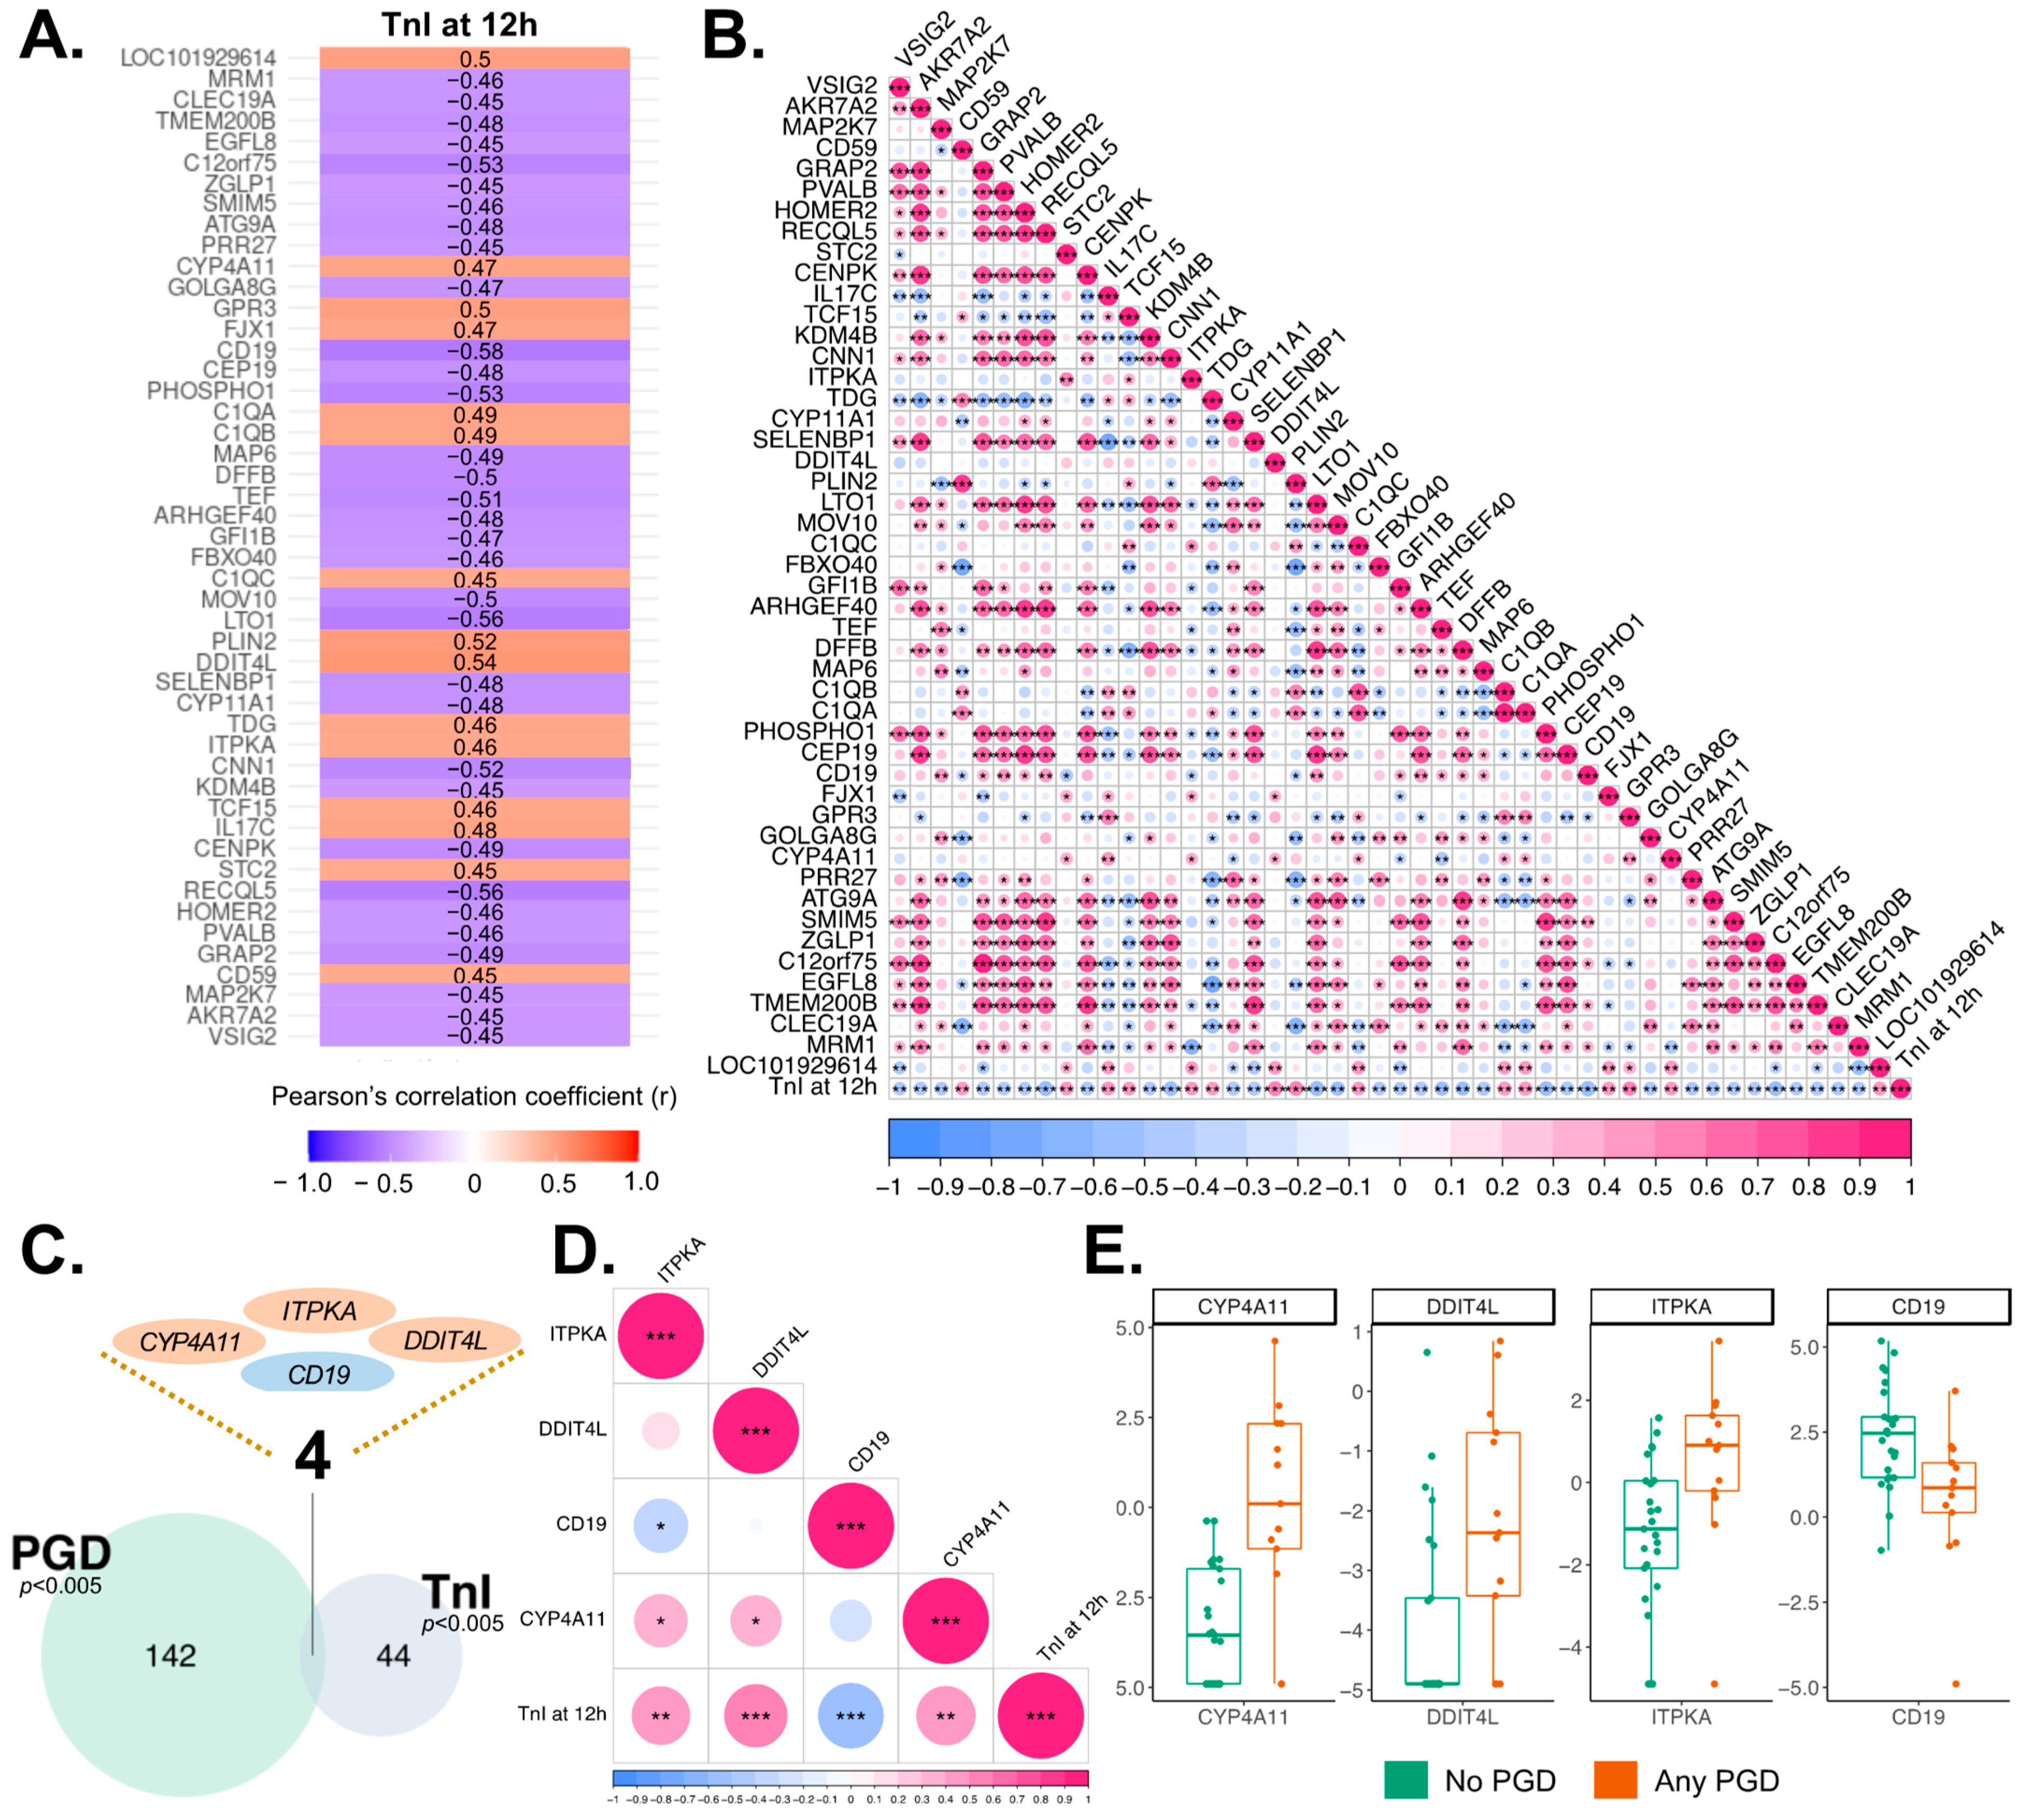
3.6. Correlation of EV Transcriptome with Cardiomyocyte Injury

Our previous study has reported that plasma high-sensitivity troponins are highest at 12 h in recipients who had severe left ventricular PGD [23]. Therefore, we investigated all EV transcripts expressed at 12 h to identify significant correlations between the EV transcriptome and cardiomyocyte injury, defined by 12 h plasma level of high-sensitivity TnI. We found that 48 protein-coding genes were significantly correlated with myocardial injury (Figure 6A and Table 2), and they exhibited correlations in their expression with each other (Figure 6B). In addition, of the 48 genes correlated to TnI plasma levels, 8 were also found among the DEG after reperfusion, suggesting their expression patterns are significantly affected after reperfusion (Table S7).

3.7. Association of EV Transcriptome and Outcomes after Heart Transplantation

We next compared the plasma EV transcriptome of recipients without PGD (66%) with those who developed PGD of any grade (34%). The result revealed that 3194 protein-coding genes were related to the higher incidence of PGD when applying a p-value of less than 0.05. Generally, these genes that showed correlations with PGD (p < 0.05, n = 3194) were associated with lipid metabolism, acute-phase response, glucuronidation, TNF signaling pathway, and complement and coagulation cascades (Figure S4A,B). We found 146 protein-coding genes when using a more stringent p-value cut-off (p-value < 0.005) (Table 3) and 30 protein-coding genes when applying a p-value of less than 0.001. Most of these 30 genes were upregulated compared to recipients without PGD (Figure S4C). To investigate whether the gene expression of these 146 genes was affected by reperfusion, we compared the genes with 1317 DEGs at 12 h after reperfusion. We found 25 genes that were also present in the DEGs after reperfusion, and their biological functions were related to retinol metabolism, amyloidosis, bone marrow cells, plasma cells, liver, and digestive gland (Table S7). However, no significant differences in donor characteristics were observed between the recipient PGD groups (Table S8). Given that cardiomyocyte damage is a prominent manifestation of PGD after HTx, we cross-checked our correlation analyses, and identified four protein-coding genes (ITPKA, DDIT4L, CD19, and CYP4A11) that were consistently observed (Figure 6C and Table 4). These genes showed correlations in expression among each other (Figure 6D) and three of them showed upregulation in the recipient group with PGD after HTx (Figure 6E). Although reperfusion injury may have a greater impact on the early outcome (i.e., PGD) than on long-term outcomes such as acute rejection, we investigated the potential relationship between genes related to reperfusion injury and biopsy-proven acute rejection. We examined differences in the EV transcriptome at 12 h based on the recipients’ IV-treatment history within 30 days after HTx and biopsy-proven AR diagnosis history within the first year after HTx. Among the 38 recipients, 9 received IV treatment within 30 days after HTx, while 27 did not (2 not available). Additionally, 24 recipients developed any biopsy-proven AR within the first year after HTx, and 14 recipients remained stable. We found 100 genes that showed significantly different expression levels based on the history of IV treatment within 30 days and another 100 genes associated with biopsy-proven AR within the first year, respectively (p < 0.01). Moreover, 31 and 42 genes were found in each analysis when applying a p-value cutoff of 0.005 (Tables S9 and S10). However, we did not find any significantly enriched pathways and gene ontology terms using biopsy-proven AR prediction genes.

4. Discussion

In this study, we provide a detailed analysis of the transcriptomic landscape of plasma-derived EVs following IRI in human HTx. While transcriptomic signatures of IRI in experimental settings have been well established using bulk RNAseq, the whole transcriptomic profile of plasma EVs in clinical settings has been unexplored. We uncovered 1317 EV transcripts that were significantly altered during heart transplant IRI, including upregulation of genes related to immune activation and metabolism mediated by cytochrome P450 (CYP) and downregulation of genes associated with cell proliferation, extracellular matrix, smooth muscle contraction, and TGF-β signaling pathway. In addition, EV transcripts were linked to cardiomyocyte injury and PGD as 48 protein-coding EV transcripts were associated with higher levels of the cardiomyocyte injury marker TnI and 30 EV genes with the development of PGD after HTx. Importantly, four transcripts—ITPKA, DDIT4L, CD19, and CYP4A11—were closely associated with both cardiomyocyte injury and PGD, indicating that these protein-coding genes may have important roles in regulating heart transplant IRI.
A recent systematic review of bulk RNA analyses of myocardial tissue suggests that the transcriptomic hallmarks of IRI include increased mRNA expressions related to response to stress, cell proliferation, inflammatory response, and cell pathway (i.e., TNF, NF-kB, IL-17, MAPK, TLR, and NOD-like signaling pathways), while downregulated genes were associated with cytoskeletal structures, cell development, cell survival, ion channels, and cAMP signaling pathway [24]. Our findings showed that recipient plasma EV transcripts were associated with upregulated genes related to inflammation, T-cell chemotaxis, and cytokine interactions, while downregulated genes were linked to ion transport and extracellular matrix (Table S11). Interestingly, we found that circulating EVs contain gene transcripts related to allograft rejection already at 12 h after reperfusion, along with transcripts associated with cell proliferation and metabolism. Moreover, WebCSEA analysis focused on the heart tissue database suggested that DEGs at 12 h after reperfusion were related to a broad range of tissue structural components, such as fibroblasts, stromal cells, smooth muscle cells, pericytes, epicardial adipocytes, and others related to heart tissue. Nevertheless, our pathway analyses and tissue-specific cell type enrichment analyses suggested that circulating EVs after reperfusion may be involved in or reflect the regulation of cellular structure, hence affecting tissue remodeling and repair in the cardiovascular system after reperfusion. Collectively, our results may help to understand how the cellular structure disruption and inflammation after IRI contribute to the development of PGD after HTx.
Upon reperfusion of the heart transplant, oxygen radicals may cause tissue damage by interacting with polyunsaturated fatty acids and by the formation of lipid peroxides and hydroperoxides. Oxygen free radicals induce the release of platelet-activating factors by endothelial cells and, thereby, aggravate neutrophil-mediated immune responses. Consequently, elevated proinflammatory signals and activation of downstream signaling pathways may ultimately result in the development of parenchymal fibrosis and decreased cardiac function. Given that, we speculate that lipid metabolism and lipid-metabolism-induced stress are key factors for understanding the mechanism of IRI. For example, polyunsaturated fatty acids such as arachidonic acid and linoleic acid are well-known to participate in the induction of endothelial dysfunction, vascular tone, calcium mobilization, and oxidative stress [24,25,26,27,28,29]. Especially, arachidonic acid is an essential fatty acid and precursor of prostaglandins, thromboxanes, and leukotrienes, which are important players in endothelial dysfunction [30]. Of the four genes that showed a moderate correlation with both cardiomyocyte injury and PGD, CYP4A11 has been shown to have a role in lipid metabolism, reactive-oxygen-species-induced lipid peroxidation, and inflammation in non-alcoholic fatty liver disease [31]. There is growing evidence suggesting that CYP enzymes play a pivotal role in the cardiovascular system [32]; for example, polymorphisms in CYP4A11 have associations with coronary artery diseases [33]. Furthermore, DDIT4L, another one of the four genes highlighted in the results, promotes cardiomyocyte cell death by inhibiting the mTOR signaling pathway under hypoxia/reoxygenation setting [34] and increases oxidized LDL-induced cytotoxicity [35], which may indicate the relation between oxidative stress and lipid metabolism. Furthermore, DDIT4L expression is reported in pathological cardiac hypertrophy, and overexpression of DDIT4L increases autophagy and causes mild systolic dysfunction [36].
Next, we focused on the calcium signaling pathway. During IRI, calcium overload can cause cardiac systolic dysfunction, because calcium ions play an essential role in cardiac action potential [37]. We found both ITPKA and CD19 may participate in the regulation of calcium transport in cardiomyocytes and the PI3K signaling pathway. Although CD19 is well known as a marker for B cells, we focused on the role of CD19 and B-cell receptor pathway cascades that participate in calcium homeostasis [38]. BCR-induced calcium transport has a connection with G-protein-coupled receptors, which are closely related to cardiovascular health [39], and enhanced BCR signaling under deficiency of CD19 is related to PI3K activity [40], and changes in myocardial B-cell population may affect myocardial growth and contractility [41]. Downregulation of calcium signaling pathway-related transcripts may result in impaired cardiac contractibility and remodeling due to dysregulation of excitation–contraction coupling [42]. Altogether, an imbalance in calcium homeostasis and activation of downstream signaling pathways may significantly affect the outcome of a heart transplant by altering the metabolism and result in mitochondrial dysfunction, inflammation, and reduced heart function.
One limitation of this study is the relatively small cohort size of 38 recipients. Additionally, validation of RNAseq data by qRT-PCR was not performed due to a limited volume of samples. Revalidation of the data in a larger cohort using both RNAseq and qPCR could further enhance our understanding of the mechanistic connection between EV and IRI and the role of EV in HTx. Moreover, we cannot differentiate transplantation-associated IRI from normal IRI, as well as alloimmune response reflected in circulating EVs after reperfusion. In addition, comparing blood samples from the coronary sinus and peripheral blood may provide enhanced specificity of EV analysis related to cardiac conditions. However, we did not consider this when initiating the original randomized control trial. Future studies using external cohorts and comparisons with samples taken from recipients before transplantation and during ischemia may enable us to differentiate the effects of ischemia-induced and reperfusion-induced injuries on the EV transcriptome.

5. Conclusions

In conclusion, we provide a comprehensive insight into the whole transcriptomic profile of plasma EVs from heart transplant recipients after reperfusion. In addition, we highlight four transcripts that EVs carry after reperfusion and suggest their clinical relevance both in cardiomyocyte injury and in PGD after HTx. Altogether, our findings suggest that EV may provide important information about heart transplant IRI. In addition to our analysis focused on protein-coding genes in plasma EVs, investigating the expression profiles of long non-coding RNAs, pseudogenes, and microRNAs may provide a deeper understanding of the EV biomarker capabilities or intricate roles of plasma EVs as gene expression modulators in IRI. Additional in-depth studies should be carried out to further elucidate the possible tissue sources of the circulating EVs and their roles in IRI and allograft damage. Ultimately, the profiling of EV transcriptome may be utilized as a novel approach for the development of non-invasive biomarkers for PGD after HTx.

Supplementary Materials

The following supporting information can be downloaded at https://www.mdpi.com/article/10.3390/genes14112101/s1, Figure S1: Comparison of enriched biological terms for differentially expressed genes (DEGs) and high-power discrimination genes (HPDs). Figure S2: Scatter plots of REVIGO-based summarized gene ontology terms using differentially expressed genes found in 12 h EV samples when compared to 0 h. Figure S3: Heart-specific cell signatures related to upregulated and downregulated DEGs at 12 h after reperfusion. Figure S4: Biological functions and pathways enriched by statistically significant genes that are associated with primary graft dysfunction after heart transplantation. Table S1: RNAseq data including raw counts and normalized counts data. Table S2: The 1317 DEGs at 12 h after reperfusion compared to before reperfusion. Table S3: ROC analysis of 1317 DEGs at 12 h after reperfusion. Table S4: 357 DEGs with a minimum specificity and sensitivity of 80%. Table S5: A list of enriched KEGG pathways using 1317 DEGs at 12 h after reperfusion. Table S6: WebCSEA analysis of DEGs focused on heart tissue. Table S7: Correlation marker candidates commonly observed in DEGs at 12 h after reperfusion. Table S8: Donor clinical characteristics. Table S9: 100 genes that showed significant differences in recipients based on IV treatment history within 30 days. Table S10: 100 genes that showed significant differences in recipients based on any biopsy-proven acute rejection history. Table S11: A list of 21 genes repetitively observed at 12 h and previously known transcriptomic hallmarks of IRI.

Author Contributions

Conceptualization, S.J. and K.L.; data curation, S.J. and S.W.; formal analysis, S.J. and K.D.; funding acquisition, K.L.; investigation, S.J., R.K., S.W. and E.H.; methodology, S.J. and M.P.; software, S.J. and K.D.; supervision, K.L.; visualization, S.J. and K.D.; writing—original draft, S.J. and S.W.; writing—review and editing, S.J., R.K., S.W., K.D., M.P., S.S., A.I.N. and K.L. All authors have read and agreed to the published version of the manuscript.

Funding

This study was funded by grants from the Academy of Finland, Jane and Aatos Erkko Foundation, Sigrid Juselius Foundation, Helsinki University Hospital, Finnish Cultural Foundation, Finnish Foundation for Cardiovascular Research, Emil Aaltonen Foundation, Research and Science Foundation of Farmos, Aarne Koskelo Foundation, Paavo Ilmari Ahvenainen Foundation, Sirpa and Markku Jalkanen Foundation, Finnish Transplantation Society, Finnish Society of Angiology, Paulo Foundation, Päivikki and Sakari Sohlberg Foundation, Maud Kuistila Foundation, Ida Montin Foundation, and University of Helsinki.

Institutional Review Board Statement

The study was conducted in accordance with the Declaration of Helsinki and approved by the Ethics Committee of Helsinki University Hospital (358/13/03/02/2009).

Informed Consent Statement

Informed consent was obtained from all participants involved in the study.

Data Availability Statement

The data of this study are not publicly available due to privacy and ethical restrictions. However, the RNA-seq raw counts and normalized data are provided in the Supplementary Materials.

Acknowledgments

We would like to thank Karina Barreiro, Ileana Quintero, Rosabella Hartman, and the EV Core of the University of Helsinki and the EM unit for their help with nanoparticle tracking analysis and electron microscopy. Library preparation, sequencing, and primary analysis were performed by the FIMM Genomics NGS Sequencing Unit at the University of Helsinki supported by HiLIFE and Biocenter Finland. Open access funding provided by University of Helsinki. We are grateful to Eeva Rouvinen for her assistance in collecting and skilful processing of the samples.

Conflicts of Interest

The authors declare no conflict of interest.

References

  1. Tang, Q.; Dong, C.; Sun, Q. Immune Response Associated with Ischemia and Reperfusion Injury during Organ Transplantation. Inflamm. Res. 2022, 71, 1463–1476. [Google Scholar] [CrossRef] [PubMed]
  2. Fernández, A.R.; Sánchez-Tarjuelo, R.; Cravedi, P.; Ochando, J.; López-Hoyos, M. Review: Ischemia Reperfusion Injury—A Translational Perspective in Organ Transplantation. Int. J. Mol. Sci. 2020, 21, 8549. [Google Scholar] [CrossRef]
  3. Valadi, H.; Ekström, K.; Bossios, A.; Sjöstrand, M.; Lee, J.J.; Lötvall, J.O. Exosome-Mediated Transfer of MRNAs and MicroRNAs Is a Novel Mechanism of Genetic Exchange between Cells. Nat. Cell Biol. 2007, 9, 654–659. [Google Scholar] [CrossRef]
  4. Ravichandran, R.; Bansal, S.; Rahman, M.; Sureshbabu, A.; Sankpal, N.; Fleming, T.; Bharat, A.; Mohanakumar, T. Extracellular Vesicles Mediate Immune Responses to Tissue-Associated Self-Antigens: Role in Solid Organ Transplantations. Front. Immunol. 2022, 13, 861583. [Google Scholar] [CrossRef]
  5. Ge, X.; Meng, Q.; Wei, L.; Liu, J.; Li, M.; Liang, X.; Lin, F.; Zhang, Y.; Li, Y.; Liu, Z.; et al. Myocardial Ischemia-reperfusion Induced Cardiac Extracellular Vesicles Harbour Proinflammatory Features and Aggravate Heart Injury. J. Extracell. Vesicles 2021, 10, e12072. [Google Scholar] [CrossRef] [PubMed]
  6. Tuuminen, R.; Syrjälä, S.; Krebs, R.; Keränen, M.A.I.; Koli, K.; Abo-Ramadan, U.; Neuvonen, P.J.; Tikkanen, J.M.; Nykänen, A.I.; Lemström, K.B. Donor Simvastatin Treatment Abolishes Rat Cardiac Allograft Ischemia/Reperfusion Injury and Chronic Rejection Through Microvascular Protection. Circulation 2011, 124, 1138–1150. [Google Scholar] [CrossRef] [PubMed]
  7. Nykänen, A.I.; Holmström, E.J.; Tuuminen, R.; Krebs, R.; Dhaygude, K.; Kankainen, M.; Jokinen, J.J.; Lommi, J.; Helanterä, I.; Räisänen-Sokolowski, A.; et al. Donor Simvastatin Treatment in Heart Transplantation. Circulation 2019, 140, 627–640. [Google Scholar] [CrossRef]
  8. Kobashigawa, J.; Zuckermann, A.; Macdonald, P.; Leprince, P.; Esmailian, F.; Luu, M.; Mancini, D.; Patel, J.; Razi, R.; Reichenspurner, H.; et al. Report from a Consensus Conference on Primary Graft Dysfunction after Cardiac Transplantation. J. Heart Lung Transplant. 2014, 33, 327–340. [Google Scholar] [CrossRef] [PubMed]
  9. Puhka, M.; Nordberg, M.-E.; Valkonen, S.; Rannikko, A.; Kallioniemi, O.; Siljander, P.; Af Hällström, T.M. KeepEX, a Simple Dilution Protocol for Improving Extracellular Vesicle Yields from Urine. Eur. J. Pharm. Sci. 2017, 98, 30–39. [Google Scholar] [CrossRef]
  10. Bolger, A.M.; Lohse, M.; Usadel, B. Trimmomatic: A Flexible Trimmer for Illumina Sequence Data. Bioinformatics 2014, 30, 2114–2120. [Google Scholar] [CrossRef]
  11. Dobin, A.; Davis, C.A.; Schlesinger, F.; Drenkow, J.; Zaleski, C.; Jha, S.; Batut, P.; Chaisson, M.; Gingeras, T.R. STAR: Ultrafast Universal RNA-Seq Aligner. Bioinformatics 2013, 29, 15–21. [Google Scholar] [CrossRef]
  12. Liao, Y.; Smyth, G.K.; Shi, W. The Subread Aligner: Fast, Accurate and Scalable Read Mapping by Seed-and-Vote. Nucleic Acids Res. 2013, 41, e108. [Google Scholar] [CrossRef]
  13. Thévenot, E.A.; Roux, A.; Xu, Y.; Ezan, E.; Junot, C. Analysis of the Human Adult Urinary Metabolome Variations with Age, Body Mass Index, and Gender by Implementing a Comprehensive Workflow for Univariate and OPLS Statistical Analyses. J. Proteome Res. 2015, 14, 3322–3335. [Google Scholar] [CrossRef] [PubMed]
  14. Robinson, M.D.; McCarthy, D.J.; Smyth, G.K. EdgeR: A Bioconductor Package for Differential Expression Analysis of Digital Gene Expression Data. Bioinformatics 2010, 26, 139–140. [Google Scholar] [CrossRef] [PubMed]
  15. Kolde, R. Pheatmap: Pretty Heatmaps. Available online: https://CRAN.R-project.org/package=pheatmap (accessed on 11 August 2022).
  16. Yu, G.; Wang, L.-G.; Han, Y.; He, Q.-Y. ClusterProfiler: An R Package for Comparing Biological Themes Among Gene Clusters. OMICS 2012, 16, 284–287. [Google Scholar] [CrossRef] [PubMed]
  17. Supek, F.; Bošnjak, M.; Škunca, N.; Šmuc, T. REVIGO Summarizes and Visualizes Long Lists of Gene Ontology Terms. PLoS ONE 2011, 6, e21800. [Google Scholar] [CrossRef] [PubMed]
  18. Sayols, S. Rrvgo: A Bioconductor Package for Interpreting Lists of Gene Ontology Terms. MicroPubl. Biol. 2023, 2023. [Google Scholar] [CrossRef]
  19. Szklarczyk, D.; Gable, A.L.; Lyon, D.; Junge, A.; Wyder, S.; Huerta-Cepas, J.; Simonovic, M.; Doncheva, N.T.; Morris, J.H.; Bork, P.; et al. STRING V11: Protein–Protein Association Networks with Increased Coverage, Supporting Functional Discovery in Genome-Wide Experimental Datasets. Nucleic Acids Res. 2019, 47, D607–D613. [Google Scholar] [CrossRef]
  20. Dai, Y.; Hu, R.; Liu, A.; Cho, K.S.; Manuel, A.M.; Li, X.; Dong, X.; Jia, P.; Zhao, Z. WebCSEA: Web-Based Cell-Type-Specific Enrichment Analysis of Genes. Nucleic Acids Res. 2022, 50, W782–W790. [Google Scholar] [CrossRef] [PubMed]
  21. Schlicker, A.; Domingues, F.S.; Rahnenführer, J.; Lengauer, T. A New Measure for Functional Similarity of Gene Products Based on Gene Ontology. BMC Bioinform. 2006, 7, 302. [Google Scholar] [CrossRef]
  22. Jones, R.C.; Karkanias, J.; Krasnow, M.A.; Pisco, A.O.; Quake, S.R.; Salzman, J.; Yosef, N.; Bulthaup, B.; Brown, P.; Harper, W.; et al. The Tabula Sapiens: A Multiple-Organ, Single-Cell Transcriptomic Atlas of Humans. Science 2022, 376, eabl4896. [Google Scholar] [CrossRef]
  23. Holmström, E.J.; Syrjälä, S.O.; Dhaygude, K.; Tuuminen, R.; Krebs, R.; Nykänen, A.; Lemström, K.B. Severe Primary Graft Dysfunction of the Heart Transplant Is Associated with Increased Plasma and Intragraft Proinflammatory Cytokine Expression. J. Heart Lung Transplant. 2023, 42, 807–818. [Google Scholar] [CrossRef]
  24. Movahed, M.; Brockie, S.; Hong, J.; Fehlings, M.G. Transcriptomic Hallmarks of Ischemia-Reperfusion Injury. Cells 2021, 10, 1838. [Google Scholar] [CrossRef] [PubMed]
  25. Verma, S.; Fedak, P.W.M.; Weisel, R.D.; Butany, J.; Rao, V.; Maitland, A.; Li, R.-K.; Dhillon, B.; Yau, T.M. Fundamentals of Reperfusion Injury for the Clinical Cardiologist. Circulation 2002, 105, 2332–2336. [Google Scholar] [CrossRef] [PubMed]
  26. Ghosh, A.; Gao, L.; Thakur, A.; Siu, P.M.; Lai, C.W.K. Role of Free Fatty Acids in Endothelial Dysfunction. J. Biomed. Sci. 2017, 24, 50. [Google Scholar] [CrossRef] [PubMed]
  27. Kim, F.; Tysseling, K.A.; Rice, J.; Pham, M.; Haji, L.; Gallis, B.M.; Baas, A.S.; Paramsothy, P.; Giachelli, C.M.; Corson, M.A.; et al. Free Fatty Acid Impairment of Nitric Oxide Production in Endothelial Cells Is Mediated by IKKβ. Arterioscler. Thromb. Vasc. Biol. 2005, 25, 989–994. [Google Scholar] [CrossRef]
  28. Zhang, C.; He, M.; Ni, L.; He, K.; Su, K.; Deng, Y.; Li, Y.; Xia, H. The Role of Arachidonic Acid Metabolism in Myocardial Ischemia–Reperfusion Injury. Cell Biochem. Biophys. 2020, 78, 255–265. [Google Scholar] [CrossRef]
  29. Chauhan, P.K.; Sowdhamini, R. Transcriptome Data Analysis of Primary Cardiomyopathies Reveals Perturbations in Arachidonic Acid Metabolism. Front. Cardiovasc. Med. 2023, 10, 1111019. [Google Scholar] [CrossRef]
  30. Zhou, Y.; Khan, H.; Xiao, J.; Cheang, W.S. Effects of Arachidonic Acid Metabolites on Cardiovascular Health and Disease. Int. J. Mol. Sci. 2021, 22, 12029. [Google Scholar] [CrossRef]
  31. Gao, H.; Cao, Y.; Xia, H.; Zhu, X.; Jin, Y. CYP4A11 Is Involved in the Development of Nonalcoholic Fatty Liver Disease via ROS-induced Lipid Peroxidation and Inflammation. Int. J. Mol. Med. 2020, 45, 1121–1129. [Google Scholar] [CrossRef] [PubMed]
  32. Elbekai, R.H.; El-Kadi, A.O.S. Cytochrome P450 Enzymes: Central Players in Cardiovascular Health and Disease. Pharmacol. Ther. 2006, 112, 564–587. [Google Scholar] [CrossRef]
  33. Sirotina, S.; Ponomarenko, I.; Kharchenko, A.; Bykanova, M.; Bocharova, A.; Vagaytseva, K.; Stepanov, V.; Churnosov, M.; Solodilova, M.; Polonikov, A. A Novel Polymorphism in the Promoter of the CYP4A11 Gene Is Associated with Susceptibility to Coronary Artery Disease. Dis. Markers 2018, 2018, 5812802. [Google Scholar] [CrossRef]
  34. Hernández, G.; Lal, H.; Fidalgo, M.; Guerrero, A.; Zalvide, J.; Force, T.; Pombo, C.M. A Novel Cardioprotective P38-MAPK/MTOR Pathway. Exp. Cell Res. 2011, 317, 2938–2949. [Google Scholar] [CrossRef]
  35. Cuaz-Pérolin, C.; Furman, C.; Larigauderie, G.; Legedz, L.; Lasselin, C.; Copin, C.; Jaye, M.; Searfoss, G.; Yu, K.T.; Duverger, N.; et al. REDD2 Gene Is Upregulated by Modified LDL or Hypoxia and Mediates Human Macrophage Cell Death. Arterioscler. Thromb. Vasc. Biol. 2004, 24, 1830–1835. [Google Scholar] [CrossRef]
  36. Simonson, B.; Subramanya, V.; Chan, M.C.; Zhang, A.; Franchino, H.; Ottaviano, F.; Mishra, M.K.; Knight, A.C.; Hunt, D.; Ghiran, I.; et al. DDiT4L Promotes Autophagy and Inhibits Pathological Cardiac Hypertrophy in Response to Stress. Sci. Signal. 2017, 10, eaaf5967. [Google Scholar] [CrossRef] [PubMed]
  37. Fearnley, C.J.; Roderick, H.L.; Bootman, M.D. Calcium Signaling in Cardiac Myocytes. Cold Spring Harb. Perspect. Biol. 2011, 3, a004242. [Google Scholar] [CrossRef] [PubMed]
  38. Buhl, A.M.; Pleiman, C.M.; Rickert, R.C.; Cambier, J.C. Qualitative Regulation of B Cell Antigen Receptor Signaling by CD19: Selective Requirement for PI3-Kinase Activation, Inositol-1,4,5-Trisphosphate Production and Ca2+ Mobilization. J. Exp. Med. 1997, 186, 1897–1910. [Google Scholar] [CrossRef] [PubMed]
  39. Li, Y.; Li, B.; Chen, W.-D.; Wang, Y.-D. Role of G-Protein Coupled Receptors in Cardiovascular Diseases. Front. Cardiovasc. Med. 2023, 10, 1130312. [Google Scholar] [CrossRef]
  40. Xu, Y.; Fairfax, K.; Light, A.; Huntington, N.D.; Tarlinton, D.M. CD19 Differentially Regulates BCR Signalling through the Recruitment of PI3K. Autoimmunity 2014, 47, 430–437. [Google Scholar] [CrossRef] [PubMed]
  41. Adamo, L.; Rocha-Resende, C.; Lin, C.-Y.; Evans, S.; Williams, J.; Dun, H.; Li, W.; Mpoy, C.; Andhey, P.S.; Rogers, B.E.; et al. Myocardial B Cells Are a Subset of Circulating Lymphocytes with Delayed Transit through the Heart. JCI Insight 2020, 5, e134700. [Google Scholar] [CrossRef]
  42. Gorski, P.A.; Ceholski, D.K.; Hajjar, R.J. Altered Myocardial Calcium Cycling and Energetics in Heart Failure—A Rational Approach for Disease Treatment. Cell Metab. 2015, 21, 183–194. [Google Scholar] [CrossRef] [PubMed]
Figure 1. CONSORT-type workflow chart of the study. Plasma EV transcriptomes before reperfusion and at 12 h after reperfusion of the heart transplant were compared with each other. Only the EV transcriptome of plasma samples taken at 12 h after reperfusion was correlated with the clinical data of the heart transplant recipient. Figure created with BioRender.com (accessed on 14 November 2023).
Genes 14 02101 g001
Figure 2. Characterization of isolated EVs. Transmission electron microscopy and nanoparticle tracking analysis were performed to confirm and examine the presence, morphology, size distribution, and concentration of recipient plasma EVs. (A) Transmission electron microscopy of plasma EVs at 0 h and (B) at 12 h after reperfusion of the heart. Arrows indicate the typical cup-shaped morphology of EVs. (C) Concentration (particles/mL) and (D) size distribution data were obtained from nanoparticle measurement equipment (NanoSight and ZetaView); the dashed line in each plot was plotted by geom_smooth function in R, using the LOESS method to represent the trend of concentration values throughout the samples according to the size of the samples.
Genes 14 02101 g002
Figure 3. Differentially expressed genes at 12 h post-reperfusion compared to pre-reperfusion. (A) Unsupervised principal component analysis showed that different timepoint (blue, 0 h; red, 12 h) samples have distinct EV transcriptomic profiles. (B) Hierarchical clustering analysis confirmed clear differences in the gene expression patterns between 0 h and 12 h groups. (red, upregulated; green, downregulated) (C) The number of differentially expressed genes at 12 h after reperfusion is illustrated in a pie chart format.
Genes 14 02101 g003
Figure 4. The biological relevance of differentially expressed genes found at 12 h post-reperfusion using pathway enrichment analyses. The 1317 differentially expressed genes (DEGs) were analyzed to explore their biological functions by enriching relevant terms with different databases. Focusing on biological processes, gene ontology enrichment revealed terms associated with (A) upregulated DEGs and (B) downregulated DEGs. Enriched pathways based on the KEGG database suggested relevant pathways of (C) upregulated and (D) downregulated DEGs. (E) WebCSEA results to visualize overall organ system-specific cell signatures, and (F) WebCSEA results to visualize heart tissue cell-specific signatures. Since our patient cohort consists exclusively of cardiac transplant recipients, we focused primarily on heart-related genes.
Genes 14 02101 g004
Figure 5. Protein network analysis of the top 50 most significantly upregulated and downregulated genes at 12 h post-reperfusion. Probable protein–protein networks and biological functions of the most significant (A) 50 upregulated and (B) 50 downregulated genes were analyzed based on the STRING online database. Edges represent protein–protein associations based on curated databases, text mining, and experimentally determined interactions. Edges are connected with lines whose thickness represents the confidence of the network association.
Genes 14 02101 g005
Figure 6. EV transcripts that showed significant correlations with clinical outcomes. (A) Forty-eight genes showing correlations between the EV transcriptome and the myocardial injury marker; high-sensitivity troponin I, measured at 12 h after reperfusion (p < 0.005). (B) Correlations among the expression levels of these 48 genes (p < 0.005). (C) Four genes significantly correlated with both TnI and PGD (p-value < 0.005). (D) Correlations of expression levels among the four genes. (E) Expression levels of the four genes (p < 0.005). p-values in B and D are denoted with asterisk marks, * p < 0.05, ** p < 0.005, *** p < 0.001.
Genes 14 02101 g006
Table 1. Heart transplant recipient characteristics.
Total (n = 38)No PGD (n = 25)PGD (n = 13)p
Female, n (%)9 (23.7%)7 (28%)2 (15.4%)0.46
Sex mismatch, n (%)2 (5.3%)2 (8%)0 (0%)0.54
Age, median, y (range)59 (27–67)60 (27–67)58 (46–66)0.46
Weight, median, kg (range)82 (41–120)84 (41–112)77 (62–120)0.58
BMI, median, kg/m2 (range)27.5 (15.6–36.3)27.6 (15.6–36.3)25.7 (21.5–36.2)0.66
Panel reactive antibodies (PRA)
PRA I, % (range)0 (0–60)7 (0–60)0 (0–20)0.14
PRA II, % (range)0 (0)0 (0)0 (0)0.34
Original diagnosis, % of known 0.16
Amyloidosis1 (2.6%)0 (0%)1 (7.7%)
Dilated cardiomyopathy19 (50%)13 (52%)6 (46.2%)
Hypertrophic cardiomyopathy0 (0%)0 (0%)0 (0%)
Ischemic cardiomyopathy2 (5.3%)0 (0%)2 (15.4%)
Congenital1 (2.6%)1 (4%)0 (0%)
End-stage coronary disease8 (21.1%)7 (28%)1 (7.7%)
Myocarditis3 (7.9%)2 (8%)1 (7.7%)
Sarcoidosis1 (2.6%)1 (4%)0 (0%)
Other3 (7.9%)1 (4%)2 (15.4%)
Chronic illnesses, % of known
Hypertension8 (23.5%)6 (26.1%)2 (18.2%)1.00
Diabetes mellitus (I or II)8 (26.7%)6 (30%)2 (20%)0.68
Coronary artery disease10 (29.4%)9 (39.1%)1 (9.1%)0.11
Peripheral vascular disease0 (0%)0 (0%)0 (0%)1.00
Malignancy2 (5.3%)2 (8.7%)0 (0%)0.53
Prior stroke7 (20.6%)6 (26.1%)1 (9.1%)0.38
Prior heart surgery8 (21.6%)5 (20%)3 (25%)1.00
Prior sternotomy10 (29.4%)6 (26.1%)4 (36.4%)0.69
Organ-specific parameters prior to HTx
EF, % (range)20 (10–50)22 (10–50)20 (15–50)0.89
PVR, Wood (range)2 (1–6)3 (1–6)2 (1–4)0.06
TPG, mmHg (range)8 (2–17)10 (2–17)7 (3–11)0.12
sPAP, mmHg (range)39 (22–62)43 (22–62)37 (27–62)0.39
dPAP, mmHg (range)21 (8–39)21 (8–39)18 (9–33)0.45
mPAP, mmHg (range)28 (13–43)28 (13–43)26 (15–41)0.78
Absolute FEV1, L/min (range)2 (1–3)2 (1–3)2 (2–3)0.30
Relative FEV1, % (range)65% (14–96)65% (14–96)65% (55–85)0.56
P-Bilirubin, µmol/L (range)12 (5–46)11 (5–46)13 (6–40)0.98
Pre-op GFR, mL/min/1.73 m2 (range)51 (26–128)48 (26–120)51 (34–128)0.71
Smoking, n (%) 0.44
Current1 (2.6%)0 (0%)1 (7.7%)
Former13 (34.2%)8 (34.8%)5 (41.7%)
Never22 (62.9%)15 (65.2%)7 (58.3%)
History unknown; only current known3 (7.9%)2 (8%)1 (7.7%)
Preoperative VAD, n (%) 0.40
Continuous flow3 (7.9%)3 (12%)0 (0%)
Pulsatile flow3 (7.9%)1 (4%)2 (15.4%)
Preoperative ECMO, n (%)4 (10.5%)3 (13.6%)1 (8.3%)1.00
Time on organ waiting list, median days (range)117 (1–1020)120 (1–840)60 (2–1020)0.77
Graft ischemia, median min (range)
Cold105 (7–165)110 (7–165)73 (9–149)0.54
Warm77 (30–120)78 (30–117)75 (40–120)0.65
Total160 (58–265)170 (58–238)156 (80–265)0.94
Perfusion support80 (40–186)80 (40–125)80 (45–186)0.28
Nitric oxide22 (57.9%)11 (44%)11 (84.6%)0.004
RBC transfusions during Tx, units4 (0–17)3 (0–10)4 (1–17)0.07
Recipient EBV34 (94.4%)22 (91.7%)12 (100%)0.54
Recipient CMV31 (83.8%)22 (88%)9 (75%)0.37
CMV prophylaxis35 (94.6%)22 (91.7%)13 (100%)0.53
Primary graft dysfunction, n (%)
No PGD25 (65.8%)25 (100%)0 (0%)
Any PGD13 (34.2%)0 (0%)13 (100%)
Mild PGD2 (5.3%)0 (0%)2 (15.4%)
Moderate PGD6 (15.8%)0 (0%)6 (46.2%)
Severe PGD4 (10.5%)0 (0%)4 (30.8%)
RV-PGD1 (2.6%)0 (0%)1 (7.7%)
Myocardial injury marker, median (range)
TnI at 12 h after reperfusion90,434 (22,757–50,000)60,640 (22,757–35,405)287,445 (28,711–50,000)0.008
TnT at 12 h after reperfusion6805 (1565–48,650)5462 (1565–18,470)21,040 (3356–48,650)0.007
CPK-MB at 12 h after reperfusion228 (51–600)156 (51–431)390 (95–600)0.001
Values are given as median with range. For numeric data, statistical significance was examined by using a two-tailed t-test with non-equal variance, and the significance of binary data and categorical data between two or more groups was examined by Fisher’s exact test (BMI, body mass index; PRA, panel reactive antibodies; EF, ejection fraction; PVR, pulmonary vascular resistance; TPG, transpulmonary gradient; sPAP, systolic pulmonary arterial pressure; dPAP, diastolic pulmonary arterial pressure; mPAP, mean pulmonary arterial pressure; FEV1, forced expiratory volume in first second; GFR, glomerular filtration rate; VAD, ventricular assist device; ECMO, extracorporeal membrane oxygenation; RBC, red blood cell; Tx, transplantation; EBV, Epstein–Barr virus; CMV, cytomegalovirus; PGD, primary graft dysfunction; RV-PGD, right ventricular primary graft dysfunction; TnI, high-sensitivity troponin I; TnT, high-sensitivity troponin T; CPK-MB, creatine phosphokinase-MB).
Table 2. 48 protein-coding genes that are highly related to TnI plasma levels at 12 h after reperfusion.
SymbolDescriptionCoefficient rp-Value
DDIT4LDNA damage inducible transcript 4 like0.544.99 × 10–4
PLIN2Perilipin 20.528.25 × 10–4
GPR3G-protein-coupled receptor 30.501.26 × 10–3
LOC101929614Proline-rich receptor-like protein kinase PERK100.501.43 × 10–3
C1QBComplement C1q B chain0.491.71 × 10–3
C1QAComplement C1q A chain0.491.92 × 10–3
IL17CInterleukin 17C0.482.44 × 10–3
FJX1Four-jointed box kinase 10.472.93 × 10–3
CYP4A11Cytochrome P450 family 4 subfamily A member 110.472.94 × 10–3
TDGThymine DNA glycosylase0.463.42 × 10–3
ITPKAInositol-trisphosphate 3-kinase A0.463.65 × 10–3
TCF15Transcription factor 150.463.94 × 10–3
CD59CD59 molecule (CD59 blood group)0.454.24 × 10–3
STC2Stanniocalcin 20.454.54 × 10–3
C1QCComplement C1q C chain0.454.96 × 10–3
VSIG2V-set and immunoglobulin domain containing 2–0.454.98 × 10–3
PRR27Proline-rich 27–0.454.70 × 10–3
KDM4BLysine demethylase 4B–0.454.64 × 10–3
EGFL8EGF-like domain multiple 8–0.454.56 × 10–3
AKR7A2Aldo-keto reductase family 7 member A2–0.454.53 × 10–3
ZGLP1Zinc finger GATA-like protein 1–0.454.36 × 10–3
MAP2K7Mitogen-activated protein kinase kinase 7–0.454.33 × 10–3
CLEC19AC-type lectin domain containing 19A–0.454.21 × 10–3
HOMER2Homer scaffold protein 2–0.464.09 × 10–3
MRM1Mitochondrial rRNA methyltransferase 1–0.463.75 × 10–3
PVALBParvalbumin–0.463.69 × 10–3
FBXO40F-box protein 40–0.463.47 × 10–3
SMIM5Small integral membrane protein 5–0.463.44 × 10–3
GFI1BGrowth-factor-independent 1B transcriptional repressor–0.473.24 × 10–3
GOLGA8GGolgin A8 family member G–0.473.03 × 10–3
CEP19Centrosomal protein 19–0.482.47 × 10–3
SELENBP1Selenium-binding protein 1–0.482.32 × 10–3
ARHGEF40Rho guanine nucleotide exchange factor 40–0.482.28 × 10–3
TMEM200BTransmembrane protein 200B–0.482.25 × 10–3
ATG9AAutophagy-related 9A–0.482.23 × 10–3
CYP11A1Cytochrome P450 family 11 subfamily A member 1–0.482.11 × 10–3
GRAP2GRB2-related adaptor protein 2–0.491.99 × 10–3
MAP6Microtubule-associated protein 6–0.491.85 × 10–3
CENPKCentromere protein K–0.491.60 × 10–3
MOV10Mov10 RISC complex RNA helicase–0.501.34 × 10–3
DFFBDNA fragmentation factor subunit β–0.501.32 × 10–3
TEFTEF transcription factor, PAR bZIP family member–0.511.13 × 10–3
CNN1Calponin 1–0.527.64 × 10–4
C12orf75Chromosome 12 open reading frame 75–0.536.80 × 10–4
PHOSPHO1Phosphoethanolamine/phosphocholine phosphatase 1–0.536.34 × 10–4
LTO1LTO1 maturation factor of ABCE1–0.562.55 × 10–4
RECQL5RecQ like helicase 5–0.562.43 × 10–4
CD19CD19 molecule–0.581.34 × 10–4
Table 3. 146 protein-coding genes that showed a correlation with a higher risk of PGD (p < 0.005).
SymbolDescriptionp-Value
SULT2A1Sulfotransferase family 2A member 18.05 × 10⁻⁵
ZFTAZinc finger translocation associated1.15 × 10–4
ITIH3Inter-α-trypsin inhibitor heavy chain 31.94 × 10⁻⁴
ATAT1α tubulin acetyltransferase 12.82 × 10⁻⁴
LOC124900286Putative uncharacterized protein DIP2C-AS14.01 × 10–4
SLC38A3Solute carrier family 38 member 34.02 × 10⁻⁴
AHSGα 2-HS glycoprotein4.16 × 10–4
HAO1Hydroxyacid oxidase 14.25 × 10⁻⁴
NPBWR1Neuropeptides B and W receptor 14.37 × 10⁻⁴
OOEPOocyte-expressed protein5.00 × 10–4
LOC102724250Neuroblastoma breakpoint family member 1-like5.06 × 10–4
APOHApolipoprotein H5.07 × 10–4
KRT17Keratin 175.68 × 10⁻⁴
CYP4A11Cytochrome P450 family 4 subfamily A member 116.55 × 10⁻⁴
MT1HMetallothionein 1H6.59 × 10–4
FGFR1Fibroblast growth factor receptor 16.66 × 10⁻⁴
TPSD1Tryptase delta 16.96 × 10⁻⁴
SLC39A14Solute carrier family 39 member 147.12 × 10⁻⁴
TAP2Transporter 2, ATP-binding cassette subfamily B member7.60 × 10–4
CEP295NLCEP295 N-terminal like7.60 × 10–4
CPB2Carboxypeptidase B27.79 × 10–4
CYP3A7Cytochrome P450 family 3 subfamily A member 77.92 × 10⁻⁴
PRR15Proline-rich 158.70 × 10⁻⁴
UCP1Uncoupling protein 19.73 × 10⁻⁴
HOXD3Homeobox D39.81 × 10–4
ITIH1Inter-α-trypsin inhibitor heavy chain 19.86 × 10⁻⁴
RIPOR2RHO family-interacting cell polarization regulator 29.86 × 10⁻⁴
NBR1NBR1 autophagy cargo receptor9.86 × 10–4
PTPRUProtein tyrosine phosphatase receptor type U9.93 × 10–4
PAHPhenylalanine hydroxylase9.93 × 10–4
SERPIND1Serpin family D member 11.03 × 10⁻³
IGFL4IGF-like family member 41.09 × 10⁻³
TMEM150BTransmembrane protein 150B1.10 × 10–3
TRIM69Tripartite motif containing 691.12 × 10⁻³
CSKC-terminal Src kinase1.12 × 10–3
YJU2YJU2 splicing factor homolog1.12 × 10–3
LRCOL1Leucine-rich colipase like 11.15 × 10⁻³
PRG3Proteoglycan 3, pro eosinophil major basic protein 21.23 × 10⁻³
C2Complement C21.27 × 10–3
SEPTIN1Septin 11.27 × 10⁻³
PRSS37Serine protease 371.33 × 10⁻³
UGT2A3UDP glucuronosyltransferase family 2 member A31.33 × 10–3
BTG2BTG anti-proliferation factor 21.44 × 10⁻³
HAMPHepcidin antimicrobial peptide1.51 × 10–3
CYP2A6Cytochrome P450 family 2 subfamily A member 61.52 × 10⁻³
GPR135G-protein-coupled receptor 1351.53 × 10–3
FGF23Fibroblast growth factor 231.61 × 10⁻³
PRSS22Serine protease 221.62 × 10⁻³
TXNIPThioredoxin-interacting protein1.62 × 10–3
TNK2Tyrosine kinase non receptor 21.62 × 10⁻³
ZNG1CZn-regulated GTPase metalloprotein activator 1C1.62 × 10–3
DDX43DEAD-box helicase 431.70 × 10⁻³
LGI2Leucine-rich repeat LGI family member 21.80 × 10⁻³
TNFRSF21TNF receptor superfamily member 211.83 × 10⁻³
ADARAdenosine deaminase RNA specific1.83 × 10–3
MATN1Matrilin 11.83 × 10⁻³
IKZF3IKAROS family zinc finger 31.83 × 10⁻³
CSF2RBColony-stimulating factor 2 receptor subunit β1.83 × 10⁻³
UGT1A7UDP glucuronosyltransferase family 1 member A71.84 × 10–3
STRCStereocilin1.88 × 10–3
MT1GMetallothionein 1G1.88 × 10–3
CPA5Carboxypeptidase A51.97 × 10–3
DCSTAMPDendrocyte-expressed seven transmembrane protein2.03 × 10–3
HJVHemojuvelin BMP co-receptor2.05 × 10–3
PLCG2Phospholipase C γ 22.06 × 10⁻³
GUCY2DGuanylate cyclase 2D, retinal2.06 × 10–3
DACT1Dishevelled-binding antagonist of β catenin 12.09 × 10⁻³
SLC10A1Solute carrier family 10 member 12.16 × 10⁻³
FGF17Fibroblast growth factor 172.20 × 10⁻³
SAA4Serum amyloid A4, constitutive2.22 × 10–3
SLC23A1Solute carrier family 23 member 12.27 × 10⁻³
HERC4HECT and RLD domain containing E3 ubiquitin protein ligase 42.32 × 10⁻³
OR8K1Olfactory receptor family 8 subfamily K member 12.39 × 10⁻³
CHRM4Cholinergic receptor muscarinic 42.47 × 10⁻³
RAB7BRAB7B, member RAS oncogene family2.54 × 10–3
KCNS2Potassium voltage-gated channel modifier subfamily S member 22.54 × 10⁻³
CYP3A4Cytochrome P450 family 3 subfamily A member 42.55 × 10⁻³
BANK1B-cell scaffold protein with ankyrin repeats 12.56 × 10⁻³
CELCarboxyl ester lipase2.56 × 10–3
CRYBG2Crystallin β-γ domain containing 22.61 × 10⁻³
IRF1Interferon regulatory factor 12.61 × 10⁻³
HPHaptoglobin2.61 × 10–3
TMEM221Transmembrane protein 2212.66 × 10–3
EPPIN-WFDC6EPPIN-WFDC6 readthrough2.67 × 10–3
BAATBile acid-CoA:amino acid N-acyltransferase2.76 × 10–3
HS3ST3A1Heparan sulfate-glucosamine 3-sulfotransferase 3A12.79 × 10–3
IDUAα-L-iduronidase2.81 × 10–3
APOA1Apolipoprotein A12.82 × 10–3
KIAA1522KIAA15222.92 × 10–3
DTX3LDeltex E3 ubiquitin ligase 3L2.92 × 10–3
ORC3Origin recognition complex subunit 32.92 × 10–3
STX17Syntaxin 172.92 × 10⁻³
ANKRD13AAnkyrin repeat domain 13A2.92 × 10–3
ZSWIM4Zinc finger SWIM-type containing 42.92 × 10⁻³
ITPKAInositol-trisphosphate 3-kinase A2.97 × 10–3
AKR7A3Aldo-keto reductase family 7 member A32.98 × 10–3
SALL1Spalt-like transcription factor 13.09 × 10⁻³
PCDHAC1Protocadherin α subfamily C, 13.16 × 10⁻³
C9Complement C93.16 × 10–3
RGS18Regulator of G protein signaling 183.27 × 10⁻³
DIAPH1Diaphanous-related formin 13.27 × 10⁻³
IGBP1Immunoglobulin-binding protein 13.27 × 10⁻³
TRIM22Tripartite motif containing 223.27 × 10⁻³
L3MBTL1L3MBTL histone methyl-lysine binding protein 13.27 × 10–3
ALX4ALX homeobox 43.37 × 10⁻³
CXCL14C-X-C motif chemokine ligand 143.40 × 10⁻³
IFNL3Interferon lambda 33.42 × 10⁻³
SH2D1BSH2 domain containing 1B3.46 × 10–3
LRRC56Leucine-rich repeat containing 563.46 × 10⁻³
EHD1EH domain containing 13.65 × 10⁻³
SMARCC2SWI/SNF-related, matrix-associated, actin-dependent regulator of chromatin subfamily c member 23.65 × 10⁻³
RDH8Retinol dehydrogenase 83.72 × 10⁻³
ABCA8ATP-binding cassette subfamily A member 83.79 × 10⁻³
UNC93Aunc-93 homolog A3.82 × 10–3
USP21Ubiquitin-specific peptidase 213.82 × 10⁻³
PCDH11YProtocadherin 11 Y-linked3.99 × 10–3
HOXB9Homeobox B94.07 × 10–3
ZMYM6Zinc finger MYM-type containing 64.08 × 10⁻³
POLR1ARNA polymerase I subunit A4.08 × 10–3
RETREG1Reticulophagy regulator 14.08 × 10⁻³
AKAP17AA-kinase-anchoring protein 17A4.08 × 10–3
PDCD4Programmed cell death 44.08 × 10⁻³
DRC3Dynein-regulatory complex subunit 34.08 × 10⁻³
SPOPSpeckle-type BTB/POZ protein4.08 × 10–3
PACSIN2Protein kinase C and casein kinase substrate in neurons 24.08 × 10⁻³
KCNIP4Potassium voltage-gated channel interacting protein 44.14 × 10⁻³
TMEM132CTransmembrane protein 132C4.16 × 10–3
C15orf48Chromosome 15 open reading frame 484.17 × 10⁻³
BTBD19BTB domain containing 194.20 × 10⁻³
ADAM20ADAM metallopeptidase domain 204.20 × 10⁻³
C8GComplement C8 γ chain4.25 × 10–3
KRTAP10-8Keratin-associated protein 10-84.27 × 10⁻³
ADAMTS15ADAM metallopeptidase with thrombospondin type 1 motif 154.35 × 10⁻³
KRT71Keratin 714.38 × 10⁻³
TTRTransthyretin4.40 × 10–3
DDX60LDExD/H-box 60 like4.54 × 10–3
CD19CD19 molecule4.54 × 10–3
DPEP2Dipeptidase 24.54 × 10⁻³
SOCS7Suppressor of cytokine signaling 74.54 × 10⁻³
KRT83Keratin 834.59 × 10⁻³
TGM3Transglutaminase 34.62 × 10⁻³
ENTPD8Ectonucleoside triphosphate diphosphohydrolase 84.73 × 10⁻³
TNP2Transition protein 24.84 × 10⁻³
DDIT4LDNA damage inducible transcript 4 like4.91 × 10–3
F11Coagulation factor XI4.98 × 10–3
LMX1BLIM homeobox transcription factor 1 β4.98 × 10⁻³
Table 4. Four significant protein-coding genes associated with both TnI and PGD after HTx.
SymbolBiological RelevanceTnI
R
TnI
p-Value
PGD
p-Value
ITPKACalmodulin-binding, calcium signaling0.463.65 × 10–32.97 × 10⁻³
Inositol phosphate metabolism
Phosphatidylinositol signaling system
DDIT4LNegative regulation of signal transduction0.544.99 × 10–44.91 × 10⁻³
Inhibits cell growth via the TOR signaling pathway and downstream of AKT1
CD19Normal B-cell differentiation–0.581.34 × 10–44.54 × 10⁻³
Activation of PI3K and the mobilization of intracellular Ca2+ stores
Positive regulation of calcium ion transmembrane transport via BCR signaling pathway
CYP4A11Metabolism of drugs, fatty acids, arachidonic acids 0.472.94 × 10–36.55 × 10⁻⁴
Biosynthesis of cholesterol, steroids, and other lipids
PPAR signaling pathway, atherosclerosis
Disclaimer/Publisher’s Note: The statements, opinions and data contained in all publications are solely those of the individual author(s) and contributor(s) and not of MDPI and/or the editor(s). MDPI and/or the editor(s) disclaim responsibility for any injury to people or property resulting from any ideas, methods, instructions or products referred to in the content.

