Article

The Impact of Chronic Mild Stress and Agomelatine Treatment on the Expression Level and Methylation Status of Genes Involved in Tryptophan Catabolic Pathway in PBMCs and Brain Structures

1
Laboratory of Medical Genetics, Faculty of Biology and Environmental Protection, University of Lodz, 90-236 Lodz, Poland
2
Department of Cytobiochemistry, Faculty of Biology and Environmental Protection, University of Lodz, 90-236 Lodz, Poland
3
Department of Medical Biochemistry, Medical University of Lodz, 92-216 Lodz, Poland
4
Biohazard Prevention Centre, Faculty of Biology and Environmental Protection, University of Lodz, 90-236 Lodz, Poland
5
Institute of Pharmacology, Polish Academy of Sciences, 31-343 Krakow, Poland
*
Author to whom correspondence should be addressed.
Genes 2020, 11(9), 1093; https://doi.org/10.3390/genes11091093
Submission received: 7 July 2020 / Revised: 8 September 2020 / Accepted: 15 September 2020 / Published: 18 September 2020
(This article belongs to the Section Human Genomics and Genetic Diseases)

Abstract

:
Depression is the serious mental disorder. Previous studies suggest that the development mechanism of depression may be associated with disorders of the tryptophan catabolic pathway (TRYCAT). Thus, this study investigates the effect of agomelatine treatment on the expression and methylation status of genes involved in TRYCAT in the brain and blood of rats exposed to a chronic mild stress (CMS). Separate groups of rats were exposed to CMS for two or seven weeks; the second group received vehicle or agomelatine for five weeks. After completion of both stress conditions and treatment, the expression levels of messenger RNA (mRNA) and protein, as well as the methylation status of promoters, were measured in peripheral blood mononuclear cells (PBMCs) and in brain structures with the use of TaqMan Gene Expression Assay, Western blot, and methylation-sensitive high-resolution melting techniques. In PBMCs, Kmo mRNA expression increased in the group after CMS, while this effect was normalized by agomelatine therapy. In brain, KatI and KatII expression changed following CMS exposure. Moreover, CMS decreased the methylation status of the second Tdo2 promoter in the amygdala. Protein expression of Tph1, Tph2, Ido1, and KatII changed in the group after CMS and agomelatine administration, most prominently in the basal ganglia, cerebral cortex, hippocampus, and amygdala. The results indicate that CMS and agomelatine affect the mRNA and protein expression, as well as the methylation of promoters of genes involved in the tryptophan catabolic pathway.

1. Introduction

Currently, more than 300 million individuals worldwide are affected by depression, causing an enormous economic and social burden [1]. Moreover, depression is also one of the main reasons for premature death and ongoing disability [2]. Its etiology and pathophysiology still remain unclear. However, a growing body of evidence shows that disorders of tryptophan metabolism may be responsible for the onset of depression symptoms. A reduced plasma level of tryptophan was observed in the course of depression [3,4]. Previous clinical studies suggested that depression may be the result of a disorders of expression and polymorphism located in genes encoding enzymes involved in the tryptophan catabolism pathway, including Tph1/Tph2 (tryptophan hydroxylase 1/2), Ido1 (indoleamine 2,3-dioxygenase 1), Kat1/Kat2 (kynurenine aminotransferase 1/2), Kmo (kynurenine 3-monooxygenase), and Kynu (kynureninase) [5,6,7,8,9,10]. Patients with depression were characterized by an increased level of neurotoxic tryptophan metabolites, including 3-hydroxykynurenine, quinolinic acid, and anthranilic acid, and a decreased level of neuroprotective compounds, including kynurenic acid. Moreover, previous studies confirmed that depression may be associated with the insufficient of tryptophan and serotonin, as well as increased activity of 2,3-dioxygenase tryptophan (TDO) and indoleamine 2,3-dioxygenase, but decreased activity of kynurenine aminotransferases I/II [4,8,9,11]. Additionally, previous studies suggest that the same disorders may affect the response to antidepressant treatment [12,13]. In addition, previous studies also draw attention to the connection of depression with polymorphic variants of genes. The c.-173A>T (rs10488682) polymorphism of TPH1 may decrease the activity of the promoter, changing the level of TPH1 transcription. In turn, the 844G>T (rs4576025) polymorphism of TPH2 may alter DNA–protein interactions, and T allele presence is associated with reduced activity of the TPH2 promoter. Interestingly, polymorphisms localized in genes involved in the tryptophan catabolic pathway (TRYCAT) pathway may modulate the response of antidepressant treatment. Polymorphism of TPH1, TPH2, and KATI genes may be associated with a lack of response to conventional antidepressant therapy. The link of polymorphic variants with the occurrence of depression and the effectiveness of treatment suggests that the disorder may also be associated with other molecular changes, including changes in the messenger RNA (mRNA) and protein expression level or methylation status of promoter regions [7,12,13]. Methylation of DNA in mammals is mainly catalyzed by DNMT1, DNMT3a, and DNMT3b (DNA methyltransferases 1, 3a, 3b) [14,15]. The postmortem brain tissue from affected patients was characterized by increased expression levels of DNMTs as compared with healthy 2 week unstressed patients [16,17]. Moreover, antidepressant therapy reversed hypermethylation of the P11 gene in stressed rats and caused the reduction of Dnmt1 and Dnmt3a messenger RNA (mRNA) levels [18]. Thus, the changes in methylation status of methyltransferases may also impact the methylation level of other genes, including genes related to oxidative stress and the tryptophan catabolic pathway.
Although antidepressants represent the first-line therapy of depression (including selective serotonin reuptake inhibitors (SSRIs), serotonin norepinephrine reuptake inhibitors, and norepinephrine–dopamine reuptake inhibitors), the effect of treatment is often insufficient. About 30% of patients with depression do not respond to antidepressant treatment, and fewer than 50% achieve remission [19,20]. The variability of treatment effects may be associated with patient heterogeneity, including personality, age, metabolic, and genetic differences, as well as drug, dose, and time of therapy [21,22]. On the other hand, some drugs have a limited use due to side effects, including gastrointestinal disturbances, weight gain, sleep disturbances, sexual dysfunction, and discontinuation effects [23,24,25]. Agomelatine is a relatively new antidepressant drug, which was approved for adult treatment in 2009 by the European Medicines Agency [26]. The pharmacological effect of the drug is two-dimensional: (i) as an agonist of MT1 and MT2 receptors, and (ii) as an antagonist of 5-HT2C receptors [27]. Agomelatine was found to be highly effective in therapy due to its modulation of circadian rhythms [28]. Moreover, an earlier study suggests that agomelatine may cause an increase in dopamine and noradrenaline, stimulating cell proliferation and neurogenesis [29]. Interestingly, agomelatine treatment causes an early improvement of anhedonia [30]. However, other research suggests that agomelatine does not show much greater effectiveness compared to SSRIs; moreover, it has significant hepatotoxicity [31,32].
In the present study, we used the chronic mild stress (CMS) rat model of depression to determine whether CMS and agomelatine administration cause disturbances of expression and promote methylation of genes involved in the tryptophan catabolic pathway, i.e., Tph1/2, Ido1, Kat1/2, Kmo, and Kynu, in peripheral blood mononuclear cells and brain structures of the rats.

2. Materials and Methods

2.1. Animals

All tests were carried out on male Wistar rats (Charles River, Sulzfeld, Germany). One month before starting the experiment, the animals were adapted to standard housing conditions in the laboratory at room temperature of 22 ± 2 °C and humidity of 50 ± 5%, maintained in a 12 h light/dark cycle (lights on at 8:00 a.m.) with free access to standard laboratory food and tap water, except when food and/or water deprivation was applied as a stress parameter. Each experimental group consisted of six rats. All the procedures were used in accordance with Directive 86/609/EEC and were approved by the Bioethical Committee at the Institute of Pharmacology, Polish Academy of Sciences, Krakow, Poland.

2.2. Chronic Mild Stress (CMS) Procedure

CMS experiments were performed according to the method described previously, and its course is presented in Figure 1A [33]. Initially, male Wistar rats were trained to consume a 1% sucrose solution in seven once-weekly baseline tests in which the solution of sucrose was presented 1 h after 14 h of food and water deprivation. Subsequently, rats were divided into two matched groups, and the first group consisted of animals exposed to stress procedure for two or seven weeks. The procedure of chronic mild stress was carried out in accordance with the guidelines described earlier [33]. Briefly, each stressed week included two periods of food or water deprivation, two periods of 45° cage tilt, two periods of soiled cage (250 mL of water in sawdust bedding), two periods of intermittent illumination (light on and off every 2 h), two periods of low intensity stroboscopic illumination (150 flashes/min), one period of paired housing, and three periods of no stress. The duration of all stressors was 10–14 h, and they were used individually and continuously, day and night. Rats were deprived of food and water for 14 h preceding each sucrose test; otherwise, food and water were freely available in the home cage. Then, the studied rats were again divided into subgroups: (i) received a vehicle (daily 10 mL/kg, IP) or (ii) received agomelatine (daily 10 mg/kg, IP) for five weeks after the period of adaptation and 24 h after the last dose weekly tests of sucrose intake were performed. The stress procedure was continued throughout the entire period of treatment. Finally, the presented study included five groups—2 weeks unstressed, 2 weeks stressed, 5 weeks agomelatine unstressed, 7 weeks stressed/5 weeks saline, and 7 weeks stressed/5 weeks agomelatine. Ultimately, the studied animals were decapitated 24 h after the last sucrose test, and samples of blood and brain structures were collected. The scheme of the CMS procedure is presented in Figure 1A.

2.3. Specimen Collection

In total, 30 male Wistar rats were enrolled in the study and divided into five groups (n = 6). The samples of blood and brain tissue were obtained after decapitation of studied animals. The samples of peripheral blood were collected in EDTA tubes and then were used to isolate peripheral blood mononuclear cells (PBMCs) using centrifugation (400× g, 30 min, 4 °C) and Gradisol L (Aqua-Med, Lodz, Poland). After separation, the pellets of PBMCs were stored at −20 °C for further analyses.
All studied brain structures were rapidly frozen in liquid nitrogen and stored at −80 °C after animal decapitation. Then, a sufficient volume of PBS was added to each sample, which were then homogenized using a FastGene®Tisue Grinder (Nippon Genetics Europe, Düren, Germany). The homogenates prepared in this way were used for the isolation of DNA, RNA, and protein specimens.

2.4. Real-Time PCR

The extraction of RNA from PBMCs and frozen brain structures was carried out using commercially available spin column kits (GenElute Mammalian Total RNA Miniprep Kit, Sigma-Aldrich, St. Louis, MO, USA; ISOLATE II RNA/DNA/Protein Kit, Bioline, Alvinston, Canada, respectively) according to the manufacturer’s instruction. After isolation, a spectrophotometer was used to measure the quantity and quality of the RNA samples, which then were stored at −20 °C until further use. RNA was reverse-transcribed into complementary DNA (cDNA) according to the manufacturer’s instructions supplied with the High-Capacity cDNA Archive Kit (Applied Biosystems, Foster City, CA, USA). The reaction of cDNA synthesis consisted of nuclease-free water, 10× RT Random Primers, 25× dNTP Mix (100 mM), 10× RT Buffer, MultiScribe® Reverse Transcriptase, and total RNA (0.5 ng/µL) and was performed using a C1000TM programmed Thermal Cycler (Bio Rad Laboratories Inc., Hercules, CA, USA). The reverse transcription included three steps: (i) enzyme activation (10 min at 25 °C), (ii) proper synthesis of cDNA (120 min at 37 °C), and (iii) enzyme inactivation (5 min at 85 °C). Then, TaqMan Universal Master Mix, no UNG, and species-specific TaqMan Gene Expression Assays (Thermo Fisher Scientific, Waltham, MA, USA) were used to quantify each gene of interest with the quantitative reverse-transcription polymerase chain reaction (RT-qPCR). Assay IDs for the genes tested were as follows: Tph1 (assay ID: Rn00598017_m1), Tph2 (assay ID: Rn01476867_m1), Kmo (assay ID: Rn01411937_m1), Kynu (assay ID: Rn01449532_m1), KatI (assay ID: Rn01439192_m1), KatII (assay ID: Rn00567882_m1), Ido1 (assay ID: Rn01482210_m1), and 18S (Hs99999901_s1) as an internal control to normalize the target expression level of genes. PCR was performed using a CFX96TM Real-Time PCR Detection System Thermal Cycler (Bio Rad Laboratories Inc., Hercules, CA, USA). The cycling conditions consisted of 10 min at 95 °C, followed by 60 cycles at 95 °C of 30 s and 1 min at 60 °C; samples were run in duplicate. The relative gene expression was calculated using the 2−ΔCt sample method and the fold change in the expression caused by agomelatine administration was calculated using the 2−ΔΔCt method [34].

2.5. Methylation-Sensitive High-Tesolution Melting (MS-HRM) PCR

The isolation of genomic DNA from PBMCs and frozen brain structures was carried out according to the manufacturer’s instructions supplied with the commercial kits—QIAamp DNA Mini Kit (Qiagen, Hilden, Germany) and ISOLATE II RNA/DNA/Protein Kit (Bioline, Alvinston, Canada), respectively. The quantity and quality of the DNA samples were measured by comparing the absorbance values at 260 nm and 280 nm, and then samples were stored at −20 °C until further analysis. The evaluation of gene promoter region methylation level was carried out using methylation-sensitive high-resolution melting (MS-HRM) [35,36]. Briefly, a search for CpG islands in the promoter of all studied genes was performed using the EMBOSS Cpgplot bioinformatics tool https://www.ebi.ac.uk/Tools/seqstats/emboss_cpgplot/, Settings: Window: 100, Shift: 1, Obs./Exp.: 0.6, GC content: 50%). Then, primers were designed using MethPrimer http://www.urogene.org/methprimer2/) according to the previously described recommendations of Wojdacz et al. (2009) [37]. Specification of primers is presented in Table S1 (Supplementary Materials).
The next step included bisulfite conversion, using the commercially available CiTi Converter DNA Methylation Kit (A&A Biotechnology, Gdynia, Poland), according to the manufacturer’s protocols. PCR was performed using the Bio-Rad CFX96 Real-Time PCR Detection System (BioRad Laboratories Inc., Hercules, CA, USA), and the cycling conditions consisted of initial activation for 12 min at 95 °C, 45 cycles at 95 °C for 15 s, annealing at optimal primer temperatures (tested experimentally) for 20 s, and elongation at 72 °C for 20 s. The HRM analysis included (i) denaturation at 95 °C for 15 s, (ii) reannealing at 60 °C for 1 min, and (iii) melting from 60 to 95 °C at a ramp rate of 0.2 °C every 2 s. Each reaction consisted of 10 ng of DNA after bisulfite modification (theoretical calculation), 5× HOT FIREPol® EvaGreen® HRM Mix (no ROX) (Solis BioDyne, Tartu, Estonia) and 500 nM of each primer. Additionally, the internal control of HRM was unmethylated and methylated bisulfite-converted control DNA (CpGenomeTM Rat Methylated Genomic DNA Standard, Merck Millipore, Burlington, MA, USA and CpGenomeTM Rat Unmethylated Genomic DNA Standard, Merck Millipore, Burlington, MA, USA) in different ratios (0%, 10%, 25%, 50%, 75%, and 100% methylated controls). The fully methylated and unmethylated DNA standards were mixed to obtain the following ratios of methylation: 0%, 10%, 25%, 50%, 75%, and 100%. Standard curves with known methylation ratios were included in each assay and were used to mark the methylation ratio of each sample from brain structures and PBMCs of studied rats. HRM data were analyzed using the Bio-Rad Precision Melt Analysis software (BioRad), with output plots produced as normalized melting curves.

2.6. Western Blot

Western blot was used for the measurement of protein expression levels in the structures of the brain tissue as described previously [38]. Protein samples from frozen brain structures were extracted in radioimmunoprecipitation assay buffer (RIPA; 10 mM Tris-HCl PH 8.0, 1 mM EDTA, 1% Triton X-100, 0.1% sodium deoxycholate, 0.1% SDS, 10 Mm NaCl) supplemented with 1 mM phenylmethanesulfonyl fluoride (PMSF; serine protease inhibitor) using the FastGene® Tissue Grinder (Nippon Genetics Europe, Düren, Germany) homogenizer. The homogenates containing proteins were double-sonicated and centrifuged (5000 rpm, 5 min, 4 °C). Then, the modified Lowry protocol was used to evaluate protein concentration [39]. The protein samples (50 µg/lane) were separated on 10% polyacrylamide gels in electrophoresis buffer (25 mM Tris; 192 mM glycine; 0.1% SDS) and electroblotted onto Immobilon-P (Millipore, Bedford, MA, USA) in transfer buffer (25 mM Tris; 192 mM glycine; 20% methanol) as previously described [40]. Subsequently, blots were blocked for 1 h at room temperature, and, after washing with TBST buffer (Tris-buffered saline with Tween-20), the membranes were incubated overnight at 4 °C with the commercially available primary antibodies (excluding anti-β-actin antibody; incubation for two hours at room temperature) in dilutions according to the manufacturer’s protocol (specification of all antibodies is presented in Table S2, Supplementary Materials). After the incubation, membranes were rinsed again with TBST buffer and then incubated with secondary antibodies conjugated with horseradish peroxidase (HRP). Next, the blots were also washed with TBS buffer, and immunoreaction was visualized using a solution of peroxidase solution (Thermo Fisher Scientific, Waltham, MA, USA) and X-ray films (Fujifilm, Tokyo, Japan). Finally, Gel Pro Analyzer v3.0 for Windows (Media Cybernetics, Rockville, MD, USA) was used for densitometric evaluation of the signal intensities. The levels of protein expression were normalized using the reference protein β-actin (ACTB; IODgene/IODACTB).

2.7. Statistical Analysis

All data in this paper are presented as means ± standard error of the mean (SEM). The Shapiro–Wilk test was used to evaluate data normality. Then, one-way analysis of variance (ANOVA) was used to detect significant differences between samples with normal distribution, whereas differences between probes with non-normal distribution were confirmed by the Kruskal–Wallis test. Finally, the Tukey test was used as a post hoc test (all permutations of post hoc testing were performed). Additionally, the t-test was used to confirm significant differences in mRNA expression and methylation levels between blood and brain. A p-value < 0.05 was considered statistically significant. Statistical analysis was performed using Statistica 12 (Statsoft, Tulsa, OK, USA), SigmaPlot 11.0 (Systat Software Inc., San Jose, CA, USA) and GraphPad Prism 5.0 (GraphPad Software, Inc., La Jolla, CA, USA).

3. Results

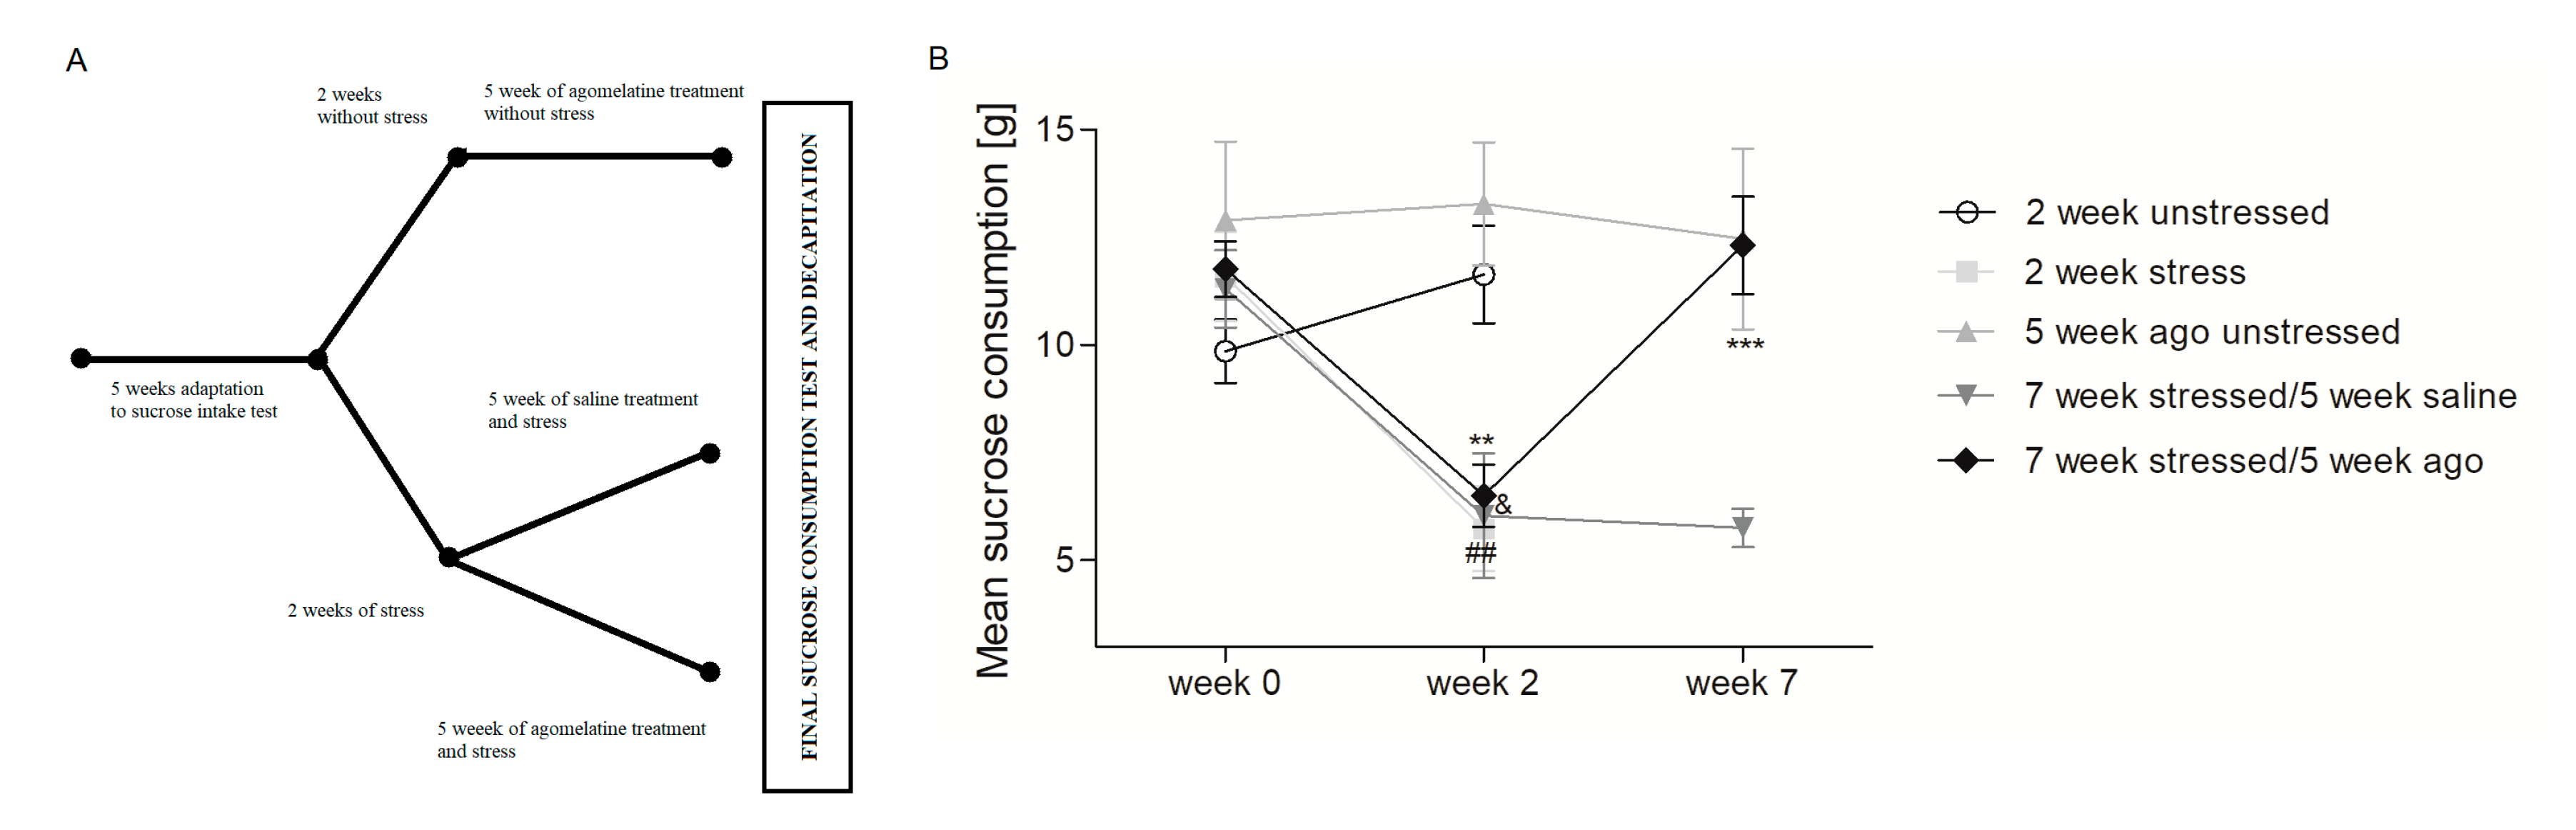
3.1. Agomelatine Impact on the Sucrose Intake of Rats Exposed to Chronioc Mild Stress

As shown in Figure 1B, prior to inducing chronic mild stress (Week 0), the sucrose intake consumption was comparable in all studied groups. The sucrose intake decreased after two weeks of stress (p < 0.01). A similar effect was observed in 7 weeks stressed/5 weeks saline and 7 weeks stressed/5 weeks agomelatine groups (p < 0.05, p < 0.01, respectively) after 2 weeks of stress. Chronic administration of agomelatine for 5 weeks normalized the level of sucrose intake in the stressed rats for 7 weeks (p < 0.001).

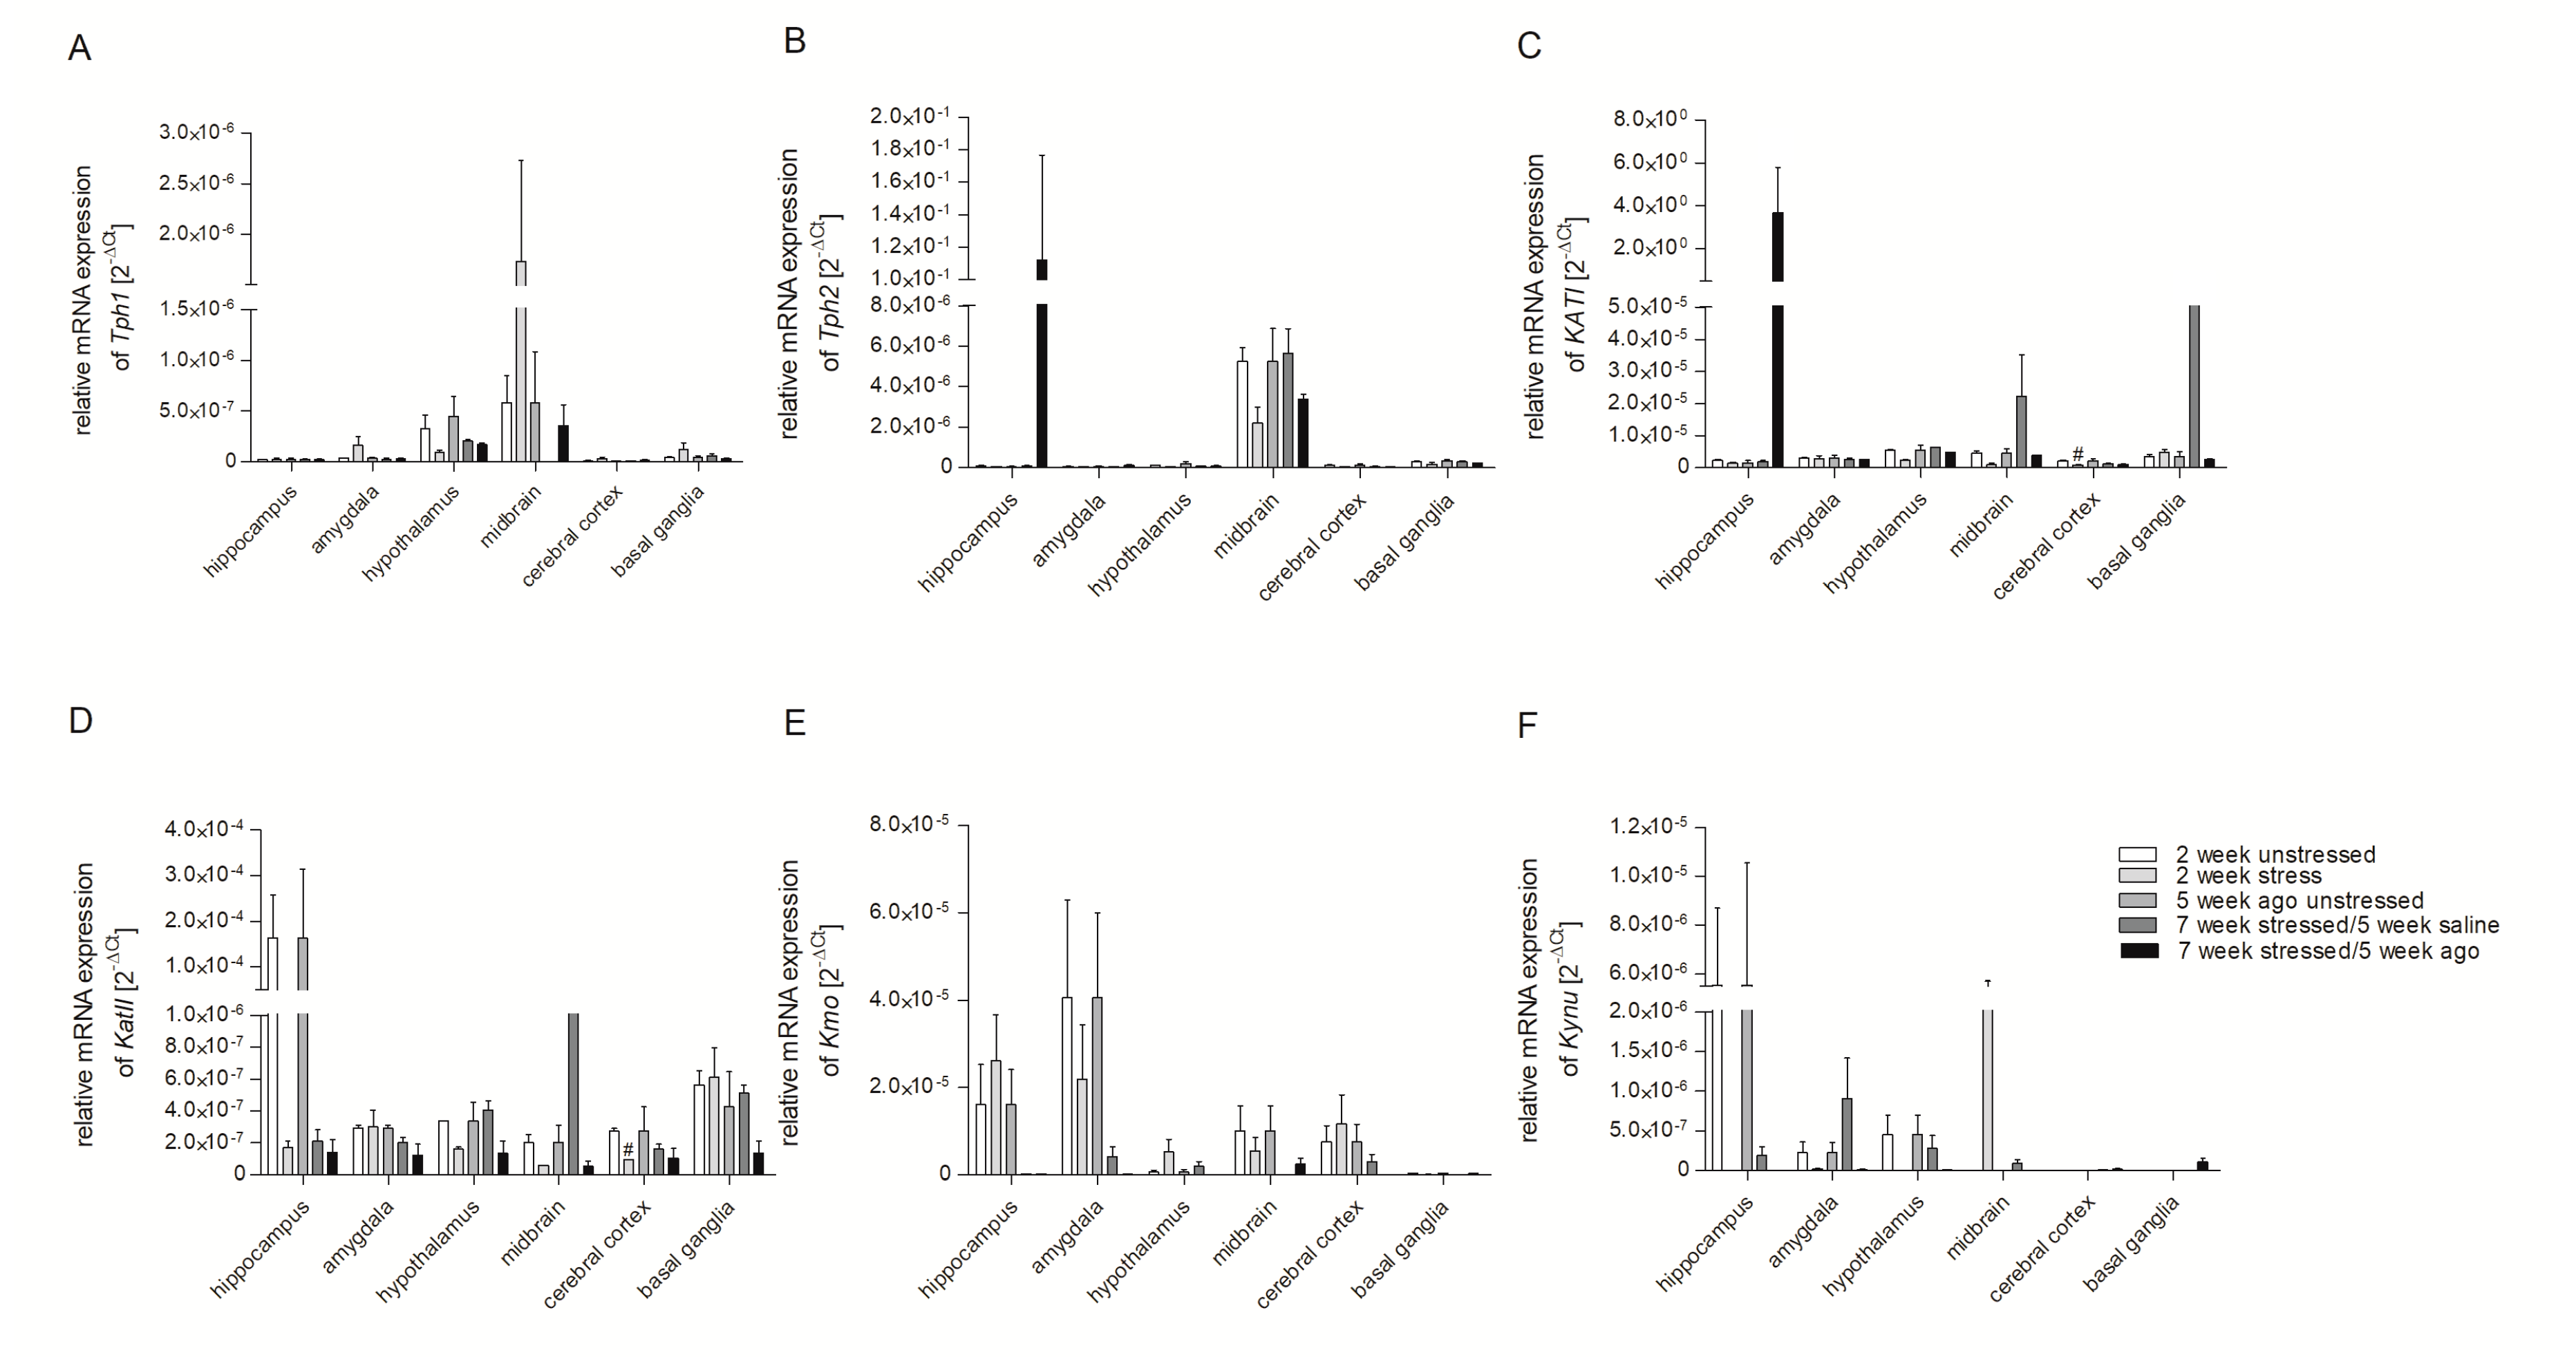
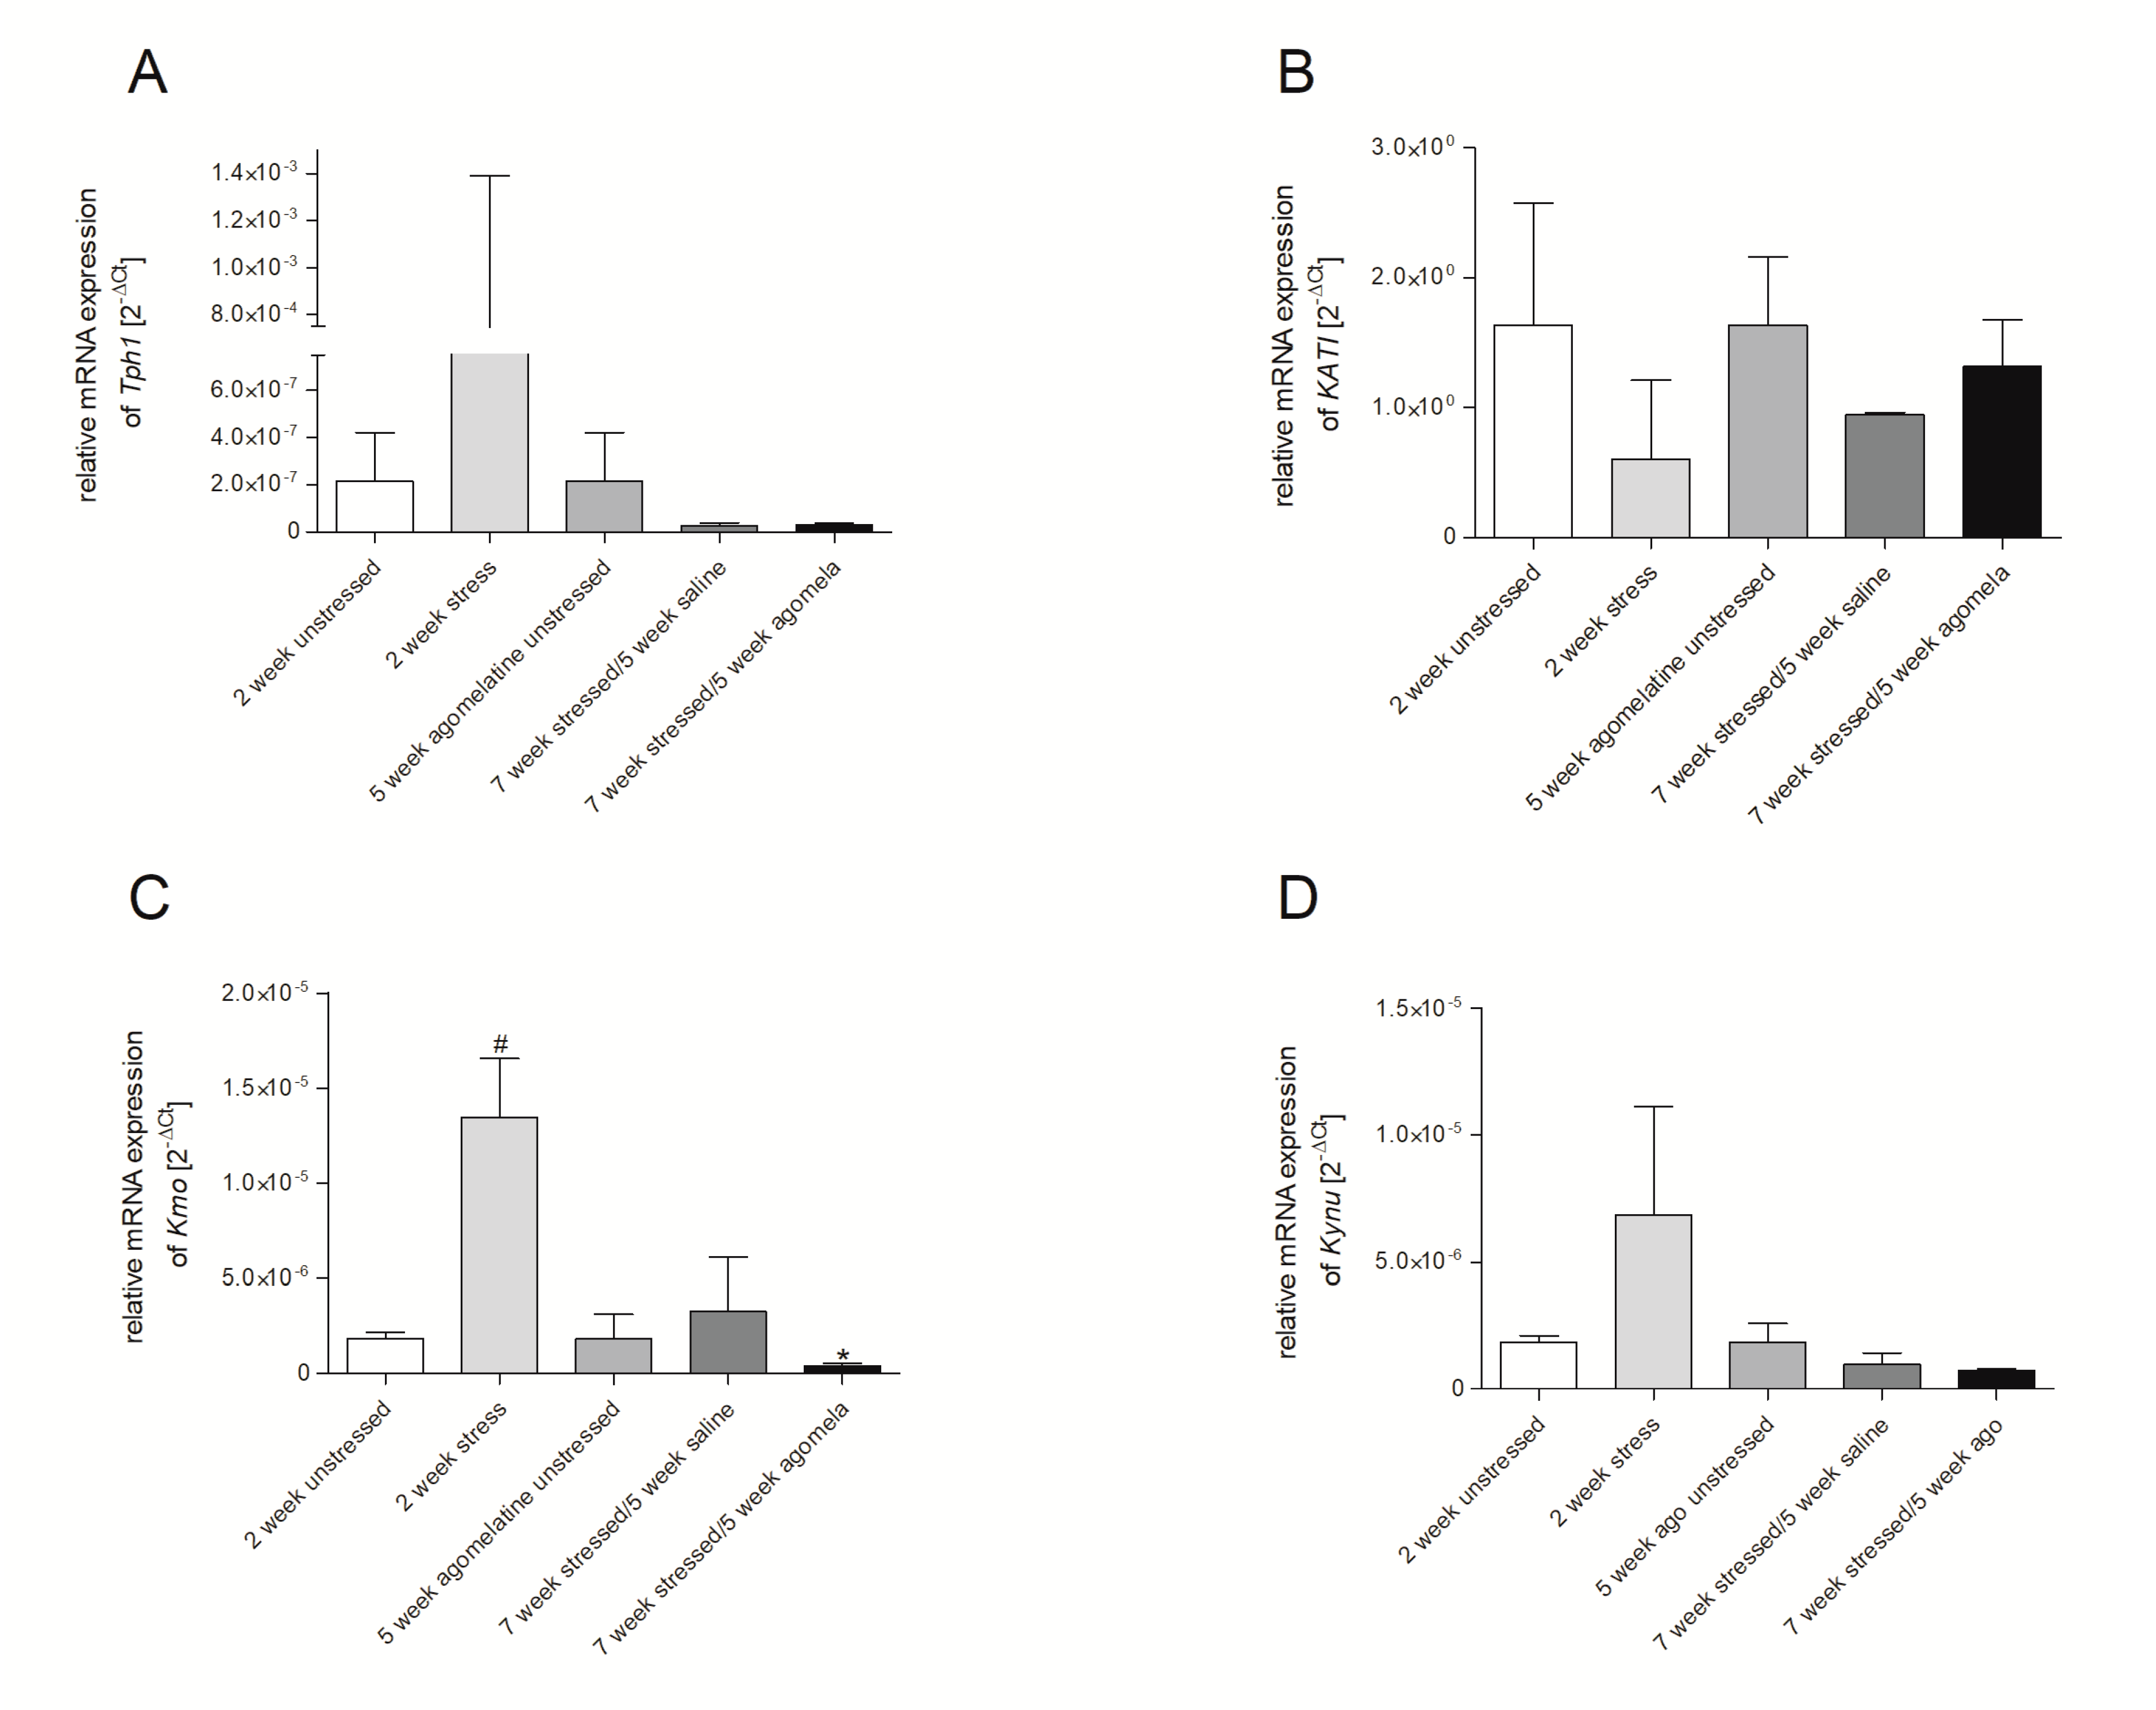
3.2. mRNA Expression of Genes Involved in Tryptophan Catabolic Pathway in PBMCs and Brain Structures

The mRNA expression of all studied genes depended on the type of examined tissue. In the 2 weeks stressed group, we only observed an increased Kmo mRNA expression in PBMCs, and this effect was normalized in the 7 weeks stressed/5 weeks agomelatine group (Figure 2C and Table S4, Supplementary Materials). The mRNA expression of Tph2 and KatII was undetectable in PBMCs. As shown in Figure 3 and Table S4 (Supplementary Materials) in the case of brain structures, the changes in expression levels were observed only in the cerebral cortex. The 2 week stress procedure caused a reduction in KatI (H = 9.044, df = 4, p < 0.05, Tukey test p < 0.05) and KatII (H = 8.436, df = 4, p < 0.05, Tukey test p < 0.05) mRNA expression in the cerebral cortex.

3.3. Aagomelatine Impact on the mRNA Expression Level in PBMCs and Brain Structures

We assessed the direction of expression changes due to agomelatine treatment in PBMCs and brain structures. To this end, we determined the changes according to the 2−ΔΔCt method, which included the difference between the expression level in the 7 weeks stressed/ 5 weeks agomelatine group and the expression level in the 2 weeks stressed group. As shown in Figure S1 (Supplementary Materials), Tph2 expression was observed in the amygdala and cerebral cortex (p < 0.001) and KatII expression was observed in the hippocampus and basal ganglia (p < 0.001) of the 7 weeks stressed/5 weeks agomelatine group, while mRNA expression was not detected in the PBMCs. Moreover, agomelatine therapy for 5 weeks led to an increase in Kmo and Kynu expression in the hippocampus, amygdala, hypothalamus, and cerebral cortex of stressed rats for 7 weeks (p < 0.001), as compared to changes observed in PBMCs. In the case of Kynu, an elevated level of mRNA expression was also observed in the hippocampus, amygdala, hypothalamus, midbrain, and cerebral cortex (p < 0.001), as compared to changes observed in PBMCs.

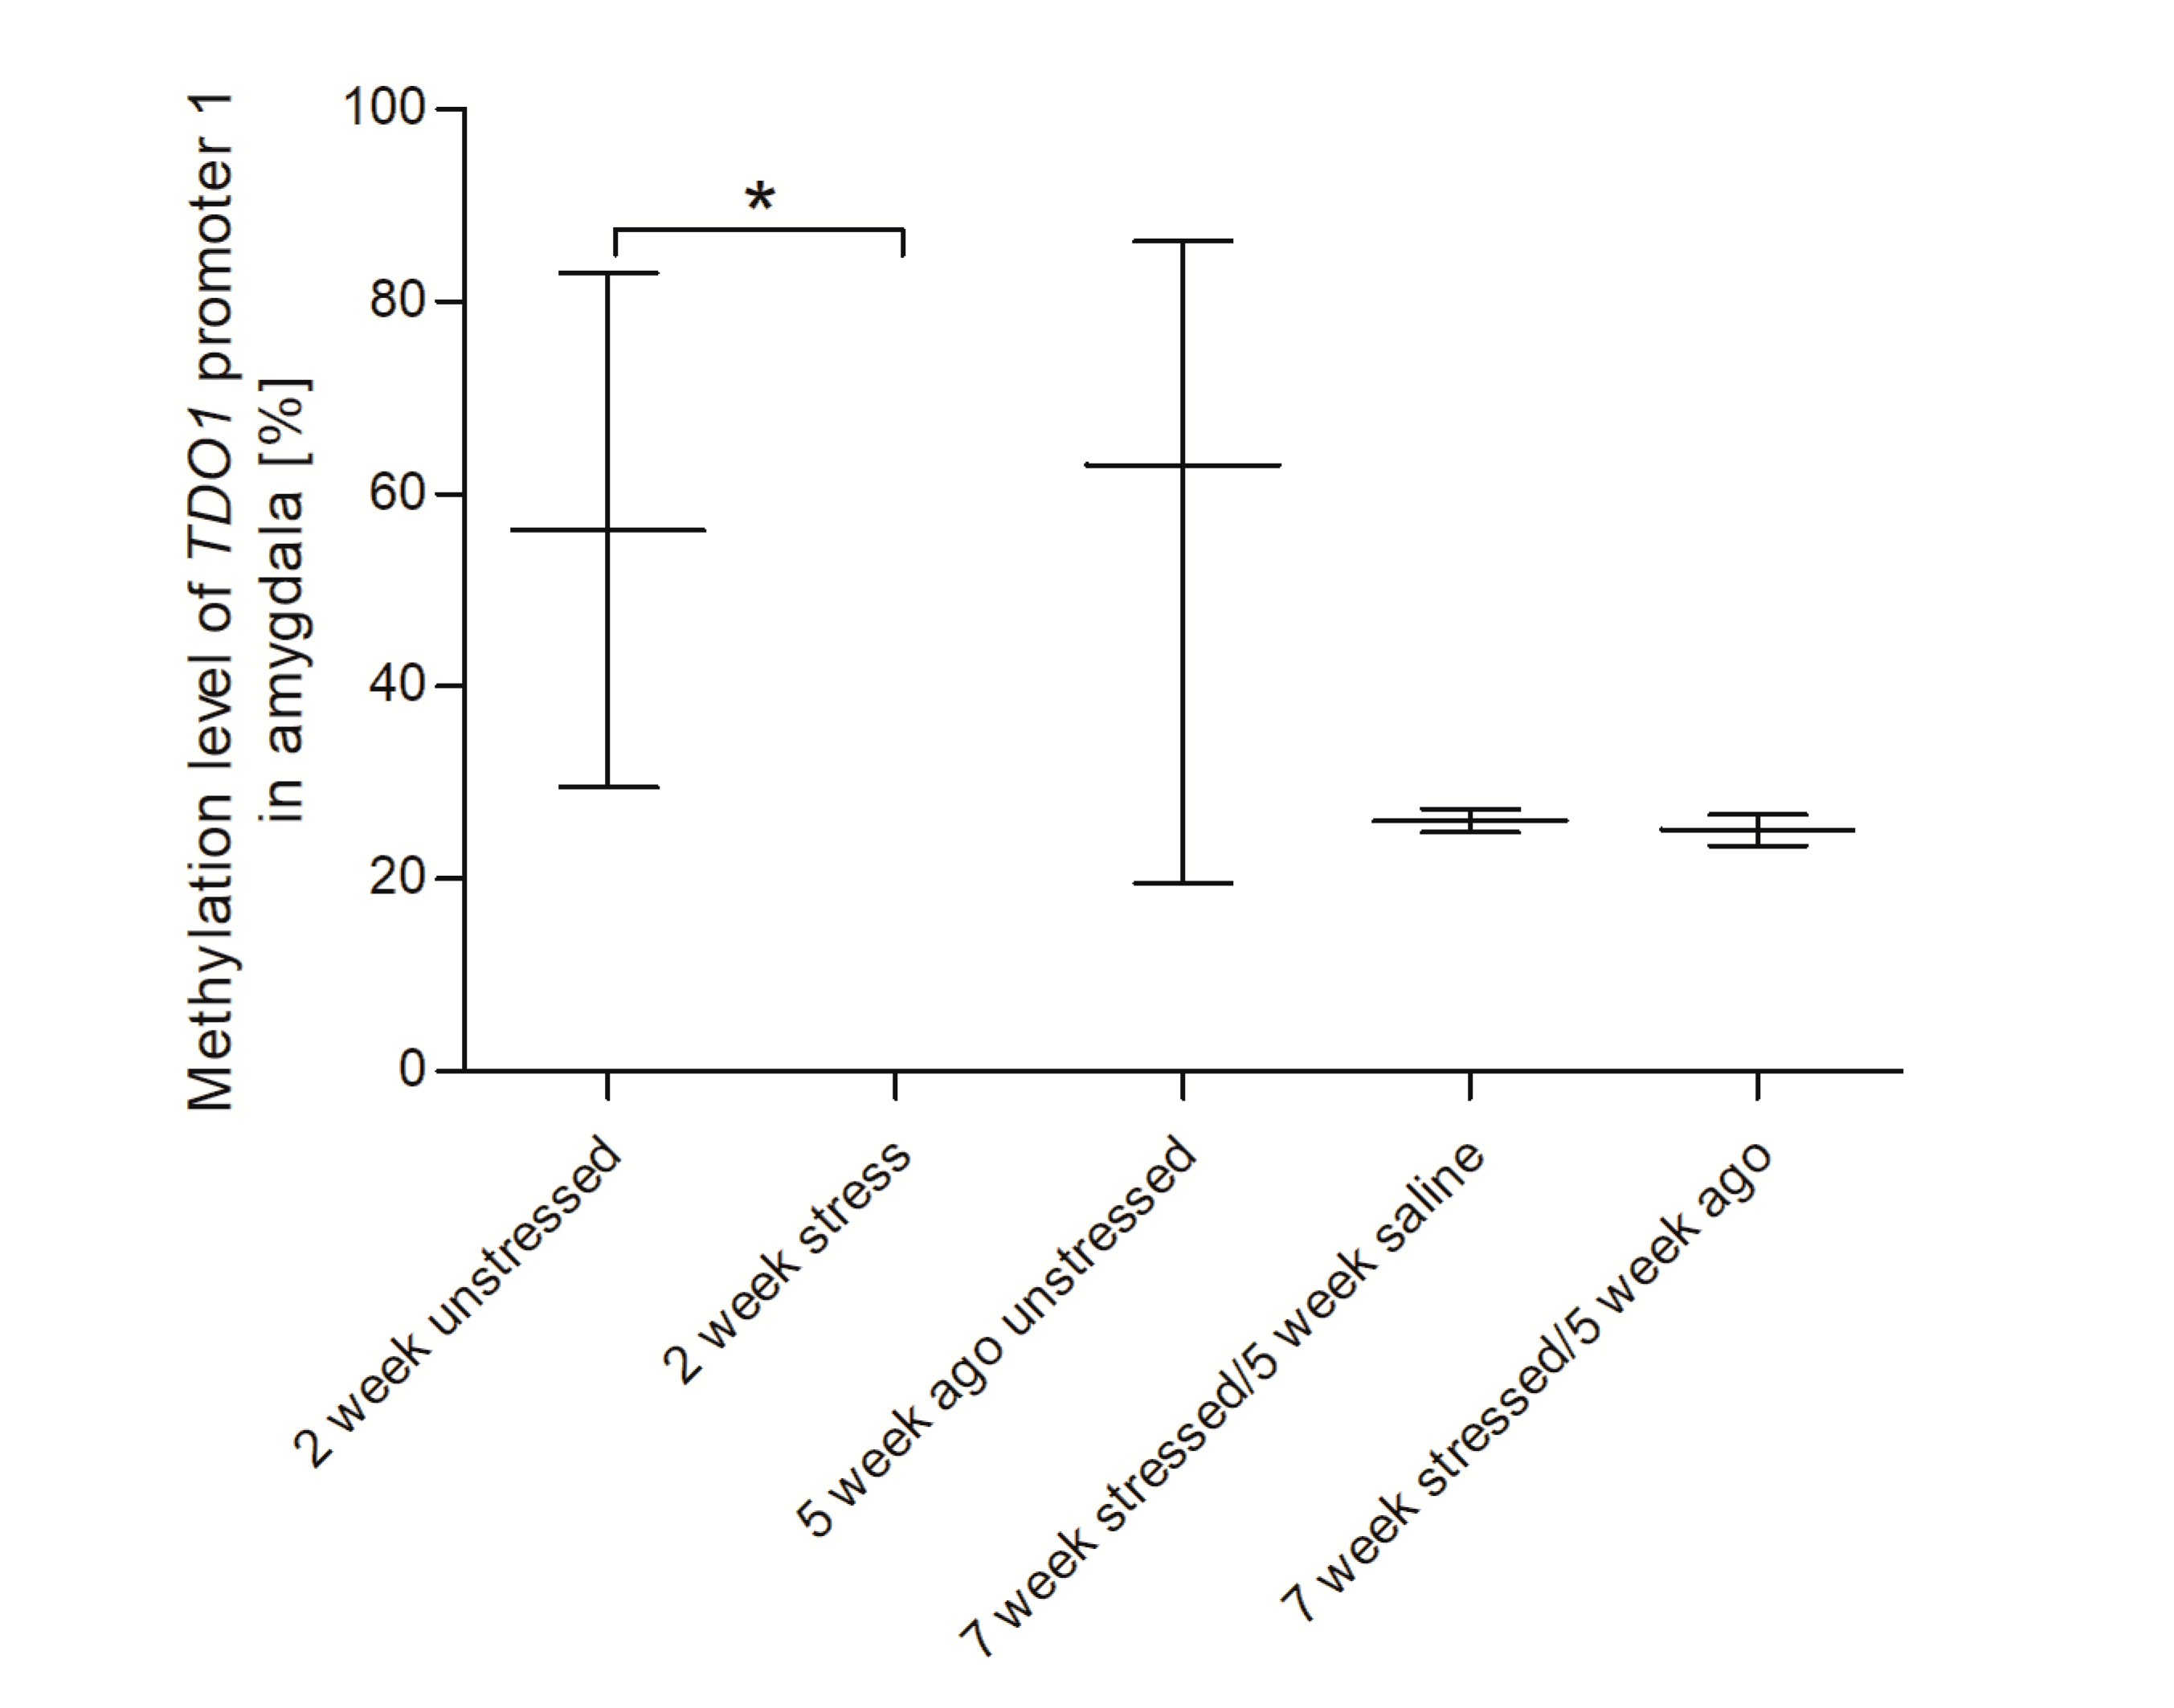
3.4. Methylation Status of Promoter Region of Genes Encoding Tryptophan Catabolic Pathway Enzymes in PBMCs and Brain Structures

As shown in Figure 4 and Table S4 (Supplementary Materials), we only found that the 7 weeks stressed/5 weeks agomelatine group was characterized by downregulation of first Tdo2 promoter methylation in the amygdala (F = 9.596, df = 4, p < 0.05, Tukey test p < 0.05). Moreover, the stress procedure and agomelatine therapy caused no change in the methylation of other promoter regions in all studied brain structures (Tables S3 and S4, Supplementary Materials). In the case of PBMCs, neither stress procedure nor chronic agomelatine administration had any significant effect on the methylation status of all studied genes (Figure S2 and Table S4, Supplementary Materials).

3.5. Agomelatine Impact on the Methylation Status of Gene Promoters in PBMCs and Brain Structures

We assessed the direction of changes due to agomelatine treatment in PBMCs and brain structures. To this end, we determined the difference between the methylation level in the 7 weeks stressed/5 weeks agomelatine group and the methylation level in the 2 weeks stressed group. As shown in Figure S3 (Supplementary Materials), significant differences were only observed in the effect of agomelatine treatment on the methylation level of the second Tdo2 promoter region. In particular, the 7 weeks stressed/5 week agomelatine group was characterized by reduced methylation status in the hippocampus (p < 0.05), hypothalamus (p < 0.01), midbrain (p < 0.01), cerebral cortex (p < 0.001), and basal ganglia (p < 0.01).

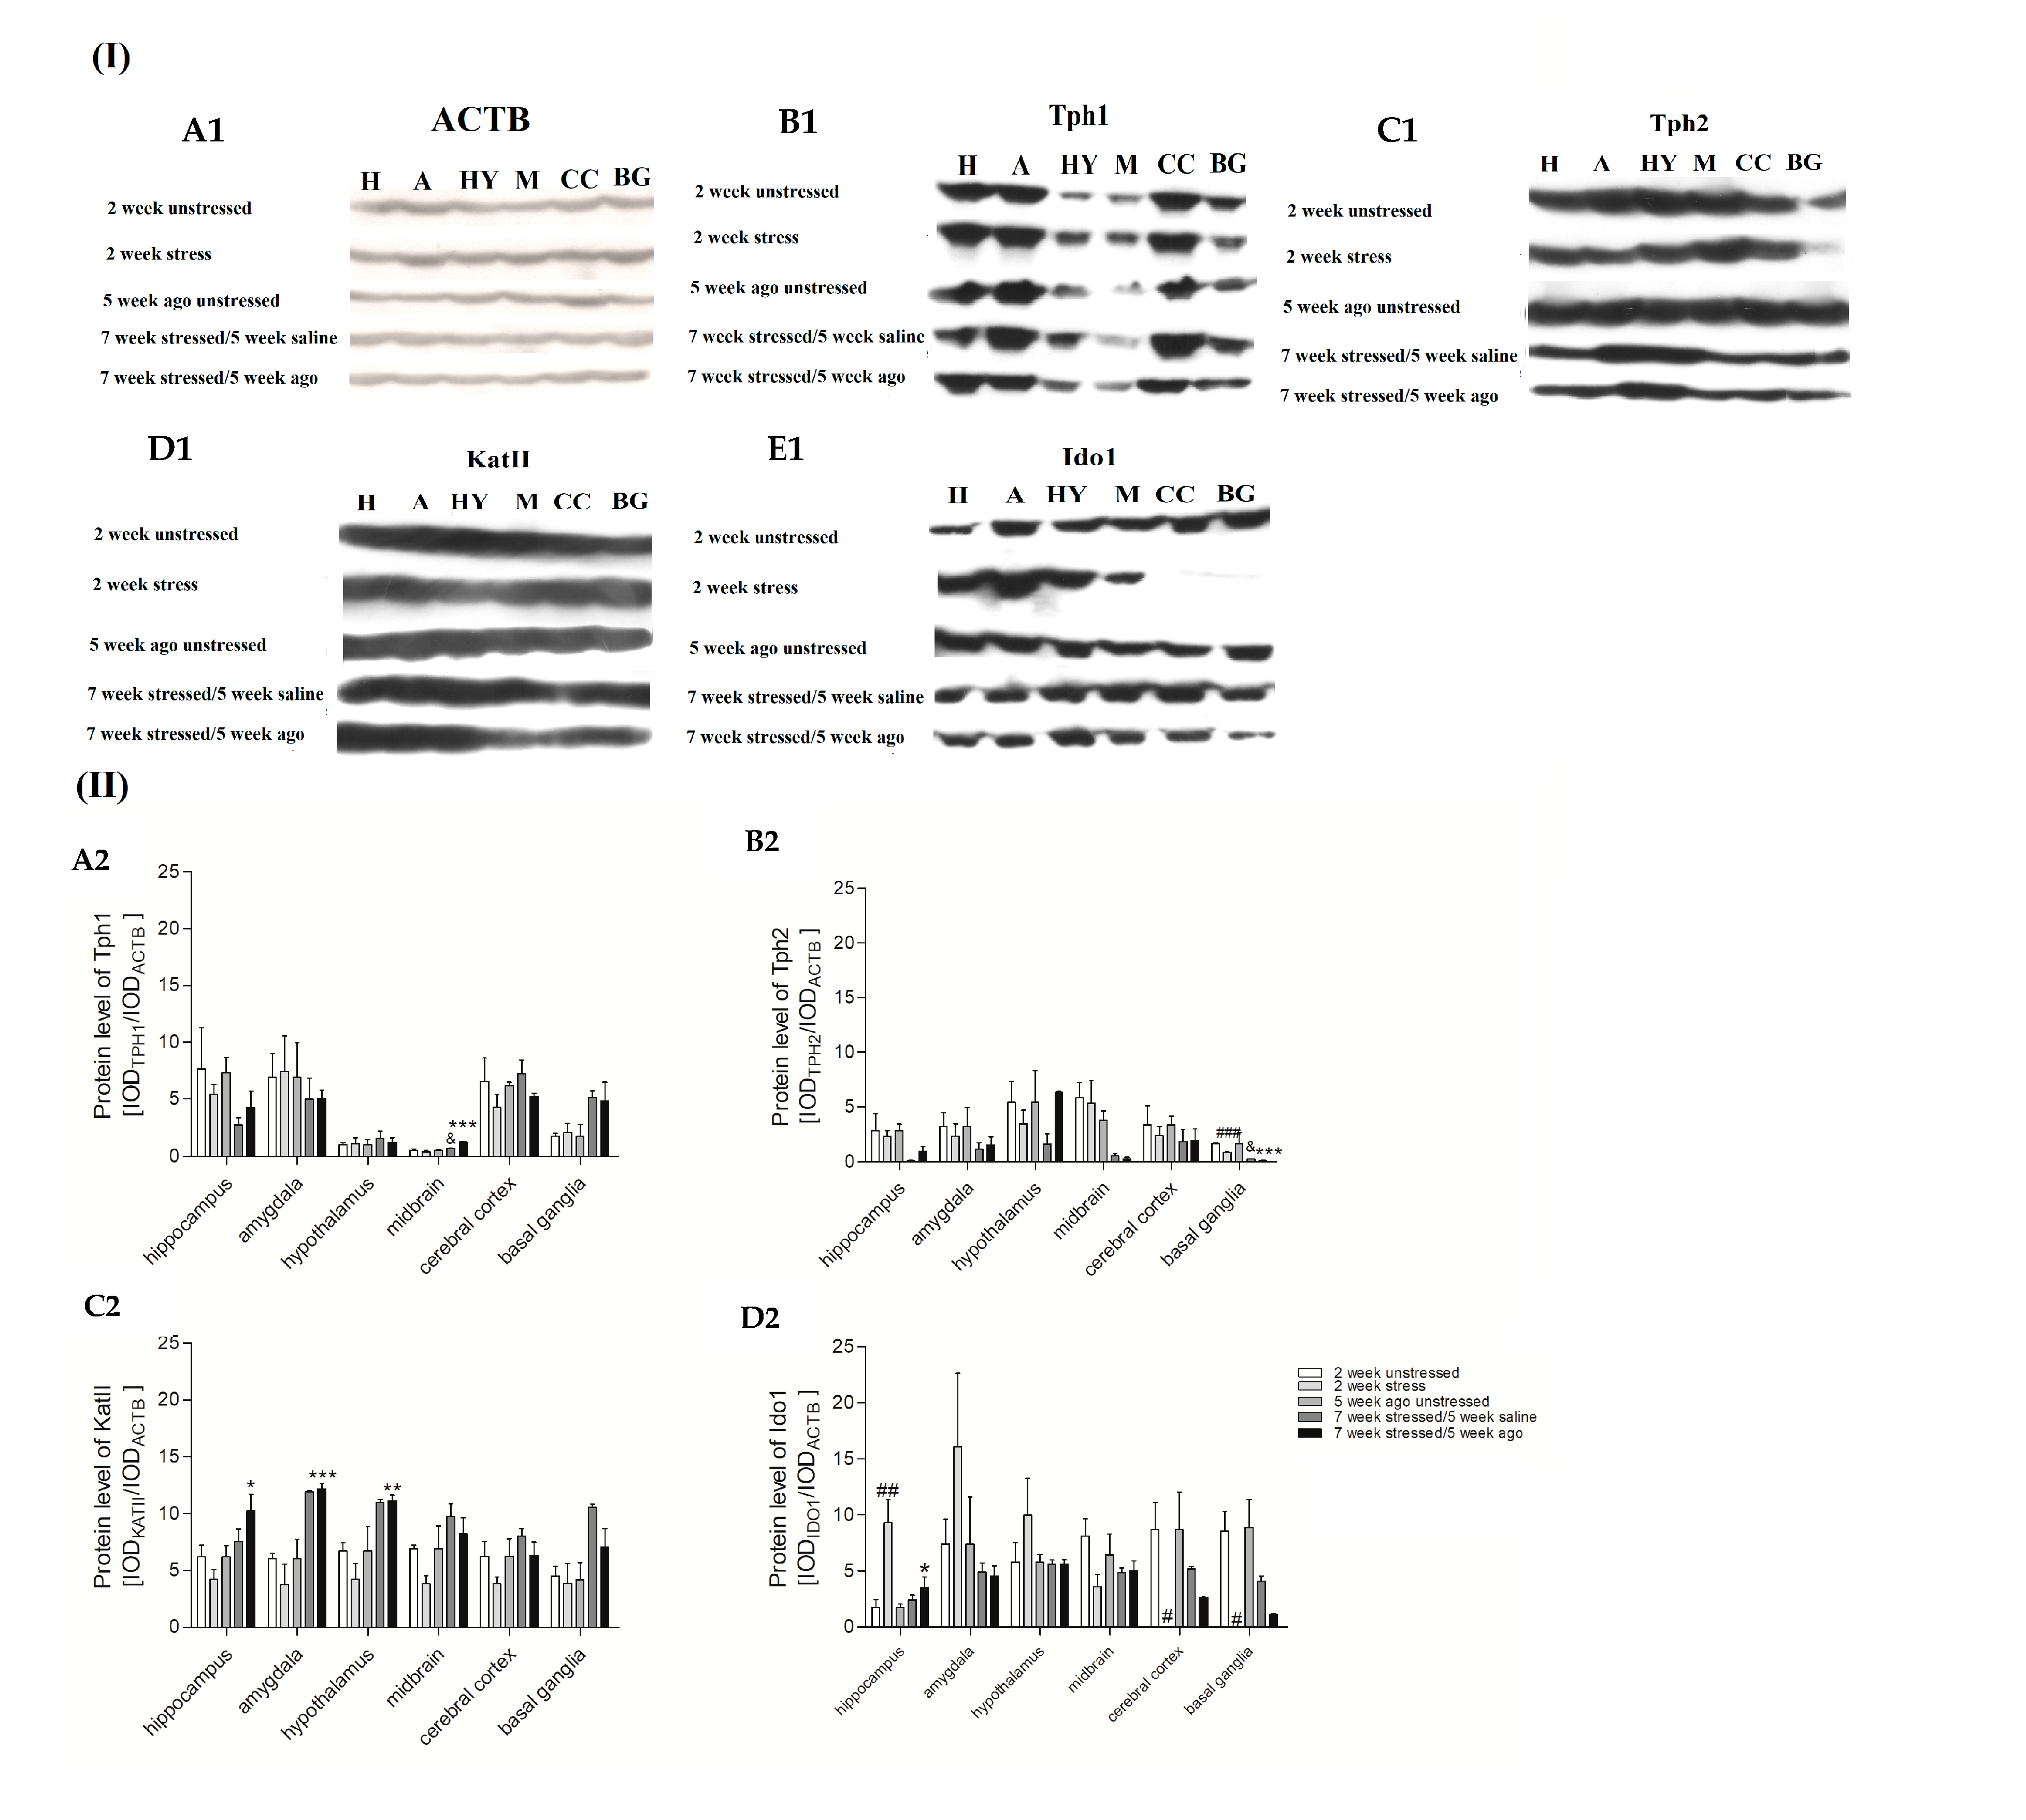
3.6. Protein Expression Level in Brain Structures

The protein expression level of Tph1, Tph2, Ido1, and KatII differed between the studied groups (Figure 5 and Figure S4, Supplementary Materials). In particular, we found that 5 weeks of chronic administration of agomelatine caused an increase in Tph1 protein expression in the midbrain of rats stressed for 7 weeks as compared to the 2 weeks stressed group (F = 17.550, df = 4, p < 0.001, Tukey test p < 0.001) and 7 weeks stressed/5 weeks saline group (F = 17,550, df = 4, p < 0.001, Tukey test p < 0.05). In the case of Tph2, the 2 week stress procedure led to the reduction in protein level in the basal ganglia (F = 15.700, df = 4, p < 0.001, Tukey test p < 0.001), whereas the 7 weeks stressed/5 weeks agomelatine group was characterized by a further reduction in the protein level as compared to the 2 weeks stressed group (F = 15.700, df = 4, p < 0.001, Tukey test p < 0.001) and the 7 weeks stressed rats/5 weeks saline group (F = 15.700, df = 4, p < 0.001, Tukey test p < 0.05) in the basal ganglia. Moreover, the 2 weeks of stress caused a decrease in the Ido1 protein level in the cerebral cortex (F = 10.116, df = 4, p < 0.05, Tukey test p < 0.05) and basal ganglia (F = 10.532, df = 4, p < 0.05, Tukey test p < 0.05). However, in the hippocampus, the expression of the protein was increased in the 2 weeks stressed group (F = 8.217, df = 4, p < 0.01, Tukey test p < 0.01), and this effect was normalized in the 7 weeks stressed/5 weeks agomelatine group (F = 8.217, df = 4, p < 0.01, Tukey test p < 0.05). In addition, 7 weeks of stress and 5 weeks of agomelatine chronic administration caused an increase in the KatII protein expression in the hippocampus (F = 4.863, df = 4, p < 0.05, Tukey test p < 0.05), hypothalamus (F = 15.923, df = 4, p < 0.001, Tukey test p < 0.01), and amygdala (F = 19.002, df = 4, p < 0.001, Tukey test p < 0.001). Unfortunately, the protein expression of KatII was undetectable in all studied brain structures.

4. Discussion

The mechanism of depression development remains elusive, and further research is needed on changes in the brain and blood of patients with depression. A chance to conduct studies on animal models represents a unique opportunity to better understand the mechanism of depression development and action of the antidepressants. Several reports suggest that the CMS procedure leads to the development of depression-like behavior, including anhedonia; thus, it can be an animal model of depression [41,42]. There are a few main factors responsible for the occurrence of depression-like behaviors, such as genetic and environmental factors associated with disorders of the tryptophan catabolic pathway [43]. The present study also confirmed that the CMS procedure and administration of agomelatine may modulate the expression level and the status of promoter methylation of genes encoding enzymes involved in tryptophan metabolism in PBMCs and various brain structures. The first main finding of our results showed that the 2 week stress procedure caused an increase in Kmo mRNA expression in the PBMCs and a decrease in Kat mRNA expression in the cerebral cortex. Kmo action leads to the generation of 3-hydroxykynurenine, which is known as a potential endogenous neurotoxin [44], whereas Kat produces neuroprotective kynurenic acid [45]. Therefore, changes in the expression level of genes encoding these enzymes may be associated with neurodegenerative processes observed in patients with depression [46]. Moreover, we observed that five weeks of agomelatine-based therapy in rats stressed for seven weeks caused a reduction in the Kmo expression, which may lead to a decrease in the kynurenic acid/3-hydroxykinurenine (KYNA/3-HK) ratio [47]. The spared nerve injury (SNI) model also confirmed that stressed mice were characterized by increased mRNA and Kmo protein expression mostly in the hippocampal neurons [48]. On the other hand, Wang et al. (2018) observed no differences in Kmo activity between control and chronic unpredictable mild stress groups [49]. In the case of KatII, CMS caused a downregulation of mRNA expression in the cortex [50]. On the other hand, we observed that chronic administration of agomelatine for five weeks led to an increase in the KatII protein expression in the hippocampus, hypothalamus, and amygdala of rats stressed for seven weeks. Similarly, regarding the mRNA expression level, Kocki et al. (2018) found that the cortical and hippocampal expression of KatI and KatII genes was increased after chronic, but not single administration of all studied antidepressants (amitriptyline, imipramine, fluoxetine, and citalopram) [51].
Our results suggest that the Tdo2 may be involved in the mechanism of depression development. We found that the 2 week stress procedure caused downregulation of the second Tdo2 promoter methylation in the amygdala but we observed no change in the level of expression. However, in the case of chronic social stress, mice were characterized by an increased level of Tdo2 and Ido2 expression in liver [52]. Additionally, we found that the 2 week stress group was characterized by decreased Ido1 protein level in the cerebral cortex and basal ganglia. However, in the case of the hippocampus, we found that the level of the Ido1 protein expression was increased after 2 weeks of stress, and these effects were normalized by 5 weeks of agomelatine treatment in rats stressed for 7 weeks. Similarly, earlier studies also showed that critical incident stress and chronic social stress increased the level of mRNA and protein expression in the hippocampus and enzyme activity in plasma, and these effects were normalized by fluoxetine therapy [53,54]. Additionally, previous studies demonstrated that the increased level of Ido1 may lead to overproduction of neurotoxic metabolites and deficit of tryptophan and may contribute to inhibition of serotonin production [55,56]. Moreover, a blockade of Ido1 activation prevented the development of depressive-like behavior, and this could be used to design antidepressants [57]. Furthermore, Ido1 gene knockout or pharmacological inhibition of its activity in the hippocampus attenuated both nociceptive and depressive behavior [54].
The next main finding of our study is that the Tph2 protein expression was reduced after the 2 week stress procedure in the basal ganglia, whereas 5 weeks of chronic administration of agomelatine caused a further reduction in the Tph2 protein level in rats stressed for 7 weeks. Similarly, chronic immobilization stress caused a decrease in mRNA and protein expression of Tph2 in the hippocampus, but fluoxetine therapy (SSRIs) normalized this effect [53]. On the other hand, Jacobsen et al. (2012) suggested that depression may be associated with Tph2 excess, which may lead to tryptophan depletion [58]. In turn, Chen et al. (2017) found that the stressed animals were characterized by an increased level of Tph1/Tph2 promoter methylation which was normalized by therapy with paroxetine [5]. However, in the case of Tph1, we found that the 7 weeks stressed/5 weeks agomelatine group was characterized by an increase in protein expression in the midbrain.
The last studied gene was Kynu. We found no differences between all studied groups in the mRNA and protein expression, as well as the methylation status of the promoter region. However, the mice, after chronic unpredictable mild stress, were characterized by elevated Kynu mRNA expression in the hippocampus [59].
All in all, our present study is the first to report that CMS and agomelatine affect the mRNA and protein expression, as well as methylation status of promoter regions, of genes involved in the tryptophan catabolic pathway in the blood and the brain structures. Due to the number of participants and the availability of posthumous brain tissue, comparative human studies are limited. Thus, the use of a validated animal model of depression may enable researchers to recognize genes involved in the mechanism of depression development and, in the future, may help to identify peripheral markers of the central nervous system pathology.
Depression is a heterogeneous disease, and patients with depression are characterized by various clinical symptoms. These symptoms are often contradictory in the different patients observed—excessive or lack of appetite and insomnia or excessive sleepiness. Thus, developing a stable model of this disease is very difficult and, unfortunately, the use of a chronic mild stress model of depression has some limitations. Moreover, the disease genes for depression are unknown, which limits the applicability of transgenic models in studies [60]. Another concern is related to the interpretation of the obtained results. It should be remembered that the 2 weeks stressed group was exposed to stress stimuli for a period of two weeks, and the group treated with agomelatine underwent treatment for a total of seven weeks (including five weeks of antidepressant therapy). Therefore, the obtained results should be treated with caution, which, in the future, should be compared with the results of studies conducted in humans. However, our research may facilitate the development of more stable transgenic models of depression.

5. Conclusions

Our study suggested that the tryptophan catabolic pathway may be involved in the effects of chronic mild stress and agomelatine treatment. More specifically, (i) the CMS procedure changed the expression of Kmo in PBMCs and of KatI and KatII in the brain at the mRNA level, (ii) chronic administration of agomelatine affected the mRNA expression of Kmo in the PBMCs, (iii) changes in methylation of the second promoter of Tdo2 were caused only by the CMS procedure in the brain, (iv) CMS and agomelatine therapy modulated the protein expression level of Tph1, Tph2, Ido1, and KatII in the brain, and (v) the results obtained using peripheral tissue could predict the condition of the brain; however, this was dependent on the brain structure. Our presented findings confirm that depression development and antidepressant treatment with agomelatine may modulate the mRNA and protein expression levels and methylation status of the promoter region of genes involved in the TRYCAT pathway.

Supplementary Materials

The following are available online at https://www.mdpi.com/2073-4425/11/9/1093/s1, Figure S1: The effect of agomelatine therapy on mRNA expression of Tph1 (A), Tph2 (B), KatI (C), KatII (D), Kmo (E) and Kynu (F) in PBMCs and in brain structures of animals exposed to CMS procedure for seven weeks and agomelatine administration (10 mg/kg) for five weeks (7 week stressed/5 week agomelatine), Figure S2: Methylation level of Tph1 promoter (A), Ido1 promoter (B), Tdo2 promoter 1 (C) and Kmo promoter (D) in PBMCs of animals exposed to CMS for two weeks (2 week stress, 2 week unstressed) and in animals exposed to CMS for seven weeks and administered vehicle (1 mL/kg) or agomelatine (10 mg/kg) for five weeks (5 week agomelatine unstressed, 7 week stressed/5 week saline, and 7 week stressed/5 week agomelatine), Figure S3: The methylation level of Tph1 (A), Ido1 (B), Tdo2 promoter 1 (C) promoter 2 (D), Kmo (E) between brain structures and PBMCs of animals exposed to CMS for seven weeks and administered vehicle (1 mL/kg) or agomelatine (10 mg/kg) for five weeks (7 week stressed/5 week saline, 7 week stressed/5 week agomelatine), Figure S4: Protein expression of Kynu in animals exposed to CMS for two weeks (control, stressed) and in animals exposed to CMS for seven weeks and administered vehicle (1 mL/kg) or agomelatine (10 mg/kg) for five weeks (control/ago, stressed/saline, stressed/ago), Table S1: The characteristics of primers used for analysis of methylation levels in the promoter regions of the studied genes, Table S2: Conditions of the antibodies used in the Western blot analysis, Table S3: Methylation level of Ido1 promoter (A), Tph1 promoter (B), Tdo2 promoter 1 (C), Tdo2 promoter 2 (D) and Kmo (E) in hippocampus, amygdala, hypothalamus, midbrain, cortex and basal ganglia of animals exposed to CMS for two weeks (2 week unstressed, 2 week stress) and in animals exposed to CMS for seven weeks and administered vehicle (1 mL/kg) or agomelatine (10 mg/kg) for five weeks (5 week ago unstressed, 7 week stressed/5 week saline, and 7 week stressed/5 week ago), Table S4: Statistical information for analysis of mRNA expression level and methylation status of promoter region in PBMCs and brain structures (A) Statistical parameters for analysis of mRNA expression level in PBMCs and brain structures (B) Statistical parameters for analysis of methylation status of promoter region in PBMCs and brain structures (C) Statistical parameters for analysis of protein expression in brain structures.

Author Contributions

Conceptualization, J.S., M.P. and T.S.; data curation, T.S.; formal analysis, P.W., E.S. and M.P.; funding acquisition, T.S.; investigation, P.W., E.S., P.J., P.C., K.B., M.B. and P.G.; methodology, P.W., E.S., P.J., P.C., K.B., M.B., M.P. and T.S.; project administration, P.G. and T.S.; supervision, T.S.; validation, P.W., E.S., P.J., P.C., P.G. and M.P.; writing—original draft, P.W.; writing—review and editing, M.B., J.S., M.P. and T.S. All authors have read and agreed to the published version of the manuscript.

Funding

This study was funded by the National Science Center of Poland, grant (2015/19/BNZ7/00410).

Conflicts of Interest

The authors declare no conflict of interest.

References

  1. World Health Organization—Depression. Available online: https://www.who.int/news-room/fact-sheets/detail/depression (accessed on 16 March 2020).
  2. Kessler, R.C.; Berglund, P.; Demler, O.; Jin, R.; Koretz, D.; Merikangas, K.R.; Rush, A.J.; Walters, E.E.; Wang, P.S. The epidemiology of major depressive disorder: Results from the National Comorbidity Survey Replication (NCS-R). JAMA 2003, 289, 3095–3105. [Google Scholar] [CrossRef] [PubMed]
  3. Capuron, L.; Ravaud, A.; Neveu, P.J.; Miller, A.H.; Maes, M.; Dantzer, R. Association between decreased serum tryptophan concentrations and depressive symptoms in cancer patients undergoing cytokine therapy. Mol. Psychiatr. 2002, 7, 468–473. [Google Scholar] [CrossRef] [PubMed] [Green Version]
  4. Ogawa, S.; Fujii, T.; Koga, N.; Hori, H.; Teraishi, T.; Hattori, K.; Noda, T.; Higuchi, T.; Motohashi, N.; Kunugi, H. Plasma L-tryptophan concentration in major depressive disorder: New data and meta-analysis. J. Clin. Psychiatr. 2014, 75, e906–e915. [Google Scholar] [CrossRef]
  5. Chen, Y.; Xu, H.; Zhu, M.; Liu, K.; Lin, B.; Luo, R.; Chen, C.; Li, M. Stress inhibits tryptophan hydroxylase expression in a rat model of depression. Oncotarget 2017, 8, 63247–63257. [Google Scholar] [CrossRef] [PubMed] [Green Version]
  6. Wigner, P.; Czarny, P.; Synowiec, E.; Bijak, M.; Białek, K.; Talarowska, M.; Galecki, P.; Szemraj, J.; Sliwinski, T. Association between single nucleotide polymorphisms of TPH1 and TPH2 genes, and depressive disorders. J. Cell. Mol. Med. 2018, 22, 1778–1791. [Google Scholar] [CrossRef] [Green Version]
  7. Wigner, P.; Czarny, P.; Synowiec, E.; Bijak, M.; Talarowska, M.; Galecki, P.; Szemraj, J.; Sliwinski, T. Variation of genes encoding KAT1, AADAT and IDO1 as a potential risk of depression development. Eur. Psychiatr. 2018, 52, 95–103. [Google Scholar] [CrossRef] [PubMed]
  8. Maes, M.; Leonard, B.E.; Myint, A.M.; Kubera, M.; Verkerk, R. The new ‘5-HT’ hypothesis of depression: Cell-mediated immune activation induces indoleamine-2,3-dioxygenase, which leads to lower plasma tryptophan and an increased synthesis of detrimental tryptophan catabolites (TRYCATs), both of which contribute to the onset of depression. Prog. Neuro-Psychopharmacol. Biol. Psychiatr. 2011, 35, 702–721. [Google Scholar]
  9. Maes, M.; Galecki, P.; Verkerk, R.; Rief, W. Somatization, but not depression, is characterized by disorders in the tryptophan catabolite (TRYCAT) pathway, indicating increased indoleamine 2,3-dioxygenase and lowered kynurenine aminotransferase activity. Neuroendocr. Lett. 2011, 32, 264–273. [Google Scholar]
  10. Lezheiko, T.V.; Golimbet, V.E.; Andryushchenko, A.V.; Melik-Pashayan, A.E.; Mironova, E.V. A study of the association between the kynurenine-3-monooxygenase gene and depression. Zhurnal Nevrol. Psikhiatrii Im. SS Korsakova 2016, 116, 92–95. [Google Scholar] [CrossRef]
  11. Kwidzinski, E.; Bechmann, I. IDO expression in the brain: A double-edged sword. J. Mol. Med. 2007, 85, 1351–1359. [Google Scholar] [CrossRef] [Green Version]
  12. Smith, D.F. Quest for biomarkers of treatment-resistant depression: Shifting the paradigm toward risk. Front. Psychiatr. 2013, 18, 57. [Google Scholar] [CrossRef] [PubMed] [Green Version]
  13. Zhang, X.; Gainetdinov, R.R.; Beaulieu, J.M.; Sotnikova, T.D.; Burch, L.H.; Williams, R.B.; Schwartz, D.A.; Krishnan, K.R.; Caron, M.G. Loss-of-function mutation in tryptophan hydroxylase-2 identified in unipolar major depression. Neuron 2005, 45, 11–16. [Google Scholar] [CrossRef] [PubMed] [Green Version]
  14. Bestor, T.; Laudano, A.; Mattaliano, R.; Ingram, V. Cloning and sequencing of a cDNA encoding DNA methyltransferase of mouse cells. The carboxyl-terminal domain of the mammalian enzymes is related to bacterial restriction methyltransferases. J. Mol. Biol. 1988, 203, 971–983. [Google Scholar] [CrossRef]
  15. Okano, M.; Bell, D.W.; Haber, D.A.; Li, E. DNA methyltransferases Dnmt3a and Dnmt3b are essential for de novo methylation and mammalian development. Cell 1999, 99, 247–257. [Google Scholar] [CrossRef] [Green Version]
  16. Guidotti, A.; Auta, J.; Chen, Y.; Davis, J.M.; Dong, E.; Gavin, D.P.; Grayson, D.R.; Matrisciano, F.; Pinna, G.; Satta, R.; et al. Epigenetic GABAergic targets in schizophrenia and bipolar disorder. Neuropharmacology 2011, 60, 1007–1016. [Google Scholar] [CrossRef] [PubMed] [Green Version]
  17. Poulter, M.O.; Du, L.; Weaver, I.C.G.; Palkovits, M.; Faludi, G.; Merali, Z.; Szyf, M.; Anisman, H. GABAA receptor promoter hypermethylation in suicide brain: Implications for the involvement of epigenetic processes. Biol. Psychiatr. 2008, 64, 645–652. [Google Scholar] [CrossRef]
  18. Melas, P.A.; Rogdaki, M.; Lennartsson, A.; Bjork, K.; Qi, H.; Witasp, A.; Werme, M.; Wegener, G.; Mathe, A.A.; Svenningsson, P.; et al. Antidepressant treatment is associated with epigenetic alterations in the promoter of P11 in a genetic model of depression. Int. J. Neuropsychopharmacol. 2011, 15, 669–679. [Google Scholar] [CrossRef] [Green Version]
  19. Kessler, R.C.; Demler, O.; Frank, R.G.; Olfson, M.; Pincus, H.A.; Walters, E.E.; Wang, P.; Wells, K.B.; Zaslavsky, A.M. Prevalence and treatment of mental disorders, 1990 to 2003. N. Engl. J. Med. 2005, 352, 2515–2523. [Google Scholar] [CrossRef] [Green Version]
  20. Parikh, S.V.; Lam, R.W.; CANMAT Depression Work Group. Clinical guidelines for the treatment of depressive disorders, I. Definitions, prevalence, and health burden. Can. J. Psychiatr. 2001, 46, 13S–20S. [Google Scholar]
  21. Frank, E.; Prien, R.F.; Jarrett, R.B.; Keller, M.B.; Kupfer, D.J.; Lavori, P.W.; Rush, A.J.; Weissman, M.M. Conceptualization and rationale for consensus definitions of terms in major depressive disorder: Remission, recovery, relapse, and recurrence. Arch. Gen. Psychiatr. 1991, 48, 851–856. [Google Scholar] [CrossRef]
  22. Kennedy, S.H.; Eisfeld, B.S.; Meyer, J.H.; Bagby, R.M. Antidepressants in clinical practice: Limitations of assessment methods and drug response. Human Psychopharmacol. Clin. Exp. 2001, 16, 105–114. [Google Scholar] [CrossRef] [PubMed]
  23. Vanderkooy, J.D.; Kennedy, S.H.; Bagby, R.M. Antidepressant side effects in depression patients treated in a naturalistic setting: A study of bupropion, moclobemide, paroxetine, sertraline, and venlafaxine. Can. J. Psychiatr. 2002, 47, 174–180. [Google Scholar] [CrossRef] [PubMed]
  24. Zajecka, J.M. Augmentation strategies to increase antidepressant tolerability. J. Clin. Psychiatr. 2007, 68, 23–27. [Google Scholar]
  25. Zajecka, J.M. Clinical issues in long-term treatment with antidepressants. J. Clin. Psychiatr. 2000, 61, 20–25. [Google Scholar]
  26. EMA Valdoxan (Agomelatine). Summary of Product Characteristics; EMA: Amsterdam, The Netherlands, 2008. [Google Scholar]
  27. Kennedy, S.H.; Eisfeld, B.S. Agomelatine and its therapeutic potential in the depressed patient. Neuropsychiatr. Dis. Treat. 2007, 3, 423–428. [Google Scholar]
  28. Popoli, M. Agomelatine: Innovative pharmacological approach in depression. CNS Drugs 2009, 23, 27–34. [Google Scholar] [CrossRef]
  29. De Berardis, D.; Di Iorio, G.; Acciavatti, T.; Conti, C.; Serroni, N.; Olivieri, L.; Cavuto, M.; Martinotti, G.; Janiri, L.; Moschetta, F.S.; et al. The emerging role of melatonin agonists in the treatment of major depression: Focus on agomelatine. CNS Neurol. Disord. Drug Targets 2011, 10, 119–132. [Google Scholar] [CrossRef]
  30. Martinotti, G.; Sepede, G.; Gambi, F.; Di Iorio, G.; De Berardis, D.; Di Nicola, M.; Onofrj, M.; Janiri, L.; Di Giannantonio, M. Agomelatine versus venlafaxine XR in the treatment of anhedonia in major depressive disorder: A pilot study. J. Clin. Psychopharmacol. 2012, 32, 487–491. [Google Scholar] [CrossRef]
  31. Guaiana, G.; Gupta, S.; Chiodo, D.; Davies, S.J.; Haederle, K.; Koesters, M. Agomelatine versus other antidepressive agents for major depression. Cochrane Database Syst. Rev. 2013, 12, CD008851. [Google Scholar] [CrossRef] [Green Version]
  32. Montastruc, F.; Scotto, S.; Vaz, I.R.; Guerra, L.N.; Escudero, A.; Sáinz, M.; Falomir, T.; Bagheri, H.; Herdeiro, M.T.; Venegoni, M.; et al. Hepatotoxicity related to agomelatine and other new antidepressants: A case/noncase approach with information from the Portuguese, French, Spanish, and Italian pharmacovigilance systems. J. Clin. Psychopharmacol. 2014, 34, 327–330. [Google Scholar] [CrossRef]
  33. Papp, M. Models of affective illness: Chronic mild stress in the rat. Curr. Protoc. Pharmacol. 2012, 57, 5–9. [Google Scholar] [CrossRef]
  34. Schmittgen, T.D.; Livak, K.J. Analyzing real-time PCR data by the comparative C(T) method. Nat. Protoc. 2008, 3, 1101–8110. [Google Scholar] [CrossRef] [PubMed]
  35. Wojdacz, T.K.; Dobrovic, A. Methylation-sensitive high resolution melting (MS-HRM): A new approach for sensitive and high-throughput assessment of methylation. Nucleic Acids Res. 2007, 35, e41. [Google Scholar] [CrossRef] [PubMed] [Green Version]
  36. Wojdacz, T.K.; Dobrovic, A.; Hansen, L.L. Methylation-sensitive high-resolution melting. Nat. Protoc. 2008, 3, 1903–1908. [Google Scholar] [CrossRef] [PubMed]
  37. Wojdacz, T.K.; Borgbo, T.; Hansen, L.L. Primer design versus PCR bias in methylation independent PCR amplifications. Epigenetics 2009, 4, 231–234. [Google Scholar] [CrossRef] [PubMed] [Green Version]
  38. Laemmli, U.K. Cleavage of structural proteins during the assembly of the head of bacteriophage T4. Nature 1970, 227, 680–685. [Google Scholar] [CrossRef]
  39. Lowry, O.H.; Rosebrough, N.J.; Farr, A.L.; Randall, R.J. Protein measurement with the Folin phenol reagent. J. Biol. Chem. 1951, 193, 265–275. [Google Scholar]
  40. Towbin, H.; Staehelin, T.; Gordon, J. Electrophoretic transfer of proteins from polyacrylamide gels to nitrocellulose sheets: Procedure and some applications. Proc. Natl. Acad. Sci. USA 1979, 76, 4350–4354. [Google Scholar] [CrossRef] [Green Version]
  41. Gamaro, G.D.; Manoli, L.P.; Torres, I.L.; Silveira, R.; Dalmaz, C. Effects of chronic variate stress on feeding behavior and on monoamine levels in different rat brain structures. Neurochem. Int. 2003, 42, 107–114. [Google Scholar] [CrossRef]
  42. Bekris, S.; Antoniou, K.; Daskas, S.; Papadopoulou-Daifoti, Z. Behavioural and neurochemical effects induced by chronic mild stress applied to two different rat strains. Behav. Brain Res. 2005, 161, 45–59. [Google Scholar] [CrossRef]
  43. Réus, G.Z.; Jansen, K.; Titus, S.; Carvalho, A.; Gabbay, V.; Quevedo, J. Kynurenine pathway dysfunction in the pathophysiology and treatment of depression: Evidences from animal and human studies. J. Psychiatr. Res. 2015, 68, 316–328. [Google Scholar] [CrossRef] [PubMed] [Green Version]
  44. Okuda, S.; Nishiyama, N.; Saito, H.; Katsuki, H. 3-Hydroxykynurenine, an endogenous oxidative stress generator, causes neuronal cell death with apoptotic features and region selectivity. J. Neurochem. 1998, 70, 299–307. [Google Scholar] [CrossRef] [PubMed]
  45. Jayawickrama, G.S.; Nematollahi, A.; Sun, G.; Gorrell, M.D.; Church, W.B. Inhibition of human kynurenine aminotransferase isozymes by estrogen and its derivatives. Sci. Rep. 2017, 7, 17559. [Google Scholar] [CrossRef] [PubMed] [Green Version]
  46. Baquero, M.; Martin, N. Depressive symptoms in neurodegenerative diseases. World J. Clin. Cases 2015, 3, 682–693. [Google Scholar] [CrossRef] [PubMed]
  47. Kocki, T.; Wnuk, S.; Kloc, R.; Kocki, J.; Owe-Larsson, B.; Urbanska, E.M. New insight into the antidepressants action: Modulation of kynurenine pathway by increasing the kynurenic acid/3-hydroxykynurenine ratio. J. Neural Transm. (Vienna) 2012, 119, 235–243. [Google Scholar] [CrossRef] [PubMed]
  48. Laumet, G.; Zhou, W.; Dantzer, R.; Edralin, J.D.; Huo, X.; Budac, D.P.; O’Connor, J.C.; Lee, A.W.; Heijnen, C.J.; Kavelaars, A. Upregulation of neuronal kynurenine 3-monooxygenase mediates depression-like behavior in a mouse model of neuropathic pain. Brain Behav. Immun. 2017, 66, 94–102. [Google Scholar] [CrossRef]
  49. Wang, B.; Lian, Y.J.; Su, W.J.; Peng, W.; Dong, X.; Liu, L.L.; Gong, H.; Zhang, T.; Jiang, C.L.; Wang, Y.X. HMGB1 mediates depressive behavior induced by chronic stress through activating the kynurenine pathway. Brain Behav. Immun. 2018, 72, 51–60. [Google Scholar] [CrossRef]
  50. Duda, W.; Curzytek, K.; Kubera, M.; Connor, T.J.; Fagan, E.M.; Basta-Kaim, A.; Trojan, E.; Papp, M.; Gruca, P.; Budziszewska, B.; et al. Interaction of the immune-inflammatory and the kynurenine pathways in rats resistant to antidepressant treatment in model of depression. Int. Immunopharmacol. 2019, 73, 527–538. [Google Scholar] [CrossRef]
  51. Kocki, T.; Urbańska, E.M.; Kocki, J.; Kloc, R.; Kocka, K.; Olajossy, M.; Owe-Larsson, B. Prolonged therapy with antidepressants increases hippocampal level of kynurenic acid and expression of Kat1 and Kat2 genes. Pharmacol. Rep. 2018, 70, 737–745. [Google Scholar] [CrossRef]
  52. Bergamini, G.; Mechtersheimer, J.; Azzinnari, D.; Sigrist, H.; Buerge, M.; Dallmann, R.; Freije, R.; Kouraki, A.; Opacka-Juffry, J.; Seifritz, E.; et al. Chronic social stress induces peripheral and central immune activation, blunted mesolimbic dopamine function, and reduced reward-directed behaviour in mice. Neurobiol. Stress 2018, 8, 42–56. [Google Scholar] [CrossRef] [PubMed]
  53. Jiao, H.; Yan, Z.; Ma, Q.; Li, X.; Jiang, Y.; Liu, Y.; Chen, J. Influence of Xiaoyaosan on depressive-like behaviors in chronic stress-depressed rats through regulating tryptophan metabolism in hippocampus. Neuropsychiatr. Dis. Treat. 2018, 15, 21–31. [Google Scholar] [CrossRef] [PubMed] [Green Version]
  54. Kim, H.; Chen, L.; Lim, G.; Sung, B.; Wang, S.; McCabe, M.F.; Rusanescu, G.; Yang, L.; Tian, Y.; Mao, J. Brain indoleamine 2,3-dioxygenase contributes to the comorbidity of pain and depression. J. Clin. Investig. 2012, 122, 2940–2954. [Google Scholar] [CrossRef] [PubMed] [Green Version]
  55. Myint, A.M.; Kim, Y.K.; Verkerk, R.; Scharpé, S.; Steinbusch, H.; Leonard, B. Kynurenine pathway in major depression: Evidence of impaired neuroprotection. J. Affect. Disord. 2007, 98, 143–151. [Google Scholar] [CrossRef] [PubMed]
  56. Wichers, M.C.; Koek, G.H.; Robaeys, G.; Verkerk, R.; Scharpé, S.; Maes, M. IDO and interferon-α-induced depressive symptoms: A shift in hypothesis from tryptophan depletion to neurotoxicity. Mol. Psychiatr. 2005, 10, 538–544. [Google Scholar] [CrossRef] [PubMed] [Green Version]
  57. Xie, W.; Cai, L.; Yu, Y.; Gao, L.; Xiao, L.; He, Q.; Ren, Z.; Liu, Y. Activation of brain indoleamine 2,3-dioxygenase contributes to epilepsy-associated depressive-like behavior in rats with chronic temporal lobe epilepsy. J. Neuroinflamm. 2014, 11, 41. [Google Scholar] [CrossRef] [Green Version]
  58. Jacobsen, J.P.; Siesser, W.B.; Sachs, B.D.; Peterson, S.; Cools, M.J.; Setola, V.; Folgering, J.H.; Flik, G.; Caron, M.G. Deficient serotonin neurotransmission and depression-like serotonin biomarker alterations in tryptophan hydroxylase 2 (Tph2) loss-of-function mice. Mol. Psychiatr. 2012, 17, 694–704. [Google Scholar] [CrossRef] [PubMed] [Green Version]
  59. Wang, J.; Li, X.; He, S.; Hu, L.; Guo, J.; Huang, X.; Hu, J.; Qi, Y.; Chen, B.; Shang, D.; et al. Regulation of the kynurenine metabolism pathway by Xiaoyao San and the underlying effect in the hippocampus of the depressed rat. J. Ethnopharmacol. 2018, 214, 13–21. [Google Scholar] [CrossRef]
  60. Wiborg, O. Chronic mild stress for modeling anhedonia. Cell Tissue Res. 2013, 354, 155–169. [Google Scholar] [CrossRef]
Figure 1. The course of the experiment of chronic mild stress (CMS) and agomelatine therapy (A). Sucrose intake test in rats exposed to CMS for two weeks (week 2) and in animals exposed to CMS for seven weeks (week 7) and administered vehicle (1 mL/kg) or agomelatine (10 mg/kg) for five weeks (B). The consumption of 1.0% sucrose solution was measured in a 1 h test by weighing pre-weighed bottles. The data represent means ± standard error of the mean (SEM); n = 6; ## p < 0.01 relative to week 2 in the 2 weeks stressed group, & p < 0.05 relative to week 2 in the 5 weeks agomelatine unstressed group, ** p < 0.01 relative to week 2 in the 7 weeks stressed/5 weeks agomelatine group, *** p < 0.001 relative to week 7 in the 7 weeks stressed/5 weeks agomelatine group.
Genes 11 01093 g001
Figure 2. Tph1 (A), KatI (B), Kmo (C), and Kynu (D) messenger RNA (mRNA) expression in peripheral blood mononuclear cells (PBMCs0 of rats non-exposed and exposed to CMS for two weeks (2 weeks unstressed, 2 weeks stress), in animals non-exposed to CMS for seven weeks and administered agomelatine (10 mg/kg) for five weeks (5 weeks agomelatine unstressed), and in animals exposed to CMS for seven weeks and administered vehicle (1 mL/kg) or agomelatine (10 mg/kg) for five weeks (7 weeks stressed/5 weeks saline and 7 weeks stressed/5 weeks agomelatine). Relative gene expression levels were estimated using the 2−ΔCt (Ctgene–Ct18S) method; n = 6; # p < 0.05 for differences between 2 weeks stressed and 2 weeks unstressed groups, * p < 0.05 for differences between 2 weeks stressed and 7 weeks stressed/5 weeks agomelatine groups.
Genes 11 01093 g002
Figure 3. Tph1 (A), Tph2 (B), KatI (C), KatII (D), Kmo (E), and Kynu (F) mRNA expression in six brain structures (hippocampus, amygdala, hypothalamus, midbrain, cerebral cortex, and basal ganglia) of rats exposed to CMS for two weeks (2 weeks unstressed, 2 week stressed) and in animals exposed to CMS for seven weeks and administered vehicle (1 mL/kg) or agomelatine (10 mg/kg) for five weeks (5 weeks agomelatine unstressed, 7 weeks stressed/5 weeks saline and 7 weeks stressed/5 weeks agomelatine). Relative gene expression levels were estimated using the 2−ΔCt (Ctgene–Ct18S) method; n = 6; # p < 0.05 for differences between 2 weeks stressed and 2 weeks unstressed groups.
Genes 11 01093 g003
Figure 4. Methylation status of Tdo2 promoter 1 in the amygdala of CMS rats for two weeks (2 week unstress, 2 week stress) and in rats exposed to CMS for seven weeks and treated vehicle (1 mL/kg) or agomelatine (10 mg/kg) for five weeks (5 week agomelatine unstressed, 7 week stressed/5 week saline, and 7 week stressed/5 week agomelatine). Data represents means and min to max value. n = 6. * p < 0.05 for differences between 2 week stressed and 2 week unstressed groups.
Genes 11 01093 g004
Figure 5. ACTB (A1), Tph1 (B1), Tph2 (C1), KatII (D1), and Ido1 (E1) protein expression in six brain structures of rats exposed to CMS for two weeks (2 weeks unstressed, 2 weeks stressed) and in animals exposed to CMS for seven weeks and administered vehicle (1 mL/kg) or agomelatine (10 mg/kg) for five weeks (5 weeks agomelatine unstressed, 7 weeks stressed/5 weeks saline, and 7 weeks stressed/5 weeks agomelatine). (I) Representative Western blot analysis in the hippocampus (H), amygdala (A), hypothalamus (HY), midbrain (M) cerebral cortex (CC), and basal ganglia (BG) of 2 weeks unstressed, 2 weeks stressed, 5 weeks agomelatine unstressed, 7 weeks stressed/5 weeks saline, and 7 weeks stressed/5 weeks agomelatine groups. (II) Levels of Tph1 (A2), Tph2 (B2), Ido1 (C2), and KatII (D2) proteins measured in hippocampus, amygdala, hypothalamus, midbrain, cortex, and basal ganglia. Samples containing 25 μg of proteins were resolved by SDS-PAGE. The intensity of bands corresponding to Tph1, Tph2, Ido1, and KatII was analyzed by densitometry. Integrated optical density (IOD) was normalized by protein content and a reference sample (see Section 2 for details). The graphs show the mean IODs of the bands from all analyzed samples. The IODgene/IODACTB method was used to estimate the relative protein expression levels in the analyzed samples. Data represent means ± SEM; n = 6; # p < 0.05, ## p < 0.01, ### p < 0.001 for differences between 2 weeks stressed and 2 weeks unstressed groups; * p < 0.05, ** p < 0.01, *** p < 0.001 for differences between 2 weeks stressed and 7 weeks stressed/5 weeks agomelatine; & p < 0.05 for differences between 7 weeks stressed/5 weeks saline and 7 weeks stressed/5 weeks agomelatine groups.
Genes 11 01093 g005

