
Using a Safe System Framework to Examine the Roadway Mortality Increase Pre-COVID-19 and in the COVID-19 Era in New York State

 , ,
, ,
Abstract
1. Introduction
2. Materials and Methods
2.1. Study Population
2.2. Data Source(s)
2.3. Variable Classifications
2.4. Pillar 1: Road User-Level Characteristics
2.4.1. Demographics and Person Type
2.4.2. Driver/Occupant Behavior
Use of Protective Gear
2.5. Pillar 2: Vehicle and Vehicle Crash Level Characteristics
2.6. Pillar 3: Roadway Characteristics
2.7. Pillar 4: Speeding
2.8. Pillar 5: Post Crash Care
2.9. Statistical Analysis
3. Results
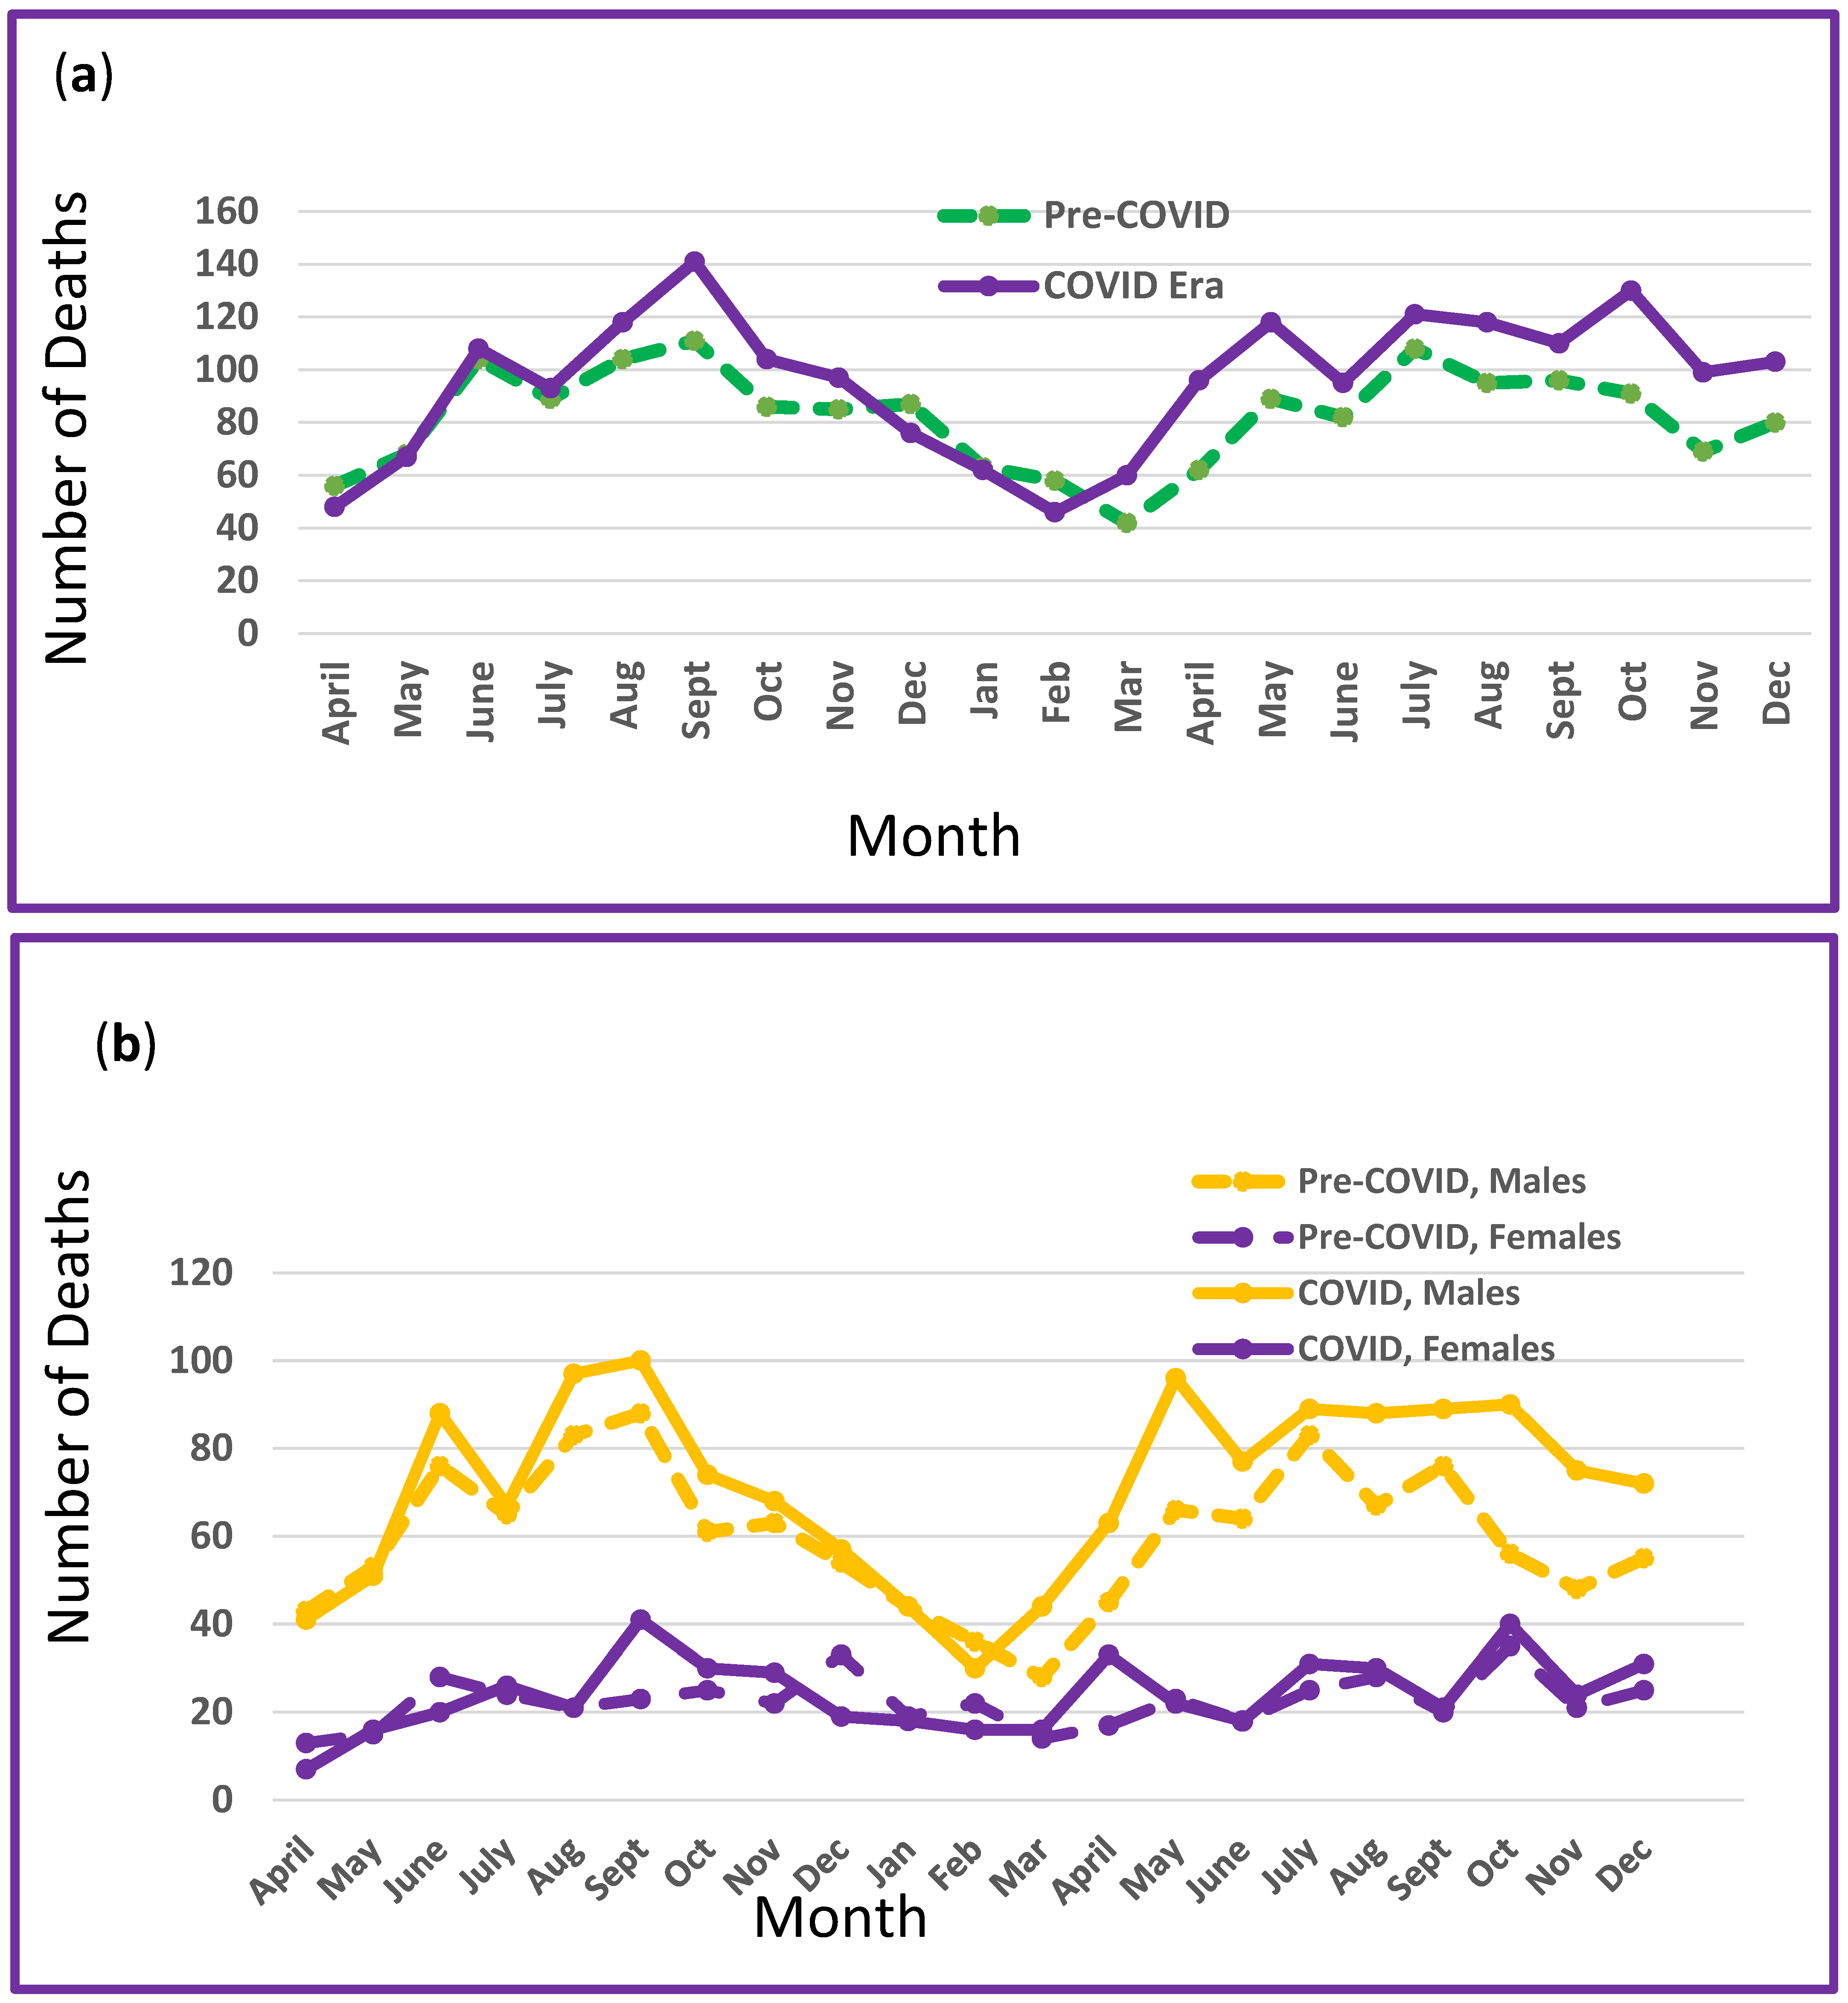
3.1. Pillar 1: Road User Characteristics
3.1.1. Road User Type
3.1.2. Motor Vehicle Occupants
3.1.3. Motorized Two- and Three-Wheeled Vehicles
3.1.4. Pedestrians
3.2. Pillar 2: Vehicle Characteristics
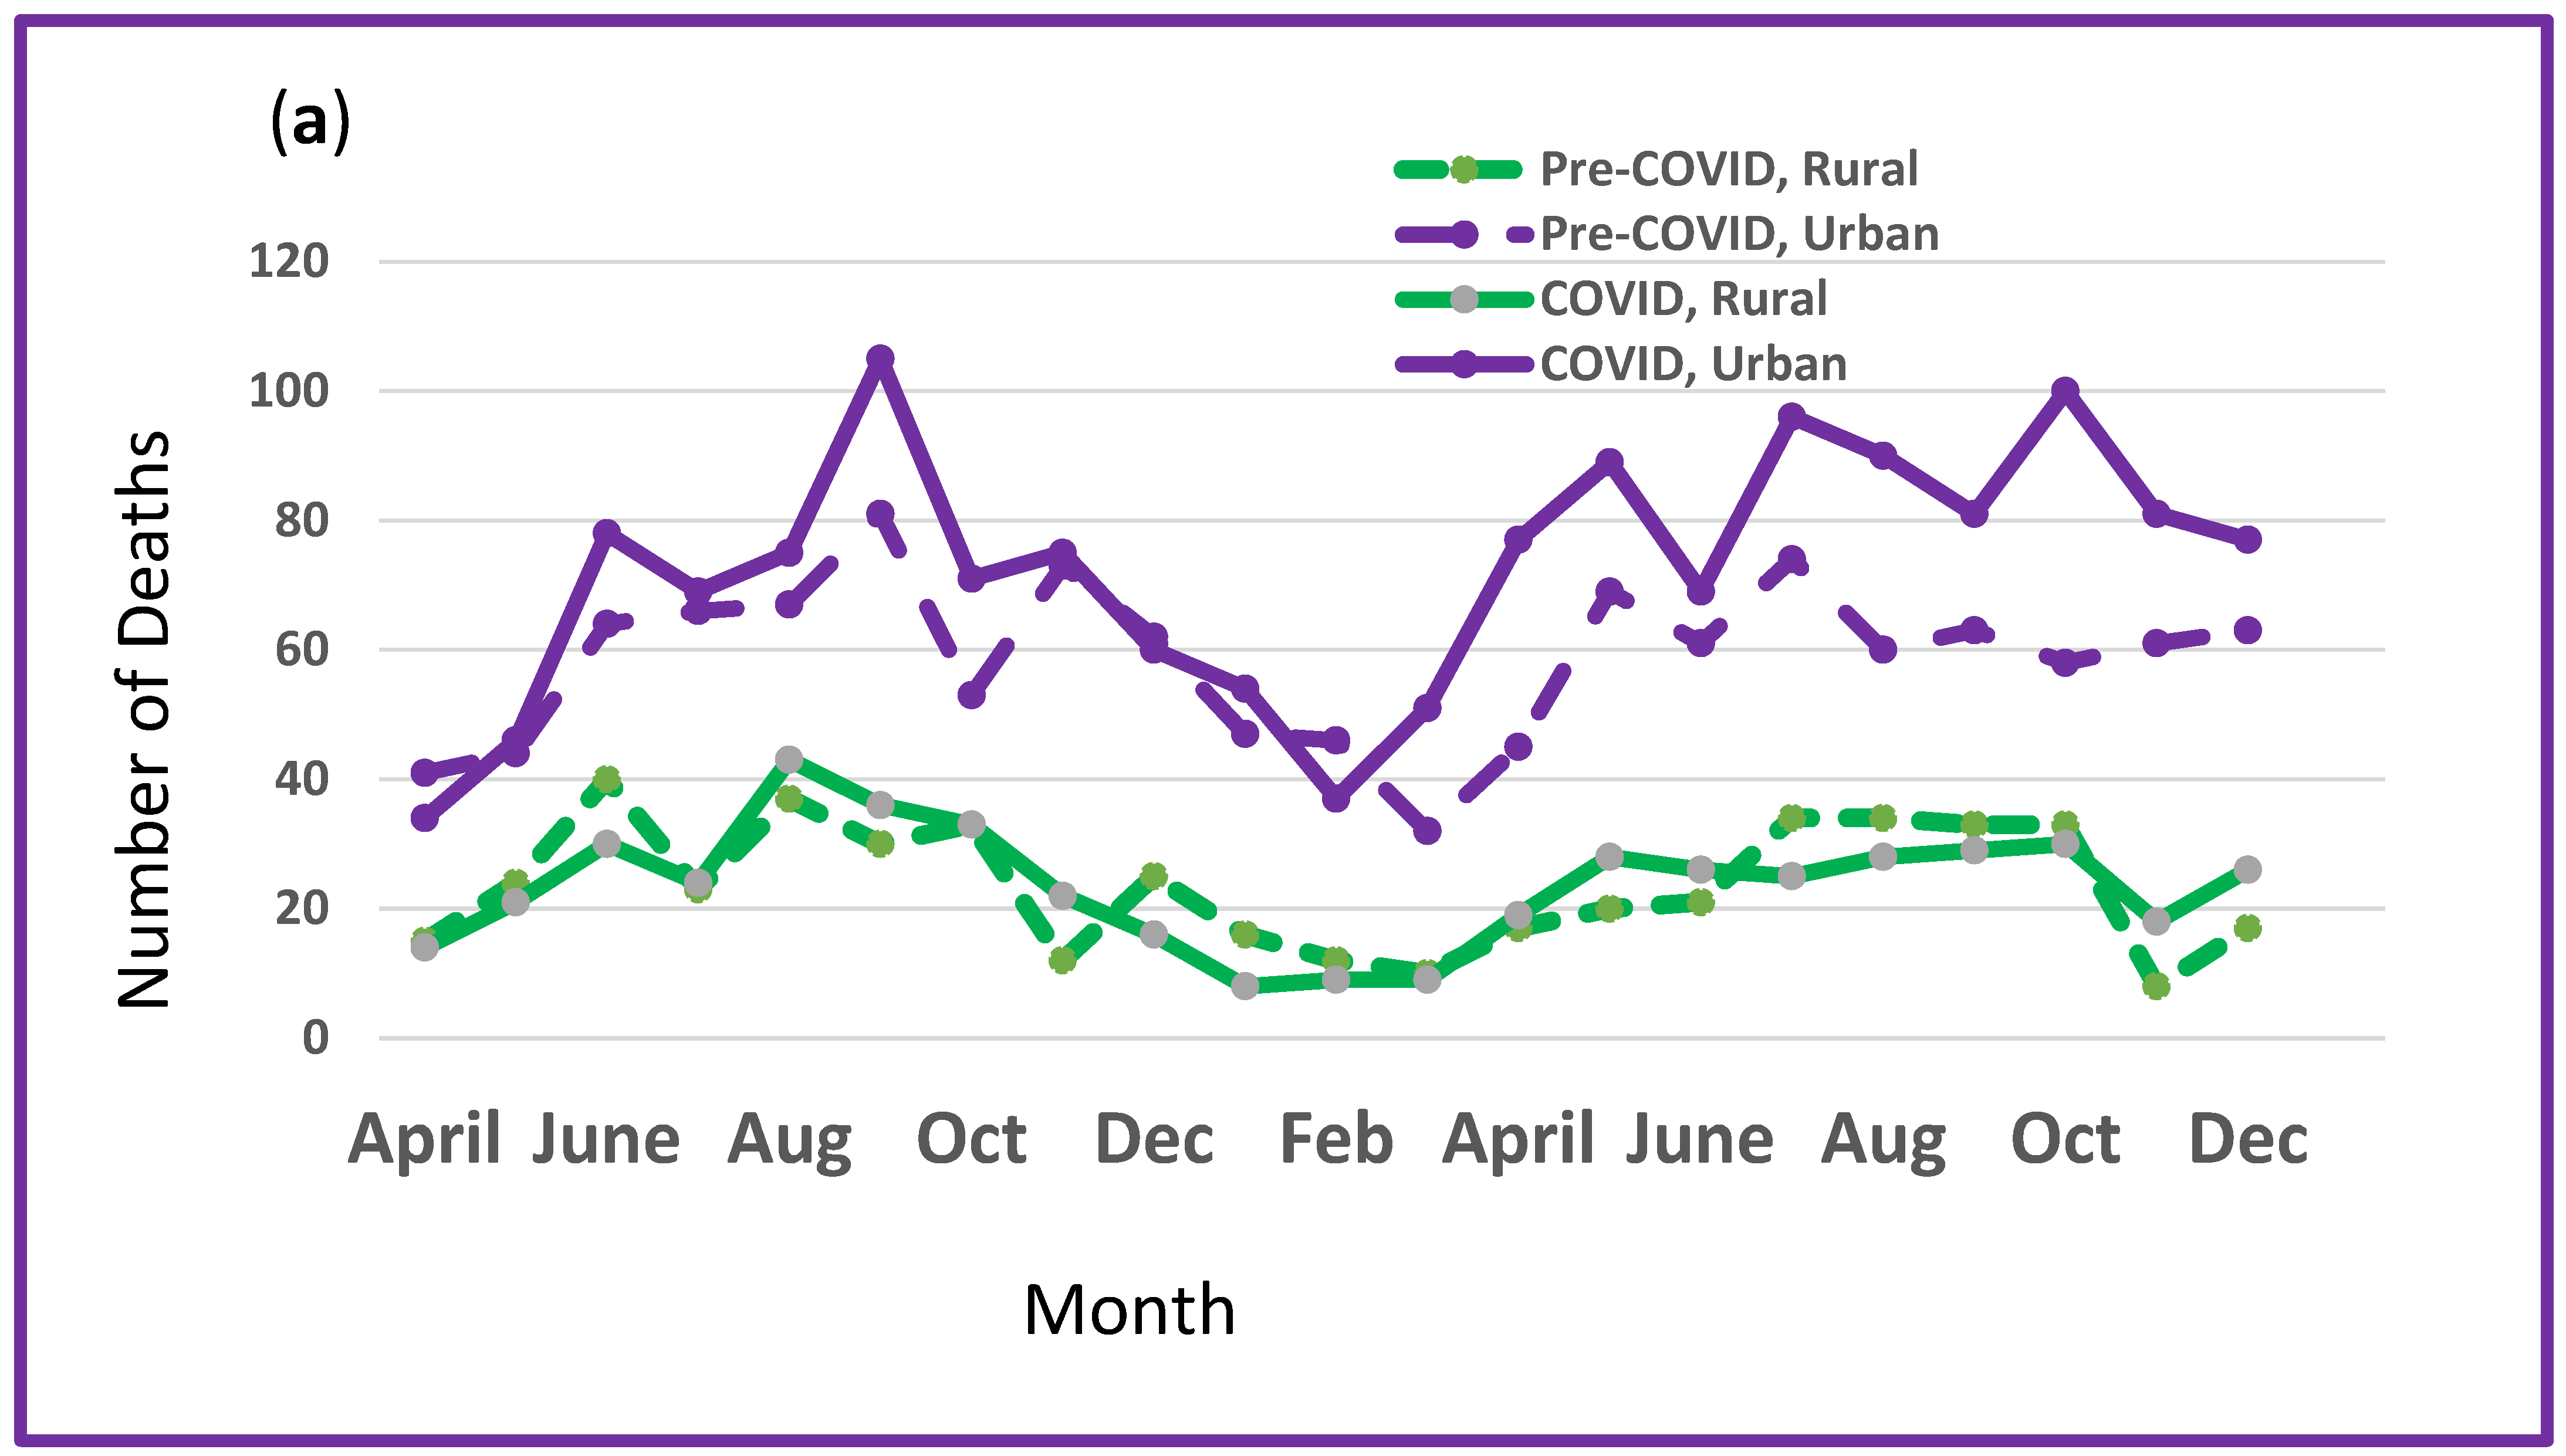
3.3. Pillar 3: Roadway Characteristics
Urbanization
3.4. Pillar 4: Speeding
3.5. Pillar 5: Post Crash Care
3.5.1. Mode of Transport
3.5.2. Independent Risk Factors for Mortality for Persons in or on Motorized Vehicles
4. Discussion
5. Conclusions
Supplementary Materials
Author Contributions
Funding
Institutional Review Board Statement
Informed Consent Statement
Data Availability Statement
Conflicts of Interest
References
- Kaufman, E.J.; Holena, D.; Koenig, G.; Martin, N.D.; Maish, G.O., 3rd; Moran, B.J.; Ratnasekera, A.; Stawicki, S.P.; Timinski, M.; Brown, J. Increase in Motor Vehicle Crash Severity: An Unforeseen Consequence of COVID-19. Am. Surg. 2023, 89, 865–870. [Google Scholar] [CrossRef] [PubMed] [PubMed Central]
- National Highway Traffic Safety Administration (NHTSA). Motor Vehicle Crash Data Querying and Reporting, New York State, Fatal Crashes 2018, 2019. Version 7.4. Available online: https://cdan.dot.gov/ (accessed on 22 June 2024).
- Adanu, E.K.; Okafor, S.; Penmetsa, P.; Jones, S. Understanding the factors associated with the temporal variability in crash severity before, during, and after the COVID-19 shelter-in-place order. Safety 2022, 8, 42. [Google Scholar] [CrossRef]
- Qureshi, A.I.; Huang, W.; Khan, S.; Lobanova, I.; Siddiq, F.; Gomez, C.R.; Suri, M.F.K. Mandated societal lockdown and road traffic accidents. Accid. Anal. Prev. 2020, 146, 105747. [Google Scholar] [CrossRef] [PubMed] [PubMed Central]
- Shaik, M.E.; Ahmed, S. An overview of the impact of COVID-19 on road traffic safety and travel behavior. Transp. Eng. 2022, 9, 100119. [Google Scholar] [CrossRef]
- NHTSA. Update to Special Reports on Traffic Safety During the COVID-19 Public Health Emergency: Fourth Quarter Data [Traffic Safety Facts]; United States Department of Transportation. National Highway Traffic Safety Administration. Office of Behavioral Safety Research: Washington, DC, USA, 2021; Report Number: DOT HS 813 135. [CrossRef]
- National Center for Statistics and Analysis. Early Estimate of Motor Vehicle Traffic Fatalities for the first half (January–June) of 2021; NHTSA: Washington DC, USA, 2021; Report No.: DOT HS 813 199.
- Reynolds, L.; Griffin, R.L. A decomposition of the effects of the COVID-19 pandemic on changes in the motor vehicle collision related mortality in Alabama. Accid. Anal. Prev. 2023, 189, 107127. [Google Scholar] [CrossRef] [PubMed] [PubMed Central]
- National Highway Traffic Safety Administration. 2020 Fatality Data Show Increased Traffic Fatalities During Pandemic. Published 3 June 2021. Available online: https://www.nhtsa.gov/press-releases/2020-fatality-data-show-increased-traffic-fatalities-during-pandemic#:~:text=The%20fatality%20rate%20for%202020,to%20wear%20a%20seat%20belt (accessed on 11 July 2024).
- Patwary, A.L.; Khattak, A.J. Crash harm before and during the COVID-19 pandemic: Evidence for spatial heterogeneity in Tennessee. Accid. Anal. Prev. 2023, 183, 106988. [Google Scholar] [CrossRef] [PubMed] [PubMed Central]
- Lee, J.; Liu, H.; Abdel-Aty, M. Changes in traffic crash patterns: Before and after the outbreak of COVID-19 in Florida. Accid. Anal. Prev. 2023, 190, 107187. [Google Scholar] [CrossRef]
- Yasin, Y.J.; Grivna, M.; Abu-Zidan, F.M. Global impact of COVID-19 pandemic on road traffic collisions. World J. Emerg. Surg. 2021, 16, 51. [Google Scholar] [CrossRef] [PubMed] [PubMed Central]
- Saha, D.; Dumbaugh, E.; Merlin, L.A. A conceptual framework to understand the role of built environment on traffic safety. J Safety Res. 2020, 75, 41–50. [Google Scholar] [CrossRef]
- United States Department of Transportation. National Roadway Safety Strategy; Version 1.1.; US DOT: Washington, DC, USA, 2022.
- Federal Highway Administration. The Safe System Approach (Report No. FHWA-SA-20-015). 2020. Available online: https://safety.fhwa.dot.gov/zerodeaths/docs/FHWA_SafeSystem_Brochure_V9_508_200717.pdf (accessed on 22 June 2024).
- Oh, S.A.; Liu, C.; Pressley, J.C. Fatal Pediatric Motor Vehicle Crashes on U.S. Native American Indian Lands Compared to Adjacent Non-Indian Lands: Restraint Use and Injury by Driver, Vehicle, Roadway and Crash Characteristics. Int. J. Environ. Res. Public Health 2017, 14, 1287. [Google Scholar] [CrossRef]
- Stiles, J.; Kar, A.; Lee, J.; Miller, H.J. Lower Volumes, Higher Speeds: Changes to Crash Type, Timing, and Severity on Urban Roads from COVID-19 Stay-at-Home Policies. Transp. Res. Rec. 2023, 2677, 15–27. [Google Scholar] [CrossRef] [PubMed]
- Griffin, R.; McGwin, G.; Kerby, J. Decomposition analysis of the effects of vehicle safety technologies on the motor vehicle collision-related mortality rate from 1994 to 2015. Traffic Inj. Prev. 2018, 19 (Suppl. S2), S169–S172. [Google Scholar] [CrossRef] [PubMed]
- National Highway Traffic Safety Administration (NHTSA). How Data Informs NHTSA’s Vehicle Safety Research Program Reducing Fatalities: Biggest Needs Part 1. Available online: https://www.nhtsa.gov/sites/nhtsa.gov/files/2024-02/16180-NSR-231211-001_SAE_How%20Data%20Informs%20NHTSAs%20Vehicle%20Research%20Program-tag.pdf (accessed on 22 June 2024).
- Integrating the Safe System Approach with the Highway Safety Improvement Program. Available online: https://safety.fhwa.dot.gov/hsip/docs/fhwasa2018.pdf (accessed on 22 June 2024).
- National Safety Council. The Safe System Approach. Available online: https://www.nsc.org/road/resources/road-to-zero/safe-system-approach (accessed on 22 June 2024).
- Kirley, B.B.; Robison, K.L.; Goodwin, A.H.; Harmon, K.J.; O’Brien, N.P.; West, A.; Harrell, S.S.; Thomas, L.; Brookshire, K. Countermeasures That Work: A Highway Safety Countermeasure Guide for State Highway Safety Offices, 11th ed.; National Highway Traffic Safety Administration: Washington, DC, USA, 2023; Report No. DOT HS 813 490. Available online: https://www.nhtsa.gov/sites/nhtsa.gov/files/2023-12/countermeasures-that-work-11th-2023-tag_0.pdf (accessed on 22 June 2024).
- National Center for Statistics and Analysis. Fatality Analysis Reporting System Analytical User’s Manual, 1975–2021 (Report No. DOT HS 813 417); National Highway Traffic Safety Administration: Washington, DC, USA, 2023.
- National Highway Traffic Safety Administration. Fatality Analysis Reporting System (FARS); National Highway Traffic Safety Administration: Washington, DC, USA. Available online: https://www.nhtsa.gov/research-data/fatality-analysis-reporting-system-fars (accessed on 20 December 2024).
- Berning, A.; Smith, R.C.; Drexler, M.; Wochinger, K. Drug Testing and Traffic Safety: What You Need to Know (Report No. DOT HS 813 264); National Highway Traffic Safety Administration: Washington, DC, USA, 2022.
- Basavaraju, S.V. Serologic Testing of US Blood Donations to Identify Severe Acute Respiratory Syndrome Coronavirus 2 (SARS-CoV-2)—Reactive Antibodies: December 2019–January 2020. Clin. Infect. Dis. 2020, 72, e1004–e1009. [Google Scholar] [CrossRef] [PubMed]
- Ferguson, W.; Furticella, J.; Hinderaker, A.; Howard, S.; Newman, A.; Rogers, K. Two Years of the Pandemic in New York, Step by Awful Step. The New York Times, 15 March 2020. [Google Scholar]
- Pressley, J.C.; Hines, L.M.; Bauer, M.J.; Oh, S.A.; Kuhl, J.R.; Liu, C.; Cheng, B.; Garnett, M.F. Using Rural-Urban Continuum Codes (RUCCS) to Examine Alcohol-Related Motor Vehicle Crash Injury and Enforcement in New York State. Int. J. Environ. Res. Public Health 2019, 16, 1346. [Google Scholar] [CrossRef] [PubMed] [PubMed Central]
- Hosmer, D.W.; Lemeshow, S.; Sturdivant, R.X. Applied Logistic Regression, 3rd ed.; Wiley and Sons: Hoboken, NJ, USA, 2013. [Google Scholar]
- R Core Team. R: A Language and Environment for Statistical Computing; R Foundation for Statistical Computing: Vienna, Austria, 2021; Available online: https://www.R-project.org/ (accessed on 10 March 2024).
- The R Development Team. The R Manuals. Available online: https://cran.r-project.org/manuals.html (accessed on 31 January 2024).
- NYSERDA. $32 Million Now Available for Shared Electric Transportation Solutions: New Clean Mobility Program Supports Community-Led Planning and Demonstration Projects That Solve Local Transportation Needs and Help Reduce Emissions. Available online: https://www.nyserda.ny.gov/About/Newsroom/2024-Announcements/2024_06_21-Governor-Hochul-Announces-32-Million-Now-Available-For-Shared-Electric (accessed on 29 June 2024).
- Olsen, C.S.; Thomas, A.M.; Singleton, M.; Gaichas, A.M.; Smith, T.J.; Smith, G.A.; Peng, J.; Bauer, M.J.; Qu, M.; Yeager, D.; et al. Motorcycle helmet effectiveness in reducing head, face and brain injuries by state and helmet law. Inj. Epidemiol. 2016, 3, 8. [Google Scholar] [CrossRef] [PubMed] [PubMed Central]
- Wararkar, T. A Timeline of COVID-19’s Impact on NYC’s Restaurant Industry. Eater, N.Y. 30 December 2020. Available online: https://ny.eater.com/2020/12/30/22203053/nyc-coronavirus-timeline-restaurants-bars-2020 (accessed on 10 June 2024).
- Chen, Y.; Klein, S.L.; Garibaldi, B.T.; Li, H.; Wu, C.; Osevala, N.M.; Li, T.; Margolick, J.B.; Pawelec, G.; Leng, S.X. Aging in COVID-19: Vulnerability, immunity and intervention. Ageing Res. Rev. 2021, 65, 101205. [Google Scholar] [CrossRef]
- Greenleaf, A.R.; Millington, M.; Chan, K.; Reyes, M.; Farley, S.M.; Low, A.; Hoos, D.; El-Sadr, W.M. Effect of COVID-19 Pandemic on Older New York City Residents Living at Home. J. Community Health 2022, 47, 361–370. [Google Scholar] [CrossRef]
- Redelmeier, D.A.; Zipursky, J.S. Pedestrian Deaths During the COVID-19 Pandemic. Am. J. Lifestyle Med. 2023, 17, 276–279. [Google Scholar] [CrossRef]
- Maskály, J.; Ivković, S.K.; Neyroud, P. Policing the COVID-19 Pandemic: Exploratory Study of the Types of Organizational Changes and Police Activities Across the Globe. Int. Crim. Justice Rev. 2021, 31, 266–285. [Google Scholar] [CrossRef]
- Ashby, M.P.J. Changes in Police Calls for Service During the Early Months of the 2020 Coronavirus Pandemic. Polic. A J. Policy Pact. 2020, 14, 1054–1072. [Google Scholar] [CrossRef] [PubMed Central]
- Luca, D.L. Do Traffic Tickets Reduce Motor Vehicle Accidents? Evidence from a Natural Experiment. J. Policy Anal. Manag. 2015, 34, 85–106. [Google Scholar] [CrossRef]
- Pressley, J.C.; Puri, N.; He, T. Fatal Motor Vehicle Crashes in Upstate and Long Island New York: The Impact of High Visibility Seat Belt Enforcement on Multiple Risky Driving Behaviors. Int. J. Environ. Res. Public Health 2023, 20, 920. [Google Scholar] [CrossRef] [PubMed] [PubMed Central]
- McKinley, J. New York City Region Is Now an Epicenter of the Coronavirus Pandemic. Available online: https://www.nytimes.com/2020/03/22/nyregion/Coronavirus-new-York-epicenter.html (accessed on 29 June 2024).
- Dole, K. Traffic Tickets Issued by NYPD Plummet, Speeding Remained the Same: Report. 1010 Wins, News. 10 August 2020. Available online: https://www.audacy.com/1010wins/articles/traffic-tickets-issued-by-nypd-plummet-report (accessed on 10 June 2024).
- Lin, L.; Shi, F.; Li, W. Assessing inequality, irregularity, and severity regarding road traffic safety during COVID-19. Sci. Rep. 2021, 11, 13147. [Google Scholar] [CrossRef] [PubMed] [PubMed Central]
- Hupf, A. Report: Pandemic Led to Surge of New Yorkers Leaving the State. Available online: https://www.dailygazette.com/news/govt_politics/new-yorkers-migration-comptroller/article_e6413192-93a4-11ee-9e7b-6bcc673d10ce.html (accessed on 25 June 2024).
- Walters, J.K.; Repp, K.K.; Mew, M.C. Alcohol and drug presence in traffic crash fatalities before and after the COVID-19 pandemic: Evaluation of the fatality analysis reporting system (FARS) and linked medical examiner-vital records data in Clackamas, Multnomah, and Washington County, Oregon, 2019–2021. Forensic Sci. Int. Synerg. 2024, 8, 100468. [Google Scholar] [CrossRef] [PubMed] [PubMed Central]
- Ehsani, J.P.; Michael, J.P.; Duren, M.; Shields, W.C.; Compton, R.P.; Fowler, D.; Smith, G. Drug presence in driving deaths in Maryland: Comparing trends and prevalence in medical examiner and FARS data. Accid. Anal. Prev. 2021, 154, 106066. [Google Scholar] [CrossRef] [PubMed] [PubMed Central]
- Bunn, T.; Singleton, M.; Chen, I.C. Use of multiple data sources to identify specific drugs and other factors associated with drug and alcohol screening of fatally injured motor vehicle drivers. Accid. Anal. Prev. 2019, 122, 287–294. [Google Scholar] [CrossRef] [PubMed]
- Zavattaro, S. Last Responders: The Role of Deathcare Systems During COVID-19. The Rockefeller Institute of Government. Available online: https://rockinst.org/blog/last-responders-the-role-of-deathcare-systems-during-covid-19/ (accessed on 19 June 2024).
- Zavattaro, S. Medical Examiners and Coroners Have Borne a Heavy Burden During the COVID-19 Pandemic and Have Often Felt Invisible and Unsupported. Available online: https://theconversation.com/medical-examiners-and-coroners-have-borne-a-heavy-burden-during-the-covid-19-pandemic-and-have-often-felt-invisible-and-unsupported-170925 (accessed on 19 June 2024).
- Joint Office of Energy and Transportation. Biden-Harris Administration Invests $54 Million to Expand Clean Transportation Across American Communities. Available online: https://driveelectric.gov/news/communities-taking-charge-accelerator-funding (accessed on 29 June 2024).


| Pre-COVID | COVID Era | Total | |||
|---|---|---|---|---|---|
| Demographic and Crash Characteristics | % Change | 1 April 2018–31 December 2019 | 1 April 2020–31 December 2021 | 1 April 2018–31 December 2021 | Chi-Square |
| n (%) | X² (p-Value) | ||||
| n (%) | n = 1725 | n = 2010 | n = 3735 | ||
| Road user type | 16.52 | 1725 | 2010 | 3735 | 23.770 (<0.001) |
| Motor vehicle occupants | 19.70 | 868 (50.3) | 1039 (51.7) | 1907 (51.1) | |
| Motorized 2-wheeled MV occupants | 45.10 | 286 (16.6) | 415 (20.6) | 701 (18.8) | |
| Bicycle, not motorized | 4.17 | 72 (4.2) | 75 (3.7) | 147 (3.9) | |
| Pedestrian | −6.57 | 487 (28.2) | 455 (22.6) | 942 (25.2) | |
| Other/unknown | 116.67 | 12 (0.7) | 26 (1.3) | 38 (1.0) | |
| Age, collapsed (all occupants) | 1153 | 1450 | 2603 | 11.291 (0.023) | |
| 0–12 | 50.0 | 16 (1.4) | 24 (1.7) | 40 (1.5) | |
| 13–19 | 16.2 | 74 (6.4) | 86 (5.9) | 160 (6.1) | |
| 20–44 | 41.8 | 521 (45.2) | 739 (51.0) | 1260 (48.4) | |
| 45–64 | 18.7 | 299 (25.9) | 355 (24.5) | 654 (25.1) | |
| 65+ | 1.2 | 243 (21.1) | 246 (17.0) | 489 (18.8) | |
| Safety equipment use | 1641 | 1909 | 3550 | 86.659 (<0.001) | |
| Unrestrained/not helmeted | 52.7 | 364 (22.2) | 556 (29.1) | 920 (25.9) | |
| Restrained or helmeted | 21.4 | 740 (45.1) | 898 (47.0) | 1638 (46.1) | |
| Not applicable (i.e., pedestrians) | −6.6 | 487 (29.7) | 455 (23.8) | 942 (26.5) | |
| Motor Vehicles (four-wheeled), Drivers | |||||
| Age | 663 | 782 | 1445 | 18.734 (0.009) | |
| ≤19 | 0.0 | 39 (5.9) | 39 (5.0) | 78 (5.4) | |
| 20–24 | 0.0 | 73 (11.0) | 73 (9.3) | 146 (10.1) | |
| 25–29 | 41.3 | 63 (9.5) | 89 (11.4) | 152 (10.5) | |
| 30–34 | 97.8 | 46 (6.9) | 91 (11.6) | 137 (9.5) | |
| 35–39 | 75.0 | 32 (4.8) | 56 (7.2) | 88 (6.1) | |
| 40–44 | 40.0 | 35 (5.3) | 49 (6.3) | 84 (5.8) | |
| 45–64 | 5.6 | 198 (29.9) | 209 (26.7) | 407 (28.2) | |
| 65 and over | −0.6 | 177 (26.7) | 176 (22.5) | 353 (24.4) | |
| Sex | 664 | 784 | 1448 | 0.058 (0.810) | |
| Male | 18.9 | 512 (77.1) | 609 (77.8) | 1121 (77.5) | |
| Female | 14.5 | 152 (22.9) | 174 (22.2) | 326 (22.5) | |
| Impaired, alcohol | 0.764 (0.382) | ||||
| No | 21.5 | 488 (73.5) | 593 (75.6) | 1081 (74.7) | |
| Yes | 8.5 | 176 (26.5) | 191 (24.4) | 367 (25.3) | |
| Restraint Status | |||||
| Driver of MV | 18.1 | 664 | 784 | 1448 | 5.627 (0.018) |
| Unrestrained | 39.8 | 201 (30.3) | 281 (35.8) | 482 (33.3) | |
| Restrained | 5.7 | 407 (61.3) | 430 (54.8) | 837 (57.8) | |
| Not reported | 30.4 | 56 (8.4) | 73 (9.3) | 129 (8.9) | |
| Motorized two-wheeled Vehicle, Drivers | |||||
| Age | 271 | 396 | 667 | 15.433 (0.031) | |
| <=19 | 33.3 | 9 (3.3) | 12 (3.0) | 21 (3.1) | |
| 20–24 | 57.6 | 33 (12.2) | 52 (13.1) | 85 (12.7) | |
| 25–29 | −14.3 | 63 (23.2) | 54 (13.6) | 117 (17.5) | |
| 30–34 | 106.3 | 32 (11.8) | 66 (16.7) | 98 (14.7) | |
| 35–39 | 138.1 | 21 (7.7) | 50 (12.6) | 71 (10.6) | |
| 40–44 | 45.0 | 20 (7.4) | 29 (7.3) | 49 (7.3) | |
| 45–64 | 35.1 | 74 (27.3) | 100 (25.3) | 174 (26.1) | |
| 65 and over | 73.7 | 19 (7.0) | 33 (8.3) | 52 (7.8) | |
| Sex | 271 | 397 | 668 | 0.064 (0.800) | |
| Male | 47.5 | 261 (96.3) | 385 (97.0) | 646 (96.7) | |
| Female | 20.0 | 10 (3.7) | 12 (3.0) | 22 (3.3) | |
| Helmet wearing | 268 | 397 | 665 | 9.616 (0.002) | |
| No | 235.3 | 17 (6.3) | 57 (14.4) | 74 (11.1) | |
| Yes | 35.1 | 242 (90.3) | 327 (82.4) | 569 (85.6) | |
| Unknown | 44.4 | 9 (3.4) | 13 (3.3) | 22 (3.3) | |
| Impaired, alcohol | 271 | 397 | 668 | 1.936 (0.164) | |
| No | 57.0 | 193 (71.2) | 303 (76.3) | 496 (74.3) | |
| Yes | 20.5 | 78 (28.8) | 94 (23.7) | 172 (25.7) | |
| Pedestrians | |||||
| Age | 483 | 448 | 931 | 4.792 (0.309) | |
| 0–12 | 33.3 | 12 (2.5) | 16 (3.6) | 28 (3.0) | |
| 13–19 | 10.0 | 10 (2.1) | 11 (2.5) | 21 (2.3) | |
| 20–44 | 7.4 | 135 (28.0) | 145 (32.4) | 280 (30.1) | |
| 45–64 | −7.9 | 151 (31.3) | 139 (31.0) | 290 (31.1) | |
| 65+ | −21.7 | 175 (36.2) | 137 (30.6) | 312 (33.5) | |
| Sex | 487 | 455 | 942 | 0.209 (0.648) | |
| Male | −9.0 | 312 (64.1) | 284 (62.4) | 596 (63.3) | |
| Female | −2.3 | 175 (35.9) | 171 (37.6) | 346 (36.7) | |
| Bicyclists, Non Motorized | |||||
| Age | 72 | 75 | 147 | 2.836 (0.586) | |
| 0–12 | −66.7 | 3 (4.2) | 1 (1.3) | 4 (2.7) | |
| 13–19 | −10.0 | 10 (13.9) | 9 (12.0) | 19 (12.9) | |
| 20–44 | 12.5 | 24 (33.3) | 27 (36.0) | 51 (34.7) | |
| 45–64 | 33.3 | 21 (29.2) | 28 (37.3) | 49 (33.3) | |
| 65+ | −28.6 | 14 (19.4) | 10 (13.3) | 24 (16.3) | |
| Sex | 72 | 75 | 147 | 1.948 (0.163) | |
| Male | 18.2 | 55 (76.4) | 65 (86.7) | 120 (81.6) | |
| Female | −41.2 | 17 (23.6) | 10 (13.3) | 27 (18.4) | |
| % Change | Pre-COVID | COVID Era | Total | ||
|---|---|---|---|---|---|
| 1 April 2018–31 December 2019 | 1 April 2020–31 December 2021 | 1 April 2018–31 December 2021 | Chi-Square | ||
| n (%) | X² (p-Value) | ||||
| n = 1725 | n = 2010 | n = 3735 | |||
| Pillar II: Vehicle Characteristics | |||||
| Number of Vehicles | 1725 | 2010 | 3735 | 10.308 (0.006) | |
| Single | 8.44 | 1031 (59.8) | 1118 (55.6) | 2149 (57.5) | |
| Two | 22.16 | 564 (32.7) | 689 (34.3) | 1253 (33.5) | |
| Multiple (2+) | 56.15 | 130 (7.5) | 203 (10.1) | 333 (8.9) | |
| Motorized Vehicle Type | 1155 | 1461 | 2616 | 25.856 (0.007) | |
| Car | 22.43 | 486 (42.1) | 595 (40.7) | 1081 (41.3) | |
| SUV | 19.69 | 193 (16.7) | 231 (15.8) | 424 (16.2) | |
| Van | 18.18 | 44 (3.8) | 52 (3.6) | 96 (3.7) | |
| Light/Pickup Trucks | 12.66 | 79 (6.8) | 89 (6.1) | 168 (6.4) | |
| Medium/Heavy Trucks | 11.54 | 26 (2.3) | 29 (2.0) | 55 (2.1) | |
| Other Motorized Vehicles | |||||
| Two-Wheel Motorcycles | 31.34 | 268 (23.2) | 352 (24.1) | 620 (23.7) | |
| Three-Wheel Motorcycles | 200.00 | 2 (0.2) | 6 (0.4) | 8 (0.3) | |
| Moped/Motor Scooters/Minibikes | 263.64 | 11 (0.1) | 40 (2.7) | 51 (1.9) | |
| Off-Road Motorcycles | 250.00 | 4 (0.3) | 14 (0.1) | 18 (0.7) | |
| Other Off-Road Vehicles | 42.31 | 26 (2.3) | 37 (2.5) | 63 (2.4) | |
| Other Vehicle Types | −72.73 | 11 (1.0) | 3 (0.2) | 14 (0.5) | |
| Unknown | 160.00 | 5 (0.4) | 13 (0.9) | 18 (0.7) | |
| Collision type | 1719 | 2008 | 3727 | 33.229 (<0.001)) | |
| Not a collision with MV in transport | 7.40 | 1162 (67.6) | 1248 (62.2) | 2410 (64.7) | |
| Angle | 24.14 | 261 (15.2) | 324 (16.1) | 585 (15.7) | |
| Head-on | 22.65 | 181 (10.5) | 222 (11.1) | 403 (10.8) | |
| Rear-end | 67.05 | 88 (5.1) | 147 (7.3) | 235 (6.3) | |
| Sideswipe | 225.00 | 20 (1.2) | 65 (3.2) | 85 (2.3) | |
| Pillar III: Roadway Characteristics | |||||
| Urbanization | 1725 | 2010 | 3735 | 7.670 (0.006) | |
| Rural | 0.0 | 494 (28.6) | 494 (24.6) | 988 (26.5) | |
| Urban | 23.2 | 1230 (71.3) | 1515 (75.4) | 2745 (73.5) | |
| RUCC Rankings | 1725 | 2010 | 3735 | 8.218 (0.016) | |
| Metropolitan | 20.29 | 1464 (84.9) | 1761 (87.6) | 3225 (86.3) | |
| Non-metropolitan, adjacent | −9.48 | 232 (13.4) | 210 (10.4) | 442 (11.8) | |
| Non-metropolitan, non-adjacent | 34.48 | 29 (1.7) | 39 (1.9) | 68 (1.8) | |
| NY State Geographical Breakdown | 1698 | 1975 | 3673 | 2.171 (0.338) | |
| NYC | 19.6 | 373 (22.0) | 446 (22.6) | 819 (22.3) | |
| Long Island | 5.6 | 359 (21.1) | 379 (19.2) | 738 (20.1) | |
| Upstate | 19.0 | 966 (56.9) | 1150 (58.2) | 2116 (57.6) | |
| Number of lanes | 1140 | 1420 | 2560 | 9.260 (0.026) | |
| One | 13.51 | 37 (3.2) | 42 (3.0) | 79 (3.1) | |
| Two or more, one-way traffic | 8.33 | 24 (2.1) | 26 (1.8) | 50 (2.0) | |
| Two or more, two-way traffic, divided | 52.59 | 270 (23.7) | 412 (29.0) | 682 (26.6) | |
| Two or more, two-way traffic, not divided | 16.19 | 809 (71.0) | 940 (66.2) | 1749 (68.3) | |
| Intersection type | 1724 | 2009 | 3733 | 53.601 (<0.001) | |
| Not an intersection | 34.98 | 1055 (61.2) | 1424 (70.9) | 2479 (66.4) | |
| Four-way intersection | 1.87 | 374 (21.7) | 381 (19.0) | 755 (20.2) | |
| T and Y intersections | −32.53 | 292 (16.9) | 197 (9.8) | 489 (13.1) | |
| Other | 133.33 | 3 (0.2) | 7 (0.3) | 10 (0.3) | |
| Roadway Driving Conditions | 1725 | 2010 | 3735 | 17.619 (0.002) | |
| Clear conditions | 21.68 | 1098 (63.7) | 1336 (66.5) | 2434 (65.2) | |
| Rain | −14.53 | 179 (10.4) | 153 (7.6) | 332 (8.9) | |
| Cloudy | 20.88 | 388 (22.5) | 469 (23.3) | 857 (22.9) | |
| Sleet/Hail, Snow, Freezing Rain/Drizzle | −48.48 | 33 (1.9) | 17 (0.8) | 50 (1.3) | |
| Other, Fog/Smog/Smoke, Severe Crosswinds | 45.45 | 11 (0.6) | 16 (0.8) | 27 (0.7) | |
| Unknown/Not Reported | 18.75 | 16 (0.9) | 19 (0.9) | 35 (0.9) | |
| Traffic control devices | 1154 | 1460 | 2614 | 12.725 (0.048) | |
| No Controls | 25.12 | 868 (75.2) | 1086 (74.4) | 1954 (74.8) | |
| Traffic Control Signal | 33.09 | 139 (12.0) | 185 (12.7) | 324 (12.4) | |
| Stop Sign | −7.69 | 78 (6.8) | 72 (4.9) | 150 (5.7) | |
| Yield Sign | 300.00 | 1 (0.1) | 4 (0.3) | 5 (0.2) | |
| Railway Crossing | −50.00 | 4 (0.3) | 2 (0.1) | 6 (0.2) | |
| Other Signs/Signals | n/a | 0 (0.0) | 4 (0.3) | 4 (0.2) | |
| Unknown/Not Reported | 67.19 | 64 (5.5) | 107 (7.3) | 171 (6.5) | |
| Lighting conditions | 1725 | 2010 | 3735 | 7.692 (0.174) | |
| Daylight | 10.88 | 864 (50.1) | 958 (47.7) | 1822 (48.8) | |
| Dark, not lighted | 26.64 | 259 (15.0) | 328 (16.3) | 587 (15.7) | |
| Dark, lighted | 18.82 | 510 (29.6) | 606 (30.1) | 1116 (29.9) | |
| Dawn | 0.00 | 42 (2.4) | 42 (2.1) | 84 (2.2) | |
| Dusk | 37.50 | 48 (2.8) | 66 (3.3) | 114 (3.1) | |
| Unknown/Not Reported | 400.00 | 2 (0.1) | 10 (0.5) | 12 (0.3) | |
| Pillar IV: Speed | |||||
| Speed Related, Motor Vehicle Drivers | 664 | 784 | 1448 | 1.973 (0.160) | |
| No | 11.7 | 446 (67.2) | 498 (63.5) | 944 (65.2) | |
| Yes | 31.3 | 217 (32.7) | 285 (36.4) | 502 (34.7) | |
| Unknown | 0.0 | 1 (0.2) | 1 (0.1) | 2 (0.1) | |
| Speed Related, Motorized 2-wheeled MV Drivers | 271 | 397 | 668 | 0.001 (0.981) | |
| No | 45.5 | 154 (56.8) | 224 (56.4) | 378 (56.6) | |
| Yes | 47.9 | 117 (43.2) | 173 (43.6) | 290 (43.4) | |
| Pillar V: Post Crash Care | |||||
| DOA | 1725 | 2010 | 3735 | 5.803 (0.016) | |
| Not dead at scene or en route | 9.90 | 1111 (64.4) | 1221 (60.7) | 2332 (62.4) | |
| Yes, DOA | 29.77 | 608 (35.2) | 789 (39.3) | 1397 (37.4) | |
| Dead at scene | 29.90 | 602 (99.0) | 782 (99.1) | 1384 (99.1) | |
| Dead en route | 16.67 | 6 (1.0) | 7 (0.9) | 13 (0.9) | |
| Unknown | −100.00 | 6 (0.3) | 0 (0.0) | 6 (0.2) | |
| Mode of transport | 1725 | 2010 | 3735 | 12.860 (0.012) | |
| Not transported | 30.21 | 609 (35.3) | 793 (39.5) | 1402 (37.5) | |
| Ambulance, ground | 9.42 | 1083 (62.8) | 1185 (59.0) | 2268 (60.7) | |
| Ambulance, air | 3.85 | 26 (1.5) | 27 (1.3) | 53 (1.4) | |
| Fire/police | n/a | 0 (0.0) | 3 (0.1) | 3 (0.1) | |
| Other/Unknown/Not Reported | −71.43 | 7 (0.4) | 2 (0.1) | 9 (0.2) | |
| Time from crash to hospital arrival | 564 | 585 | 1149 | 7.817 (0.020) | |
| 0–29 min | 13.33 | 195 (34.6) | 221 (37.8) | 416 (36.2) | |
| 30–59 min | 13.64 | 220 (39.0) | 250 (42.7) | 470 (40.9) | |
| 60+ min | −23.49 | 149 (26.4) | 114 (19.5) | 263 (22.9) | |
| Unadjusted OR (95% CI) | Adjusted Multivariable OR (95% CI) | |
|---|---|---|
| Pillar I | ||
| Age | ||
| <=19 | Ref | Ref |
| 20–24 | 1.110 (0.692, 1.779) | 1.227 (0.752, 2.003) |
| 25–29 | 1.068 (0.673, 1.695) | 1.101 (0.680, 1.781) |
| 30–34 | 1.894 (1.174, 3.062) | 1.891 (1.150, 3.116) |
| 35–39 | 1.882 (1.127, 3.156) | 2.025 (1.186, 3.474) |
| 40–44 | 1.335 (0.791, 2.258) | 1.612 (0.931, 2.798) |
| 45–64 | 1.069 (0.697, 1.639) | 1.267 (0.808, 1.985) |
| 65 and over | 1.004 (0.646, 1.558) | 1.390 (0.869, 2.225) |
| Sex | ||
| Female | Ref | Ref |
| Male | 1.120 (0.889, 1.410) | 1.035 (0.803, 1.332) |
| Safety Equipment | ||
| Restrained/helmeted | Ref | Ref |
| Unrestrained/not helmeted | 1.353 (1.123, 1.633) | 1.442 (1.170, 1.780) |
| Pillar II | ||
| Vehicle Type, collapsed | ||
| Motor vehicles, four-wheeled | Ref | Ref |
| Motorized two- and three-wheeled vehicles | 1.229 (1.020, 1.482) | 1.270 (1.018, 1.585) |
| Collision Type | ||
| Not a collision with MV in transport | Ref | Ref |
| Angle | 1.016 (0.816, 1.265) | 1.365 (1.033, 1.809) |
| Head-on | 1.033 (0.808, 1.322) | 1.128 (0.863, 1.476) |
| Rear-end | 1.252 (0.911, 1.729) | 1.262 (0.895, 1.791) |
| Sideswipe | 2.848 (1.593, 5.422) | 2.665 (1.464, 5.152) |
| Other | 0.277 (0.040, 1.208) | 0.276 (0.040, 1.226) |
| Pillar III | ||
| Urbanization | ||
| Rural | Ref | Ref |
| Urban | 1.374 (1.146, 1.646) | 1.467 (1.201, 1.793) |
| Intersection Type | ||
| Intersection | Ref | Ref |
| Not an intersection | 1.393 (1.149, 1.689) | 1.670 (1.312, 2.128) |
| Pillar IV | ||
| Speeding-related Crash | ||
| No | Ref | Ref |
| Yes | 1.140 (0.954, 1.362) | 1.099 (0.889, 1.361) |
| Pillar V | ||
| Post Crash Care | ||
| Not transported | Ref | Ref |
| Transported by ground | 0.859 (0.720, 1.024) | 0.773 (0.636, 0.939) |
| Transported by air | 0.838 (0.447, 1.584) | 0.823 (0.433, 1.577) |
Disclaimer/Publisher’s Note: The statements, opinions and data contained in all publications are solely those of the individual author(s) and contributor(s) and not of MDPI and/or the editor(s). MDPI and/or the editor(s) disclaim responsibility for any injury to people or property resulting from any ideas, methods, instructions or products referred to in the content. |
© 2025 by the authors. Licensee MDPI, Basel, Switzerland. This article is an open access article distributed under the terms and conditions of the Creative Commons Attribution (CC BY) license (https://creativecommons.org/licenses/by/4.0/).
Share and Cite
Pressley, J.C.; Aziz, Z.; Pawlowski, E.; Hines, L.; Roberts, A.; Guzman, J.; Bauer, M. Using a Safe System Framework to Examine the Roadway Mortality Increase Pre-COVID-19 and in the COVID-19 Era in New York State. Int. J. Environ. Res. Public Health 2025, 22, 61. https://doi.org/10.3390/ijerph22010061
Pressley JC, Aziz Z, Pawlowski E, Hines L, Roberts A, Guzman J, Bauer M. Using a Safe System Framework to Examine the Roadway Mortality Increase Pre-COVID-19 and in the COVID-19 Era in New York State. International Journal of Environmental Research and Public Health. 2025; 22(1):61. https://doi.org/10.3390/ijerph22010061
Chicago/Turabian StylePressley, Joyce C., Zarah Aziz, Emilia Pawlowski, Leah Hines, Aisha Roberts, Jancarlos Guzman, and Michael Bauer. 2025. "Using a Safe System Framework to Examine the Roadway Mortality Increase Pre-COVID-19 and in the COVID-19 Era in New York State" International Journal of Environmental Research and Public Health 22, no. 1: 61. https://doi.org/10.3390/ijerph22010061
APA StylePressley, J. C., Aziz, Z., Pawlowski, E., Hines, L., Roberts, A., Guzman, J., & Bauer, M. (2025). Using a Safe System Framework to Examine the Roadway Mortality Increase Pre-COVID-19 and in the COVID-19 Era in New York State. International Journal of Environmental Research and Public Health, 22(1), 61. https://doi.org/10.3390/ijerph22010061