Article

Bibliometric Studies as a Publication Strategy

T. G. Masaryk Water Research Institute, Podbabská 2582/30, 16000 Prague, Czech Republic
Submission received: 16 October 2024 / Revised: 15 November 2024 / Accepted: 20 November 2024 / Published: 21 November 2024

Abstract

:
The number of bibliometric studies published in the scientific literature has been increasing in recent years. Some authors publish more bibliometric studies than others. The aim of this study is to (i) identify authors who focus on bibliometric studies and their publication strategy based on these studies, and to (ii) determine whether the focus of the bibliometric studies can be considered a successful publication strategy. Bibliometric analysis, including citation analysis, was used to determine the results. The Scopus database was selected as the source of bibliometric data. A total of 100 authors who frequently publish bibliometric studies were identified. For almost half of them, bibliometric studies is considered the main or significant part of their publication portfolio. A relatively small group of authors widely publish bibliometric studies. The bibliometric indicators of these authors point out that the specialization of bibliometric studies is quite successful.

1. Introduction

A recent article by Christine Musselin [1] about her publication strategy and her view of the journal’s editorial board connected in my mind with a discussion I recently had with a colleague from the editorial board of the Czech scientific journal Paliva (ISSN 1804-2058). Our discussion was about the “acceptability” of publishing citation analysis studies in a journal that is not specialized in bibliometrics such as [2,3]. One of the ideas that came up in our discussion was that if an article did not only contain citation indicators but also charted the development of topics published in the journal, then it might be acceptable to the editors for publication. Bibliometrics is very suitable for such analysis because it examines multiple parameters and trends over time.
Like any researcher, I looked for answers to my questions in the available literature. Therefore, after the mentioned discussion, I started looking for bibliometric studies of one particular journal. Bibliometric studies of a particular journal provide detailed insights into various aspects of the journal’s publication history. Bibliometric indicators such as impact factor [4], H-index [5], and other metrics (e.g., Eigenfactor [6], CiteScore [7], SJR [8]) help to understand the development of the journal and its position in the academic environment and its role in scientific communication [9,10]. Many of the bibliometric indicators used for one particular journal study were described by Anyi et al. [11]. By analyzing the most cited papers [12,13] and frequently covered topics [14,15], bibliometric studies can identify emerging research trends [16,17] and key topics [18,19] within a journal. Bibliometric studies reveal patterns in publication and citation, such as the prevalence of multi-authored articles and the types of sources most frequently cited. This information can indicate the collaborative nature of the research and the topicality of the cited literature [14,20]. Analysis of journal content over time provides insights into the development and visibility of specific research fields [21,22]. It can help researchers to identify target journals for their manuscripts [23].
To my surprise, I found more than three hundred bibliometric studies focused on the analysis of a single journal in the Scopus database for the years 2021 to 2024. I did not continue my search any further into the past. At the same time, I noticed that some authors’ names were repeated. Therefore, it can be assumed that some authors use bibliometric analysis as one of the main scientific methods of their research.
Another possible explanation for ever-recurring author names in bibliometric studies is that it is a certain publication strategy. The publication strategy is a plan of how, when, and what research will be published including the type of paper [24]. The publication strategy of researchers is a multifaceted approach that varies significantly across disciplines and career stages. Research on publication strategies has focused, for example, on the diversity of journals of young researchers [25], the criteria for selecting a journal for submission [26], the influence of the journal’s bibliometric indicators on the interest of authors to publish in it [27], etc.
As a user of bibliometrics and scientometrics, I soon realized that the bibliometric study of one particular journal is a relatively simple study that nowadays has more the character of a routine task than a scientific work. This statement may seem controversial to some readers, and in part, it may be. After all, publishing controversial topics is also one of the publishing strategies [28].
However, my statement is not intended to be controversial but is based on three basic assumptions: 1. the availability of quality guidelines for bibliometric analysis; 2. the availability of quality bibliometric data; 3. the availability of tools for automated or semi-automated bibliometric analysis. All of these assumptions are currently met. Researchers can use many methodological resources to help them select topics for bibliometric analysis [29], implement bibliometric analysis [30,31], and report it [32]. Bibliometric data for a sufficiently long period can be obtained from databases such as Scopus [33], Web of Science [34], Dimensions. AI [35], OpenAlex [36], or Crossref [37]. Likewise, several software tools are available to carry out bibliometric analyses [38] such as Publish or Perish [39], VOSviewer [40], ScientoPy [41], Bibliometrix [42], and others.
From my point of view, a bibliometric study of one particular journal does not meet two criteria defining research [43]. This is a requirement of “creativity” and “research uncertainty”. Uncertainty is low because bibliometric databases provide data needed to perform bibliometric analyses. The researcher’s creativity contribution then lies in the application of the right search queries which cover the entire breadth of the researched topic, and in the selection of the right methods. In the case of a bibliometric analysis of one particular journal, the scope of the topic (which is the researched journal) is clearly defined. In the case of a journal indexed in a selected bibliometric database, the uncertainty of defining a query is practically eliminated.
A researcher can choose research questions creatively. However, given the number of already published bibliometric studies, researchers can hardly find a new research question that could be applied to the bibliometric mapping of one particular journal. The last area in which the researchers show a creative approach is the choice of methods to answer research questions. Even here though, there is currently not much space for creativity, because the methods are determined by the selected bibliometric software. Thus, the bibliometric study of one particular journal can currently be carried out as a routine task or exercise in bibliometrics. It is only necessary to be able to use available sources and tools correctly. This is the reason why I consider the bibliometric analysis of one particular journal to be a simple routine task. This is good news for researchers in the field of bibliometrics, as it proves that bibliometrics is a tool of everyday life and no specific skills are needed.
The fact that bibliometrics has become a commonly used method is evidenced by the number of articles published in scientific literature. As of July 2024, more than 23,000 documents containing the terms “bibliometric study”, “bibliometric analysis”, “scientometric study”, or “scientometric analysis” in the Title or Keywords are indexed in the Scopus database. Of these, 77% were published after 2019 (Figure 1).
This study aims to (i) analyze the structure of authors publishing bibliometric studies, (ii) find out whether some of these authors include bibliometric studies in their publication strategy, and (iii) whether such a strategy is successful. It seems that no one has seriously dealt with this topic so far. The conclusions of this research are important for editors of scientific journals and reviewers of bibliometric studies.

2. Materials and Methods
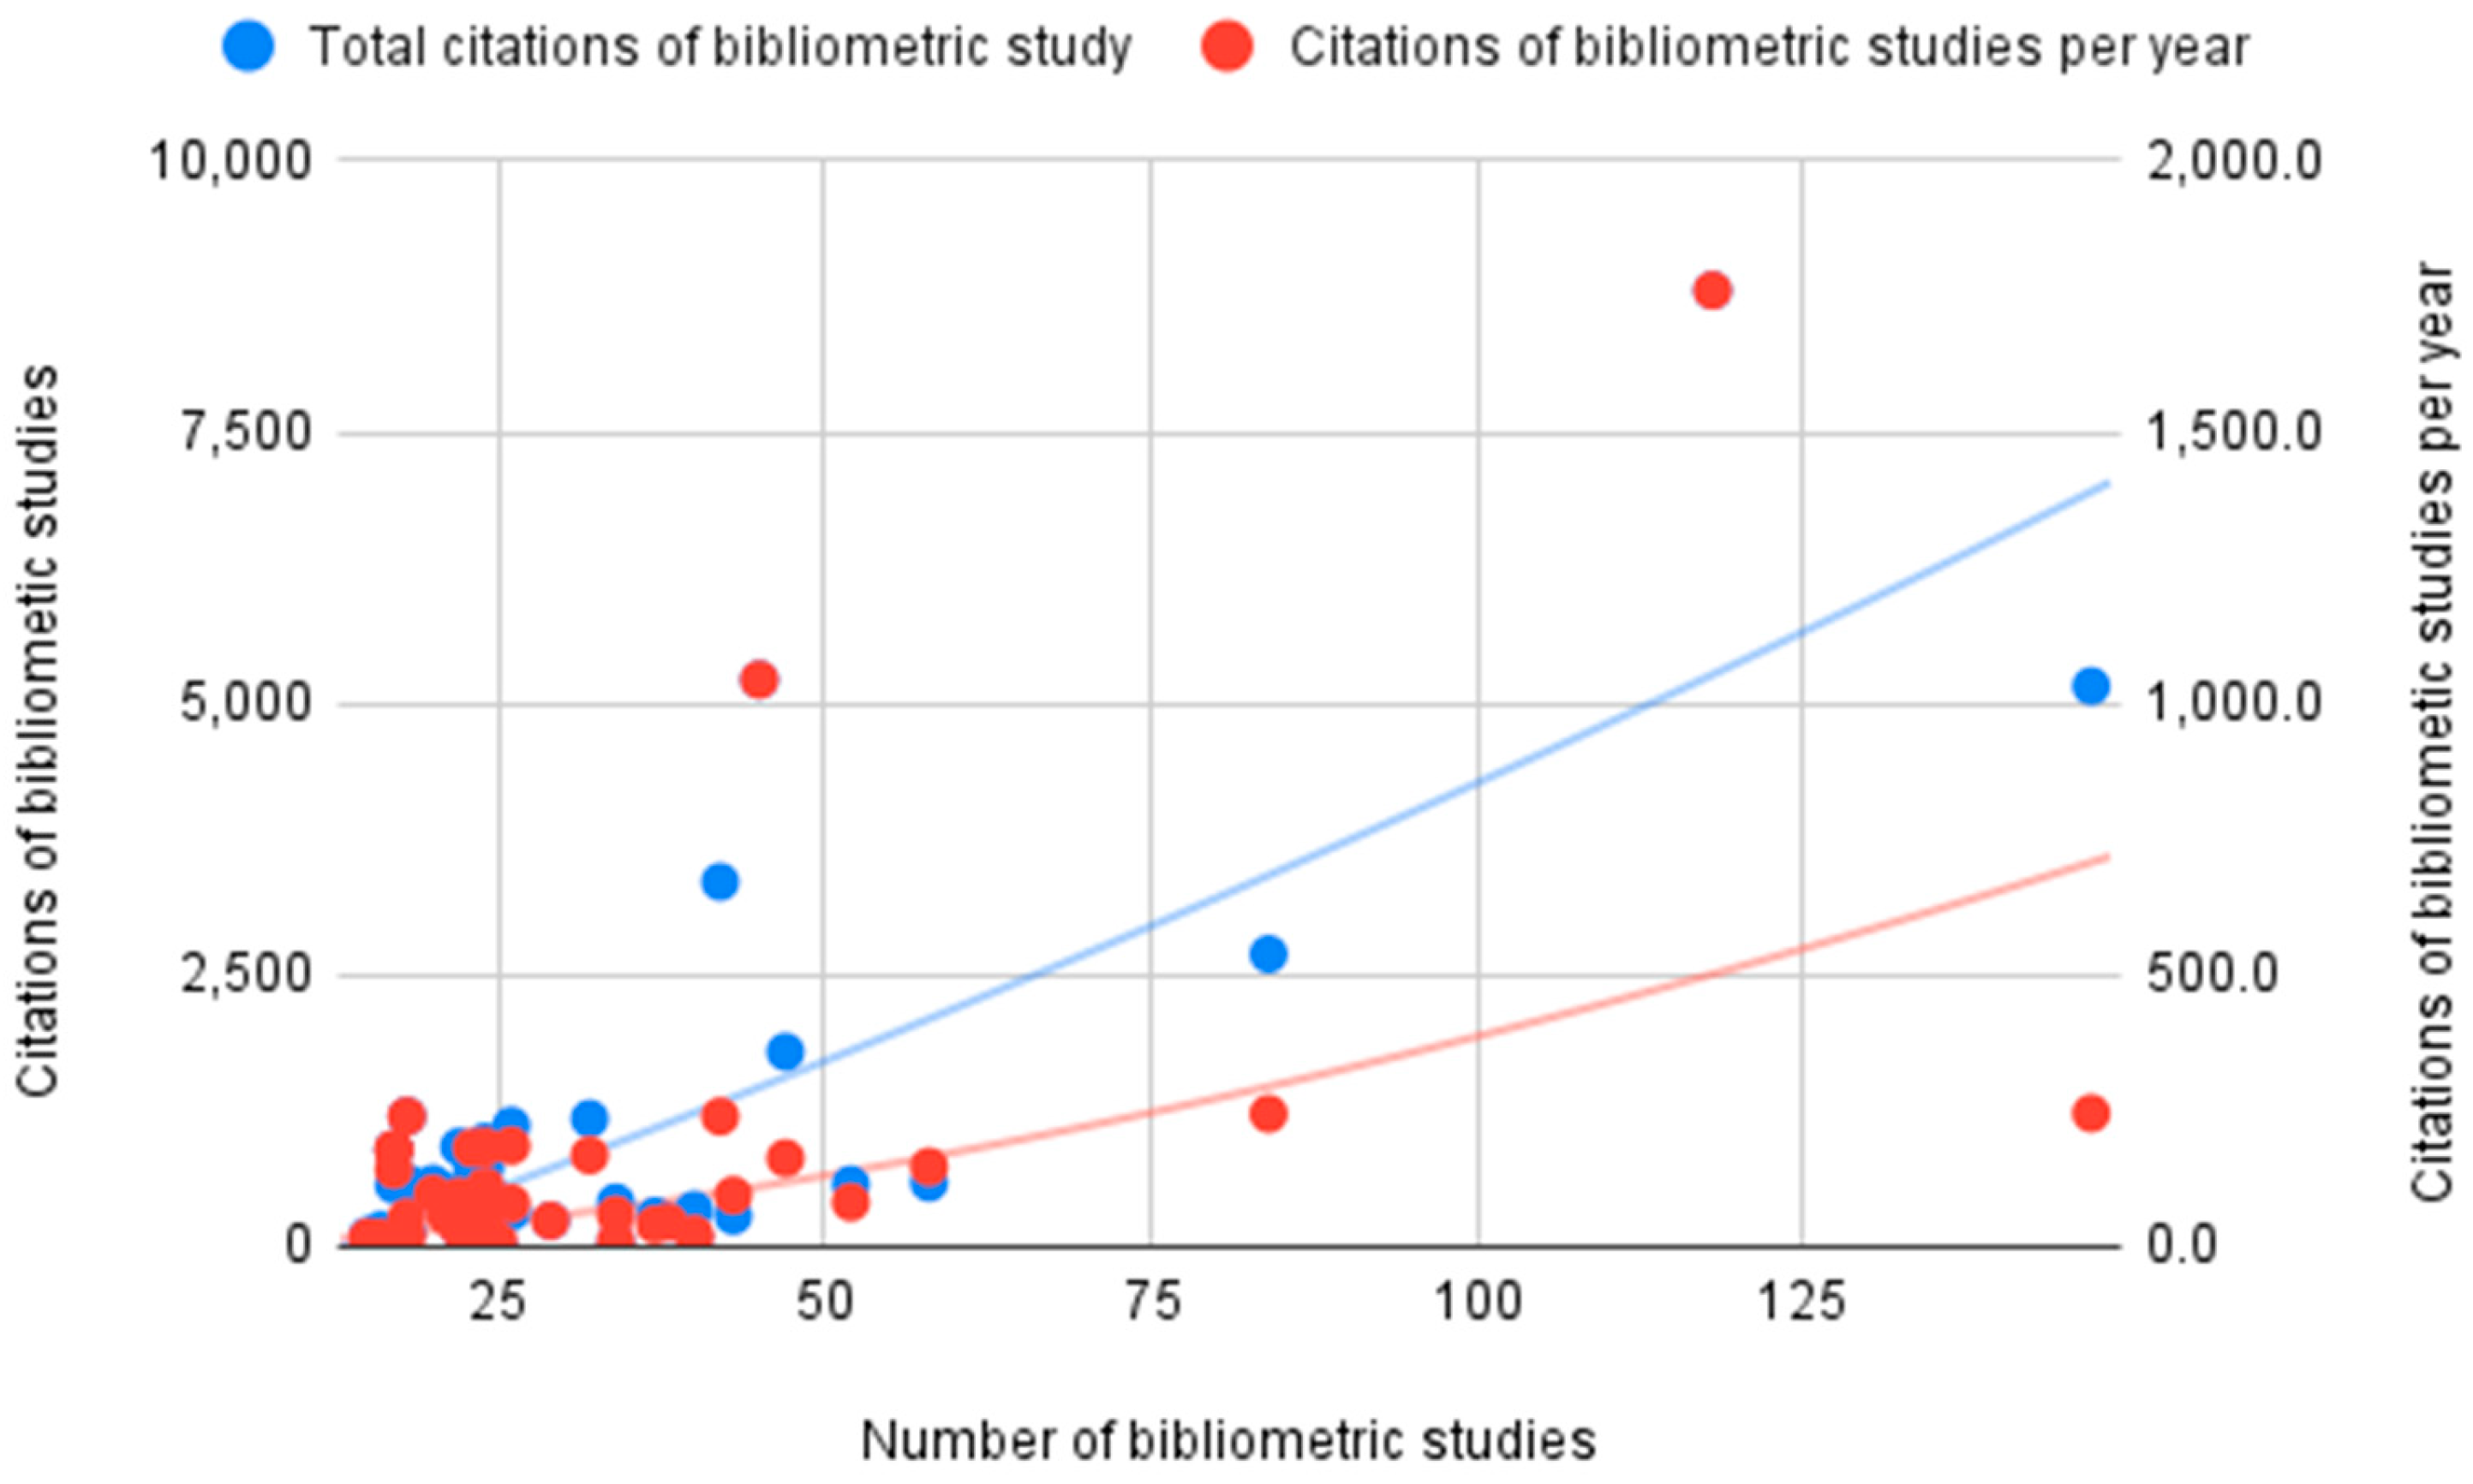
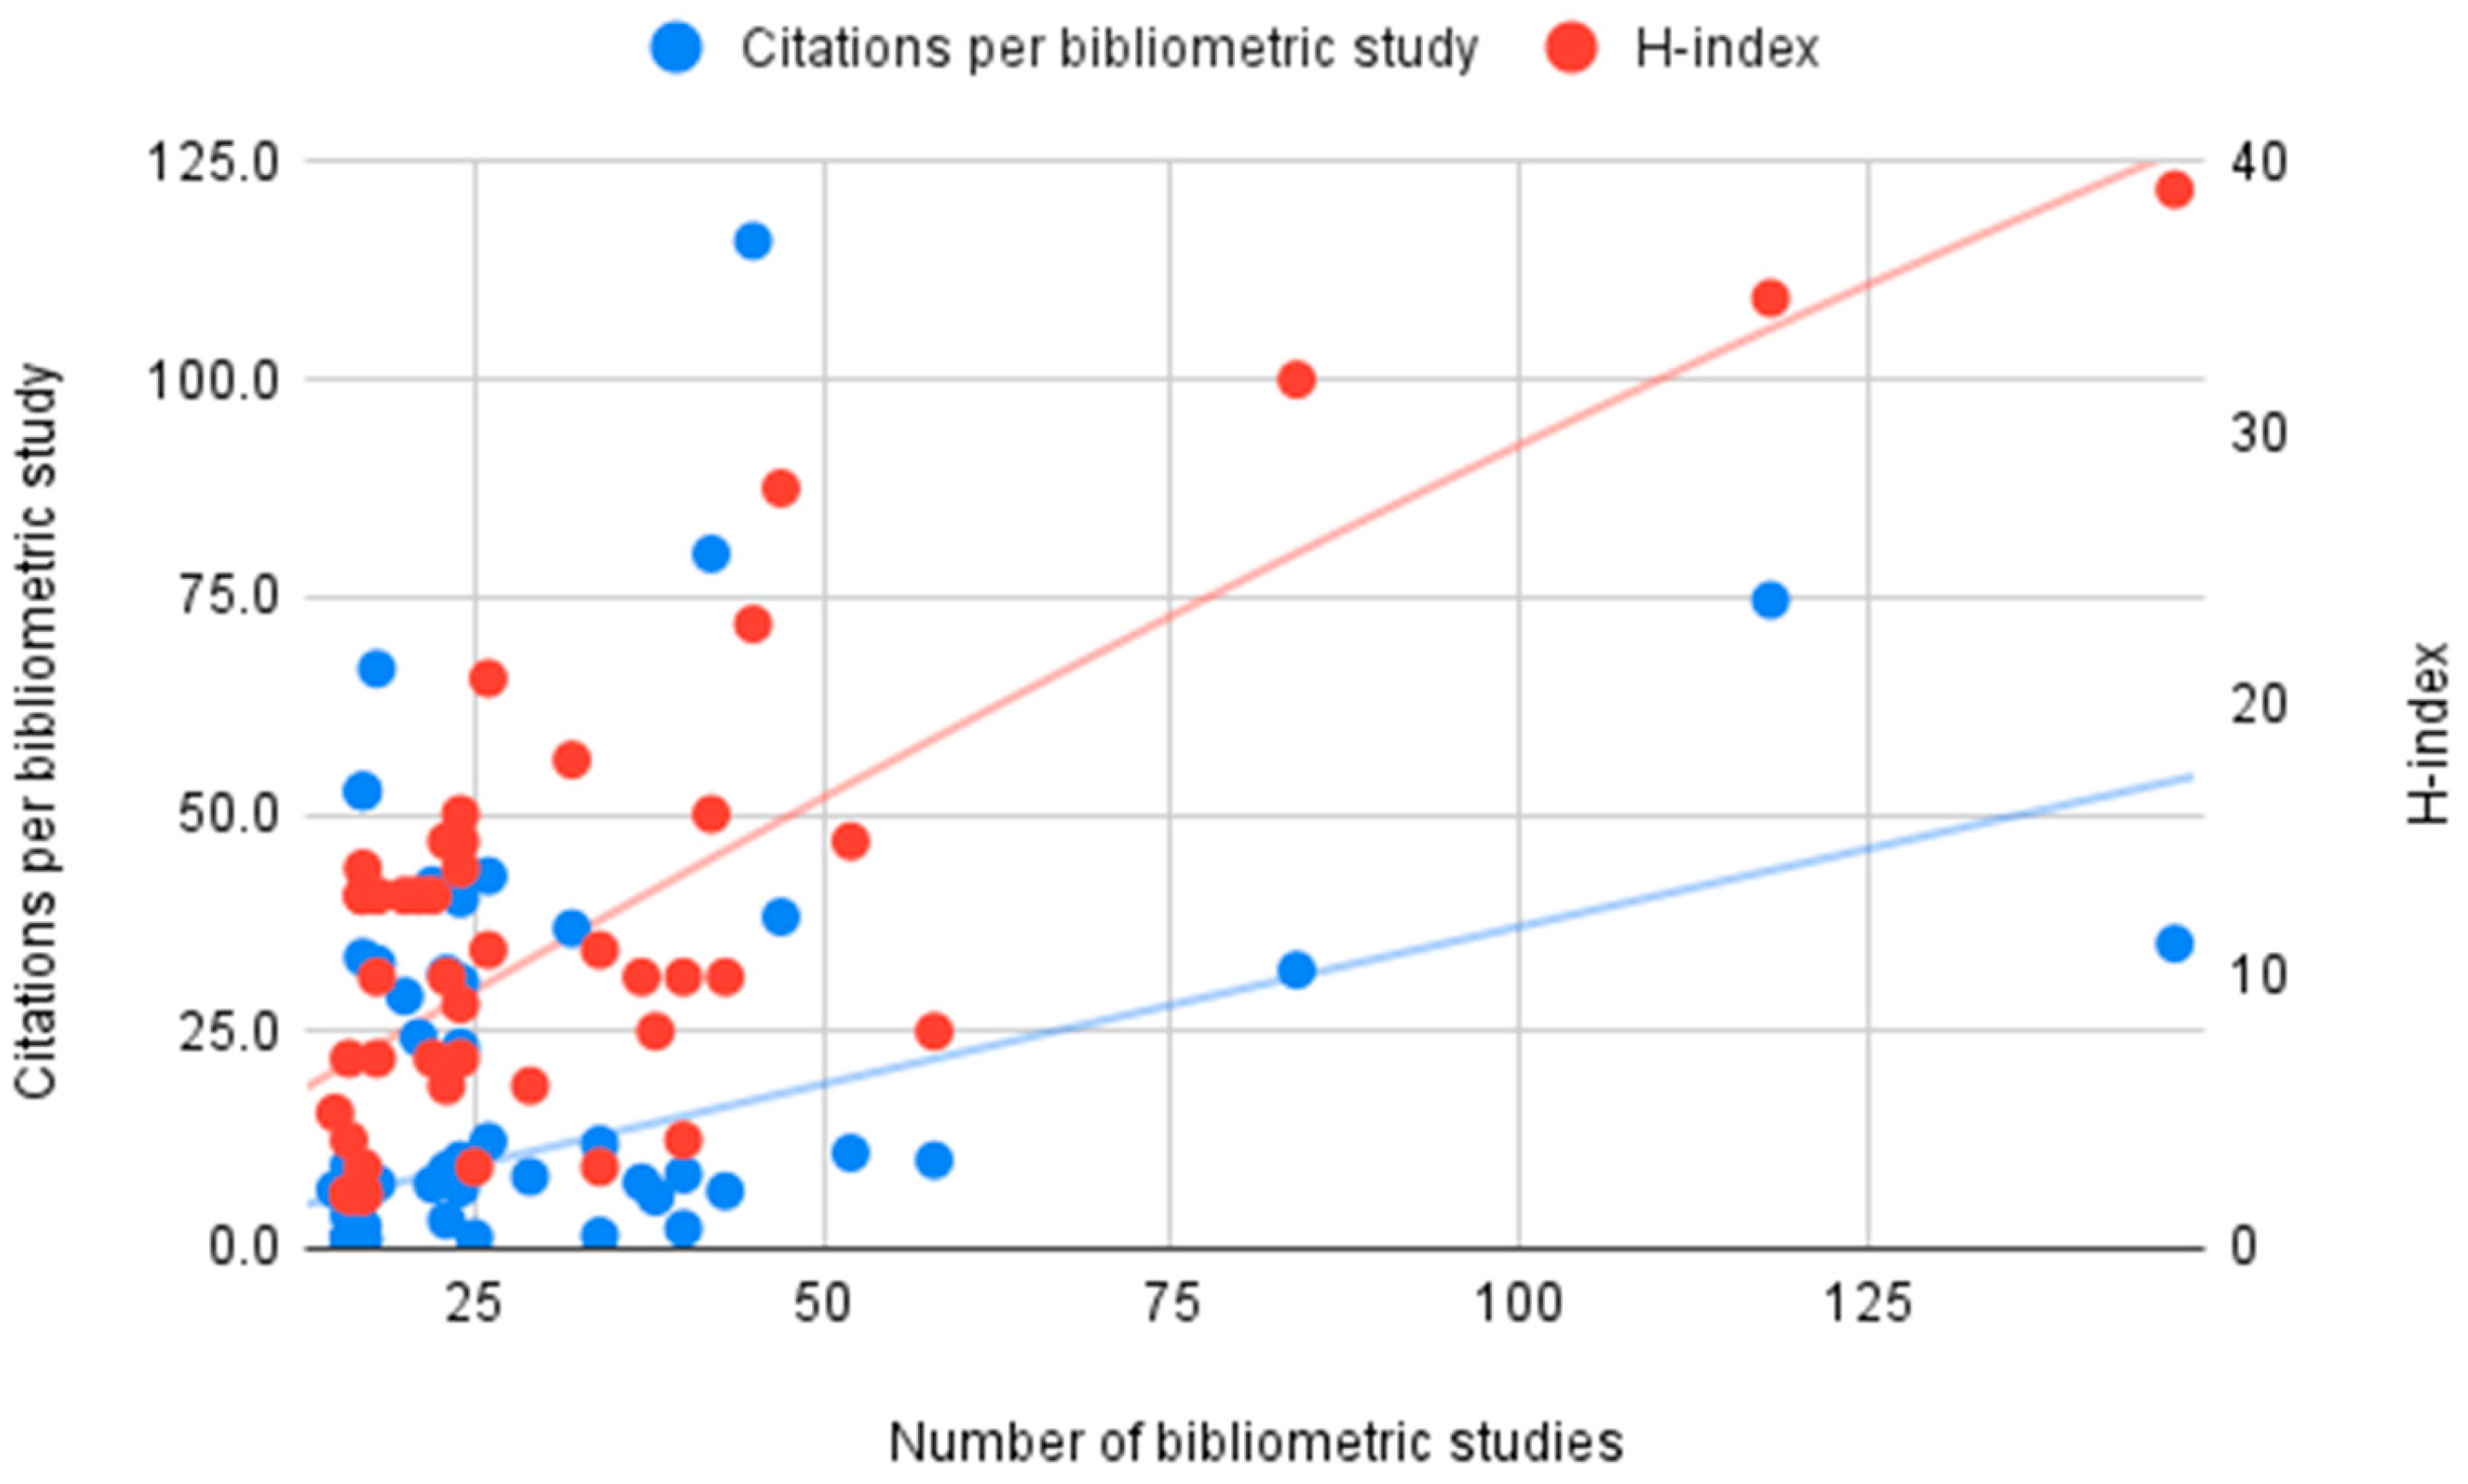
The Scopus and Web of Science databases are the two main bibliometric sources. Many authors [44,45,46,47] compare these two databases from different perspectives. The overlap is very high, though Scopus indexes more publications [47]. The Scopus and Web of Science databases are selective, so indexed sources must meet certain quality criteria. It can be said that these databases cover the core of scientific publications. There are other bibliometric resources such as the already mentioned Dimensions. AI, OpenAlex, or CrossRef, which index even more documents than Scopus or Web of Science. These databases are focused on DOI (Digital Object Identifier) documents, so they better cover the scientific periphery. The largest source of bibliometric data is Google Scholar, but it has many limitations for bibliometric analyses [48]. Therefore, the Scopus database was chosen for data collection.
Since the terms “scientometrics” and “bibliometrics” as well as the terms “analysis” and “study” are often confused, a combination of these terms was chosen. The search was set to the fields “Title” and “Author Keywords”. The resulting query had the form:
TITLE (“scientometric stud*” OR “scientometric anal*”) OR AUTHKEY (“scientometric stud*” OR “scientometric anal*”) OR TITLE (“bibliometric stud*” OR “bibliometric anal*”) OR AUTHKEY (“bibliometric stud*” OR “bibliometric anal*”).
The query was applied on 17 July 2024, with a result of 23,055 publications. Data on these publications were exported in csv format. Using the Scopus web interface, authors with at least 15 contributions were identified. For each author, the number of contributions (according to the query described above) and the total number of their publications (TP) indexed in the Scopus database were determined. Authors likely to include bibliometric studies in their publication strategy were identified. These are authors whose share of publications according to the query was ≥25% of their total number of publications. For these authors, bibliometric study information was exported to csv format to enable bibliometric mapping. Furthermore, basic scientometric indicators such as the number of citations (TC), number of citations per article (TC/TP), H-index (H), number of citations per H-index (TC/H), and number of publications per H-index (TP/H) were determined. These data were found for (i) all their publications and separately also for (ii) publications according to the above query. At the same time, the period in which they published their bibliometric studies was determined, which made it possible to normalize scientometric indicators for bibliometric studies according to the number of years.
These basic scientific indicators can be used to compare individual authors. The total number of papers published by an author is a basic measure of productivity that can be used to compare the performance of different researchers. This indicator should be used with caution when comparing the productivity of authors, as the number only indicates the quantity without indicating the quality of the publications. The number of citations is a key indicator used to evaluate the influence of researchers or their work. A higher number of citations often correlates with a higher quality and importance of the research. The H-index [5] is a bibliometric indicator that measures both productivity and citation impact. The H-index is the number of publications with citation number ≥ H. Despite its limitations [49,50,51], the H-index has become one of the most widely used bibliometric indicators. Ratio indicators (e.g., TC/TP) enable relative comparison of individual authors. In particular, the ratio of bibliometric studies to the author’s total number of publications indicates the author’s specialization in bibliometric studies. Other indicators were used to describe the success of this publication strategy.
In order to assess the success of the inclusion of bibliometric studies in the publication strategy, the share of uncited (uncitedness) of authors’ bibliometric studies was evaluated.
Bibliometric mapping was performed using the VOSviewer program, version 1.6.20, which uses the VOS method [52]. Co-authorship analysis at the author and country level was used to find out how these authors collaborate.

3. Results

Based on the above-mentioned query, a total of 100 different authors were identified who published more than 15 bibliometric studies (Table 1). Of these, bibliometric studies made up more than 25% of their publications for 49 authors, and even more than half of their publications for 14 authors. These 49 authors published a total of 1135 publications and received 30,973 citations, i.e., the average number of citations per publication was 27.3 citations. The bibliometric indicators for 14 authors with more than half of their publications are shown in Table 2 and Table 3.
As of the date of this analysis, 197 articles were not cited, i.e., uncitedness was 17.4%. One uncited article was from 2014, 1 uncited article from 2015, 4 uncited articles from 2019, 4 uncited articles from 2020, 7 uncited articles from 2021, 16 uncited articles from 2022, 84 uncited articles from 2023, and 80 uncited articles from 2024.
Kolesnikov et al. [53] argued that the publication strategy aimed at increasing publishing productivity may lead to a decline in publication impact despite productivity growth. This does not seem to be a publication strategy focused on the bibliometric studies as shown in Figure 2 and Figure 3, where both figures show positive value trends. This means that a higher number of bibliometric studies leads to better author performance.
Researchers from a total of 81 countries contributed to the articles of 49 authors who were likely to include bibliometric studies in their publication strategy. Most often, they were researchers from China, India, and Taiwan. Researchers from 22 countries (Table 4) published more than 15 bibliometric studies.
Figure 4 shows networks of co-authorship collaboration between authors who were likely to include bibliometric studies in their publication strategy. Figure 4 shows only the results for authors with 15 bibliometric studies. On the contrary, Figure 5 shows cooperation within particular countries. Figure 5 shows all the countries involved in the publications of authors who were likely to include bibliometric studies in their publication strategy.

4. Discussion

4.1. Networks of Cooperation

Authors who were likely to include bibliometric studies in their publication strategy and have published more than 15 bibliometric studies in most cases collaborate with each other (groups of the same color connected by lines in Figure 4). In addition, these author clusters are often linked by the co-authorship of members of other clusters. In total, it is possible to identify 15 individual authors or groups of authors who are not connected in the form of collaborators on articles.
At the same time, as evident from Figure 5, cooperation on bibliometric studies is international. An interesting fact is that the most active authors are from Asian countries, specifically from China, India, Taiwan, Malaysia, and Pakistan. The first non-Asian country is Spain (in sixth place). The high number of bibliometric studies by Palestinian and Saudi authors is also interesting. Bibliometric studies seem to be popular in countries that are not among the most active in other areas of research. At present, it is not possible to state what is the cause of this. However, as this study indicates, certain groups of researchers from these countries focus on bibliometric studies as their publication strategy.

4.2. The Success of a Publication Strategy Based on Bibliometric Studies

For the 49 authors who included bibliometric studies in their publication strategy, the number of publications needed to obtain 1 H-index point ranged from 1.2 to 11.3 with a mean of 3.9 and a median of 3.0 publications.
The non-citation rate is also relatively low, but this may be due to the fact that the field is undoubtedly experiencing its heyday, as evidenced by the number of published bibliometric studies.
This analysis suggests that bibliometric studies are a relatively effective publication strategy. However, there are also other types of articles that are successful. According to Miranda and Garcia-Carpintero [54], average citations received by reviews are approximately three times higher than citations received by original research articles.

4.3. Limitation and Future Directions

The limitation of this study is the selection of the Scopus database as the only source of bibliometric data. The inclusion of other bibliometric sources could increase the coverage of the study. It can be expected that this increase will be not significant, as researchers who develop specific publication strategies based on the publication of many bibliometric studies, will focus on the main or “core” scientific journals. Of course, there are also other strategies focused on popular or regional journals, which are described, e.g., by Donovan [55], but similar publication strategies are probably in the minority.
Another potential limitation of the study is the selection criteria for involving only authors with 15 published bibliometric analyses that represent more than 25% of their publications. The numbers 15 and 25% were selected empirically. On one hand, the study aimed to focus on authors who use bibliometric studies as their main or significant type of publication. On the other hand, the goal was to obtain a data set large enough for statistical assessment. Setting different criterion values would quite significantly change the size of the data set entering the assessment.
Future research should focus on several aspects. First, it will be appropriate to deal with the criteria that describe specialization in a specific type of publication and the values of these criteria. Second, the research can focus on the motivation of researchers to publish mainly bibliometric studies. Another direction could be to focus on trends in bibliometric indicators, identification of driving forces that affect these indicators, and compare these indicators with other publication strategies. In particular, the comparison with other publication strategies (from the perspective of the type of published papers) can provide interesting data for the entire bibliometric and scientometric research.

4.4. Ethical Aspects and Practical Recommendation

According to the Frascati manual [43], research and experimental development consists of creative and systematic work carried out in order to obtain new knowledge and/or design new applications of available knowledge. A scientific article should therefore fulfill these features of research and experimental development. As already mentioned in the Introduction Section, current tools and bibliometric databases make it easy to create bibliometric studies.
One of the ethical questions raised by the mass publication of bibliometric studies is the question of whether it is still research or just an “exercise in bibliometrics”. Another question that will be appropriate to deal with is whether there is a purposeful dilution of scientific topics and salami publishing. A typical topic for discussion is individual bibliometric studies of a single journal, where data for a number of journals can be collected and analyzed in one step. By simply setting up scripts for data mining, analysis, and visualization, a series of outputs, tables, and figures can be generated that look like specific results of analysis for one particular scientific journal. A typical salami publication [56] is the division of these results into as many papers as possible in order to increase the number of publications. It should be discussed whether these studies still provide new knowledge.
In particular, editors of scientific journals and reviewers of submitted bibliometric studies should ask whether the manuscript brings new knowledge. New knowledge can be in the form of new research questions, as well as in innovative methods, ways of interpreting results, etc. In particular, the interpretation of results should then be placed in the context of the research questions and should not be just a simple summary of the outputs of software tools used for bibliometric analyses.
Authors of bibliometric studies should describe former studies on the same topic and clearly state what is new in their work and/or how they fill gaps in former studies. Bibliometric studies must be a balanced, informative, and personal but unbiased review of bibliometric data that provides complex and commented views on these data.

5. Conclusions

This study is probably the first study focused on a specific type of publications, which are bibliometric studies, as a publication strategy. It seems that a new group of researchers is emerging who specialize in this type of publication in their publication strategy. In this study, the group of authors who have published 15 or more bibliometric studies was assessed. In fact, the group is very small and contributes only to the production of bibliometric studies with only 0.2%. However, the group is quite significantly connected by mutual co-authorships, which indicate a targeted specialization in this type of study. This study also showed that this publication strategy can be successful and can lead to a relatively rapid acquisition of citations. For early-carrier researchers in all fields of study, it can be an interesting and relatively easy way to increase their bibliometric values and scientific impact. On the other hand, it should be emphasized that even a bibliometric study published in a scientific journal should bring new knowledge and should not be a mere “exercise in bibliometrics”.

Funding

This research received no external funding.

Institutional Review Board Statement

Not applicable.

Informed Consent Statement

Not applicable.

Data Availability Statement

The data that support the findings of this study are available on request from the corresponding author [L.A.]. The data are not publicly available due to restrictions of Scopus database.

Acknowledgments

The author would like to thank the anonymous reviewers for their valuable comments.

Conflicts of Interest

The author declares no conflicts of interest.

References

  1. Musselin, C. Transformed Publication Strategies. Eur. Rev. 2024, First View, 1–10. [Google Scholar] [CrossRef]
  2. Ansorge, L. Citační analýza časopisu VTEI. Vodohospodářské Tech.-Ekon. Inf. 2022, 64, 47–54. [Google Scholar] [CrossRef]
  3. Ansorge, L. Srovnání citovanosti časopisu VTEI v databázích Web of Science a Scopus. Vodohospodářské Tech.-Ekon. Inf. 2024, 66, 32–37. [Google Scholar]
  4. Garfield, E. The History and Meaning of the Journal Impact Factor. JAMA 2006, 295, 90–93. [Google Scholar] [CrossRef] [PubMed]
  5. Hirsch, J.E. An Index to Quantify an Individual’s Scientific Research Output. PNAS 2005, 102, 16569–16572. [Google Scholar] [CrossRef] [PubMed]
  6. Bergstrom, C. Eigenfactor: Measuring the Value and Prestige of Scholarly Journals. Coll. Res. Libr. News 2007, 68, 314–316. [Google Scholar] [CrossRef]
  7. Colledge, L.; James, C.; Azoulay, N.; Meester, W.; Plume, A. CiteScore Metrics Are Suitable to Address Different Situations—A Case Study. Eur. Sci. Ed. 2017, 43, 27–31. [Google Scholar] [CrossRef]
  8. González-Pereira, B.; Guerrero-Bote, V.P.; Moya-Anegón, F. A New Approach to the Metric of Journals’ Scientific Prestige: The SJR Indicator. J. Informetr. 2010, 4, 379–391. [Google Scholar] [CrossRef]
  9. García-Villar, C.; García-Santos, J.M. Indicadores Bibliométricos Para Evaluar La Actividad Científica. Radiología 2021, 63, 228–235. [Google Scholar] [CrossRef]
  10. Joshi, M.A. Bibliometric Indicators for Evaluating the Quality of Scientific Publications. J. Contemp. Dent. Pract. 2014, 15, 258–262. [Google Scholar] [CrossRef]
  11. Anyi, K.W.U.; Zainab, A.N.; Anuar, N.B. Bibliometric Studies on Single Journals: A Review. Malays. J. Libr. Inf. Sci. 2009, 14, 17–55. [Google Scholar]
  12. Vishwanathan, K.; Kambhampati, S.B.S.; Patralekh, M.K.; Vaish, A.; Vaishya, R. Bibliometric Analysis of the Top 50 Most Cited Publications of the Journal of Clinical Orthopaedics and Trauma. J. Clin. Orthop. Trauma 2021, 22, 101590. [Google Scholar] [CrossRef] [PubMed]
  13. Yang, L.-C.; Liu, F.-H.; Liu, C.-M.; Yu, C.-H.; Chang, Y.-C. Bibliometric Analysis of Top-Cited Articles in Journal of Dental Sciences. J. Dent. Sci. 2023, 18, 338–344. [Google Scholar] [CrossRef] [PubMed]
  14. Wilson, M.L. Topics, Author Profiles, and Collaboration Networks in the Journal of Research on Technology in Education: A Bibliometric Analysis of 20 Years of Research. J. Res. Technol. Educ. 2024, 56, 291–313. [Google Scholar] [CrossRef]
  15. Ellili, N.O.D. Bibliometric Analysis on Corporate Governance Topics Published in the Journal of Corporate Governance: The International Journal of Business in Society. Corp. Gov. Int. J. Bus. Soc. 2022, 23, 262–286. [Google Scholar] [CrossRef]
  16. Aristizabal, D.; Lara, A.; Payares, V.; Alzate, A. Bibliometric Analysis and Research Trends of A Journal: Magazine of Civil Engineering. Libr. Philos. Pract. 2021, 1–24. [Google Scholar]
  17. Parab, S.Y.; Thakkar, V. Trends in Research in Indian Journal of Anaesthesia—A Bibliometric Analysis. Indian J. Anaesth. 2023, 67, 1130. [Google Scholar] [CrossRef]
  18. Donthu, N.; Lim, W.M.; Kumar, S.; Pattnaik, D. A Scientometric Study of the Journal of Advertising Research: Prominent Contributors and Research Themes from 1996 to 2019. J. Advert. Res. 2022, 62, 105–117. [Google Scholar] [CrossRef]
  19. Donthu, N.; Kumar, S.; Ranaweera, C.; Pattnaik, D.; Gustafsson, A. Mapping of Journal of Services Marketing Themes: A Retrospective Overview Using Bibliometric Analysis. J. Serv. Mark. 2021, 36, 340–363. [Google Scholar] [CrossRef]
  20. Baker, H.K.; Kumar, S.; Pattnaik, D. Research Constituents, Intellectual Structure, and Collaboration Pattern in the Journal of Forecasting: A Bibliometric Analysis. J. Forecast. 2021, 40, 577–602. [Google Scholar] [CrossRef]
  21. Yihua, W.; Meng, F.; Farrukh, M.; Raza, A.; Alam, I. Twelve Years of Research in The International Journal of Islamic and Middle Eastern Finance and Management: A Bibliometric Analysis. Int. J. Islam. Middle East. Financ. Manag. 2022, 16, 154–174. [Google Scholar] [CrossRef]
  22. Carey, L.B.; Kumar, S.; Goyal, K.; Ali, F. A Bibliometric Analysis of the Journal of Religion and Health: Sixty Years of Publication (1961–2021). J. Relig. Health 2023, 62, 8–38. [Google Scholar] [CrossRef] [PubMed]
  23. Gureyev, V.N.; Mazov, N.A. Detection of Information Requirements of Researchers Using Bibliometric Analyses to Identify Target Journals. Inf. Technol. Libr. 2013, 32, 66–77. [Google Scholar] [CrossRef]
  24. Joubert, P.H.; Rogers, S.M. Publication Strategy. In Strategic Scientific and Medical Writing: The Road to Success; Joubert, P.H., Rogers, S.M., Eds.; Springer: Berlin/Heidelberg, Germany, 2015; pp. 133–136. ISBN 978-3-662-48316-9. [Google Scholar]
  25. Zhang, Y.; Yu, Q. What Is the Best Article Publishing Strategy for Early Career Scientists? Scientometrics 2020, 122, 397–408. [Google Scholar] [CrossRef]
  26. Nicholas, D.; Rodríguez-Bravo, B.; Watkinson, A.; Boukacem-Zeghmouri, C.; Herman, E.; Xu, J.; Abrizah, A.; Świgoń, M. Early Career Researchers and Their Publishing and Authorship Practices. Learn. Publ. 2017, 30, 205–217. [Google Scholar] [CrossRef]
  27. Śpiewanowski, P.; Talavera, O. Journal Rankings and Publication Strategy. Scientometrics 2021, 126, 3227–3242. [Google Scholar] [CrossRef]
  28. Coronel, R. On Publication Strategies. Another Advice to a Beginning Scientist. Front. Physiol. 2020, 11, 1073. [Google Scholar] [CrossRef]
  29. Lund, B. How to Select Better Topics and Design Better Bibliometrics and Scientometrics Studies: A Perspective. J. Scientometr. Res. 2021, 10, 348–351. [Google Scholar] [CrossRef]
  30. Donthu, N.; Kumar, S.; Mukherjee, D.; Pandey, N.; Lim, W.M. How to Conduct a Bibliometric Analysis: An Overview and Guidelines. J. Bus. Res. 2021, 133, 285–296. [Google Scholar] [CrossRef]
  31. Öztürk, O.; Kocaman, R.; Kanbach, D.K. How to Design Bibliometric Research: An Overview and a Framework Proposal. Rev. Manag. Sci. 2024, 18, 3333–3361. [Google Scholar] [CrossRef]
  32. Montazeri, A.; Mohammadi, S.; Hesari, M.P.; Ghaemi, M.; Riazi, H.; Sheikhi-Mobarakeh, Z. Preliminary Guideline for Reporting Bibliometric Reviews of the Biomedical Literature (BIBLIO): A Minimum Requirements. Syst. Rev. 2023, 12, 239. [Google Scholar] [CrossRef] [PubMed]
  33. Baas, J.; Schotten, M.; Plume, A.; Côté, G.; Karimi, R. Scopus as a Curated, High-Quality Bibliometric Data Source for Academic Research in Quantitative Science Studies. Quant. Sci. Stud. 2020, 1, 377–386. [Google Scholar] [CrossRef]
  34. Birkle, C.; Pendlebury, D.A.; Schnell, J.; Adams, J. Web of Science as a Data Source for Research on Scientific and Scholarly Activity. Quant. Sci. Stud. 2020, 1, 363–376. [Google Scholar] [CrossRef]
  35. Thelwall, M. Dimensions: A Competitor to Scopus and the Web of Science? J. Informetr. 2018, 12, 430–435. [Google Scholar] [CrossRef]
  36. Priem, J.; Piwowar, H.; Orr, R. OpenAlex: A Fully-Open Index of Scholarly Works, Authors, Venues, Institutions, and Concepts. In Proceedings of the 26th International Conference on Science and Technology Indicators, Granada, Spain, 7–9 September 2022; Faculty of Communication and Documentation, University of Granada: Granada, Spain, 2022; p. sti22193. [Google Scholar]
  37. Hendricks, G.; Tkaczyk, D.; Lin, J.; Feeney, P. Crossref: The Sustainable Source of Community-Owned Scholarly Metadata. Quant. Sci. Stud. 2020, 1, 414–427. [Google Scholar] [CrossRef]
  38. Moral-Muñoz, J.A.; Herrera-Viedma, E.; Santisteban-Espejo, A.; Cobo, M.J. Software Tools for Conducting Bibliometric Analysis in Science: An up-to-Date Review. Prof. De La Inf. 2020, 29. [Google Scholar] [CrossRef]
  39. Harzing, A.-W. Publish or Perish 2007.
  40. Van Eck, N.J.; Waltman, L. Software Survey: VOSviewer, a Computer Program for Bibliometric Mapping. Scientometrics 2010, 84, 523–538. [Google Scholar] [CrossRef]
  41. Ruiz-Rosero, J.; Ramirez-Gonzalez, G.; Viveros-Delgado, J. Software Survey: ScientoPy, a Scientometric Tool for Topics Trend Analysis in Scientific Publications. Scientometrics 2019, 121, 1165–1188. [Google Scholar] [CrossRef]
  42. Aria, M.; Cuccurullo, C. Bibliometrix: An R-Tool for Comprehensive Science Mapping Analysis. J. Informetr. 2017, 11, 959–975. [Google Scholar] [CrossRef]
  43. OECD. Frascati Manual 2015: Guidelines for Collecting and Reporting Data on Research and Experimental Development; Organisation for Economic Co-operation and Development: Paris, France, 2015. [Google Scholar] [CrossRef]
  44. Chadegani, A.A.; Salehi, H.; Yunus, M.M.; Farhadi, H.; Fooladi, M.; Farhadi, M.; Ebrahim, N.A. A Comparison between Two Main Academic Literature Collections: Web of Science and Scopus Databases. Asian Soc. Sci. 2013, 9, p18. [Google Scholar] [CrossRef]
  45. Gavel, Y.; Iselid, L. Web of Science and Scopus: A Journal Title Overlap Study. Online Inf. Rev. 2008, 32, 8–21. [Google Scholar] [CrossRef]
  46. Asubiaro, T.; Onaolapo, S.; Mills, D. Regional Disparities in Web of Science and Scopus Journal Coverage. Scientometrics 2024, 129, 1469–1491. [Google Scholar] [CrossRef]
  47. Visser, M.; van Eck, N.J.; Waltman, L. Large-Scale Comparison of Bibliographic Data Sources: Scopus, Web of Science, Dimensions, Crossref, and Microsoft Academic. Quant. Sci. Stud. 2021, 2, 20–41. [Google Scholar] [CrossRef]
  48. Delgado López-Cózar, E.; Orduña-Malea, E.; Martín-Martín, A. Google Scholar as a Data Source for Research Assessment. In Springer Handbook of Science and Technology Indicators; Glänzel, W., Moed, H.F., Schmoch, U., Thelwall, M., Eds.; Springer International Publishing: Cham, Switzerland, 2019; pp. 95–127. ISBN 978-3-030-02511-3. [Google Scholar]
  49. Bi, H.H. Four Problems of the H-Index for Assessing the Research Productivity and Impact of Individual Authors. Scientometrics 2023, 128, 2677–2691. [Google Scholar] [CrossRef]
  50. Brito, R.; Navarro, A.R. The Inconsistency of H-Index: A Mathematical Analysis. J. Informetr. 2021, 15, 101106. [Google Scholar] [CrossRef]
  51. Bornmann, L.; Mutz, R.; Daniel, H.-D. Are There Better Indices for Evaluation Purposes than the h Index? A Comparison of Nine Different Variants of the h Index Using Data from Biomedicine. J. Am. Soc. Inf. Sci. Technol. 2008, 59, 830–837. [Google Scholar] [CrossRef]
  52. Van Eck, N.J.; Waltman, L. VOS: A New Method for Visualizing Similarities between Objects. In Proceedings of the Advances in Data Analysis, Berlin, Germany, 8–10 March 2006; Decker, R., Lenz, H.-J., Eds.; Springer: Berlin/Heidelberg, Germany, 2007; pp. 299–306. [Google Scholar]
  53. Kolesnikov, S.; Fukumoto, E.; Bozeman, B. Researchers’ Risk-Smoothing Publication Strategies: Is Productivity the Enemy of Impact? Scientometrics 2018, 116, 1995–2017. [Google Scholar] [CrossRef]
  54. Miranda, R.; Garcia-Carpintero, E. Overcitation and Overrepresentation of Review Papers in the Most Cited Papers. J. Informetr. 2018, 12, 1015–1030. [Google Scholar] [CrossRef]
  55. Donovan, S.K. Planning for Academic Publishing After Retirement: Some Results and Observations. Publications 2024, 12, 38. [Google Scholar] [CrossRef]
  56. Gollogly, L.; Momen, H. Ethical Dilemmas in Scientific Publication: Pitfalls and Solutions for Editors. Rev. Saúde Pública 2006, 40, 24–29. [Google Scholar] [CrossRef]
Figure 1. Number of bibliometric/scientometric studies/analyses (source: Scopus 17 July 2024).
Metrics 01 00005 g001
Figure 2. Scatter plots of total citations and citations per year of bibliometric studies versus the total number of publications of bibliometric studies by 49 authors. The solid curves are the best-fitted regression models for scatter-plot data.
Metrics 01 00005 g002
Figure 3. Scatter plots of citations per bibliometric study and H-index versus the total number of publications of bibliometric studies by 49 authors. The solid curves are the best-fitted regression models for scatter-plot data.
Metrics 01 00005 g003
Figure 4. Collaborative networks of authors who have published at least 15 bibliometric studies, and were likely to include bibliometric studies in their publication strategy.
Metrics 01 00005 g004
Figure 5. Collaborative networks of countries from which authors come who were likely to include bibliometric studies in their publication strategy.
Metrics 01 00005 g005
Table 1. The number of authors according to the share of bibliometric studies in the total number of their publications.
Share of Bibliometric Studies0.1–24.9%25.0–49.9%50.0–74.9%75.0–100.0%
Number of authors513586
Table 2. The number of publications and citations of the author from all his publications (T) and from bibliometric studies (B) for authors for whom bibliometric studies make up the majority of their publications.
AuthorAU-IDTP(T)TP(B)TP(B)/TP(T)TC(T)TC(B)TC(B)/TC(T)
Pandey, N.57211577722544583.33%5630521892.68%
Khan, M.A.58159005100463882.61%24522792.65%
Ali, N.57215970226282382.14%997575.76%
Sun, J.55716207000272281.48%22916371.18%
Yang, Q.57819576200211676.19%461532.61%
Sureka, R.57211688395322475.00%74255674.93%
Tian, H.57820440500231773.91%511529.41%
Zheng, D.57789410300231773.91%331957.58%
Wu, J.57789839000251768.00%371951.35%
Chen, L.57788554900251664.00%381950.00%
She, Z.57789623900261661.54%381950.00%
Montalván-Burbano, N.57210814655392358.97%94172877.36%
Siddique, N.24173820100512956.86%40824058.82%
Chen, X.57031196900643250.00%2309117951.06%
AU-ID—author Scopus ID; TP(T)—total number of publications of the author; TP(B)—total number of author’s bibliometric studies; TC(T)—total number of author’s citations; TC(B)—total number of citations of author’s bibliometric studies.
Table 3. The number of publications and citations of the author from all his publications (T) and from bibliometric studies (B) for authors for whom bibliometric studies make up the majority of their publications.
AuthorAU-IDH(T)H(B)TP(B)/H(B)TC(B)/H(B)TP(B)/Years
Pandey, N.572115777222626262626
Khan, M.A.581590051002323232323
Ali, N.572159702262.02.02.02.02.0
Sun, J.55716207000226.9226.9226.9226.9226.9
Yang, Q.578195762009.09.09.09.09.0
Sureka, R.5721168839599999
Tian, H.5782044050088888
Zheng, D.577894103004.14.14.14.14.1
Wu, J.5778983900028.428.428.428.428.4
Chen, L.577885549007.67.67.67.67.6
She, Z.5778962390066666
Montalván-Burbano, N.5721081465566666
Siddique, N.241738201003.33.33.33.33.3
Chen, X.5703119690012.512.512.512.512.5
H(T)—H-index of the author from all his publications; H(B)—H-index of the author from bibliometric studies; TP(B)/H(B)—number of publications per 1 H-index point; TC(B)/H(B)—number of citations per 1 H-index point; TP(B)/years—average number of bibliometric studies published per year.
Table 4. Countries of authors with more than 15 bibliometric studies.
CountryTP(B)TC(B)TC(B)/TP(B)CountryTP(B)TC(B)TC(B)/TP(B)
China268752028.1Peru491062.2
India207968946.8Turkey3753314.4
Taiwan199567728.4Germany3586224.6
Malaysia150750650.0Hong Kong3482424.2
Pakistan1096095.6Ecuador2993032.1
Spain107570453.3Brazil282137.6
United States94709075.4Canada2777028.5
Palestine92287731.3Sudan2629611.4
Saudi Arabia726258.7Iran221456.6
Australia64580690.7Italy1819110.6
United Kingdom51130825.6Nigeria1856831.6
Disclaimer/Publisher’s Note: The statements, opinions and data contained in all publications are solely those of the individual author(s) and contributor(s) and not of MDPI and/or the editor(s). MDPI and/or the editor(s) disclaim responsibility for any injury to people or property resulting from any ideas, methods, instructions or products referred to in the content.

