1. Introduction
The excessive consumption of fossil fuels and the resulting greenhouse gas emissions, particularly CO
2, constitute the primary drivers of global warming, profoundly impacting both the natural environment and the sustainable development of human society [
1,
2]. As the world’s largest energy consumer, China accounted for 26.5% of global energy consumption in 2021 and remains the leading nation for CO
2 emissions. Furthermore, China is one of the most acutely vulnerable nations to the adverse effects of global climate change [
3]. In response, China has made climate change mitigation a national priority, committing to ambitious carbon reduction objectives. At the Paris Climate Conference, China pledged to reduce carbon emissions by 60~65% for per unit of Gross Domestic Product (GDP) by 2030 compared with 2005 levels, and to achieve peak carbon emissions and carbon neutrality by 2060 [
4]. Due to unprecedented economic growth, energy consumption continues to rise, particularly in industrial production processes, complicating the achievement of these carbon reduction targets. The absence of precise energy consumption data at the district and county levels in urban areas significantly impedes the accurate estimation of CO
2 emissions, leading to data inconsistencies and posing challenges for systematic regional climate studies. Consequently, the robust estimation of CO
2 emissions from energy consumption in Chinese cities, alongside a comprehensive analysis of their spatio-temporal evolution and influencing factors, is critical for devising refined pollution control and carbon mitigation strategies. With the national “Belt and Road” development strategy, Xi’an city, the historical starting point of China’s Silk Road and a significant economic and cultural hub in the northwest, has experienced accelerated economic growth while prioritizing environmental governance and carbon reduction initiatives. Thus, a thorough understanding of CO
2 emissions and spatial distribution dynamics at the district and county levels in Xi’an is vital for providing scientifically grounded guidance in formulating and implementing effective carbon reduction strategies. This understanding is pivotal for advancing ecological preservation and promoting regionally coordinated development in China’s central and western regions.
With the development of remote sensing technology, nightlight data have been extensively applied in key fields such as economic development assessments and energy consumption modeling [
5,
6], owing to their objectivity, availability, timeliness, and long-term continuity. This technology addresses the limitations of incomplete statistical data at the municipal and county levels, yielding significant research outcomes. Due to the inherent limitations of traditional fine-scale statistical data and inconsistencies in statistical standards, researchers have increasingly turned to nighttime light data for estimating carbon emissions at finer spatial scales. In 1997, Elvidge et al. identified a correlation between the brightness of nighttime light data and global CO
2 emissions [
7]. Subsequently, Doll et al. conducted a quantitative analysis of nighttime light brightness values from 46 countries and their CO
2 emissions, demonstrating for the first time that DMSP-OLS nighttime light data could effectively represent the spatial distribution of global CO
2 concentrations [
8]. Raupach et al. further explored this relationship by selecting multiple countries as sample regions and constructing correlations between average nightlight brightness within national administrative boundaries and carbon emissions [
9]. Using global energy statistics and power plant carbon emission monitoring data, Oda and Maksyutov developed a global, national-scale annual CO
2 emission inventory database [
10]. These studies have consistently affirmed the robust linear correlation between nighttime light data and CO
2 emissions at global and national scales. Chinese researchers have also made notable contributions to fine-scale investigations. For instance, in 2013, Su et al. pioneered the use of DMSP-OLS nighttime light data to estimate energy-related CO
2 emissions at the municipal scale in China [
11]. Similarly, Meng et al. conducted analogous studies to examine urban carbon emissions in China [
12]. More recently, a growing body of research has leveraged datasets such as DMSP-OLS, NPP-VIIRS, and Luojia-1 nighttime light data to analyze urban spatial patterns of carbon emissions [
13,
14,
15]. The principal advantage of employing nighttime light data in carbon emission estimations lies in its ability to produce high-resolution emission estimates, particularly in data-scarce regions, providing a rapid, accurate, and cost-effective alternative to traditional methods of carbon emission evaluation [
16].
Carbon emissions have been assessed or studied frequently on large scales, for example, China as a whole [
17,
18,
19,
20]. However, the precise assessment of carbon emissions on fine scales is a challenge. Nonetheless, some studies have been conducted on local scales; for example, carbon emissions from the building sector were estimated for the Noord Brabant region in the Netherlands [
21], and the carbon emissions of the Beijing-Tianjin-Hebei areas of China were estimated [
13]. The scaling effects of carbon emissions were also studied in Hubei province, China [
16]. These studies are at least on provincial scales. Focused on Xi’an, this study employs the U.S. Black Marble nighttime light dataset, integrated with socio-economic and industrial energy consumption statistics, to estimate refined scale, district (county) level, industrial energy-related carbon emissions for the years 2012 and 2022. By examining both the spatial and temporal patterns of carbon emissions and carbon emission intensity over a decade, this research seeks to elucidate the influence of socio-economic development and industrial structuring on carbon emissions in Xi’an city. We aim to provide reliable and actionable data to support social and economic development across various districts and counties and inform policy making related to energy conservation and carbon reduction.
3. Results
3.1. Refined Spatial Distributions of Carbon Emissions
This study utilized the ArcGIS raster calculator to compute the monthly average nighttime light data for 2012 and 2022 and subsequently overlaid these datasets on the administrative boundaries of Xi’an. Through the application of zonal statistics, the total nighttime light intensity values for each district and county were calculated. By integrating these results, this study estimated the total carbon emissions across Xi’an’s districts and counties for 2012 and 2022, thereby constructing a carbon emission estimation model. The results of linear and polynomial regression fitting for 2022 are presented in
Figure 2.
The analysis revealed a robust linear correlation between the total Black Marble nightlight values and the energy consumption-derived carbon emission statistics for Xi’an’s districts and counties in 2012 and 2022, with coefficients of determination (R
2) of 0.7838 and 0.7941, respectively. Furthermore, the study assessed the suitability of alternative functional relationships. The exponential function produced R
2 values of 0.7013 and 0.7252, the logarithmic function yielded R
2 values of 0.6985 and 0.7099, and the power function returned R
2 values of 0.6549 and 0.6723. Among these models, the linear regression model demonstrated the strongest fit (
Table 2). Among polynomial functions, the quadratic model presented R
2 values of 0.7971 and 0.8087, respectively, i.e., close to the linear function result. Consequently, a linear model between nightlight data and carbon emissions was established, facilitating the estimation of refined regional carbon emissions.
Building on the previously derived fitting relationships, this study extracted individual raster light intensity values from the nightlight data to calculate the corresponding carbon emission estimates. Through the application of the natural breaks classification method, carbon emissions in Xi’an were classified into five distinct categories based on data from 2012 and 2022. As a result, detailed spatial distribution maps of carbon emissions were generated (
Figure 3). The maps clearly indicate that the primary carbon emission hotspots in Xi’an were consistently located at the intersections of the Yanta, Lianhu, Xincheng, Weiyang, and Baqiao districts. Additionally, the spatial distribution of carbon emissions demonstrated a pronounced outward extension from the central areas of Yanta, Lianhu, Xincheng, and Weiyang districts, with emissions particularly concentrated in the northern regions. In contrast, the surrounding areas exhibited lower levels of carbon emissions. A comparative analysis of the data from 2012 and 2022 revealed that carbon emissions in Xi’an’s central urban areas have increased over the ten-year period. Furthermore, the high-carbon-emission zones have expanded, resulting in an increased affected area. Similar patterns were found also by Zhang et al. [
25].
3.2. Carbon Emissions at the District and County Scales
This study calculated the carbon emissions of Xi’an and its districts (counties) for the years 2012 and 2022 (
Table 3). In 2012, Xi’an’s total carbon emissions were 17.0893 million tons, increasing to 19.9281 million tons by 2022, representing a 16.61% increase over the decade. The carbon emissions increased in all seven districts (counties) of Xi’an, with the most significant growth concentrated in the central urban areas. Specifically, Weiyang, Yanta, and Baqiao districts exhibited the largest increases, with growth rates of 64.75%, 48.09%, and 46.00%, respectively. In contrast, Xincheng, Yanliang, Lintong, and Huyi districts and Lantian and Zhouzhi counties demonstrated reductions in carbon emissions. Except for Xincheng district, which forms part of the central urban area, the remaining districts are predominantly peripheral regions. Among these, Lantian and Zhouzhi counties exhibited the most substantial reductions, with decreases of 20.39% and 18.05%, respectively.
In 2012, Yanta and Chang’an districts were the highest contributors to Xi’an’s carbon emissions, with emissions of 2.3756 million tons and 2.1887 million tons, accounting for 13.90% and 12.81% of the city’s total emissions, respectively. Yanliang district had the lowest emissions, totaling 0.5641 million tons and representing 3.3% of overall emissions. In 2022, Yanta and Chang’an districts remained the leading contributors, with Yanta district’s emissions surpassing 3.5 million tons. Additionally, Weiyang district’s carbon emissions increased to over 2.5 million tons. For the carbon emissions of each district (county), this study categorized and analyzed Xi’an’s districts (counties) in 2012 and 2022 (
Figure 4) using the following classification: C < 100: Low; 100 ≤ C < 130: Relatively Low; 130 ≤ C < 160: Medium; 160 ≤ C < 190: Relatively High; C ≥ 190: High (Unit: ten thousand tons). A distribution map was generated based on this classification, revealing that high-carbon-emission areas were primarily concentrated in the central region. In 2012, the high-emission districts were Chang’an and Yanta. By 2022, three districts, Yanta, Chang’an, and Weiyang, were identified as high-carbon-emission areas. Meanwhile, Xincheng and Huyi districts, Zhouzhi county, exhibited reductions, transitioning from medium to relatively low carbon emission categories.
In summary, Xi’an’s total carbon emissions increased over the decade, with emissions rising differently across districts (counties), demonstrating distinct spatial distribution characteristics. Carbon emissions became increasingly concentrated in Yanta, Chang’an, and Weiyang districts, forming a core distribution structure that expanded over the decade. Conversely, peripheral districts and counties experienced reductions in emissions. Throughout this period, Xi’an’s central urban areas consistently maintained higher levels of carbon emissions, with a noticeable expansion trend. In contrast, the peripheral districts (counties) showed declining emissions. Furthermore, there was a significant disparity between the carbon emissions of urban areas and suburban (county) areas. This disparity is closely linked to differences in development levels, commercial activities, and industrial distributions across the city’s districts.
3.3. Carbon Emission Intensity at the District and County Scale
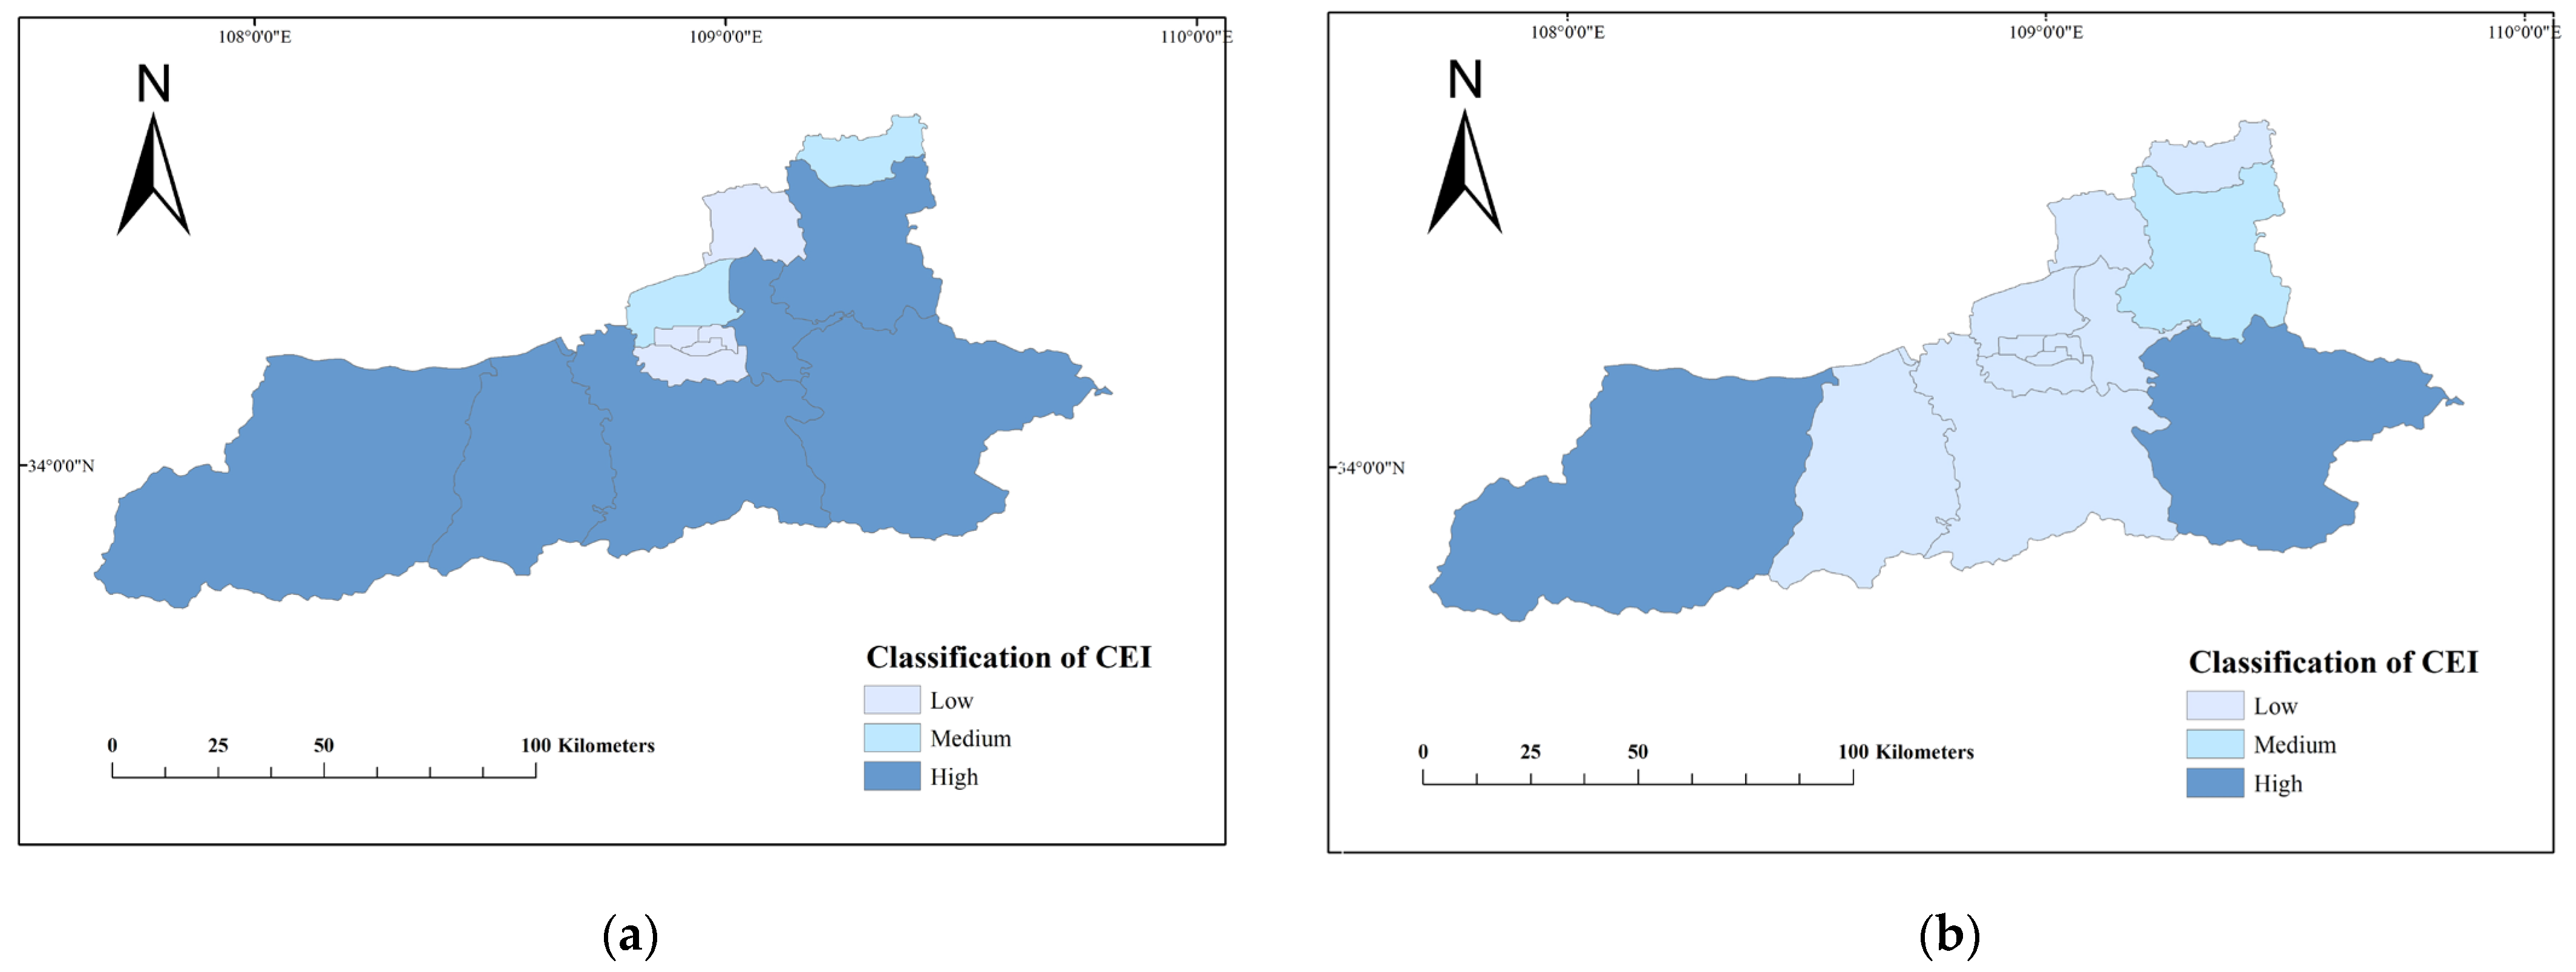
This study calculated the carbon emission intensity of each district (county) in Xi’an using Formula (2). Based on the natural breaks method and practical considerations, the emission intensity was classified into three levels: low intensity (less than 0.3), moderate intensity (between 0.3 and 0.5), and high intensity (greater than 0.5) (
Figure 5). From 2012 to 2022, Xi’an’s carbon emission intensity decreased from 0.406 to 0.184, moving from moderate intensity to low intensity, with a decrease in carbon emission intensity across all districts and counties. In 2012, six districts (counties) had high carbon emission intensities. By 2022, it had reduced to two: Zhouzhi County and Lantian County. The number of districts with low carbon emission intensity increased from five to ten. The study also calculated the change in carbon emission intensities from 2012 to 2022 (
Figure 6). Chang’an district exhibited the most substantial reduction, with a decline exceeding 70%. Similarly, notable decreases of over 50% were observed in Beilin district, Yanta district, and peripheral districts such as Huyi district, Zhouzhi county, and Lantian county. From a spatial perspective, carbon emission intensity was consistently lower in central urban areas and higher in the peripheral districts (counties). Over the decade, regions with low carbon emission intensities expanded outward from the central urban zones, while emission intensity in peripheral districts also exhibited a significant decline.
Areas with lower carbon emission intensity were predominantly concentrated in Xi’an’s economic and industrial hubs, where carbon emission efficiencies tended to be higher. Conversely, regions with higher carbon emission intensity were mainly situated in the less-developed surrounding counties. For instance, Yanta district and Lianhu district, which displayed lower carbon emission intensities, experienced significant growth in tertiary industries, including services and commerce. Additionally, the improvement in Xi’an’s low-carbon industrial framework, combined with advancements in green technology innovation and accelerated industrial upgrading, contributed to the reduction in carbon emission intensity despite the ongoing industrial expansion.
3.4. Classification of Carbon Emissions and Carbon Emission Intensity
To clearly illustrate the spatial distribution of carbon emissions and carbon emission intensity across districts and counties, this study created a classification map (
Figure 7) that categorizes these areas into four types: high carbon emissions–high carbon emission intensity (High-High), high carbon emissions–low carbon emission intensity (High-Low), low carbon emissions–high carbon emission intensity (Low-High), and low carbon emissions–low carbon emission intensity (Low-Low). According to the classification results, in 2012, the High-High areas were limited to Baqiao district and Lintong district; the High-Low areas included Yanta district, Chang’an district, Weiyang district, Lianhu district, Beilin district, and Xincheng district; the Low-High areas included Huyi district, Lantian county, and Zhouzhi county; while the Low-Low areas were represented by Gaoling district and Yanliang district. By 2022, the High-High areas had contracted to Lintong district, the High-Low areas expanded to encompass Yanta district, Chang’an district, Weiyang district, Lianhu district, Beilin district, Xincheng district, and Baqiao district; the Low-High areas included Lantian county and Zhouzhi county; and the Low-Low areas remained Gaoling district and Yanliang district.
The findings indicate that most districts and counties in Xi’an fell into the High-Low category, with the number of these areas increasing from 2012 to 2022. While these districts exhibited higher carbon emissions, their relatively low emission intensities suggested improvements in carbon emission efficiency amid rapid urbanization and economic growth. In contrast, Low-High districts, primarily located in peripheral regions, were characterized by slower rates of urbanization and economic development. Districts within the Low-Low category, such as Gaoling district and Yanliang district, represented “double low” areas, offering significant potential for carbon reduction in the urbanization and industrialization process.
4. Discussion
4.1. Steady Socio-Economic Development Is the Primary Driving Force for Carbon Emission Increases
From 2012 to 2022, the scale of the city, GDP, and industrialization levels across all districts and counties in Xi’an experienced rapid growth. In 2012, the city’s GDP stood at 42.0377 million Chinese yuan. It increased to 108.5964 million yuan in 2022. This reflected a growth of 1.58 times over the decade. Notably, following 2017, economic development demonstrated steady, stepwise growth. During the same period, Xi’an’s population expanded from 7,959,800 to 12,995,900, representing an increase of 63.27%. Specifically, after 2014, the population entered a phase of rapid growth (
Figure 8).
From the perspective of GDP and population changes across districts and counties, Xi’an’s GDP exhibited consistent growth between 2012 and 2022 (
Figure 9). The districts with the most significant increases in GDP were Yanta, Weiyang, and Chang’an districts, where GDP grew by 2.58, 2.02, and 3.16 times, respectively. Meanwhile, the population in these districts increased by 77.42%, 97.37%, and 49.34%, respectively (
Figure 10). These changes correlate closely with high carbon emission areas. Meanwhile, the populations of Lantian and Zhouzhi Counties in the periphery decreased slightly, and the overall trend was to move to the central area, which is consistent with the change trend of the spatial distribution of carbon emissions.
Xi’an has undergone a rapid urbanization process. At the founding of the People’s Republic of China in 1949, Xi’an’s built-up area was less than 14 km
2, accounting for only 0.14% of the total area. By 2000, this figure had risen to 187 km
2, and by 2012, it had more than doubled to 395 km
2. By the end of 2022, the built-up area had grown further to 830.29 km
2, accounting for 8.22% of the total area, marking a significant acceleration compared to the previous decade (
Figure 11). A comparison of urbanization rates between 2012 and 2022 (
Figure 12) revealed that Xi’an’s overall urbanization rate increased from 50.05% in 2012 to 79.59% in 2022. By 2022, the urbanization rates in Weiyang district and Yanta district reached 100%, while Baqiao district nearly doubled its urbanization rate to approximately 100%. Notably, Chang’an district experienced the most rapid growth, with its urbanization rate rising from 16.77% to 63.74%.
At the same time, the population density is also constantly increasing. In 2012, the population density of Xi’an was 875/km
2, and it grew to 1223 by 2022. Beilin, Lianhu, and Xincheng districts have consistently ranked as the three regions with the highest population density; their respective population densities reached 34,916, 27,873, and 21,619 people per square kilometer in 2022, demonstrating their sustained dominance in urban demographic concentration, while this index for Huayin, Zhouzhi, and Lantian always stayed below 500. With the exception of Lantian and Zhouzhi, two peripheral counties that experienced a decrease in population density, all other districts exhibited varying degrees of population density growth. Notably, the most significant increases were observed in Weiyang, Yanta, and Baqiao districts, each surpassing a 7% growth rate (
Figure 13). In the past decade, while urbanization has rapidly advanced, the population density of Xi’an has also continued to increase, and economic activities have been concentrated from the surrounding areas toward the center, which is consistent with the increasing trend of carbon emissions in the central urban areas.
The socio-economic development, urban expansion, and rising levels of population density and urbanization have substantially intensified population activity and industrialization, leading to an increased reliance on fossil fuels. These factors represent the primary drivers of the persistent rise in carbon emissions across Xi’an’s districts and counties. Furthermore, they have contributed significantly to the concentration of carbon emissions in urbanized areas, reflecting the ongoing centralization of economic activities.
4.2. Policy Interventions Constitute Critical Determinants Shaping the Carbon Emission Spatial Evolution and Distribution Patterns
From 2012 to 2022, Xi’an implemented a series of policies to drive socio-economic development, which led to phased increases in carbon emissions due to industrial expansion and energy demand growth in certain sectors. For instance, guided by the Shaanxi Provincial Implementation Plan for Carbon Peaking and Carbon Neutrality, Xi’an prioritized strategic emerging industries such as next-generation information technology, renewable energy, and advanced equipment manufacturing. While fostering photovoltaic and hydrogen energy supply chains and promoting high-end transformation of energy-chemical industries in northern Shaanxi, the city remained reliant on carbon-intensive technologies during coal classification/utilization and traditional industrial upgrades. Meanwhile, the introduction of top-tier photovoltaic enterprises is facilitating the advancement of clean energy utilization, though energy consumption has temporarily escalated due to silicon material production and fabrication processes. Additionally, the transportation sector’s promotion of new energy vehicles and charging infrastructure reduced long-term emissions, yet upstream battery manufacturing and grid expansion generated incremental carbon footprints.
Concurrently, Xi’an aligned with national “dual-carbon” goals to enact carbon reduction policies tailored to its regional economy and energy mix. As the core hub of Shaanxi’s carbon emission trading system, the city rigorously enforced the Shaanxi Provincial Carbon Emission Trading Management Implementation Rules, motivating enterprises to increase energy efficiency through technological innovation. Renewable energy capacity expanded significantly, with traditional industries undergoing green retrofits and buildings adopting energy-saving materials. These enterprises are mostly concentrated in peripheral districts and counties, especially in Chang’an district in the south, where the above-mentioned policies have played a role in effectively reducing carbon emission intensity. In recent years, a “Provincial-municipal Two-tiered Carbon Data Monitoring System” was also established, enhancing transparency and public engagement. These measures effectively decoupled economic growth from emissions in some districts, where industrial output and population rose while carbon footprints declined.
Spatially, guided by the spatial structure of “one core, one sub-core, six poles, and multiple nodes,” established in the Territorial Spatial Master Plan of Xi’an City (2021–2035), the government has prioritized the steady development of the main urban core while strengthening the collaborative development mechanism for the Xi’an city and Xixian new district, which is in the northern region of Xi’an. Concurrently, policy strategies have been implemented to advance the vigorous development of the northern urban zone. This integrated approach ensures coordinated spatial governance across metropolitan sub-regions, balancing growth momentum between established urban centers and emerging development clusters. In addition, compared to the mountainous terrain predominant in the southern suburbs, the northern urban area of Xi’an city features expansive plains and river networks, endowing it with geographical advantages. This has consequently driven a northward shift of economic gravity. The urbanization development in Xi’an’s northern suburbs, particularly exemplified by Weiyang district, has achieved notable progress through the influx of industrial enterprises and strategic planning of commercial zones. These developments have fundamentally transformed the long-standing “light-north and heavy-south” spatial pattern that historically characterized Xi’an’s urban structure.
4.3. Industrial Structure Is the Direct Cause of Carbon Emission Spatial Distribution Patterns
In recent years, the number of large-scale industrial enterprises in Xi’an has continued to increase steadily. In 2012, there were 970 large-scale enterprises, and by 2022, this number had risen to 1528 (excluding the Xixian new district). Over 45% of these enterprises were concentrated in three districts: Weiyang, Yanta, and Chang’an (
Figure 14). This study analyzed the contribution of each district (excluding the Xixian new district) to the total industrial output value, considering their corresponding carbon emission levels (
Figure 15). In 2012, the distribution of carbon emissions across districts was relatively balanced, with Chang’an and Yanta, which are high-carbon-emission areas, together contributing nearly 30% of Xi’an’s total industrial output value. This output was comparable to the whole output of six lower-emission districts. By 2022, the high-carbon-emission districts, including Chang’an, which forms part of Xi’an’s central urban area, accounted for 68.79% of the total industrial output value. The three high-emission districts alone contributed 55.13%.
Xi’an’s central urban areas have historically served as hubs of urbanization, economic development, and industrial activities. As administrative and economic centers, these areas host a high density of enterprises and industrial facilities, leading to elevated carbon emissions. Industrial activities in these districts are highly concentrated, with energy-intensive sectors such as chemical manufacturing, non-metallic mineral production, and electromechanical manufacturing playing a dominant role. In 2022, Xi’an had 77 enterprises undertaking chemical raw materials production, 194 undertaking non-metallic mineral manufacturing, 184 undertaking electrical equipment manufacturing, and 251 undertaking specialized equipment production. These industries demand significant energy and rely on fossil fuels such as coal, oil, and natural gas, directly driving increased CO2 emissions. Conversely, medium-carbon-emission regions, though undergoing urbanization, experienced relatively low industrialization, with fewer industrial enterprises and minimal energy-intensive industries. This disparity explains their lower carbon emissions compared to high-emission regions. Similarly, districts classified as low or very low-carbon-emission areas also exhibited limited industrial activities.
In peripheral districts, urban development policies and the shift toward sustainable energy structures have led to the active promotion of low-carbon industries and energy-efficient technologies. For example, Gaoling district has prioritized high-tech industries, while Yanliang district has focused on aerospace manufacturing. Between 2012 and 2022, the number of large-scale industrial enterprises in Gaoling district rose from 196 to 228, while Yanliang district saw an increase from 72 to 127. Recognized as a national aviation hub, Yanliang has leveraged technological innovation to develop a comprehensive aviation industry chain and has improved its urban environment. In recent years, both Yanliang and Gaoling districts have accelerated the growth of low-carbon industries, including biopharmaceuticals, automobile manufacturing, energy conservation, and environmental protection, enabling industrial expansion while curbing carbon emissions. In contrast, other peripheral counties and districts, characterized by smaller industrial scales and a predominance of low-carbon sectors such as light manufacturing and tobacco processing, exhibited significantly lower fossil fuel consumption compared to central urban areas.
The spatial concentration of carbon emissions reflects the progress in urbanization, economic growth, and industrial development across Xi’an over time. Rapid urban expansion has driven regional emissions upward. There will be more urbanization and industrialization, and more emissions in the future. Research has found that strengthening industrial collaboration can effectively improve the efficiency of green production in cities [
20]. Reasonable policies are needed to achieve a good balance between economic development and environment protection.


