Article

Has the Pilot Project of Innovative Cities Increased Economic Growth? An Empirical Study Based on Chinese Cities

1
Institute of Applied Economics, Shanghai Academy of Social Sciences, Shanghai 200020, China
2
International Tourism College, Hainan University, Haikou 570228, China
3
School of Economics and Management, Wuhan University, Wuhan 430000, China
4
National Institute of Insurance Development, Wuhan University, Ningbo 315100, China
*
Author to whom correspondence should be addressed.
Reg. Sci. Environ. Econ. 2024, 1(1), 31-45; https://doi.org/10.3390/rsee1010003
Submission received: 6 August 2024 / Revised: 3 September 2024 / Accepted: 10 September 2024 / Published: 20 September 2024

Abstract

In an era of global economic slowdown, effectively stimulating urban economic development has become a critical challenge for governments around the world. Based on the panel data of 280 prefecture-level cities in China from 2006 to 2017, this study adopts the double-difference method to evaluate the impacts of innovative cities pilot policies on urban economic growth, explore the mechanism through the intermediary effect model, and study the heterogeneity of cities with different development endowments by sub-samples. This study shows the following: (1) The policy of innovative pilot cities has significantly promoted their economic growth: GDP growth rates in the pilot cities are 1.14 percent higher than those in non-pilot cities. (2) The innovative city policy can effectively improve technological progress and human capital, thereby promoting economic growth. (3) The promotion effect of the pilot policy on the economy varies by region, city size, administration grade, market level, and government efficiency. Specifically, the policies have the most substantial positive effects in cities with lower administrative levels, smaller sizes, less market orientation, and higher government efficiency. This research, based on the city data from the world’s largest economy, evaluates the impact of government intervention—targeted urban innovation policies—on economic development, providing valuable insights into how innovation policies can be tailored and optimized for diverse urban contexts.

1. Introduction

Under the impact of the COVID-19 pandemic, global economic growth has slowed, and governments around the world have introduced various policies to stimulate economic recovery. Innovation, as a key driver of economic development, has become an essential component of these policies. However, innovation policies to some extent represent government intervention in the market’s allocation of resources, and there is ongoing debate about whether this intervention effectively promotes economic growth. China, as the largest developing country, comprises a wide range of cities with varying levels of development, offering a rich context for examining these strategies. This paper examines the effectiveness of targeted urban innovation policies on economic growth in the context of China.
Cities are important space carriers that play increasingly prominent roles in implementing national innovation policies and agglomerating innovation elements [1]. In China, a typical economic policy with the support of the central government is the establishment of innovative city pilots. The goal of this innovative policy is to help cities improve the environment for innovation, guide the effective allocation of urban innovation elements based on the market allocation of resources, and explore and form a suitable development model with its own characteristics, thereby driving sustainable growth of the city’s economy. The innovation-pilot city policy is essentially a form of government intervention designed to guide the market allocation of resources. It can have complex effects on the economy. Therefore, it is essential to evaluate its effectiveness in promoting urban economic development in practice.
By reviewing the existing literature, the empirical evaluation of the pilot policies on the economy often focuses on the impact measurement of the policy on a certain economic variable, mainly involving optimization of industrial structures [2], energy efficiency [3], foreign direct investment [4], and so on. In addition, some scholars have recently studied the effects of the pilot policies on the development of certain industries, such as urban logistics [5], high-end service [6], and other industries. In particular, many recent empirical studies on the pilot policy are related to innovation. Scholars use different data and methods to study innovation from various perspectives, including collaborative innovation efficiency [7], the innovation level of pilot cities [8], green innovation [9], and enterprise innovation behavior [10]. However, the study regarding the impact of innovative city policies on the evaluation of overall economic development is limited.
The current study found that innovative pilot cities can promote green total factor productivity through three methods: technology, agglomeration, and reverse force effects [11]. Meanwhile, innovative city policies are proven to promote urban green development by promoting technological innovation and reducing the city’s dependence on natural resources [12]. While these studies assess the impact of innovation-pilot city policies on the overall economy, they primarily focus on the quality of economic development and rarely explore the quantitative evaluation of these policies from the perspective of economic development speed.
This paper, therefore, concentrates on the impact of innovation-pilot city policies on economic growth and deeply explores the mechanisms through which these policies exert their influence. We utilize data from 280 Chinese prefecture-level cities from 2006 to 2017 and apply the difference-in-differences (DID) method to evaluate and identify the net effect of establishing innovation-pilot cities on economic growth. The study also examines the impact mechanisms through a mediating effect model and considers whether the effects of the pilot policy on urban economies differ significantly based on varying urban development endowments. Our research not only contributes to the insights of government intervention in the context of rapidly developing countries but also provides valuable policy implications regarding the potential expansion of innovation-pilot cities and the criteria for selecting future pilot cities.
The remainder of the paper is organized as follows. Section 2 presents the theory and hypotheses. Section 3 presents the model specification and data, which is followed by the empirical results in Section 4. Finally, Section 5 presents the conclusions, implications, and limitations.

2. Theory and Hypothesis

The innovative cities’ policy intends to influence the economy by establishing platforms for the agglomeration of elements, by boosting the vitality of market entities, and by speeding up the introduction and education of talents. Therefore, this study analyzes the impact on the economic growth of pilot cities from these three perspectives: innovation platforms, enterprise behavior, and human capital.
(I) Innovation platform effect. Because of the pressure from the evaluation of pilot government performance and financial support from the central government, the pilot governments have increased the guidance and support for various types of innovative elements’ agglomeration platforms, such as the Innovation Garden of Science and Technology, high-tech zones, and other innovation-based construction. On these platforms, all types of resources can be effectively integrated to reduce the distance barriers of production factors [13]. Specifically, these platforms can effectively reduce the time lag of knowledge and technology in space, reduce friction among innovation elements, and promote knowledge spills and technology transitions [14]. Second, the pilot government takes the lead in the layout of various industrial cluster platforms to promote the agglomeration of production factors. These measures can be conducive to the full play of the scale effect of factors, and thus improve economic efficiency. In addition, the pilot policies clearly pointed out that “key scientific research institutions, scientific research enterprises or universities with strong scientific research strength should strengthen the cooperation and build a sharing and exchange platform on scientific knowledge and technology research”. Therefore, some network platforms of industry–university–research collaborative innovation systems have been built. These systems encouraging the communication and common exploration of knowledge and technologies can reduce the transaction costs of all parties involved in collaborative innovation and the risk of failure of collaborative innovation and accelerate the transformation efficiency from “learning” and “research” to “production” [15], thus improving economic efficiency.
(II) Changes in enterprise behavior. Enterprises are the main body of innovation. However, the characteristics of high risk and low direct economic return of innovation make enterprises lack investment incentives for innovation. Therefore, to encourage enterprises to play their innovative roles, pilot governments often reduce the transaction cost of enterprises by improving the institutional environment for innovation and entrepreneurship, and change the endowment constraints of enterprises by using industrial policies. Specifically, it is reflected in the following aspects:(1) Pilot city governments focus on institutional and management innovation by improving their service awareness and reducing administrative approval barriers. This progress reduces the rent-seeking behavior and transaction costs of enterprises to better stimulate market vitality [16]. (2) Pilot governments provide incentive subsidies to innovative enterprises by special funds, tax incentives, and so forth, to share the innovation cost of enterprises. These policies can effectively encourage enterprises to invest more in technology and inventions [17] and accordingly promote the transformation and upgrading of enterprises. (3) If innovative companies obtain support from the government, they are more likely to gain market resources and attract investments in venture capital because these administrative endorsements could improve the commercial credit of these enterprises [18]. Due to easing the financial constraints of enterprises, these innovative enterprises could increase research and development (R&D) expenditures, which improves the competitiveness and efficiency of enterprises. (4) The pilot government encourages and supports technology introductions and technology-oriented cross-border mergers and acquisitions [19], which will significantly promote the upgrading and transformation of technology.
(III) Speeding up of human capital. Innovative pilot cities increase investment and support for education and encourage school-enterprise cooperation, thus promoting talent cultivation. Innovative pilot cities have also contributed positively to the introduction of higher-quality talent. For example, they initiate a “people-grabbing war” to retain high-quality talent in cities by offering high salary policies and housing resettlement. In addition, when a city is selected as an innovative city, this symbol helps shape the image of the city as valuing technology and innovation, thus attracting high-level professionals and excellent teams. In conclusion, this study holds that innovative pilot policies have improved the speed of human capital accumulation in cities.
From the argumentation process of both the setting of platforms (I) and the changing behavior of enterprises (II), we can easily get a corollary: the pilot policy promotes the technological progress of cities. Endogenous growth models state that technological progress is the endogenous cause of long-term economic growth [20]. In addition, speeding up of human capital (III) can also promote economic growth and different speeds of human capital accumulation lead to different economic growth rates [20]. Therefore, based on the above analysis, this study proposes the following hypothesis:
Hypothesis 1:
Innovative city pilot policies promote economic growth.
Hypothesis 2:
Innovation-pilot cities promote urban economic growth by improving regional technological progress and human capital.
The impact of a policy on the economy is also influenced by the endowment of local economic development. The regional differences in market level, economic scale, and institutional environment can lead to different performances for economic policies [21]. China possesses a vast territory, and its economic endowments and economic development levels are quite distinct per region. Therefore, given the imbalance of geographical location and urban endowment, this study further proposes the following:
Hypothesis 3:
The impact of innovation-pilot city policies on economic growth may vary depending on differences in urban development endowments.

3. Model and Data

Using panel data from 280 Chinese cities spanning 2006 to 2017, this paper employs the difference-in-differences (DID) method to empirically analyze the impact of the innovation-pilot city policy on economic growth.

3.1. Methodology

3.1.1. Benchmark Regression Model

The establishment of innovative cities is a gradual process; the Chinese government established the innovative cities pilot program in four batches in 2010, 2011, 2012, and 2013. Therefore, referring to Beck’s research [22], this study adopts the gradual DID method.
The benchmark regression model is described as follows:
R g d p i t = β 0 + β 1 I n n o v c i t y i t + β 2 C o n t r o l i t + α i + α t + ε i t
where Rgdpit is the explained variable, representing the economic growth rate of city i at year t. Innovcityit is the core binary explanatory variable. If a city is designated as an innovation-pilot city in a given year, Innovcity is 1 for that year and all subsequent years; otherwise, it is 0. Thus, its coefficient is recorded as the average treated effect of the policy. Controlit is a series of control variables that affect the economic growth rate, including city size (denoted by Size), industrial structure (denoted by Sec), trade openness (denoted by Open), internet (denoted by Internet), and infrastructure (denoted by Infra). εit denotes random errors; αi denotes city-fixed effects; αt denotes time-fixed effects.

3.1.2. Mediating Effect Model

According to the theoretical hypothesis in Section 2 of this paper, the policies of innovative pilot cities may affect economic growth in two ways: technological progress and the improvement of human capital. Here, the paper uses the method of Baron and Kenny [23] to test the mediating effect, as follows:
M   e d i i t = γ 0 + γ 1 I n n o v c i t y i t + γ 2 C o n t r o l i t + α i + α t + ε i t
R g d p i t = η 0 + η 1 I n n o v c i t y i t + η 2 M e d i i t + η 3 C o n t r o l i t + α i + α t + ε i t
where Mediit represents the mediating variable (i.e., technological progress and human capital). Here, if the values of γ1, η1, and η2 in the model are both positive and significant, it means that the policy promotes economic growth by promoting the growth of the mediating variable (i.e., the mediating effect exists).

3.2. Variable Selection and Data

3.2.1. Data Source

The paper uses balanced panel data from 280 prefecture-level cities covering the period from 2006 to 2017. The data primarily come from the China Urban Statistical Yearbook for the years 2006 to 2017. Invention patent data are sourced from the China Science and Technology Statistical Yearbook, while innovation index data are obtained from the Report on China’s Urban and Industrial Innovation (2001–2017) by the Industrial Development Center of Fudan University.

3.2.2. Variables

  • Explained variable: Urban economic growth. This is characterized by the growth rate of the city’s GDP (Rgdp) in the benchmark regression; in the robustness test, the real GDP of the entire city (Realgdp) and the GDP growth rate of the municipal district (Rgdp1) are used.
  • Independent variable: The paper uses the dummy variable (Innovcity) to capture the impact of the policy. If a city is designated as an innovation-pilot city (By 2017, the 61 pilot cities were established in four batches, comprising 55 prefecture-level cities, four municipalities directly under the central government, and two county-level cities. In this study, Shenzhen, the first innovative city pilot approved in 2008, was excluded from the treated group due to its unique policies and lack of representativeness. Additionally, the four municipalities were excluded because only certain districts within these municipalities implemented innovative pilot policies, and district-level data was relatively scarce. The two county-level cities, Changji and Shihezi, were also excluded. Therefore, in our research, the number of innovation-pilot cities is 54) in a given year, the dummy variable will be assigned a value of 1 for that year and all subsequent years; otherwise, it will be 0 (This dummy variable is an interaction term for city and policy year, indicating whether an innovative city policy is implemented in a city during a given year. Thus, the value of 0 applies to two cases: cities that have never been designated as pilot innovative cities and the years before a city is designated as such).
  • Control variables: Comprehensively considering other factors affecting economic growth, this study selects the following series of variables as control variables. (1) City size (Size): Existing studies [24] have shown that urban scale will affect urban efficiency through two contrary effects: economies of scale and the crowding effect. Therefore, the city size is taken as the control variable and described by the total population in the study. (2) Industrial structure (Sec): Empirical research showed that the change in China’s industrial structure had a significant impact on economic growth and fluctuations [25]. Thus, the proportion of the secondary industry was used in this study to reflect the industrial structure. (3) Trade openness (Open): Foreign investors can provide financial support to China’s enterprises or directly construct new factories in China; thus, these activities bring technology spillover and promote economic development [26]. In this study, the logarithm of the amount of foreign direct investment is used to describe this concept. (4) Internet (Internet): In recent years, internet technology has effectively decreased resource mismatch, improved the efficiency of resource allocation, and promoted economic development [27]. This study uses internet indicators to measure the construction of urban information infrastructure using logarithms. (5) Infrastructure (Infras): The improvement of transportation infrastructure can reduce transaction costs, promote market competition and professional division of labor [28], and thus affect economic development. Therefore, this study uses per capita road area to describe infrastructure.
  • Intermediary variable.
Technological progress: This proxy variable uses two indicators to measure progress in this study. (1) Innovation index (Patent 1): Simply summing up the number of these patents for patent stock cannot reflect the patent renewal behavior or its quality differences accurately, for all patents are assigned the same weight. Thus, the innovation index, which is a stock index adjusted by patent value, is used as a proxy variable to describe technological progress in this study. (2) The number of patented inventions per 10,000 people (Patent 2): Referring to Archibugi’s study [29], this study also supplements the number of patented inventions to describe technological progress.
Human capital (Hum): Education is positively correlated with economic growth, and thus this study uses the proportion of higher education students in the total population of the region to denote human capital.
The notation and definition of each variable are listed in Table 1. Statistical and descriptive summaries of the indicators are shown in Table 2.

4. Empirical Results

4.1. Benchmark Regression Results

The regression results are presented in Table 3. In column (1), which includes only the core explanatory variable, the coefficient of Innovcity is 0.749, significant at the 5% level. This indicates that the GDP growth rate of innovation-pilot cities is, on average, 0.75 percent higher than that of control group cities without such policies. After adding control variables in column (2), the coefficient of Innovcity increases to 1.14, significant at the 1% level, suggesting that the GDP growth rate of pilot cities is, on average, 1.14 percent higher than that of the control group. These findings support Hypothesis 1: Innovative city pilot policies promote economic growth.

4.2. Robust Tests

In this section, we perform auxiliary tests to ensure the robustness of this study’s conclusions, including the parallel trend test, placebo test, changing index, and analysis excluding interference from high-speed rails.

4.2.1. Parallel Trend Tests
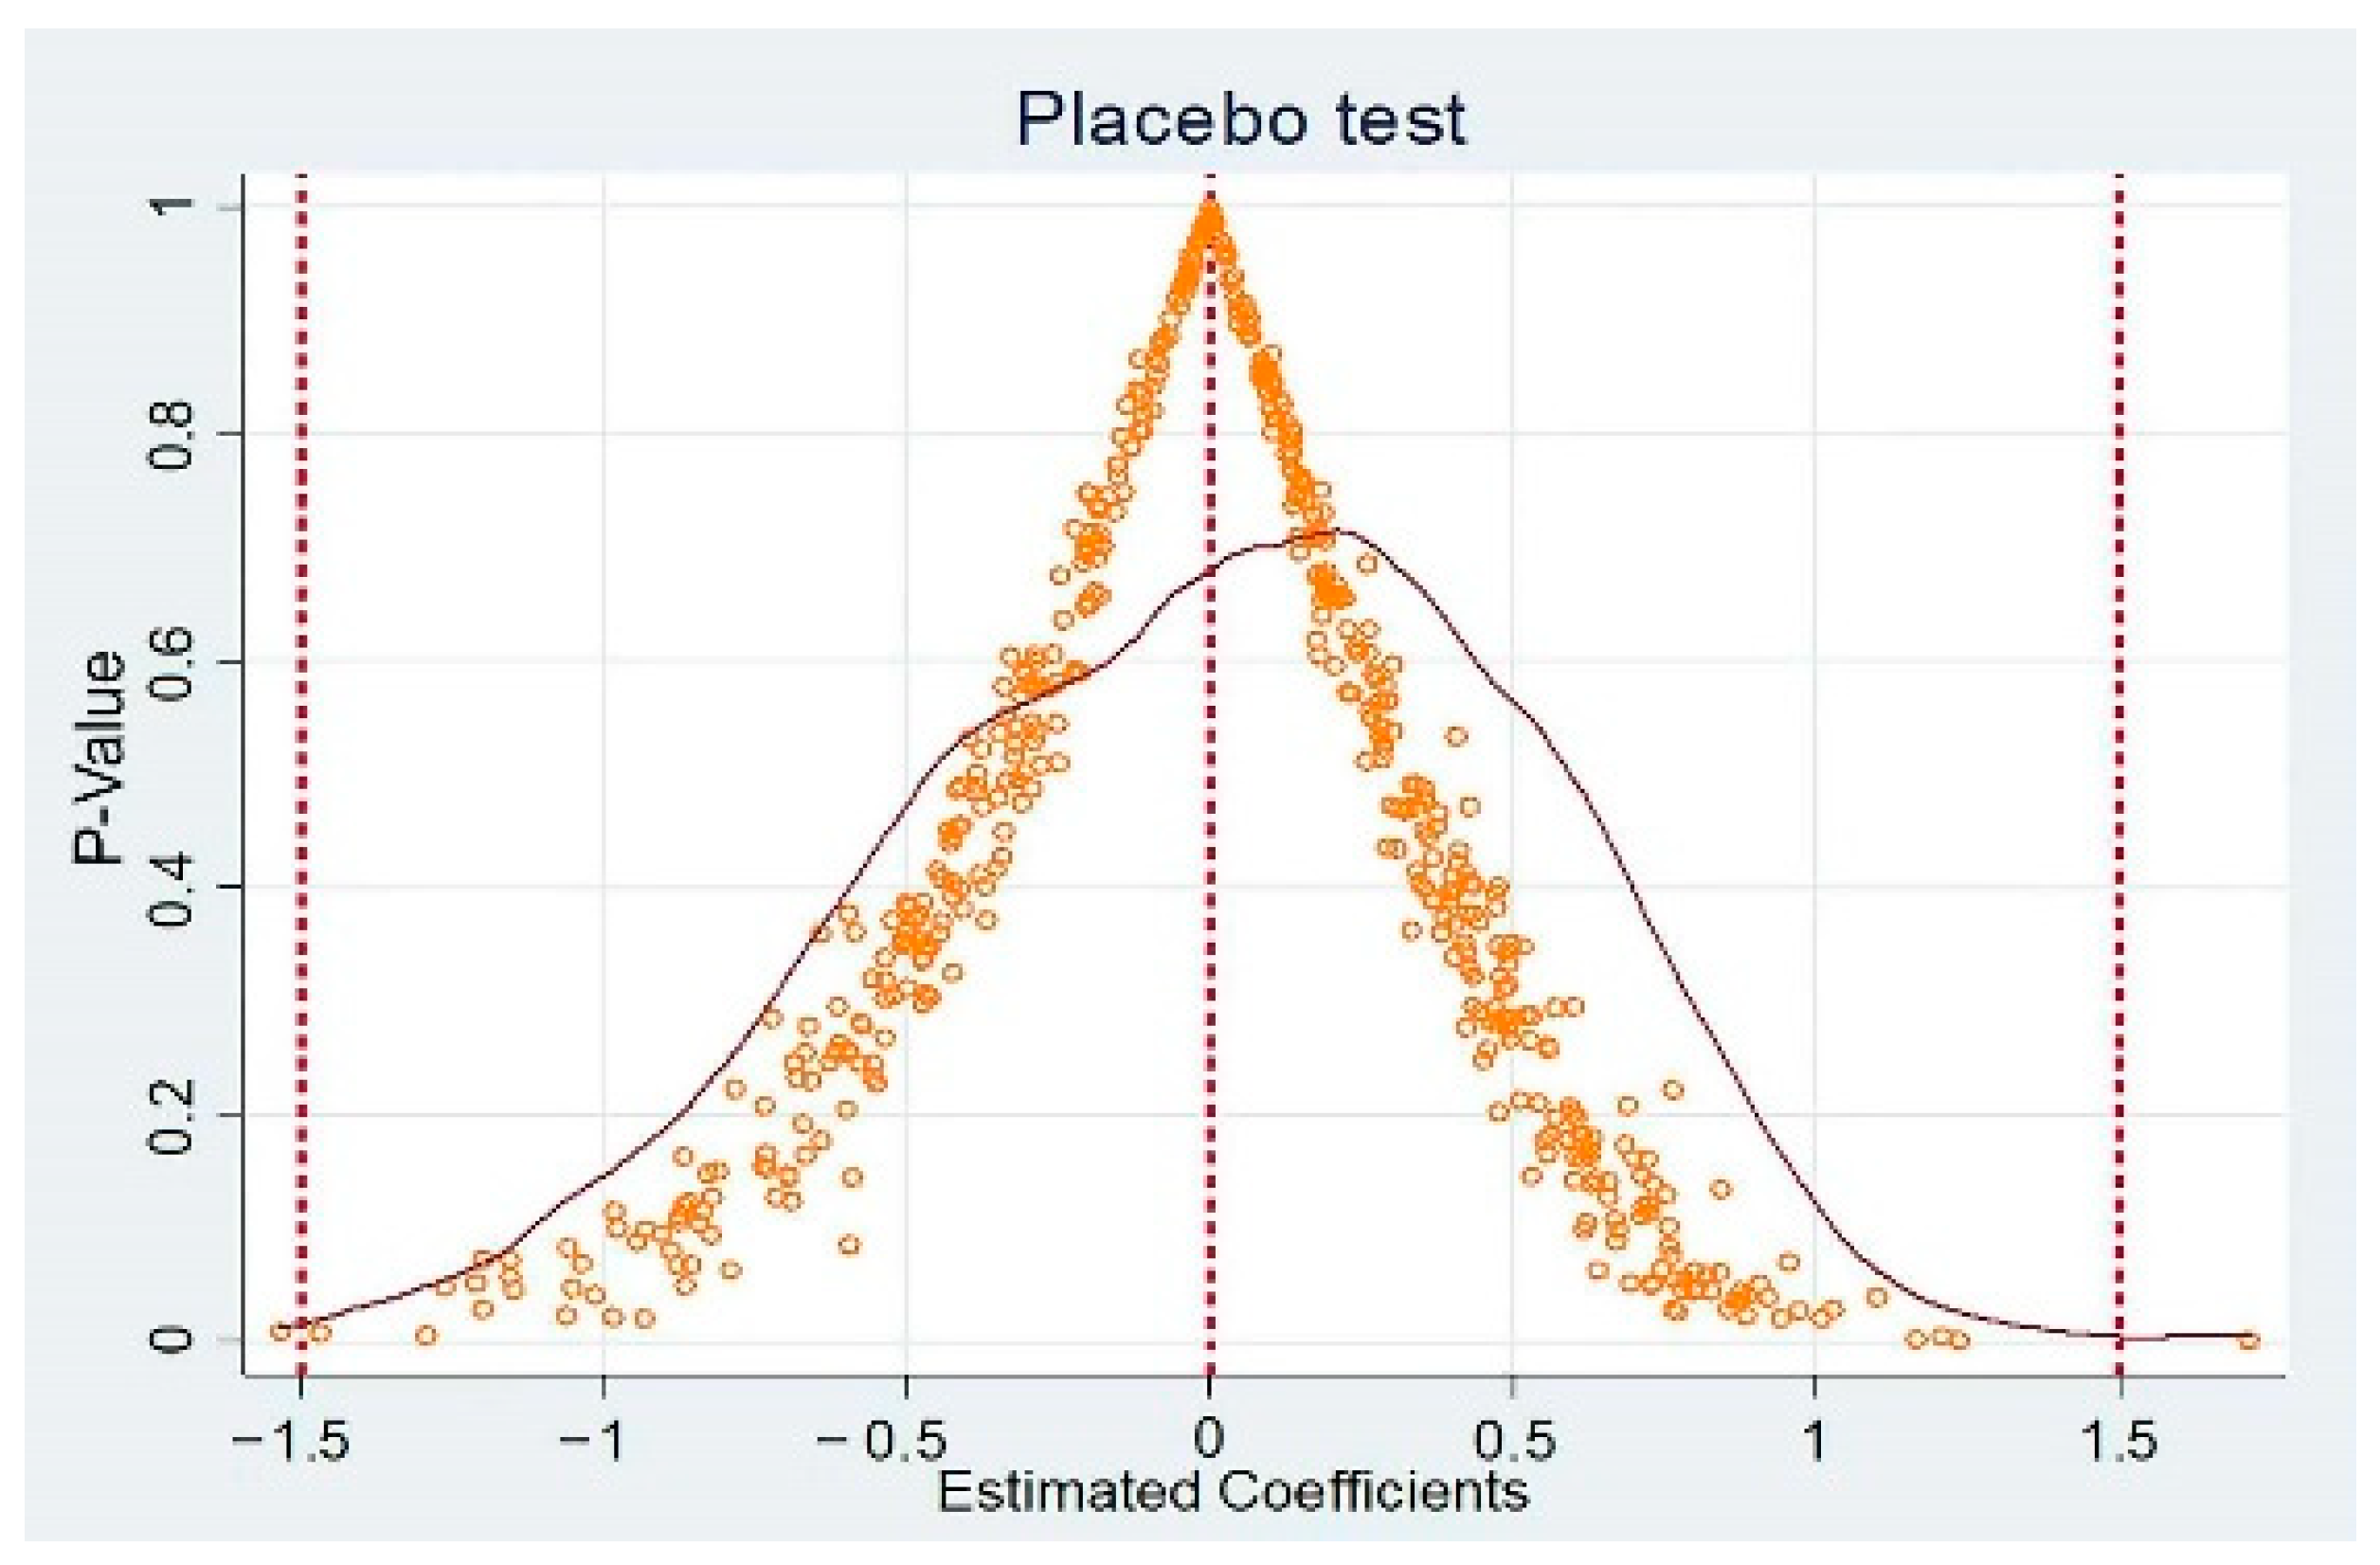
An important premise of using the multi-time-point DID method is that both the treated and control groups have shown essentially the same trend of change over time for the explained variable before the policy is implemented; thus, the difference in the results of the two groups after the experiment is caused purely by the policy treated effect. Referring to the study from Beck [22], the results are shown in Figure 1, where d-i represents the ith year before implementation of the policy. In the first 4 periods before implementation, there is no significant difference between the control and experimental groups, which means the growth rate of GDP before the implementation of innovative pilot policies in the control and experimental groups had an approximately parallel growth trend.
In addition, the method also measures the time-dynamic effect of the pilot policies on urban economic growth. After the implementation of the innovative pilot policy, its impact on the economy is roughly an inverted V shape. In the first few years, this impact is significantly positive. As the policy progresses, this impact reaches a peak around the fifth year, after which the promotion effect decreases significantly. Although the coefficient is still positive in the seventh year, the confidence interval significantly included 0, which means that the impact of the policy on the economy was not significant. The reason for such insignificance may be that the economy is dynamic, and the longer the period, the more policy interference it receives.

4.2.2. Placebo Test

For the conclusions of this study, it may be questioned whether some other random factors contribute to the statistical significance of economic growth. Therefore, this study constructs a placebo test by referring to the method of Cantoni et al. [30]. Among the 280 prefecture-level cities studied, 54 were randomly selected as the treated group, and the sampling was repeated 500 times. DID regression was performed for each sampling, and the coefficients and p-values of their innovative urban policies were counted to create the corresponding nuclear density map. As a result, the statistical coefficients are approximately normally distributed around 0, as shown in Figure 2. Based on the placebo results, other random factors can be further ruled out, leading to the results of the abovementioned benchmark regression.

4.2.3. Changing Explained Variable

In the previous benchmark regression, the explained variable was the GDP growth rate. Here, the explained variable is replaced by total real GDP, which is log-transformed in practice. As shown in column (1) of Table 4, the coefficient of Innovcity is significantly positive at 0.04, indicating that Hypothesis 1 is robust.

4.2.4. Changing the Region of Data

In previous empirical studies, the data is city-wide due to the spillover effects of the economy itself and data availability. In fact, based on the condition of Chinese cities, the city’s talent, capital, institutional endowment, and other resources are more advantageous in the municipal area, and the policy should preferentially affect the municipal area. Therefore, the study area here is narrowed to the municipal area and all indicators in the benchmark regression are replaced by the municipal districts. The results are shown in column (2) of Table 4. The coefficient of Innovcity is 1.24, still significantly positive. Therefore, the basic conclusion of this study has been proven robust again.

4.2.5. Eliminating the Interference of High-Speed Rails

High-speed rails in Chinese cities were built around 2011 and the high-speed rail network was formed by the end of 2015. Some studies showed that the construction of the high-speed rail significantly accelerated regional innovation [31] and economic growth [32]. Therefore, it is reasonable to be concerned about whether the results are disturbed by high-speed rails when evaluating the policy effects in this paper. To exclude the interference of high-speed rail factors, this test adds the binary variable of high-speed rail (Hsr) as the control variable. The results are presented in column (3) of Table 4. The coefficient of Innovcity is 1.136 and significantly positive, indicating that the policy’s impact remains significant even when accounting for the presence of high-speed railways. Thus, Hypothesis 1 is proven robust once again.

4.3. Test of Mediating Effects

4.3.1. The Mediating Effect of Technological Progress

Table 5 presents the results of testing the mediating effect of technological progress based on the theoretical hypotheses and mediating effect model. Columns (1) and (2) use the innovation index as a proxy for technological progress, while Columns (3) and (4) use per capita patents. In Column (1), the coefficient of Innovcity is 16.824 and is significant at the 1% level, indicating that the pilot policy has a significant positive impact on technological progress. Column (2) shows that the coefficient of patent1 is 0.017 and significantly positive, testing the second step of the mediating effect (i.e., Equation (3)). The results in Columns (1) and (2) show that the effect of the pilot policy on economic growth is partly through technological progress. The significance and sign of the coefficients in Columns (3) and (4) are consistent with those in Columns (1) and (2), so they are not repeated here. In summary, technological progress is confirmed as a mediating channel in the policy’s impact on economic growth.

4.3.2. The Mediating Effect of Human Capital

The mediating effect of human capital is examined in Columns (5) and (6) of Table 5. Column (5) shows that the regression coefficient of human capital (Hum) on the pilot policy (Innovcity) is 53.33 and significant at the 1% level, indicating that the pilot policy significantly increases human capital. Column (6) reveals that the coefficients of Hum and Innovcity are 0.003 and 0.963, respectively, both significantly positive, reflecting the second step of the mediating effect (i.e., Equation (3)). These results suggest that the pilot policy contributes to economic development partly by enhancing human capital.

4.4. Heterogeneity Test

4.4.1. Regional Heterogeneity

At present, China’s innovative pilot cities have spread across every province and the differences in economic endowments between regions are significant, which means that the implementation of innovative city policies may show different policy effects. Therefore, this study adopts the method of sub-regional regression to analyze the heterogeneity in the empirical study. The regression results are shown in columns (1) to (3) of Table 6, which are the regression results of three plates in eastern, central, and western China.
In column (1), the coefficient for the innovation pilot policy is 1.789, indicating that pilot cities in the eastern regions experienced a GDP growth rate of 1.789 percentage points higher than non-pilot cities. Column (2) shows that in the western regions, the coefficient is 1.841. Both coefficients are significantly positive, demonstrating that the pilot policy effectively stimulated economic growth in both eastern and western regions. However, as shown in column (3), the policy’s impact in the central region is not statistically significant, suggesting that it did not effectively promote economic growth in these cities. These varying results may be attributed to differences in economic endowments and the intensity of resource allocation.
Eastern cities relatively have superior economic endowments, such as well-developed infrastructure, high levels of human capital, and overall economic maturity. These advantages provide a solid foundation for capitalizing on policy benefits, allowing for more effective implementation of innovative strategies and amplifying their economic impact. The western region is relatively underdeveloped, with its poorer infrastructure, lower levels of human capital, and less efficient productive rate. In these regions, compared to non-innovative-pilot cities, innovative pilot cities can significantly address the region’s weaknesses. Government support and targeted resource allocation towards these pilot cities have made them more attractive to talent and capital than non-pilot cities. This has fostered the aggregation of innovative elements and the improvement of basic infrastructure, leading to notable economic growth. In contrast, the cities in the central region may lack both the advanced market conditions and resource endowments found in the east, as well as the focused resource allocation seen in the west. As a result, the policy’s impact on economic growth in the central region remains insignificant.

4.4.2. Heterogeneity of City Size

This study divides cities into three categories according to the size of the population: small, medium, and large. Specifically, since the innovative policy was officially implemented in 2010, the total urban population in 2009 was selected for classification: cities with a population of more than 5 million people are large cities, those with a population of less than 3 million people are considered small cities, and those with between 3 and 5 million people are medium cities. By introducing dummy variables related to city size in the empirical study, we perform group regression. The empirical results are presented in Table 6.
The coefficients of the policy for small- and medium-sized cities are positive, at 1.565 and 1.831, respectively, as shown in columns (5) and (6). However, the pilot policy has no significant impact on large cities, as indicated in column (4). This comparison suggests that the innovative urban policy effectively increased the economic growth rate in small- and medium-sized cities, while it had little effect in larger cities. These differing outcomes may be explained by city-scale theory, which posits that a city’s size and economic efficiency follow an inverted U-shaped curve [33].
The impact of factor aggregation induced by the innovation pilot policy varies depending on the scale of the city. According to the optimal city-scale theory, when the city size is small, it is not conducive to exerting the agglomeration effect of factors. However, the measures in the pilot policies are related to the promotion of factor agglomeration and improvement of basic implementations, which benefits scale economies and improves the efficiency of the economy. This may be why the economic promotion effect of policies is significant in small- and medium-sized cities.
However, the inverted U-shaped curve also suggests that too large cities have obvious congestion effects, reducing the utility of workers and attraction of talent. At present, the large Chinese cities, with more than 5 million people, have obvious crowding effects, such as high housing prices, high living costs, and serious pollution, which may be why the pilot policies in big cities lose attraction to valuable talent and capital. Also, large cities are developing relatively well and may have an inherent driving force for innovation demand, so the response to the policy may not be sensitive in these cities. The two abovementioned reasons could account for the result of policy effects on the economic development of large cities as being obscure.

4.4.3. Heterogeneity of a City’s Administrative Grade

In China, the overall development level and available policy support of each city are often related to the city’s administrative grade. The urban tier plays an important role in promoting innovation agglomeration [34]. Thus, cities with different administrative levels may affect the effect of policy implementation. In this paper. Chinese cities are divided into high- and low-grade cities according to the city’s administrative level. The empirical results are presented in columns (1) and (2) of Table 7: in high-grade cities, the coefficient for the innovation pilot city policy is 1.64, while in low-grade cities, it is 1.72. This suggests that the innovation pilot policies have a greater impact on promoting economic growth in low-grade cities than in high-grade cities. A possible explanation for this difference is that the pilot policies may significantly improve infrastructure and enhance the scale effects of production factors in low-grade cities, thus generating greater positive effects.

4.4.4. Heterogeneity of Marketization Degree

By using the marketization index [35], this study divides the provinces into high and low groups based on the average value of the marketization index from 2006 to 2009. The degree of marketization for sample cities is determined according to the groups of provinces. In Table 7, column (3) shows that in cities with a high degree of marketization, innovation pilot cities promote economic growth of 0.788 percentage points compared to non-innovation pilot cities. In contrast, column (4) reveals that in cities with a low degree of marketization, the coefficient is 1.796. The comparison of coefficients suggests that innovation-pilot city policies play a more significant role in promoting economic growth in areas with lower marketization.
Essentially, innovation pilot policies represent a form of government intervention in resource allocation, acting as a complement to the market’s invisible hand. Generally, the less effective the market mechanism, the more pronounced the compensatory effect of government policies on resource allocation efficiency, and the more significant the impact of these policies on the economy [36]. The empirical results align with this theory.

4.4.5. The Heterogeneity of Government Efficiency

Whether the policy can be effectively implemented depends on the capacity of the local government [24]. If the government has insufficient organizational capacity, it is difficult to ensure the effective implementation of the policy. This is one of the reasons why many regulatory policies fail. Using the provincial government efficiency index [37], the average value of the index from 2006 to 2009 (before the implementation of the policy in the window period) is used to divide the provinces into high and low groups, and the government efficiency of sample cities are determined according to the groups of provinces.
In Table 7, column (5) shows that in cities with high government efficiency, innovative pilot cities experience an increase in economic growth of 2.17 percentage points compared to non-innovative pilot cities. In contrast, column (6) indicates that in cities with low government efficiency, while the impact of the pilot policy on economic growth is positive at 0.197 percentage points, it is not statistically significant. The comparison between columns (5) and (6) reveals that government efficiency significantly influences the effectiveness of the pilot policy on economic growth. Specifically, the policy has a markedly positive impact in areas with high government efficiency.

5. Conclusions

Based on panel data from 280 Chinese prefecture-level cities spanning 2006 to 2017, this study employs a DID method to evaluate the impact of innovative urban policies on economic growth. Our research found that innovative city pilot policies, as a form of government intervention, effectively enhance regional technological progress and human capital, thereby promoting economic growth in pilot cities compared to control group cities.
Moreover, we found that the impact of innovative pilot city policies on economic growth varies depending on the city’s characteristics, including its region, size, administrative grade, government efficiency, and market level. To be specific, the pilot policy plays a positive role in cities such as small- and medium-sized cities, lower-grade cities, and cities in western regions, where the concentration of production factors is relatively low. For cities with high government efficiency and low market levels, innovative urban policies also have a more pronounced effect on economic growth as the innovative city policy helps to mitigate the efficiency losses caused by market imperfections.
By examining the effects of city innovation policies in China—a country characterized by diverse urban landscapes and varying levels of economic development—this study contributes to the ongoing debate on the role of government intervention in market economies. Our findings suggest that while government intervention can indeed be beneficial, its success highly depends on the specific characteristics of the cities where it is applied. Policymakers should, therefore, consider the specific attributes of cities—such as size, administrative grade, and market level—to tailor innovative urban policies when designing and implementing urban innovation strategies.

Author Contributions

Conceptualization, E.X. and Z.W.; methodology, E.X.; software, Z.X.; validation, E.X., Z.W. and Z.X.; formal analysis, E.X.; investigation, Z.X.; resources, Z.W.; data curation, Z.X.; writing—original draft preparation, E.X.; writing—review and editing, E.X. and Z.X.; visualization, Z.X.; supervision, Z.W.; project administration, Z.W.; funding acquisition, Z.W. All authors have read and agreed to the published version of the manuscript. E.X., Z.X. and Z.W.

Funding

This work was supported by Major Project of National Social Science Fund of China (grant number 23&ZD068).

Institutional Review Board Statement

Not applicable.

Informed Consent Statement

Not applicable.

Data Availability Statement

No new data were created or analyzed in this study. Data sharing is not applicable to this article.

Conflicts of Interest

The authors declare no conflict of interest.

References

  1. Fan, F.; Yang, B.; Wang, S. The Convergence Mechanism and Spatial Spillover Effects of Urban Industry-University-Research Collaborative Innovation Performance in China. Technol. Anal. Strateg. Manag. 2023, 1–17. [Google Scholar] [CrossRef]
  2. Zhao, W.; Toh, M.Y. Impact of Innovative City Pilot Policy on Industrial Structure Upgrading in China. Sustainability 2023, 15, 7377. [Google Scholar] [CrossRef]
  3. Yang, J.; Xiong, G.; Shi, D. Innovation and Sustainable: Can Innovative City Improve Energy Efficiency? Sust. Cities Soc. 2022, 80, 103761. [Google Scholar] [CrossRef]
  4. Nie, F.; Liu, H. The Influence of on China’s FDI Quality. Econ. Rev. 2019, 6, 67–79. [Google Scholar] [CrossRef]
  5. He, J. An Empirical Test of the Impact of the Establishment of Innovative Cities on the Efficiency of Logistics Industry. Stat. Decis. 2020, 36, 80–83. [Google Scholar] [CrossRef]
  6. Chen, C.; Guang, S.Z. National Innovative City Policy, High -End Productive Service Industry Agglomeration and High-Quality Regional Economic Development. Financ. Trade Res. 2020, 31, 36–51. [Google Scholar] [CrossRef]
  7. Wang, S.; Wang, J.X.; Wei, C.Q.; Wang, X.L.; Fan, F. Collaborative Innovation Efficiency: From within Cities to between Cities-Empirical Analysis Based on Innovative Cities in China. Growth Chang. 2021, 52, 1330–1360. [Google Scholar] [CrossRef]
  8. Zhou, Y.; Li, S. Can the Innovative-City-Pilot Policy Promote Urban Innovation? An Empirical Analysis from China. J. Urban Aff. 2021, 45, 1679–1697. [Google Scholar] [CrossRef]
  9. Li, L.; Li, M.; Ma, S.; Zheng, Y.; Pan, C. Does the Construction of Innovative Cities Promote Urban Green Innovation? J. Environ. Manag. 2022, 318, 115605. [Google Scholar] [CrossRef]
  10. Guo, F.; Yang, S.; Chai, Z. Does the construction of innovative cities improve the quantity and quality of enterprise innovation? Micro-evidence from Chinese industrial enterprises. Ind. Econ. Res. 2021, 3, 128–142. [Google Scholar]
  11. Nie, C.; Lu, J.; Feng, Y.; Hu, Z. Impact of Innovative City Construction on Green Total Factor Productivity. China Popul. Resour. Environ. 2021, 31, 117–127. [Google Scholar] [CrossRef]
  12. Zhang, H.; Kang, C.; Feng, C. From Innovation to Green: Does China’s Innovative City Construction Contribute to Green Development? Emerg. Mark. Financ. Trade 2024, 60, 2497–2532. [Google Scholar] [CrossRef]
  13. Zandiatashbar, A.; Hamidi, S.; Foster, N. High-Tech Business Location, Transportation Accessibility, and Implications for Sustainability: Evaluating the Differences between High-Tech Specializations Using Empirical Evidence from US Booming Regions. Sustain. Cities Soc. 2019, 50, 101648. [Google Scholar] [CrossRef]
  14. Fan, F.; Lian, H.; Wang, S. Can Regional Collaborative Innovation Improve Innovation Efficiency? An Empirical Study of Chinese Cities. Growth Chang. 2020, 51, 440–463. [Google Scholar] [CrossRef]
  15. Wu, Y.; Gu, X.; Tu, Z.; Zhang, Z. System Dynamic Analysis on Industry-University-Research Institute Synergetic Innovation Process Based on Knowledge Flow. Scientometrics 2022, 127, 1317–1338. [Google Scholar] [CrossRef]
  16. Nee, V. Organizational Dynamics of Market Transition—Hybrid Forms, Property-Rights, and Mixed Economy in China. Adm. Sci. Q. 1992, 37, 1–27. [Google Scholar] [CrossRef]
  17. Gao, Y.; Hu, Y.; Liu, X.; Zhang, H. Can Public R&D Subsidy Facilitate Firms? Exploratory Innovation? The Heterogeneous Effects between Central and Local Subsidy Programs. Res. Policy 2021, 50, 104221. [Google Scholar] [CrossRef]
  18. Lee, C.; Lee, K.; Pennings, J.M. Internal Capabilities, External Networks, and Performance: A Study on Technology-Based Ventures. Strateg. Manag. J. 2001, 22, 615–640. [Google Scholar] [CrossRef]
  19. Coe, D.T.; Helpman, E. International R-and-D Spillovers. Eur. Econ. Rev. 1995, 39, 859–887. [Google Scholar] [CrossRef]
  20. Lucas, R.E. On the Mechanics of Economic Development. J. Monet. Econ. 1988, 22, 3–42. [Google Scholar] [CrossRef]
  21. Ganau, R.; Grandinetti, R. Disentangling Regional Innovation Capability: What Really Matters? Ind. Innov. 2021, 28, 749–772. [Google Scholar] [CrossRef]
  22. Beck, T.; Levine, R.; Levkov, A. Big Bad Banks? The Winners and Losers from Bank Deregulation in the United States. J. Financ. 2010, 65, 1637–1667. [Google Scholar] [CrossRef]
  23. Baron, R.M.; Kenny, D.A. The Moderator-Mediator Variable Distinction in Social Psychological Research: Conceptual, Strategic, and Statistical Considerations. J. Personal. Soc. Psychol. 1986, 51, 1173–1182. [Google Scholar] [CrossRef] [PubMed]
  24. Acemoglu, D.; Garcia-Jimeno, C.; Robinson, J.A. State Capacity and Economic Development: A Network Approach. Am. Econ. Rev. 2015, 105, 2364–2409. [Google Scholar] [CrossRef]
  25. Zhang, L.; Lin, G.; Lyu, X.; Su, W. Suppression or Promotion: Research on the Impact of Industrial Structure Upgrading on Urban Economic Resilience. Humanit. Soc. Sci. Commun. 2024, 11, 843. [Google Scholar] [CrossRef]
  26. Wang, S.; Zhang, J.; Fan, F.; Lu, F.; Yang, L. The Symbiosis of Scientific and Technological Innovation Efficiency and Economic Efficiency in China—An Analysis Based on Data Envelopment Analysis and Logistic Model. Technol. Anal. Strateg. Manag. 2019, 31, 67–80. [Google Scholar] [CrossRef]
  27. Lin, J.; Yu, Z.; Wei, Y.D.; Wang, M. Internet Access, Spillover and Regional Development in China. Sustainability 2017, 9, 946. [Google Scholar] [CrossRef]
  28. Redding, S.J.; Turner, M.A. Transportation Costs and the Spatial Organization of Economic Activity. In Handbook of Regional and Urban Economics; Duranton, G., Henderson, J.V., Strange, W.C., Eds.; Elsevier: Amsterdam, The Netherlands, 2015; Volume 5, Chapter 20; pp. 1339–1398. ISBN 1574-0080. [Google Scholar]
  29. Archibugi, D.; Pianta, M. Measuring Technological Change through Patents and Innovation Surveys. Technovation 1996, 16, 451–468. [Google Scholar] [CrossRef]
  30. Cantoni, D.; Chen, Y.Y.; Yang, D.Y.; Yuchtman, N.; Zhang, Y.J. Curriculum and Ideology. J. Political Econ. 2017, 125, 338–392. [Google Scholar] [CrossRef]
  31. Tang, H.Y.; Zhang, J.Q.; Fan, F.; Wang, Z.W. High-Speed Rail, Urban Form, and Regional Innovation: A Time-Varying Difference-in-Differences Approach. Technol. Anal. Strateg. Manag. 2022, 36, 195–209. [Google Scholar] [CrossRef]
  32. Li, H.; Strauss, J.; Shunxiang, H.; Lui, L. Do High-Speed Railways Lead to Urban Economic Growth in China? A Panel Data Study of China’s Cities. Q. Rev. Econ. Financ. 2018, 69, 70–89. [Google Scholar] [CrossRef]
  33. Arnott, R. Optimal City Size in a Spatial Economy. J. Urban Econ. 1979, 6, 65–89. [Google Scholar] [CrossRef]
  34. Fan, F.; Dai, S.; Zhang, K.; Ke, H. Innovation Agglomeration and Urban Hierarchy: Evidence from Chinese Cities. Appl. Econ. 2021, 53, 6300–6318. [Google Scholar] [CrossRef]
  35. Fan, G.; Ma, G.; Wang, X. Institutional Reform and Economic Growth of China: 40-Year Progress toward Marketization. Acta Oeconomica 2019, 69, 7–20. [Google Scholar] [CrossRef]
  36. Aghion, P.; Cai, J.; Dewatripont, M.; Du, L.S.; Harrison, A.; Legros, P. Industrial Policy and Competition. Am. Econ. J. Macroecon. 2015, 7, 1–32. [Google Scholar] [CrossRef]
  37. Tang, R.; Tang, T.; Lee, Z. The Efficiency of Provincial Governments in China from 2001 to 2010: Measurement and Analysis. J. Public Aff. 2014, 14, 142–153. [Google Scholar] [CrossRef]
Figure 1. The common support test.
Rsee 01 00003 g001
Figure 2. Placebo test.
Rsee 01 00003 g002
Table 1. Definition of variables.
VariablesDefinition of Variables
Economic
growth
RgdpThe growth rate of GDP in the city
RealgdpThe logarithm of real GDP in the city
Rgdp1The rate of GDP in the municipal district of the city
Control
variable
SizeThe logarithm of total population in the city
SecThe proportion of the second industry in the regional GDP
OpenThe amount of foreign direct investment, taking a logarithm
InternetThe amount of internet, taking a logarithm
InfrastPer capita urban road area
Intermediary
variable
Patent1Innovation index, from the “Report on China’s Urban and Industrial Innovation”
Patent2Number of patent applications/total population
HumThe proportion of higher education students in the total population of the region
Table 2. Data description.
VariablesCountMeanStd.MinMaxYears
Rgdp336011.28314.5968−19.010032.900012
Realgdp33606.70280.96693.91559.739312
Rgdp1336011.25094.9709−19.670030.000012
Size33605.84550.67332.86857.268912
Sec336048.998610.696514.950090.970012
Open336011.09743.08620.000015.967612
Internet33603.50621.06520.02966.641212
Infrast33600.19560.38920.00095.790212
Hum3360164.9450227.55750.04051311.240712
Patent133605.159115.97640.0000219.389412
Patent233605.852413.68650.0109213.222712
Table 3. Results of benchmark regression.
(1)(2)
RgdpRgdp
Innovcity0.7493 **1.1359 ***
(0.3620)(0.3880)
Size 7.0757 ***
(2.1887)
Sec 0.1974 ***
(0.0241)
Open 0.1738 **
(0.0720)
Internet 0.6281 **
(0.2453)
Infrast 2.6230 ***
(0.8111)
Constant14.2275 ***−40.0054 ***
(0.1609)(12.9358)
City fixed effectsYesYes
Time fixed effectsYesYes
Observations33603360
N280280
Adjusted R20.45290.4991
Note: (1) Values in parentheses indicate city-level clustered robust standard errors. (2) *** and ** denote significance levels at 1% and 5% respectively.
Table 4. Results of robustness tests.
(1)(2)(3)
RealgdpRgdp1Rgdp
Innovcity0.0402 ***1.2366 ***1.1360 ***
(0.0103)(0.3704)(0.3884)
Hsr −0.2398
(0.3130)
Control variableYesYesYes
City fixed effectsYesYesYes
Time fixed effectsYesYesYes
Observations336033603360
N280280280
Adjusted R20.98070.48130.4991
Note: (1) Values in parentheses indicate city-level clustered robust standard errors. (2) *** denotes significance levels at 1%.
Table 5. Results of the mediating effect.
(1)(2)(3)(4)(5)(6)
Patent 1RgdpPatent 2RgdpHumRgdp
Innovcity16.8242 ***0.8741 **5.8592 ***0.9766 **53.3311 ***0.9627 **
(3.0569)(0.3987)(1.7837)(0.3965)(13.0604)(0.3883)
Patent1 0.0174 ***
(0.0057)
Patent2 0.0272 **
(0.0110)
Hum 0.0032 *
(0.0017)
Control variableYesYesYesYesYesYes
City fixed effectsYesYesYesYesYesYes
Time fixed effectsYesYesYesYesYesYes
Observations336033603360336033603360
N280280280280280280
Adjusted R20.36410.47920.43030.50010.33050.4998
Note: (1) Values in parentheses indicate city-level clustered robust standard errors. (2) ***, **, and * denote significance levels at 1% and 5% respectively.
Table 6. The results of heterogeneity test part 1.
(1)(2)(3)(4)(5)(6)
Regional DistributionCity Size
EastCentralWestLargeMediumSmall
Innovcity1.7897 ***−0.28811.8418 **−0.19201.8314 **1.5653 *
(0.5143)(0.5848)(0.9080)(0.4030)(0.7997)(0.8465)
Control variableYesYesYesYesYesYes
City fixed effectsYesYesYesYesYesYes
Time fixed effectsYesYesYesYesYesYes
Observations1164120099610929721296
N97100839181108
Adjusted R20.62720.47580.46520.57560.50350.4839
Note: (1) Values in parentheses indicate city-level clustered robust standard errors. (2) ***, **, and * denote significance levels at 1%, 5%, and 10%, respectively.
Table 7. Results of heterogeneity test—Part 2.
(1)(2)(3)(4)(5)(6)
Administrative GradeMarketizationGovernment Efficiency
HighLowHighLowHighLow
Innovcity1.6387 *1.7212 ***0.7882 *1.7964 **2.1657 ***0.1967
(0.8237)(0.4899)(0.4653)(0.7583)(0.5181)(0.5199)
Control variableYesYesYesYesYesYes
city fixed effectsYesYesYesYesYesYes
time fixed effectsYesYesYesYesYesYes
Observations54028202052130815361824
N45235171109128152
Adjusted R20.60410.48620.58400.46020.55810.4462
Note: (1) Values in parentheses indicate city-level clustered robust standard errors. (2) ***, **, and * denote significance levels at 1%, 5%, and 10%, respectively.
Disclaimer/Publisher’s Note: The statements, opinions and data contained in all publications are solely those of the individual author(s) and contributor(s) and not of MDPI and/or the editor(s). MDPI and/or the editor(s) disclaim responsibility for any injury to people or property resulting from any ideas, methods, instructions or products referred to in the content.

