Article

Ecological Assessment of Riparian Vegetation Along the Banks of the River Panjkora, Hindukush Range

by
Shakil Ahmad Zeb
1,
Shujaul Mulk Khan
1,2,*,
Abdullah Abdullah
1,
Zeeshan Ahmad
1 and
Tufail Ahmad Zeb
3
1
Department of Plant Science, Quaid-i-Azam University Islamabad, Islamabad 45320, Pakistan
2
Pakistan Academy of Science, Islamabad 44000, Pakistan
3
Department of Botany, University of Peshawar, Peshawar 25120, Pakistan
*
Author to whom correspondence should be addressed.
Submission received: 20 June 2025 / Revised: 19 August 2025 / Accepted: 2 September 2025 / Published: 10 September 2025

Abstract

Physiographic, geographic, and environmental gradients influence the development of plant communities. This study assessed how environmental gradients affect riparian vegetation along the River Panjkora, aiming to find relationships between vegetation and abiotic factors through indicator species analysis. Vegetation was sampled using the quadrat method (1 × 1 m2 for herbs, 5 × 5 m2 for shrubs, 10 × 10 m2 for trees), and soil samples were analyzed for edaphic variables. Indicator species and ordination analyses were performed using PCORD (version 5) and CANOCO (version 4.5) software to understand species diversity. Detrended correspondence analysis (DCA) and canonical correspondence analysis (CCA) identified species patterns and their links to environmental factors. A total of 216 plant species were recorded across seven stations, grouped into five communities. Community 01, Melia azedarach, Punica granatum, and Asparagus racemosus, are affected by Cr, p ≤ 0.03; Fe, p ≤ 0.01; Zn, p ≤ 0.04; and Mg, p = 0.03. On the other hand, Community 02, Populus alba, Debregeasia saeneb, and Youngia japonica, are controlled by Co, p = 0.01; pH, p = 0.03; Cd, p = 0.04; EC, p = 0.03; and TDSs, p = 0.03. The third community, with indicator species Pinus roxburghii, Rydingia limbata, and Cheilanthes pteridioides, is strongly influenced by Cr, p ≤ 0.05; Cu, p ≤ 0.03; TDSs, p = 0.02; and Zn, p = 0.03. Community 04, consisting of Ficus carica, Polygonum plebeium, and Avena sativa, is shaped by Na, p = 0.01; K, p ≤ 0.05; and Fe, p = 0.04. The fifth community, represented by Ficus palmata, Rosa multiflora, and Heliotropium europaeum, is influenced by pH, p ≤ 0.04 and Mn, p = 0.03. DCA displayed maximum gradient lengths of 6.443 (eigenvalue 0.742) on axis 1, 5.222 (0.662) on axis 2, 4.053 (0.600) on axis 3, and 4.791 (0.464) on axis 4. Soil pH, heavy metals (Cr, Fe, Zn, Mg, Co, Cd, Cu, Na, K, and Mn), EC, and TDSs were the main factors shaping community structure. The indicator species analysis is recommended to identify and conserve the rare species and native flora of a particular region.

1. Introduction

Riparian vegetation, which occurs along the banks of rivers and streams, is of crucial ecological importance, as it transitions between terrestrial and aquatic ecosystems. These zones offer essential services such as water filtration, bank stabilization, erosion prevention, flood mitigation, and corridors serving as biodiversity hotspots [1,2]. It also supports the ecosystem functioning by influencing microclimate, hydrological regimes, and nutrient cycling [3]. The riparian vegetation in developing countries such as Pakistan is severely threatened due to anthropogenic activities, overgrazing, habitat fragmentation, and rapid urbanization [4]. To correctly manage and conserve these areas, it is recommended that the rare species and native flora of a particular region be preserved, for which techniques such as indicator species analysis can be instrumental [5]. Plant populations represent hierarchical vegetation structure shaped under different ecological conditions, with biotic and abiotic factors playing key roles [6,7]. Similarly, various populations in the form of communities delineate a distinct structure in an area concerning the biotic and abiotic components of the ecosystem [8,9].
However, the vegetation structure is mainly influenced by environmental, topographic, and anthropogenic factors [10]. Simply stating this fact is insufficient, as the specific drivers and their mechanisms vary significantly across different biomes. In addition, the influencing mechanisms are also diverse; for instance, soil factors such as pH, electrical conductivity (EC), total dissolved solids (TDSs), etc., affect nutrient availability [11], while human-induced changes and animal grazing directly affect ecosystem health and function [12]. These factors vary from region to region, underscoring the need for local-scale studies to understand the specific ecological dynamics. Soil physico-chemical properties can significantly affect the richness and evenness of plants, ultimately affecting vegetation patterns across landscapes [9].
Recent environmental research highlights the impacts of rapid environmental changes, specifically those driven by anthropogenic activities, on vegetation [13]. Different vegetation types are distributed in different zones depending on the environmental variables, with some being specialized for a specific zone and unable to survive in other zones [14]. In response to environmental factors, plant species adapt by changing their growth, development, and life cycles. This spatial turnover of plant species in response to changing environmental factors has been recognized as a key concept in modern vegetation ecology [15,16]. Riparian vegetation is specifically vulnerable to decline because its location on rivers, streams, and ponds exposes it to severe conditions such as frequent flooding and winds. In the current era, other factors besides natural hazards also contribute to the fragmentation and degradation of riparian vegetation. Human activities include urbanization, road construction, overgrazing, agricultural expansion, and industrialization, which are incessantly increasing with continuous upheavals in the human population. As a result, the composition of vegetation units along ecological gradients can be viewed as a function of ongoing shifting in habitat conditions, where plant species show various ecological optima [17]. Many studies have documented the relationship between vegetation patterns and environmental factors. However, the influence of these factors varies across different regions and ecosystems. Similarly, River Panjkora in the Hindukush Range is an essential example of a region facing severe problems due to expansion in the human population and climatic catastrophes [18]. The riparian vegetation of the River Panjkora has suffered from floods for the last few years, especially during the monsoon season. But despite its ecological importance, the riparian vegetation of the River Panjkora in the Hindukush Range has received limited scientific attention, leaving a significant gap in our understanding of its community structure and the factors that influence it.
Multivariate statistical approaches provide tools to explore vegetation under the influence of environmental factors, enabling the identification of key ecological drivers crucial to plant community composition [19,20]. Therefore, the main goal of this study was to investigate the riparian vegetation along the banks of the River Panjkora. We aimed to test the central hypothesis that edaphic and topographic factors are central to structuring the plant communities in this region. Specifically, this study sought to (1) identify and classify the distinct riparian plant communities; (2) determine the relationships between these communities and key environmental variables, such as soil chemistry and altitude; and (3) identify indicator plant species for the different ecological zones along the river.

2. Materials and Methods

2.1. Study Area

The current study was conducted to study the riparian vegetation of the River Panjkora district of Dir Lower. Dir Lower is in the northern part of Khyber Pukhtunkhwa (Figure 1). The River Panjkora flows through the middle of the district, where many tributaries arise from mountains and join it to increase its water mass. Panjkora comes from the combination of five streams (Panj means five and Kora water), Kumrat-Kohistan stream, Gwaldai stream, Sherengal stream, Dir, and Barwal stream. These five streams join the River Panjkora at Dir Upper, while the Koni and Roud streams join at Dir Lower. The glaciers of the Kumrat and the surrounding regions of the Hindu Kush Mountains are the source of the River Panjkora. The current study area is located at a latitude of 34°55′56″ to 34°45′44″ N and its longitude from 72°05′71″ to 71°48′08″ E. The region consists of 34 km, starting from Akhagram and ending at its entrance to the mountains of Bajaur and Malakand. Finally, the River Panjkora meets the River Swat at Bosaq village in the district of Malakand. Mountains surround the river, which are covered in snow and have a height of about 5000 m, providing an ethereal view. In summer, there are heavy floods because these mountains are covered by snow in winter, which melts in summer and flows down in the form of a flood.

2.2. Collection of Data

Quadrat quantitative ecological design was used for data collection. A total of 135 quadrats were laid down in seven stations randomly on the banks of the River Panjkora. The data were collected from March 2018 to May 2019. Each quadrat consists of replicate i–e (S1Q1a, S1Q1b, and S1Q1c). The first quadrat (S1Q1a) was laid down near the edges of shallow water. The second quadrat was laid down at 10 m distance from the first quadrat, while the third replicate of the quadrat was laid down at 20 m distance from the first quadrat (S1Q1a). Quadrats were laid down on both sides of the river, while some quadrats were in the middle. The quadrat sizes were 1 × 1 m2, 5 × 5 m2, and 10 × 10 m2 for herbs, shrubs, and trees, respectively [21]. The phytosociological characteristics were recorded for each quadrat, including the critical value index (IVI), frequency, relative frequency, cover, and relative density [22]. The critical importance value index (IVI) is manually calculated using a formula, IVI = relative cover + relative density + relative frequency/3 on a 0–100 scale, averaging the contributions of cover, density, and frequency [23]. For each community, per-quadrat IVI values were summed across all quadrats to obtain community-level IVI for each species. Dominant species were identified as the three species with the highest IVI values per community, and rare species were those with the lowest IVI values in the community.
Moreover, indicator species for each community were identified using a threshold with a 25% indicator value (IV) and a 95% significance level (p value 0.05) as the cutoff for determining indicator species. Additionally, the data attribute plots for each identified indicator species were plotted using PCORD 5 software to visually analyze their distribution patterns [5,6,12,23].
Plant specimens were collected, pressed, dried, tagged, and mounted on herbarium sheets. Identification of plant specimens was performed by Ghulam Jelani’s lecture at the Department of Botany, University of Peshawar, and from the flora of Pakistan. Each quadrat’s coordinates, such as longitude, latitude, and altitude, were noted via GPS (Garmin, Olathe, Kansas, KS, USA). Pictures of all plants were taken through a Canon EOS 5D MARK camera (Tokyo, Japan). Anthropogenic activities and grazing pressure were also reported at various places where the vegetation was disturbed.

2.3. Soil Collection

Soil samples were collected from each quadrat. Soil was collected from a 15 cm depth, and the topmost layer of humus was removed. The soil was kept in plastic bags tagged with their respective codes. Further analysis of the soil was performed (TDSs (total dissolved solids), pH, and electrical conductivity) in the Plant Ecology and Conservation Lab, Department of Plant Science, Quaid-i Azam University, Islamabad [23].

2.4. Preparation of Soil Samples for Screening of the Atomic Absorption Spectrometry

For soil digestion, we followed the protocols of [24]. We took 1 gm of soil in powder form without any residual material. Then we prepared a mixture of tri-acid (HNO3, HCLO4, and H2SO4) in 5:1:1, respectively. After preparing the tri-acid mixture, we added 10 mL of tri-acid to one gram of soil and kept it for 24 h; then, we heated it till the color of the solution became yellow. All the oxidizable matter was easily oxidized. After cooling the solution down, we added distilled water to make it more concentrated. Finally, the concentrated sample was filtered into a 120 mL bottle via Whatman filter paper. Further nutrient and heavy metal analysis was conducted by an Atomic Absorption spectrometer (model VARIAN, AA240FS) (Mulgrave, Victoria, Australia) in the Department of Biochemistry, Quaid-i-Azam University, Islamabad.

2.5. Data Analysis

The data were statistically analyzed to determine the association between plant species composition and different ecological factors. Data analysis was performed using PC-ORD version 5 and CANOCO version 4.5 software. Before analysis, the species data were converted into a binary presence and absence format, where (1) indicated the presence while (0) indicated the absence of a species in each quadrat. This standardization allowed for consistent input in community composition analyses.
In accordance with the PC-ORD version 5 requirement, plant species were organized horizontally and quadrats vertically. In PC-ORD version 5 software, we used cluster and indicator species analysis to identify distinct plant communities and determine species that reveal specific environmental conditions [25]. For ordination, we used detrended correspondence analysis (DCA) and canonical correspondence analysis (CCA) in CANOCO 4.5 software to assess the relationship between distribution and environmental gradients, such as soil features and elevation [26,27]. The whole dataset was also checked for normality and multicollinearity before applying the ordination techniques. All visualization diagrams and ordination were generated using the respective software.

3. Results

A total of 216 species has been recorded from the banks of the River Panjkora, which consists of five different communities/associations. Floristically, these 216 species belong to 67 families and 163 genera, which are spread over seven stations. The most dominant were herbs (178), shrubs (14), and trees (24). Based on the IVI (Important Value Index), we determined the dominant and rare species of the study area. Species with low IVI were classified as rare plants, while species with maximum IVI were classified as dominant plant species.
The topmost abundant herb species are Cynodon dactylon, Cerasitum glomeratum, Nasturtium officinale, Parthenium hysterophorus, and Medicago polymorpha. On the other hand, the rare herb species are Solanum nigrum, Stellaria media, Valeriana szovitsiana, Verbascum thapsus, and Vinca major. In the shrubby layer, the dominant species are Dodonaea viscosa, Gymnosporia royleana, Ricinus communis, and Rubus ulmifolius, which have high IVI, while Rosa multiflora, Zanthoxylum armatum, Debregeasia salicifolia, Debregeasia saeneb, and Nerium oleander have low IVI, which makes them be considered rare species. The top dominant tree species, which have maximum IVI, are Populus alba, Salix tetrasperma, Broussonetia papyrifera, and Melia azdarach, while Sideroxylon mascatens, Pinus roxburghii, Platanus orientalis, Ziziphus nummularia, and Ficus carica are the rare species of the study area that have low minimum IVI value.

3.1. Species Area Curve

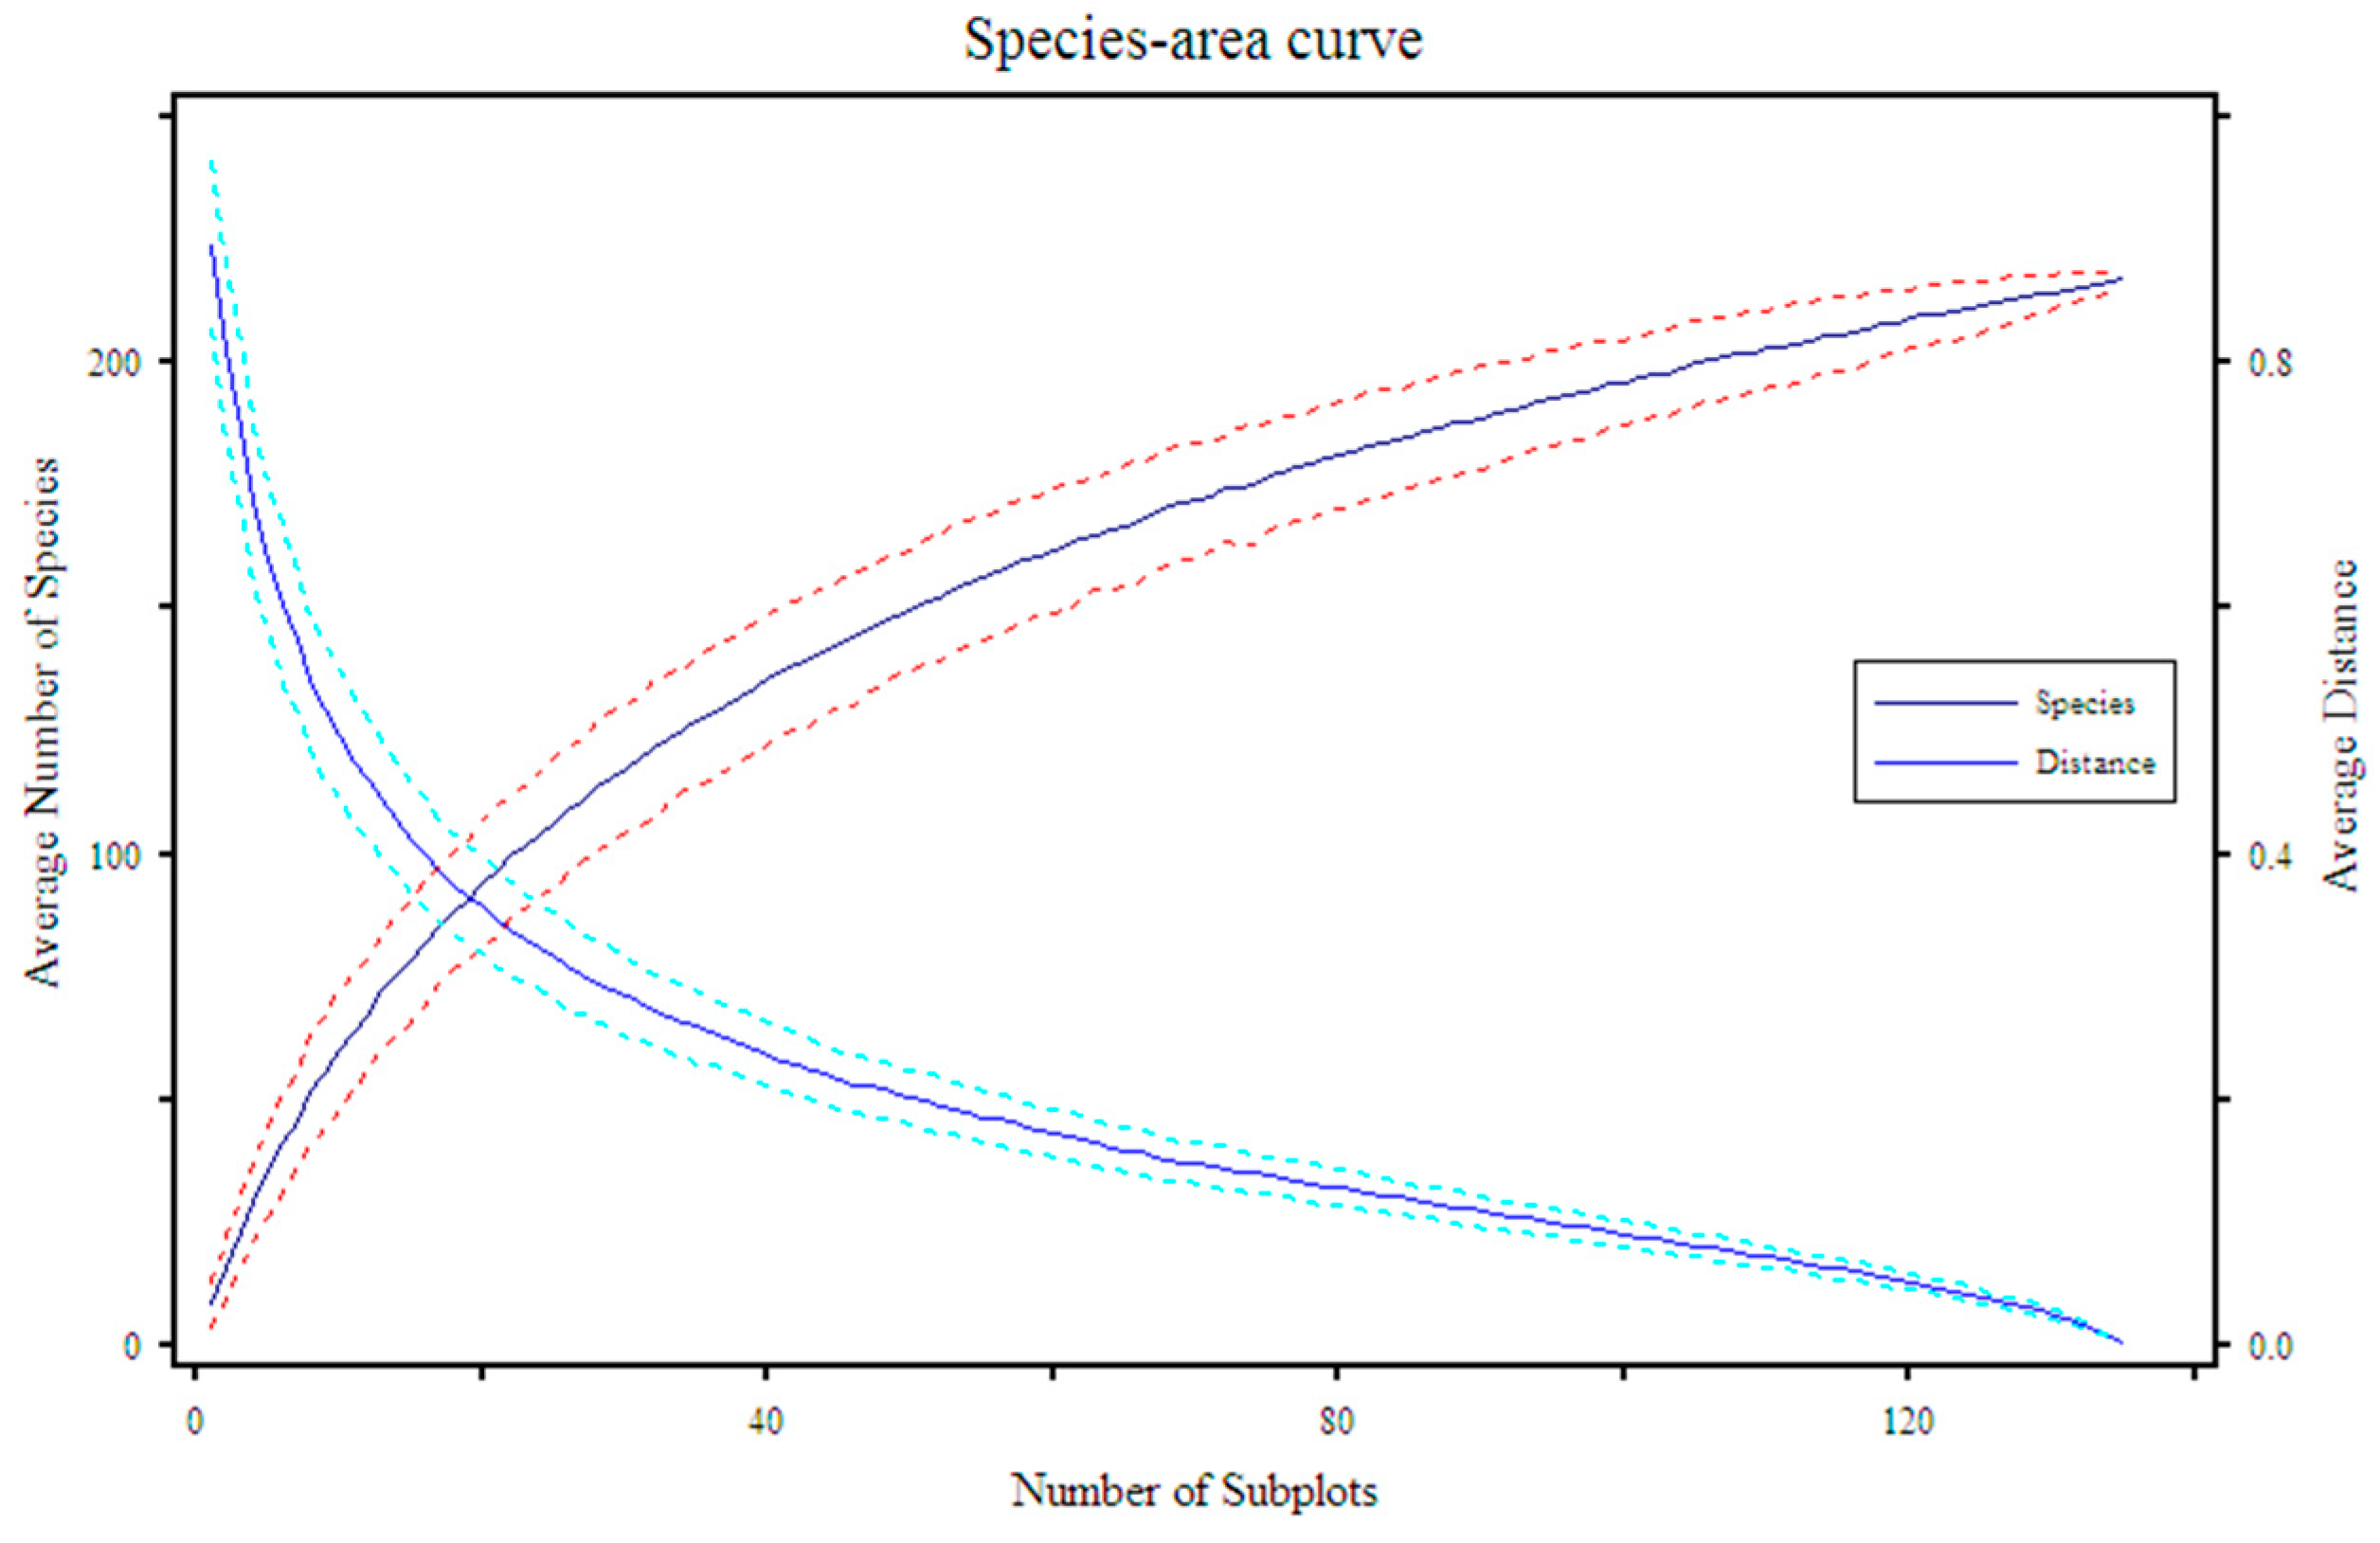
We determined whether the quadrats’ sizes are adequate through abundance data combined with the Sorenson distance value [23]. The result of the species area curve shows that species diversity increases from 25 to 100 quadrats, and after that, the curve is parallel, showing that no new species are appearing, as shown in Figure 2. It is concluded that the number of samples taken in the current study area is enough.

3.2. Cluster Analysis

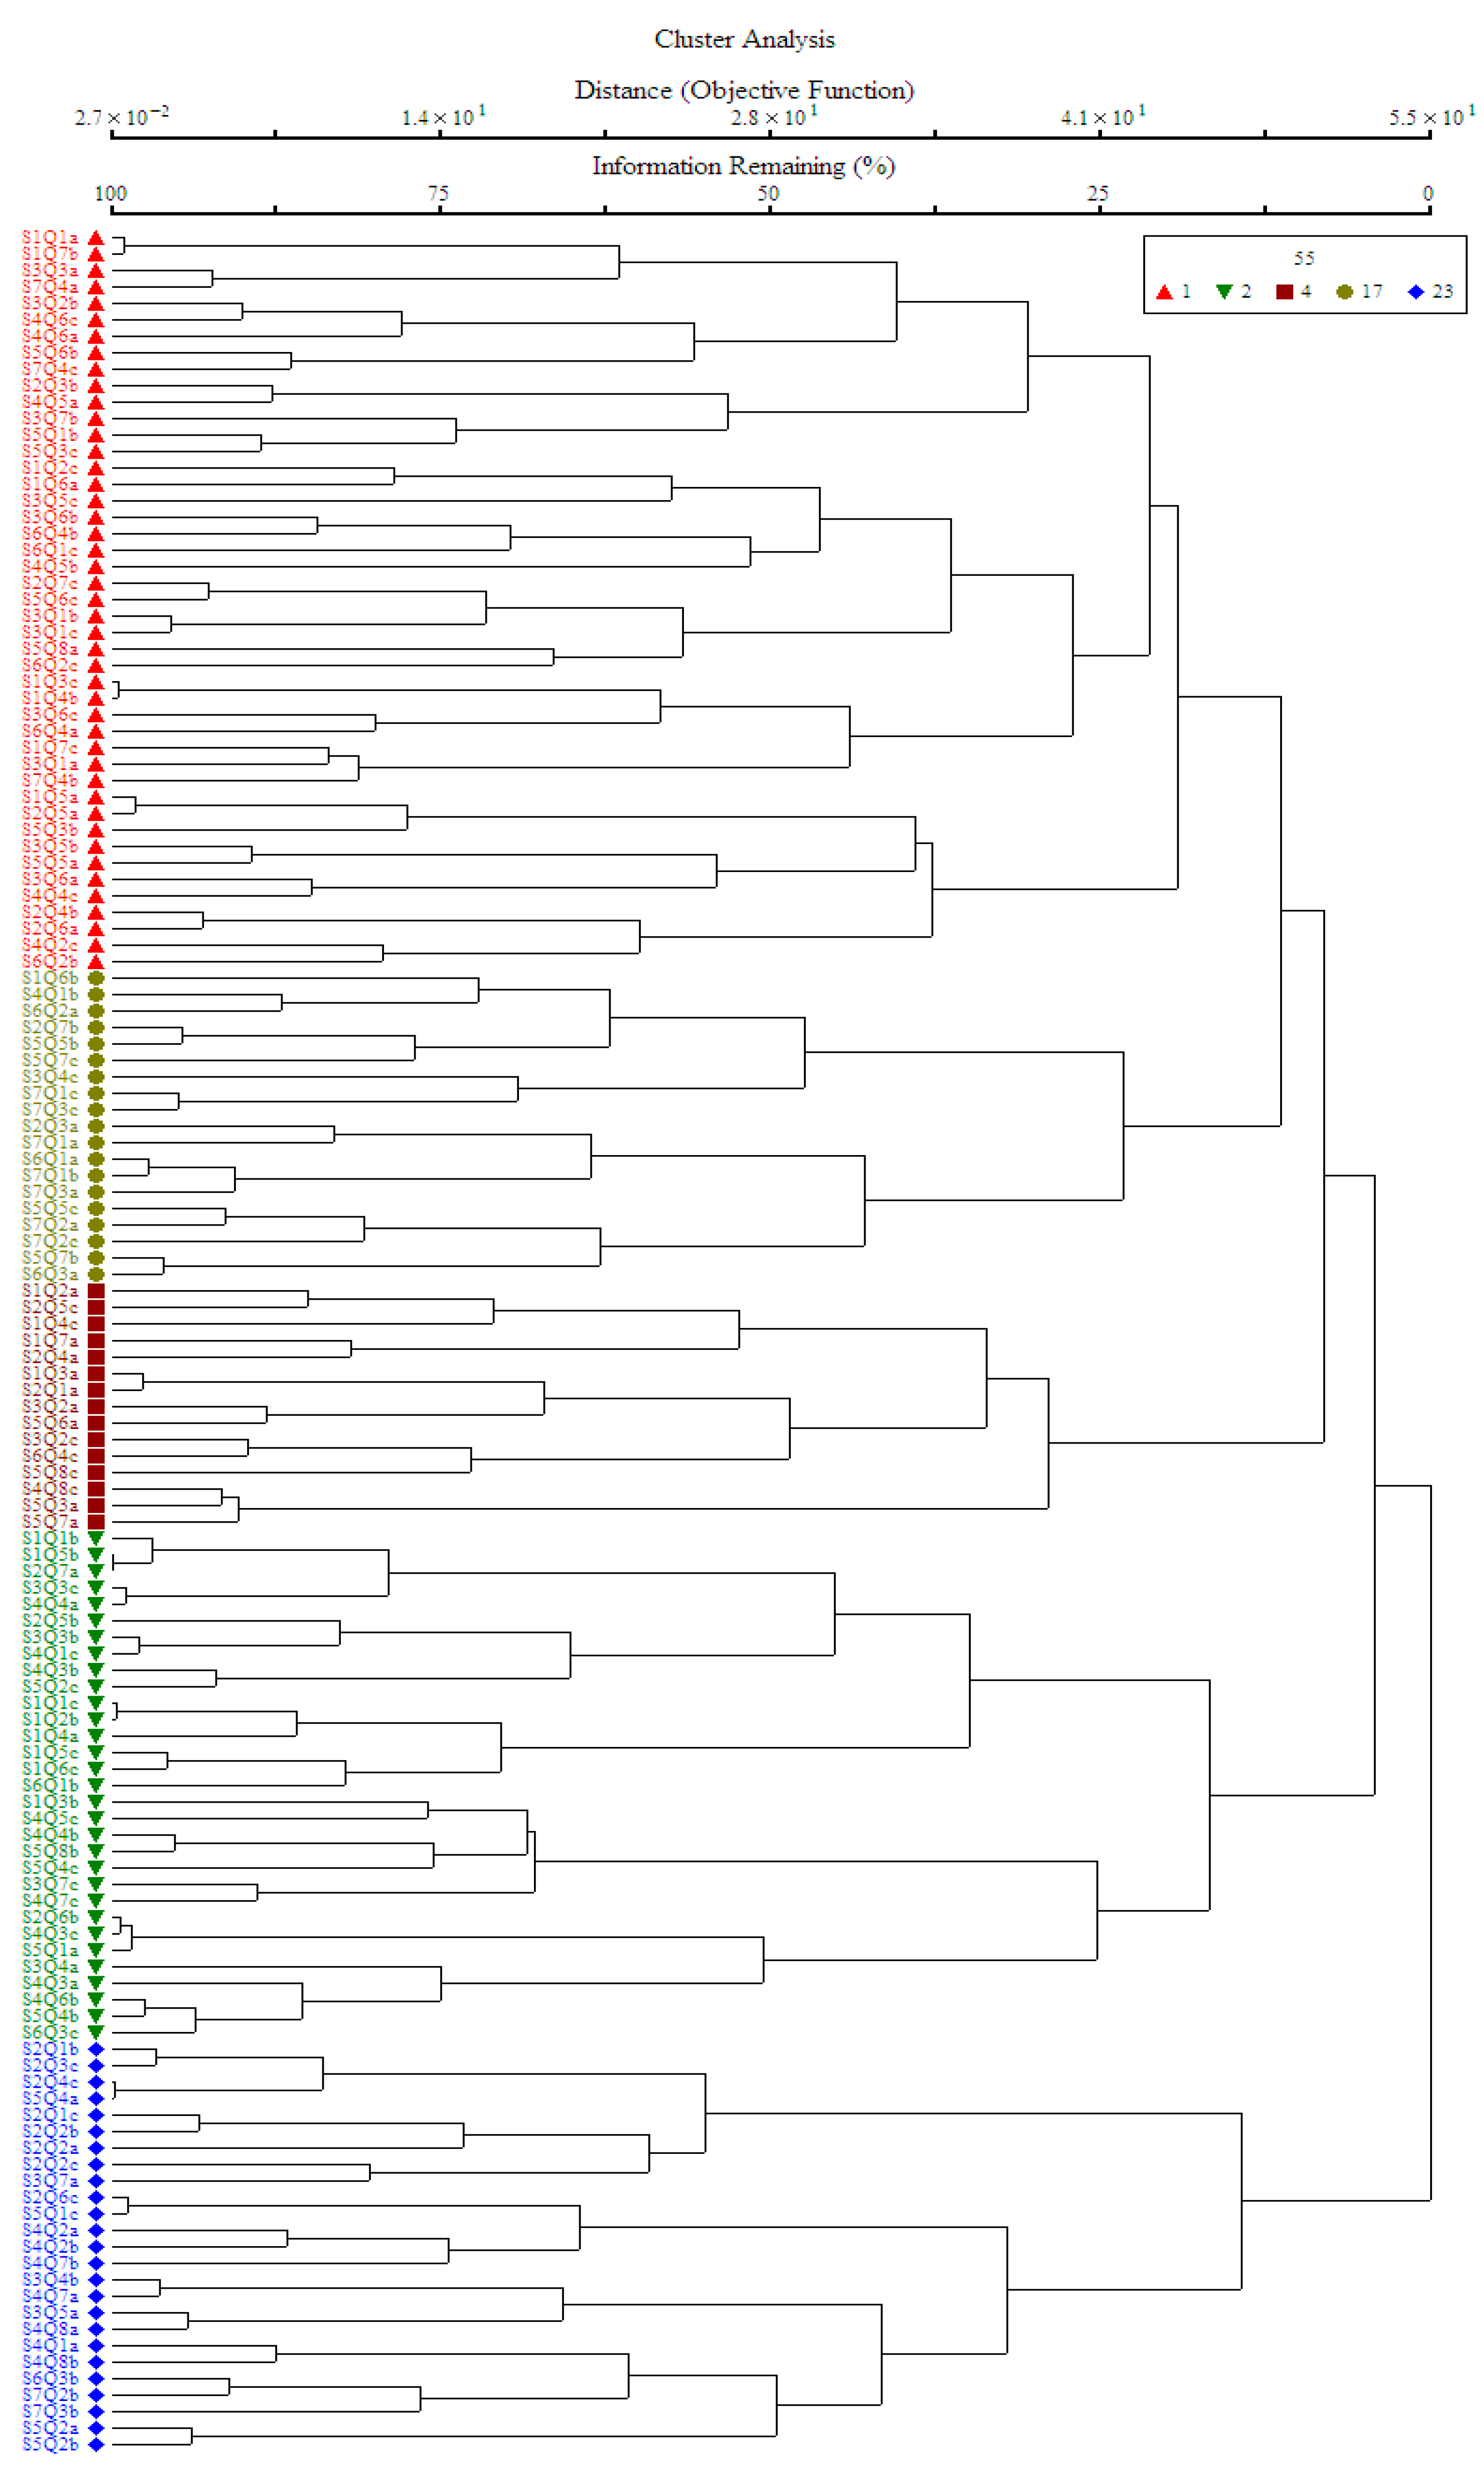
The cluster analysis using PCORD version 5 clustered seven stations (135 quadrats) into five plant communities/associations (Figure 3).

3.3. Two-Way Cluster Analysis

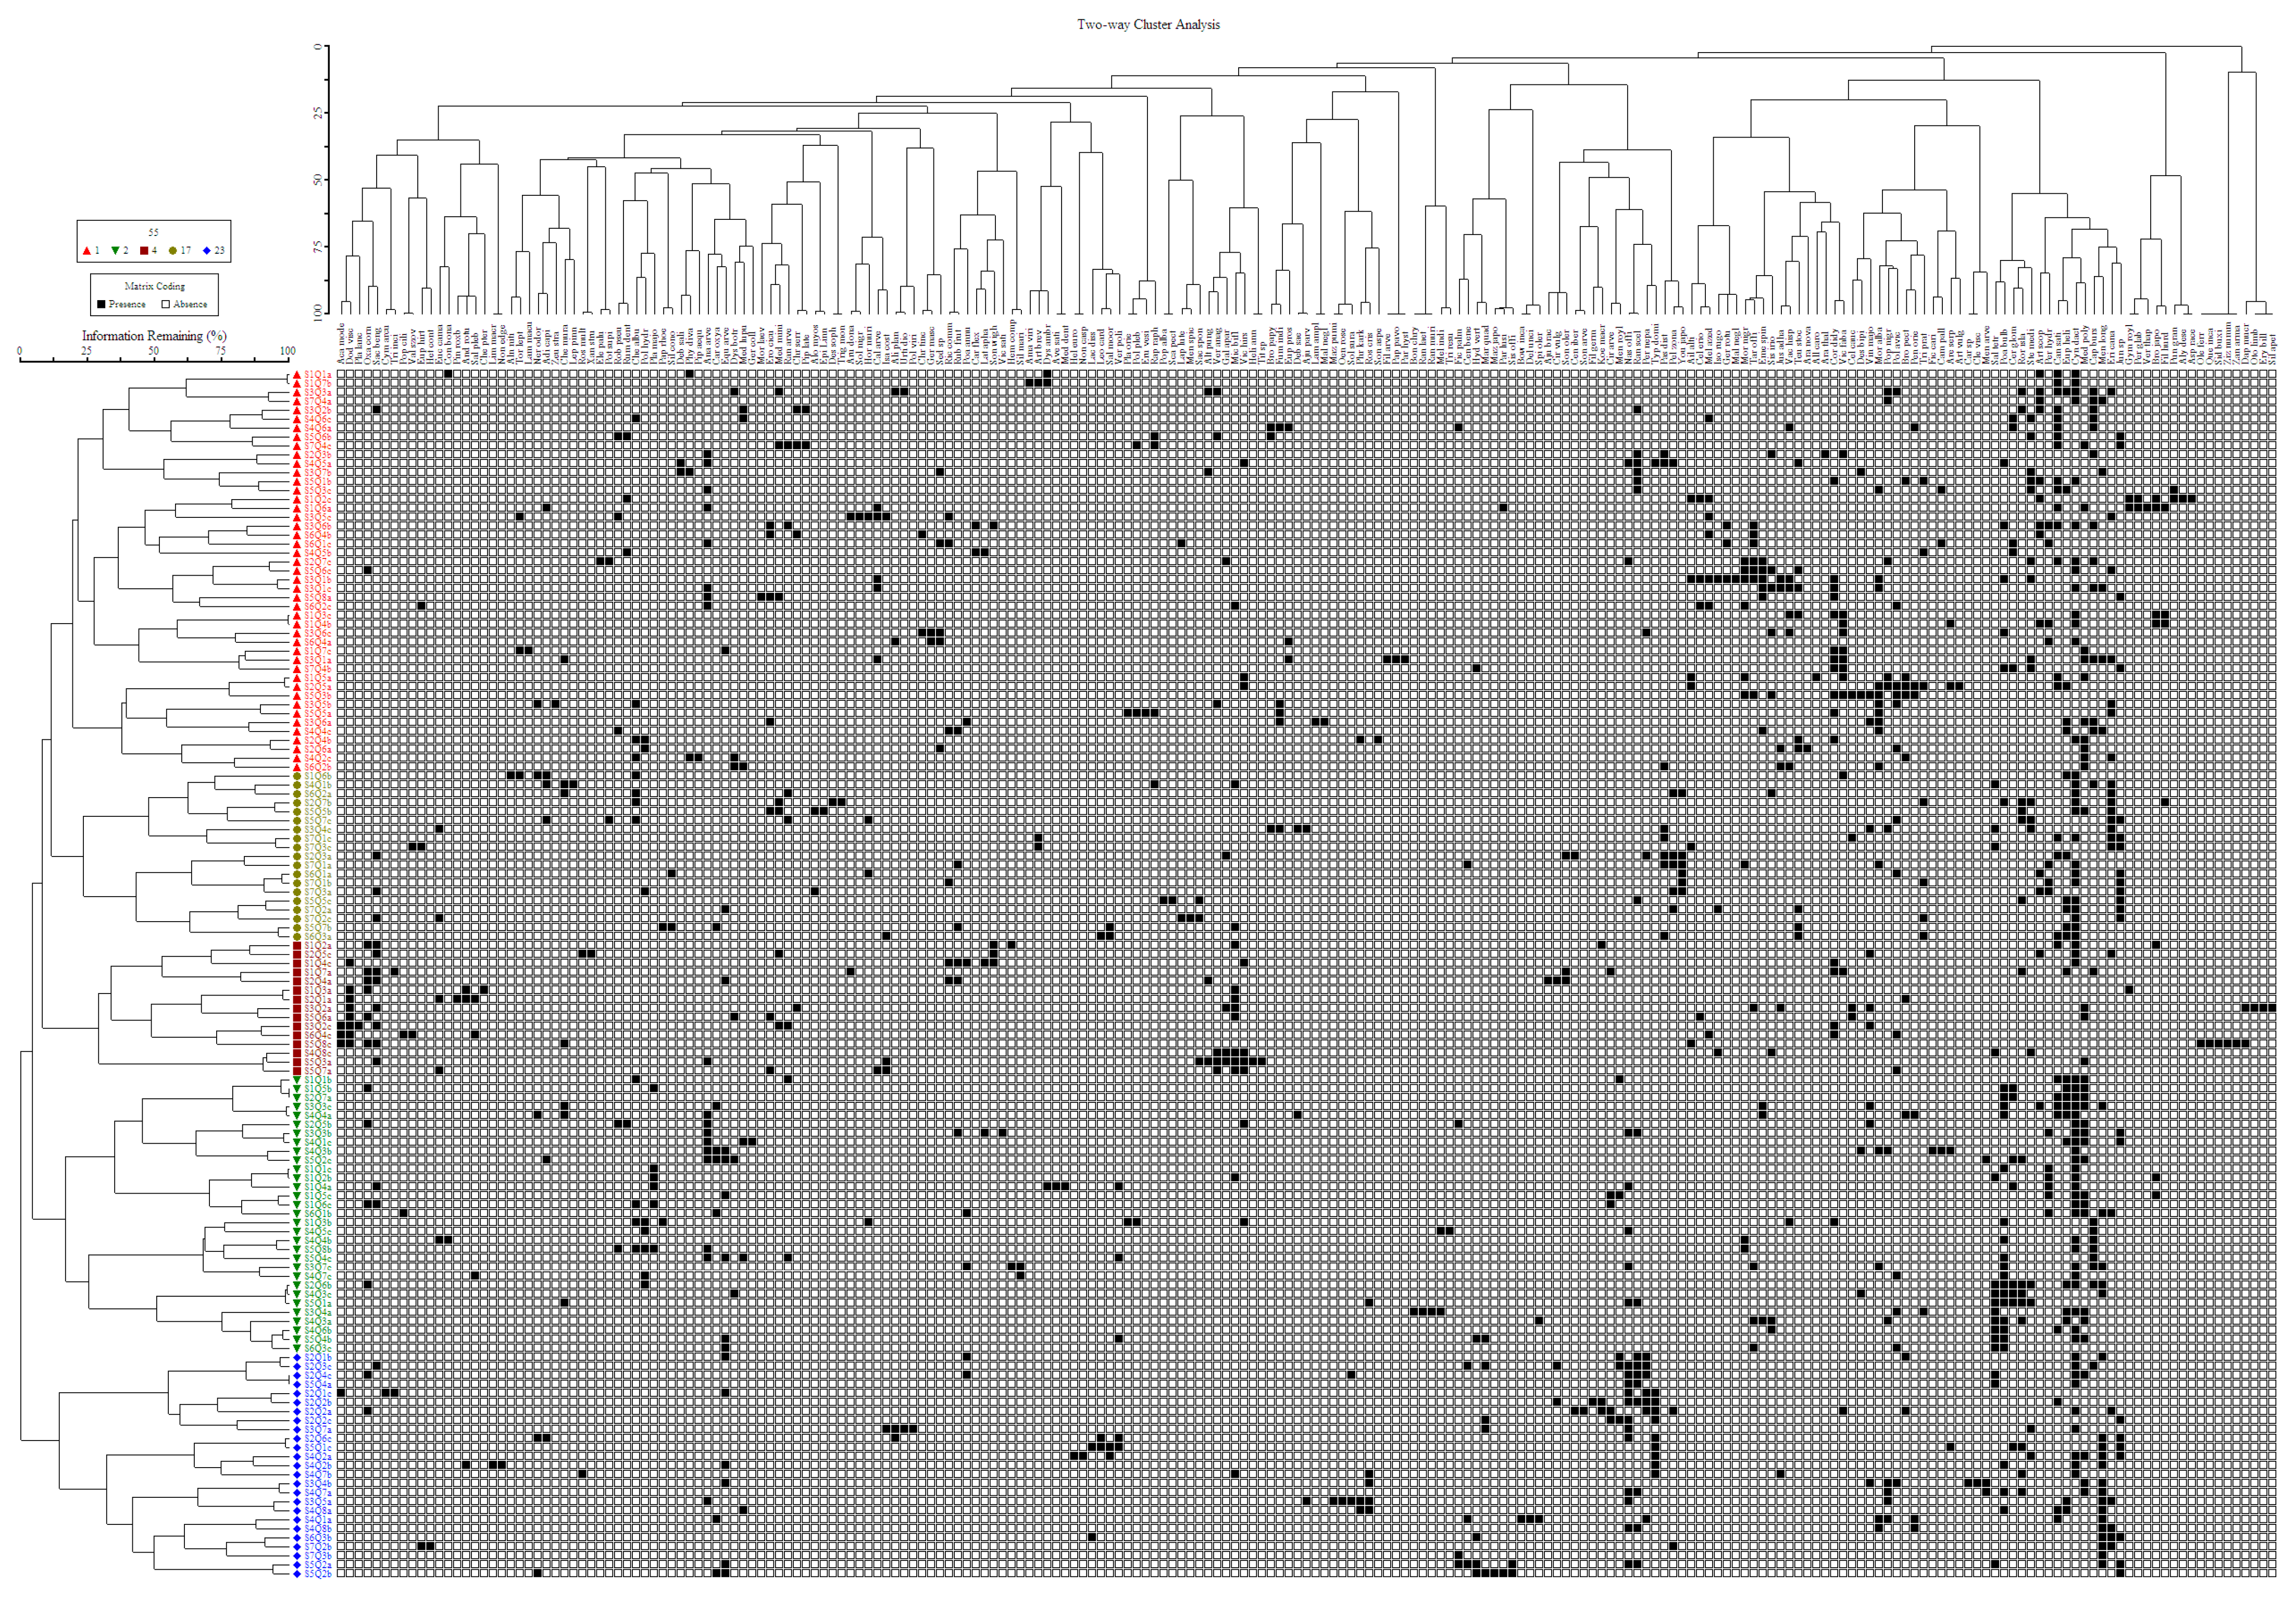
The two-way cluster analysis shows the distribution of plant species in the selected study area. It uses the presence or absence (1,0) Sorensen measure data sheet. In the two-way cluster, the black dots indicate the presence of species, while the white dots indicate their absence. A total of 135 quadrats and five communities/associations divide the plant species (Figure 4).

3.4. Classification of Plant Communities

Through cluster and two-way cluster analysis, we have classified all the plants into five different communities. The plant communities were characterized by their indicator species. For each community, one herb, one shrub, and one tree were taken as indicator species.

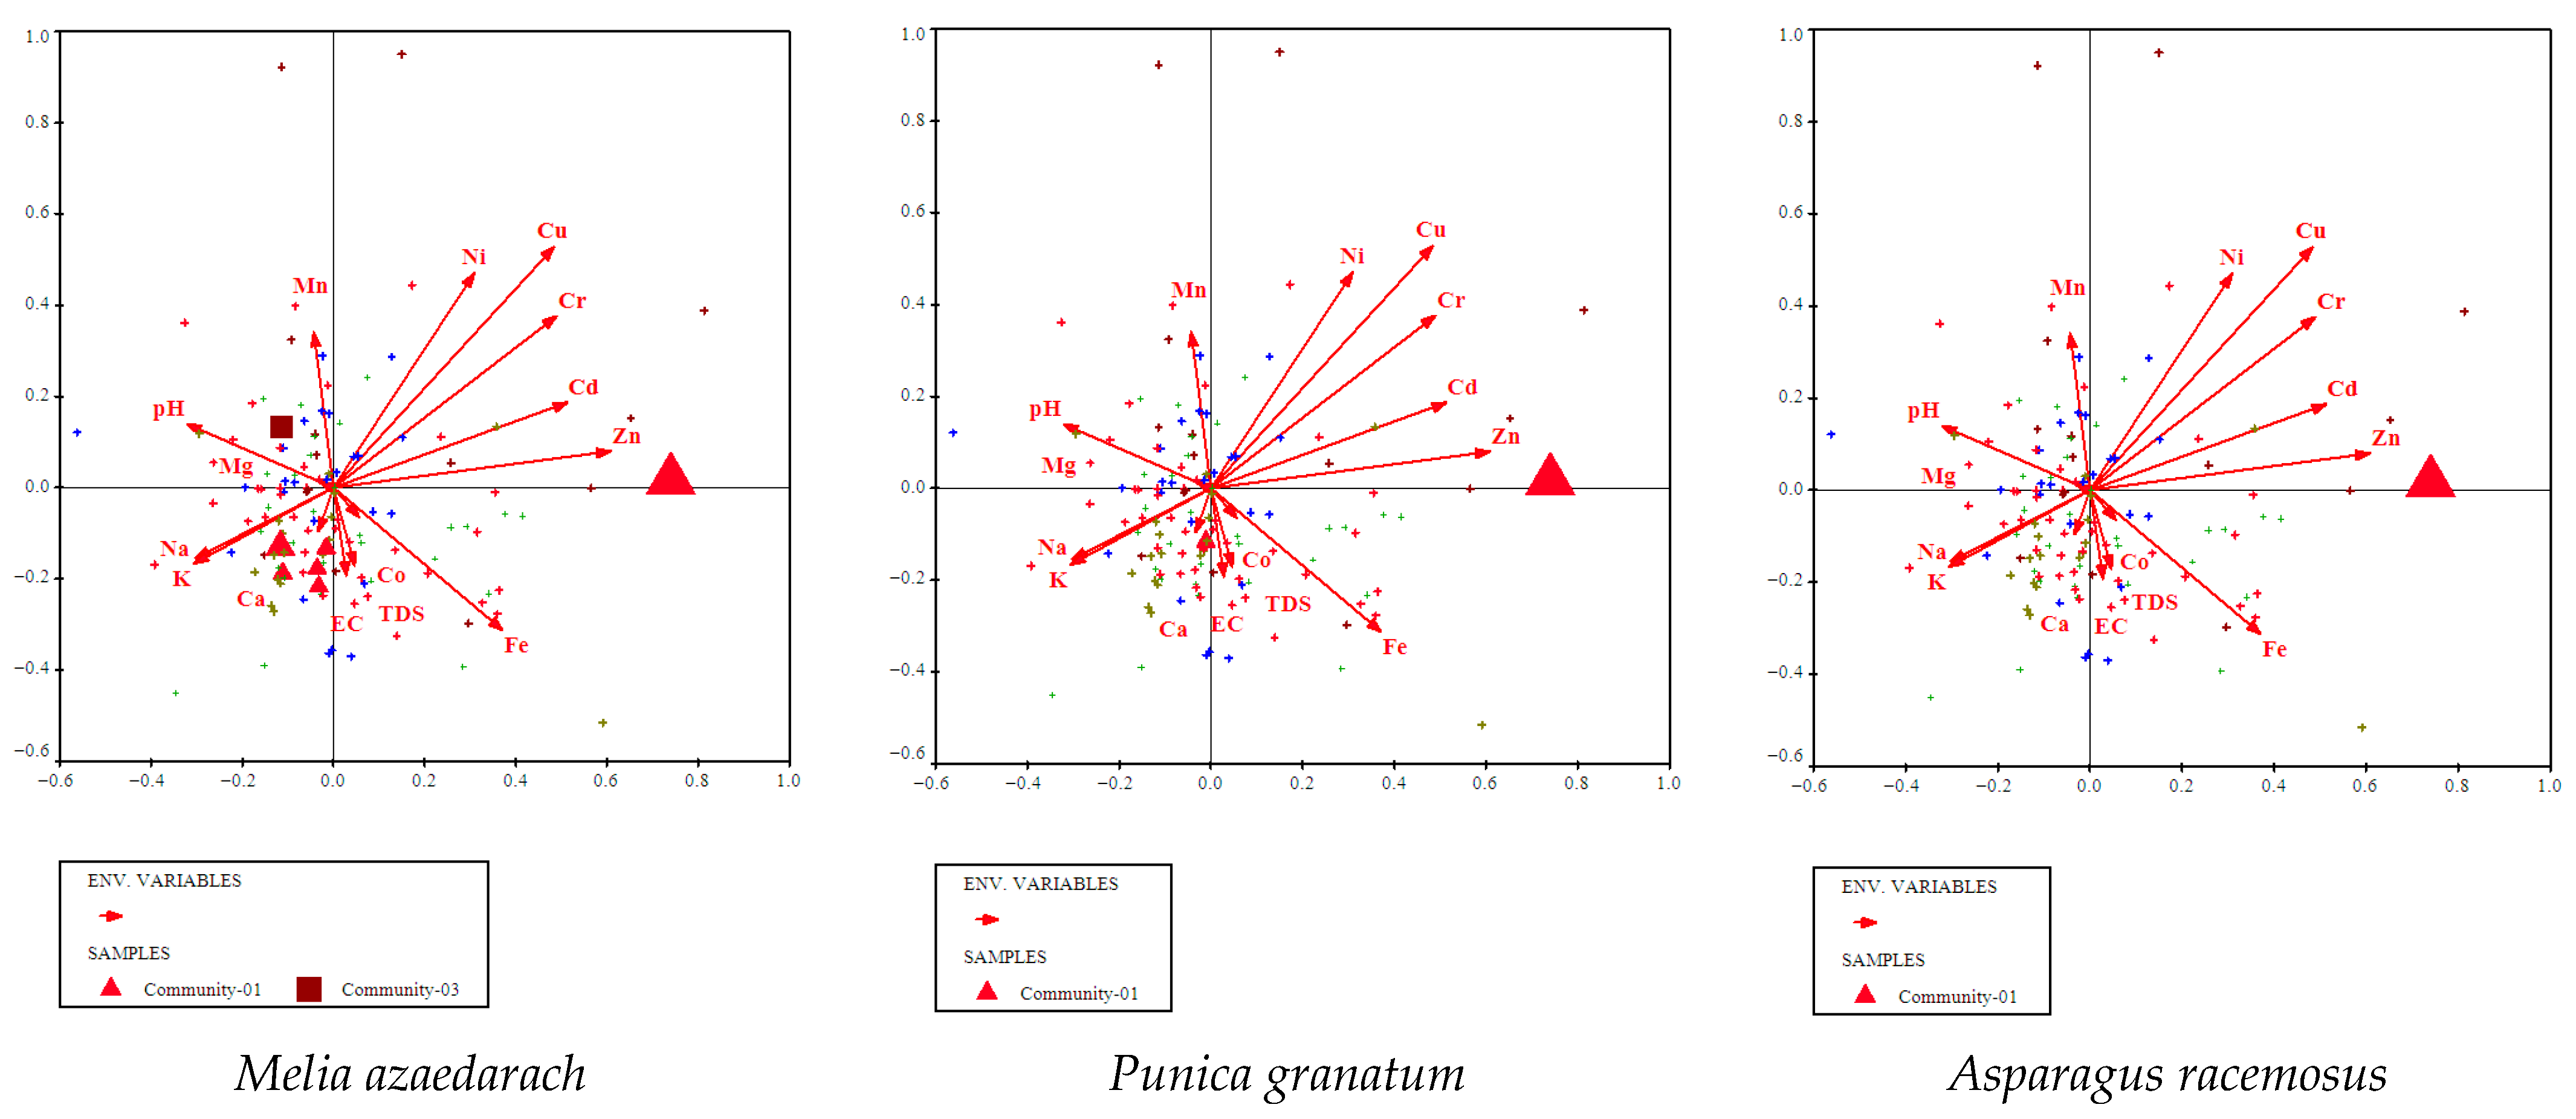
3.4.1. Melia azedarach, Punica granatum, and Asparagus racemosus Community

The first community consists of a total of forty-five quadrats. The top indicator species of this community are Melia azedarach (196.3062), Punica granatum (169.9048), and Asparagus racemosus (0.627527) (Figure 5). The listed species indicate lower Mg and higher Cr, Fe, and Zn Table 1. Other indicator species of this community are Nerium oleander, Leonurus cardiaca, Ailanthus altissima, Androsace rotundifolia, Saliva plebeia, Chenopodium murale, Gymnosporia royleana, Celtis eriocarpa, Morus laevigata, Alyssum desertorum, Oxalis corniculata, Erigeron bonariensis, Typha domingensis, Rumex dentatus, Hemarthria compressa, Persicaria glabra, Sonchus wightianus, Euphorbia helioscopia, Medicago minima, Erodium cicutarium, and Campanula pallida.
Morus nigra, Morus alba, Populus nigra, and Melia azedarach are dominant tree species that have high IVI, while Celtis caucasica, Platanus orientalis, Ficus palamta, Senegalia modesta, and Morus laevigata are the rare species having low IVI of this community. In the shrubby layer, Gymnosporia roylena, Ricinus communis, Justicia adhatoda, and Punica granatum, having high IVI, are the dominant shrub species, while the Rubus ulmifolius, Debregeasia salicifolia, Nerium oleander, and Isodon rugosus are the rare species of the first community. The most dominant herb species of this community with high IVI are Cannabis sativa, Hydrilla verticillata, Cynodon dactylon, Mentha longifolia, and Eleocharis paustris, while Verbascum thapsus, Solanum nigrum, Phragmites karka, Sonchus wightiana, and Poa annua are rare species of this community with low IVI.
The soil pH of the first community shows basic characteristics, which ranged from 7.64 to 9.52, and electrical conductivity, which ranged from 14.9 to 1110 ppm, while the range of total dissolved solids (TDSs) ranged from 11 to 121 ppm. Ranges of different heavy metals and nutrients in the soil included K (0.0806 to1.482), Mg (1.1314 to 9.7511), Ca (0.032 to 6.353), Na (−0.17 to 3.2703), Fe (0.05 to 2.064), Zn (0.1968 to 1.2016), Cd (0.212 to 0.328), Cu (0.165 to 0.583), Cr (−0.032 to 0.671), Co (1.398 to 8.782), Ni (1.665 to 2.577), and Mn (0.317 to 8.227) mg/L.

3.4.2. Populus alba, Debregeasia saeneb, and Youngia japonica, Community

The second community is divided into nineteen quadrats. The top three indicator species in this community are Populus alba (674.0473), Debregeasia saeneb (12.13606), and Youngia japonica (1.88258) (Figure 6). These species were the indicators of higher Co, Cd, EC, and TDS Table 2. Other indicator species of this community are Ranunculus sceleratus, Salix tetrasperma, Ranunculus arvensis, Celtis caucasica, Scandix pectin-veneris, Artemisia brevifolia, Saccharum spontaneum, Trifolium pratense, Filago hurdwarica, Anagallis arvensis, Bromus japonicus, and Dysphania botrys.
Broussonetia papyifera, Eucalyptus camaldulensis, Ailanthus altissima, Morus alba, and Salix tetrasperma are the dominant trees of this community, while the rare tree species of this community are Alnus nitida, Populus alba, Populus nigra, Morus nigra, and Celtis caucasica. In the shrubby layer of the second community, the dominant shrub plant species are Isodon rugosus, Debregesia saeneb, and Rubus ulmifolius, having high IVI, while Ricinus communis and Nerium oleander are rare shrub plant species having low IVI. Pelargonium zonale, Cynodon dactylon, Periscaria nepalensis, Juncus sp., and Trifolium pratense are the dominant species, while the rare herbaceous species of this community having low IVI are Poa bulbosa, Sonchus oleraceus, Papaver rhoeas, Medicago monantha, and Scandix pectin-veneris.
The pH of the soil ranged from (4.26 to 9.51), showing basic properties of the soil. Electrical conductivity (EC) ranges from (25.8 to 644 ppm); total dissolved solids (TDSs) from (29 to 777 ppm), K (0.2332 to 1.3311), Mg (3.9082 to 9.3982), Ca (0.054 to 1.182),Na (0.0168 to 1.2445), Fe(0.207 to 1.962), Zn (0.1891 to 0.8086), Cd (0.187 to 0.288), Cu (0.149 to 0.463) Cr (0.007 to 0.371), Co (1.654 to 5.727), Ni (1.706 to 2.57), and Mn (1.963 to 6.658) mg/L.

3.4.3. Pinus roxburghii, Rydingia limbata, and Cheilanthes pteridioides Community

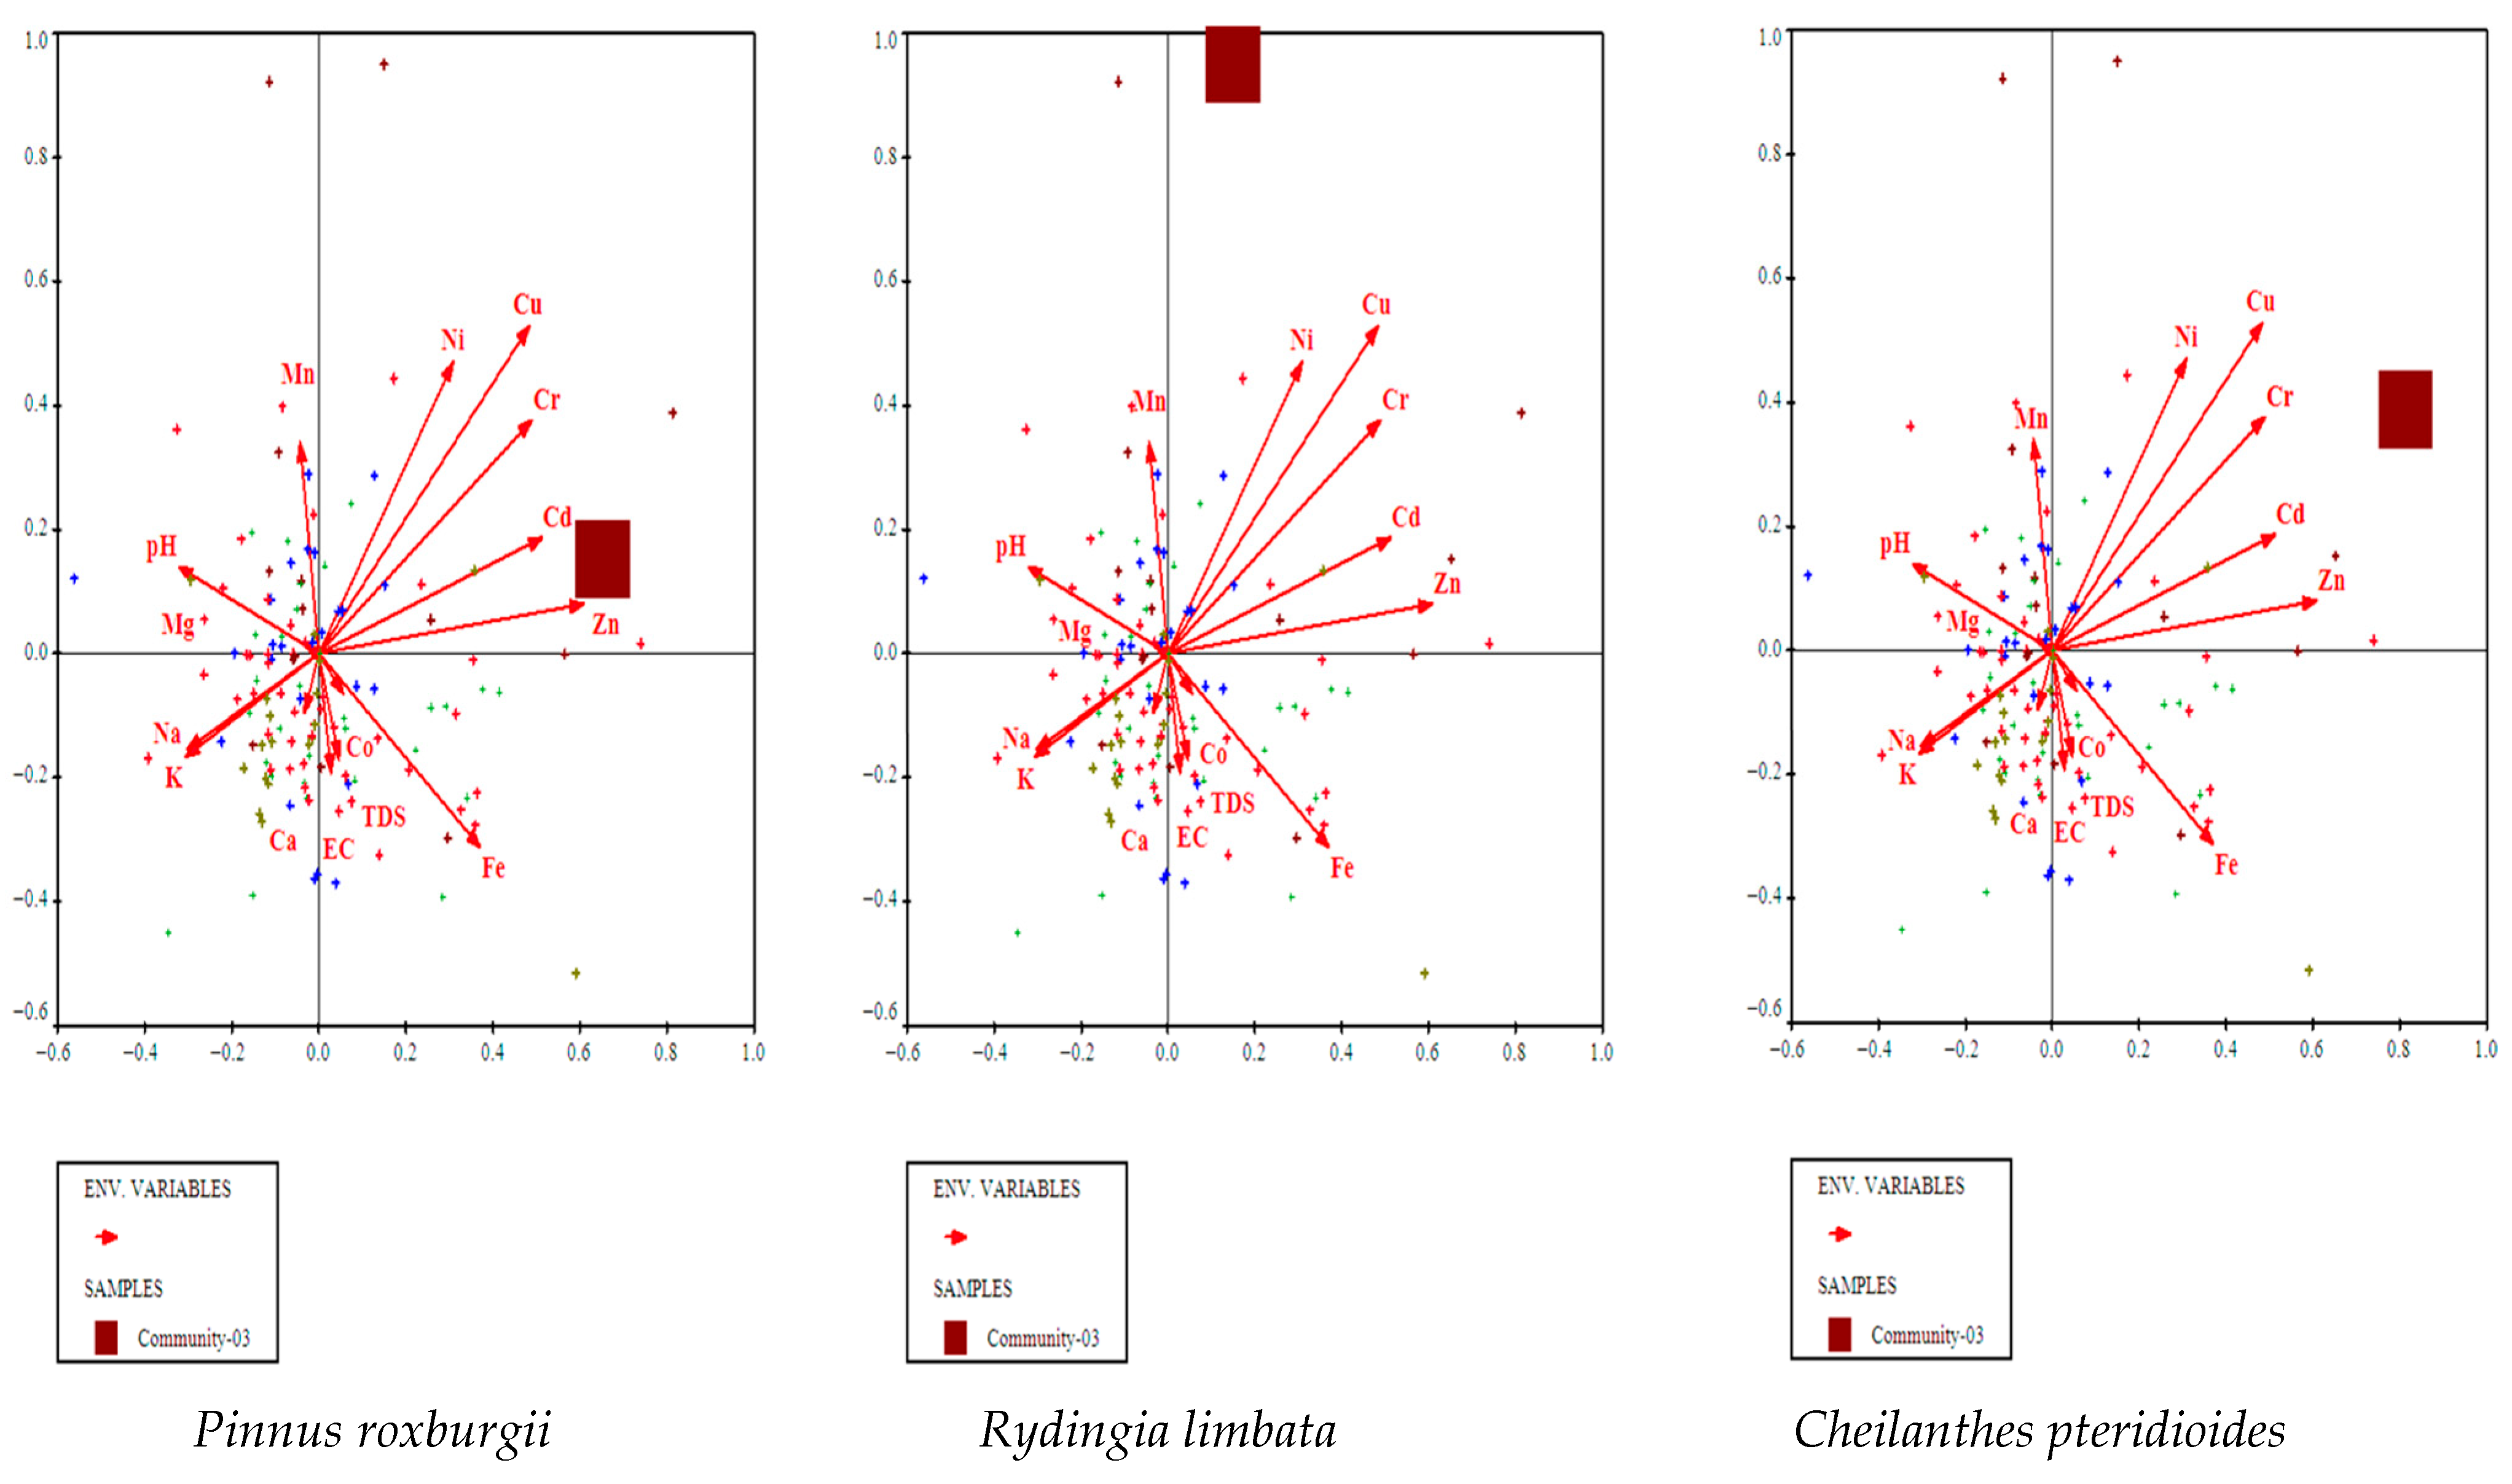
This community comprises a total of fifteen quadrats. The top three indicator species of this community are Pinus roxburghii (37.71914), Rydingia limbata (27.30613), and Chleilanthes pteridioides (3.137635) (Figure 7). These are the indicators of higher Cr, Cu, Zn, and TDS Table 3. Other indicator species of this community are Daphne mucronata, Micromeria biflora, Taraxacum officinale, Juncus sp., Chrysopogon serrulatus, Leonurus cardiaca, Galium aparine, Typha domingensis, Plantago lanceolata, Mentha royleana, Koeleria macrantha, Dodonaea viscosa, Sonchus wightianus, and Eryngium billardieri, and Silene apetala, Salix tetrasperma, Senegalia modesta, Pinus roxburghii, Ailanthus altissima, and Quercus incana are the dominant tree species of the third community having low IVI, while Olea ferruginea, Populus ciliata, Zizphus nummularia, Melia azedarach, and Sideroxylon mascatens are rare species having low IVI. Ricinus communis, Dodonaea viscosa, Gymnosporia royleana, Rydingia limbate, and Daphne mucronata are the most dominant species, while the rare shrub species of this community are Isodon rugosus, Zanthoxylum armatum, Rosa multiflora, Justicia adhatoda, and Rubus ulmifolius. The dominant herb species are Cynodon dactylon, Bromus japonicus, Oxalis corniculata, Micromeria biflora, and Saccharum bengalense, while Rorippa islandica, Vicia faba, Saccharum spontaneum, Ranunculus arvensis, and Sisymbrium irio are the rare herb species of this community having low IVI.
There were ranges of the different edaphic variables, such as pH 7.74 to 9.39, which showed the alkaline properties; electrical conductivity (18.5 to 121 ppm), total dissolved solids (TDSs) (19 to 154 ppm), K (−0.0589 to 1.2189), Mg (3.963 to 9.838), Ca (0.062 to 0.629), Na (0.0013 to 0.5643), Fe (0.138 to 1.678), Zn (0.1795 to 1.035), Cd (0.1795 to 1.035), Cu (0.173 to 0.766), Cr (0.042 to 0.642), Co (1.341 to 4.171), Ni (1.667 to 2.407), and Mn (2.532 to 9.85) mg/L.

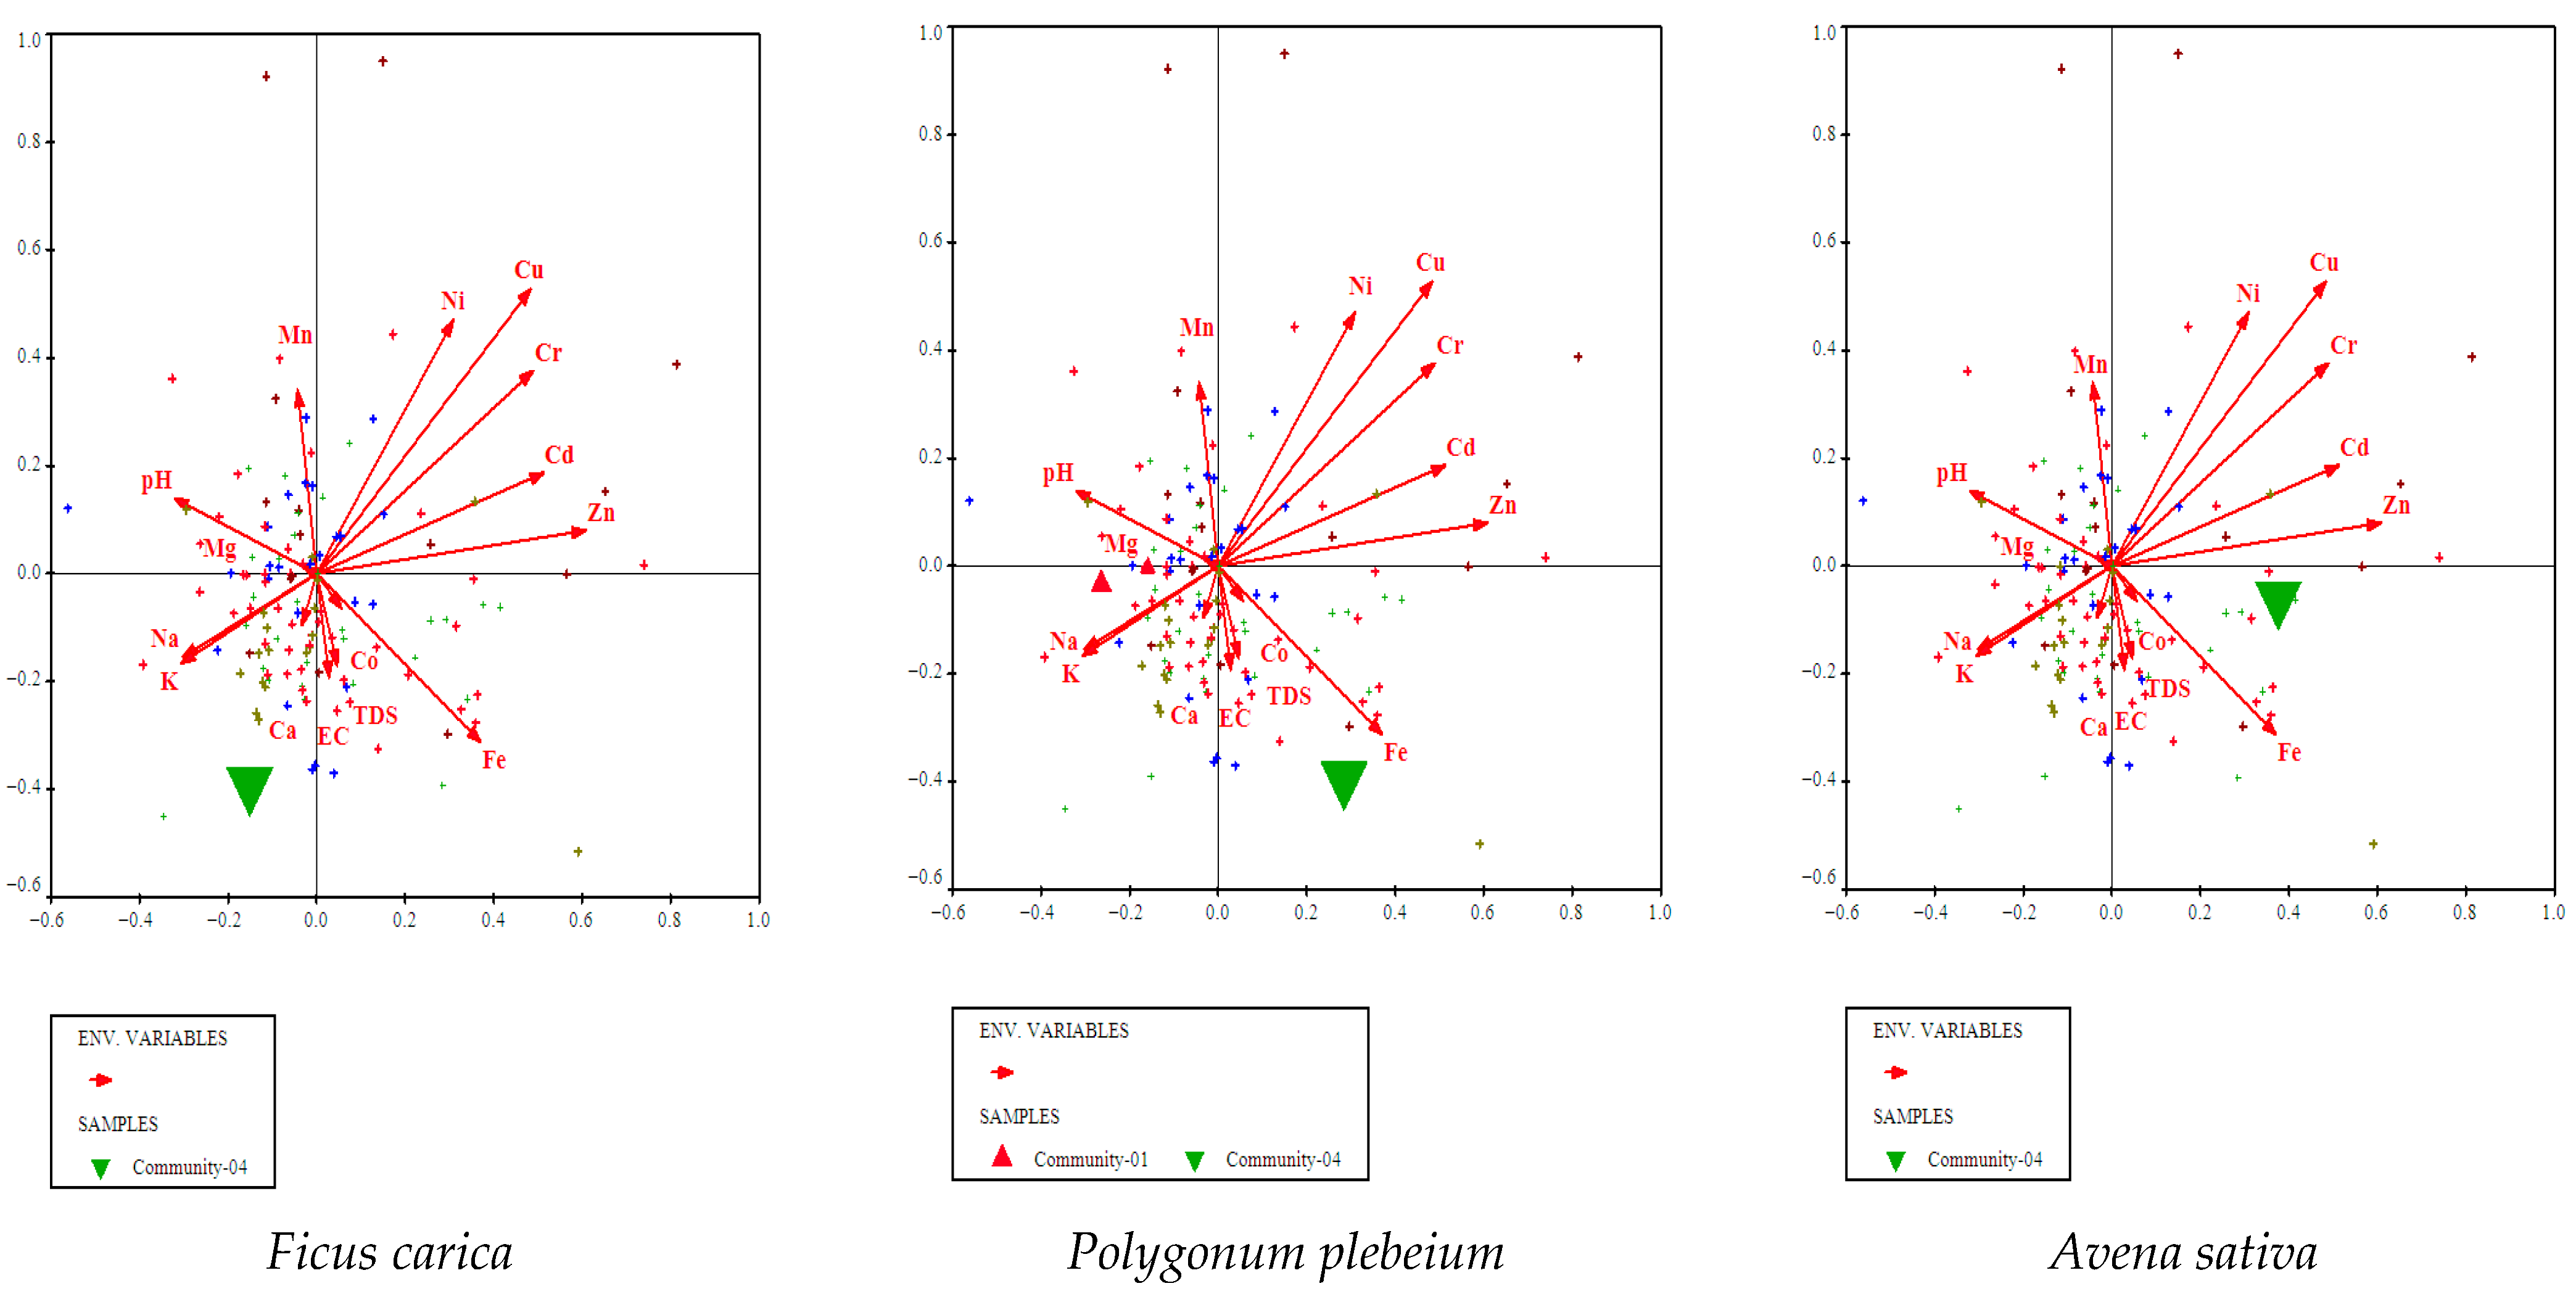
3.4.4. Ficus carica, Polygonum plebeium, and Avena sativa Community

The fourth community comprises a total of thirty-one quadrats. The top indicator species of this community are Ficus carica (5.209826), Polygonum plebeium (1.255054), and Avena sativa (0.354210) (Figure 8). These are indicators of higher Na, K, and Fe (Table 4). Other species of this community are Stellaria media, Veronica anagallis-aquatica, Morus alba, Chenopodium album, Arenaria serpyllifolia, Coronopus didymus, Fumaria indica, and Zeuxine strateumatica. Populus nigra, Robinia pseudoacacia, Morus alba, Populus ciliata, and Salix tetrasperma are the most dominant tree species having high IVI, while the Ficus palmate, Eucalyptus camaldulensis, Morus nigra, Platanus orientalis, and Ficus carica are the rare tree species of this community. Shrubs Nerium oleander and Debregeasia saenab are the dominant shrubs, while Rubus ulmifolius is the rare species with low IVI. Nasturtium officinale, Cannabis sativa, Cynodon dactylon, Juncus sp, and Poa bulbosa are dominant herb species having high IVI, while Salvia plebeian, Vicia sativa, Trifolium pratense, Rumex dentatus, and Trifolium resupinatum are rare herb species.
The pH of soil ranges from 7.69 to 9.21, electrical conductivity (EC) 9.95 to 831, total dissolved solids (TDSs) (12 to 961 ppm), K (0.0569 to 1.3337), Mg (2.5012 to 9.6366), Ca (0.033 to 0.792), Na (0.0072 to 5.7569), Fe (0.0079 to 1.5), Zn (0.22 to 1.2755), Cd (0.206 to 0.35), Cu (0.19 to 0.695), Cr (0.001 to 0.423), Co (1.316 to 2.229), Ni (1.703 to 2.523), and Mn (1.527 to 9.641) mg/L.

3.4.5. Ficus palmata, Rosa multiflora, and Heliotropium europaeum Community

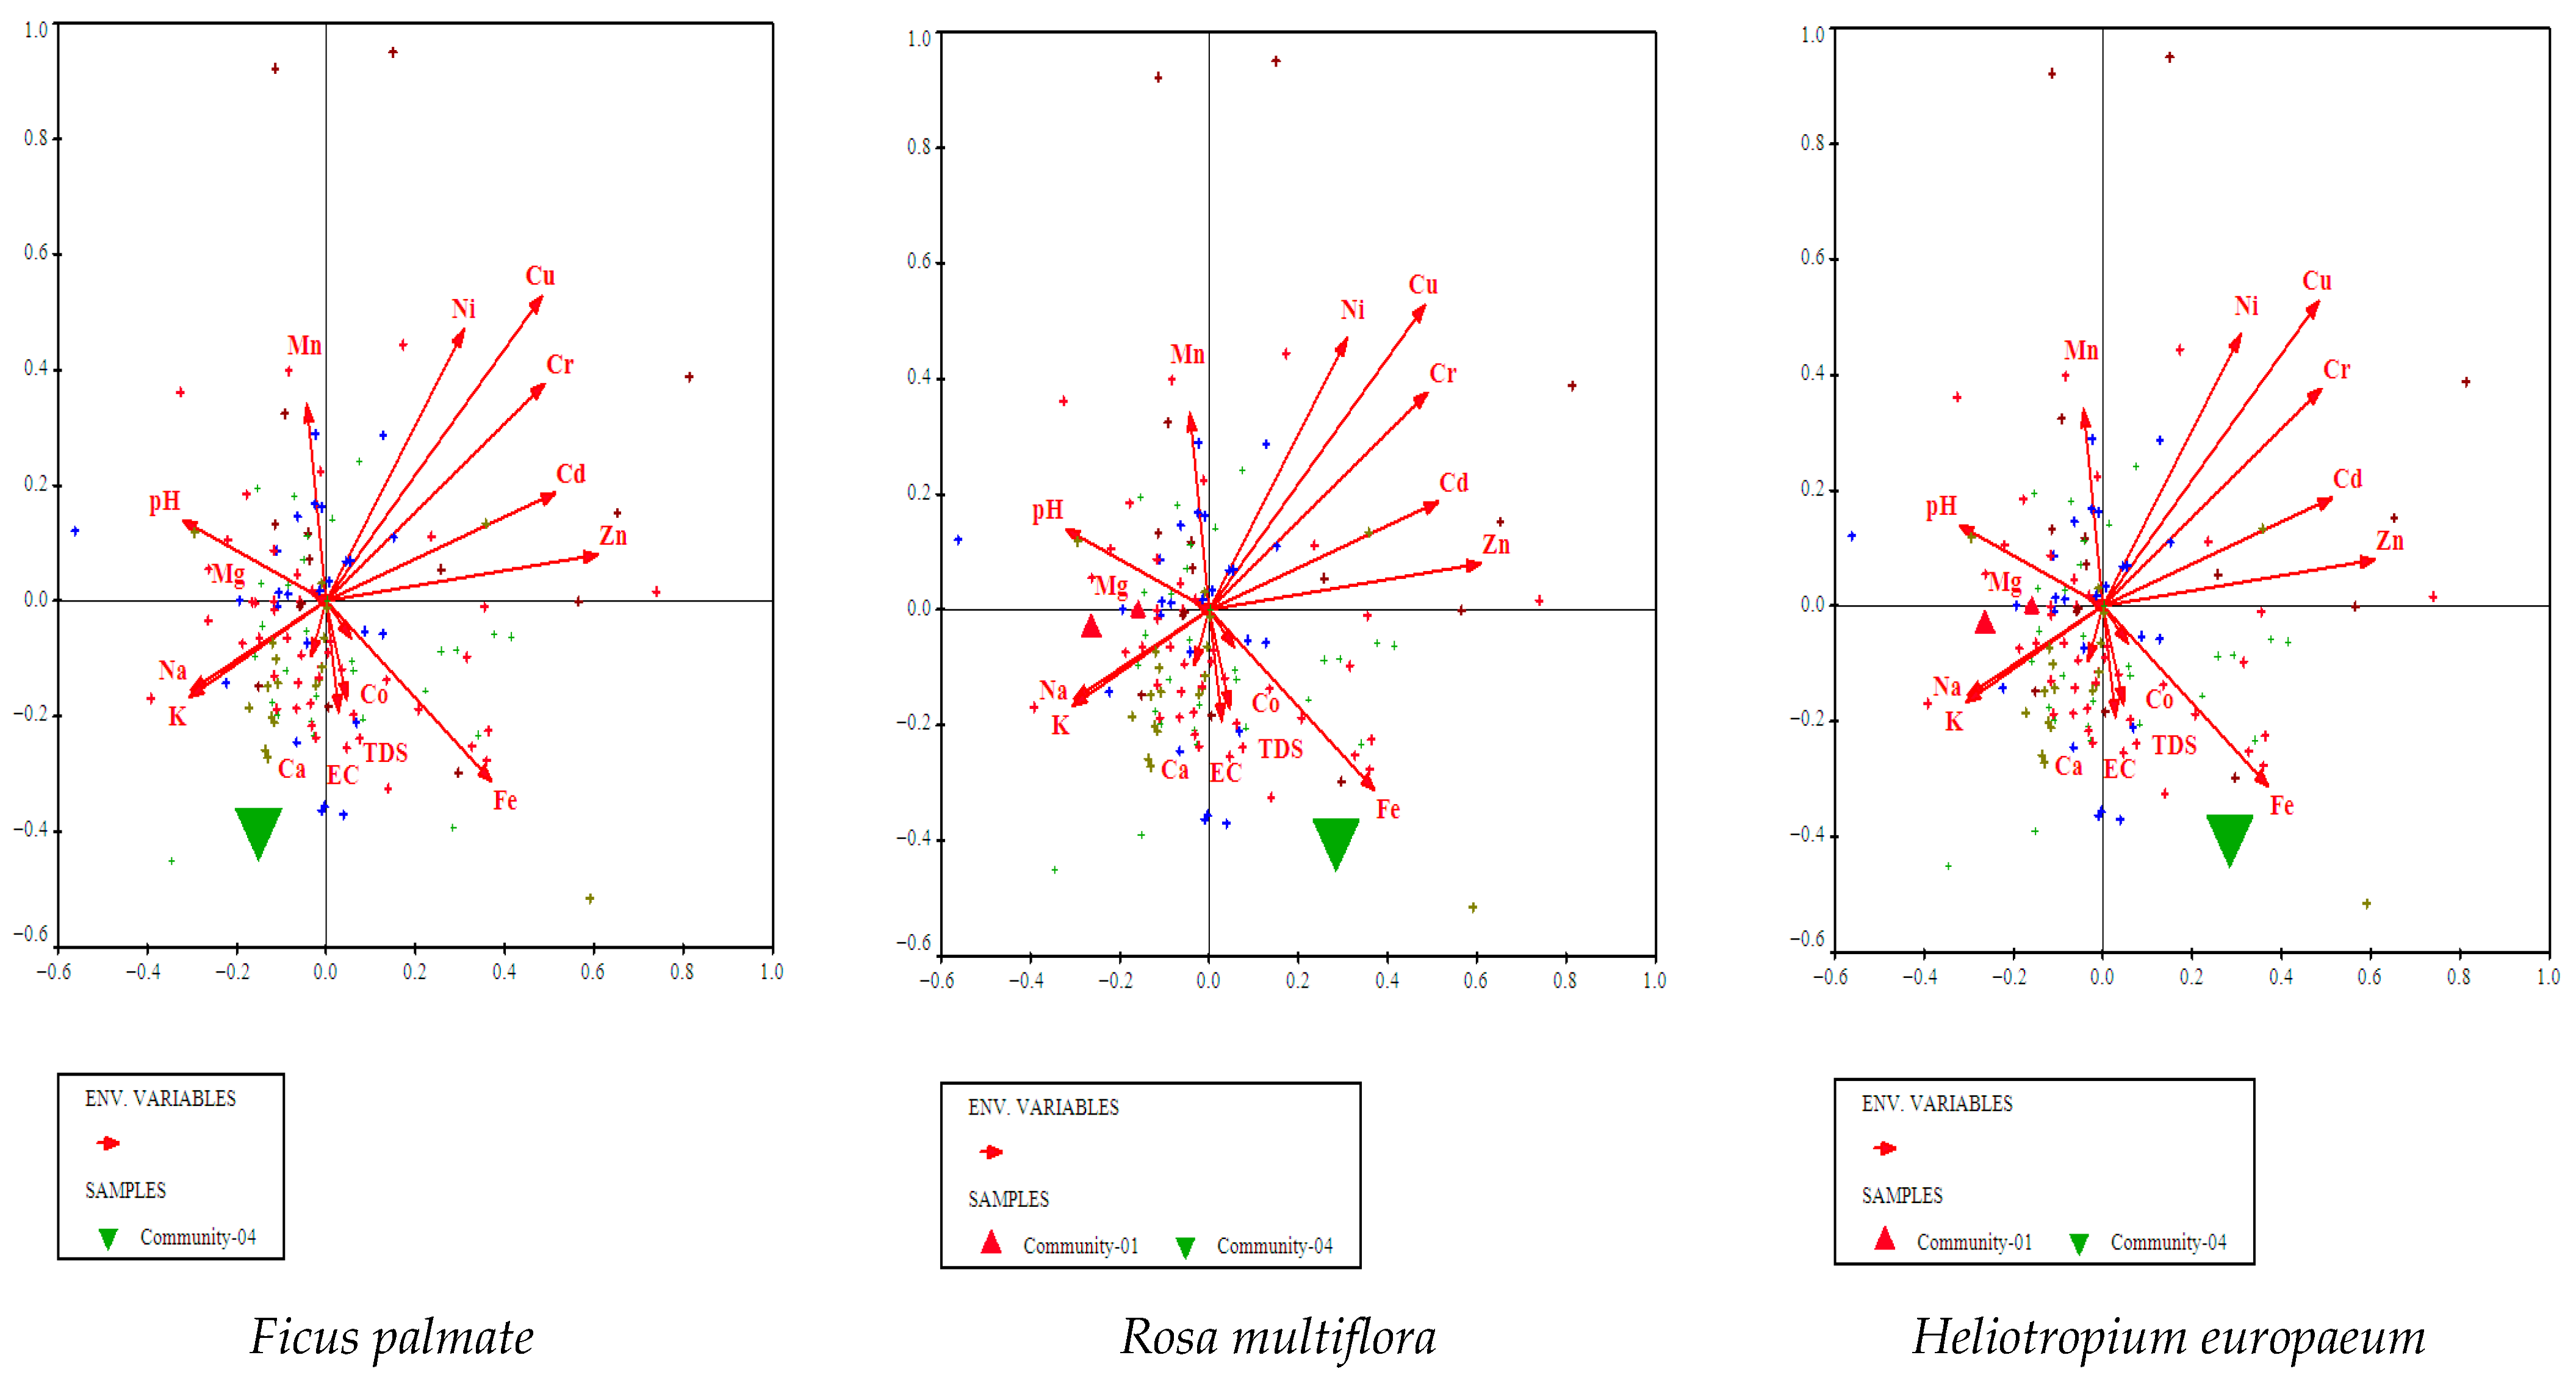
This community consists of a total of twenty-five quadrats. The top three indicator species of this community are Ficus palmate (40.74084), Rosa multiflora (27.30613), and Heliotropium europaeum (0.627527) (Figure 9). These are the indicators of higher pH, and Mn (Table 5). Morus nigra, Polypogon viridis, Urtica dioica, Senegalia modesta, Tithonia sp., Isatis costata, Vinca major, Saccharum spontaneum, Cirsium arvense, and Nonea caspica are the other indicator species of this community.
These are the indicators of higher pH, and Mn Table 5. Morus nigra, Polypogon viridis, Urtica dioica, Senegalia modesta, Tithonia sp., Isatis costata, Vinca major, Saccharum spontaneum, Cirsium arvense, and Nonea caspica are the other indicator species of this community. Populus nigra, Ficus palmate, and Salix tetrasperma are the dominant tree species having high IVI, while Senegalia modesta and Morus alba are the rare tree species having low IVI for this community. The dominant shrub species are Justica adhatoda and Nerium oleander, while the rare shrub species is Rosa multiflora. In the case of herbaceous plant species, the Cynodon dactylon, Mentha longifolia, Marsilea quadrifolia, Nasturtium officinale, and Typha domingensis are dominant species, while rare herb species of this community are Polypogon viridis, Vicia faba, Spinacia oleracea, Parietaria lusitanica, and Sonchus arvensis.
The soil pH ranges from (7.14 to 9.28), showing basic properties of the soil. The electrical conductivity (EC) is (26.3 to 117), total dissolved solids (TDSs) (29 to 130), K (0.204 to 2.808), Mg (3.8678 to 9.9742), Ca (0.036 to 0.537), Na (0.0253 to 0.9158), Fe (0.092 to 1.443), Zn (0.195 to 0.7342), Cd (0.207 to 0.307), Cu (0.171 to 0.442), Cr (0.027 to 0.523), Co (1.399 to 2.259), Ni (1.718 to 2.629), and Mn (11.904 to 9.657) mg/L.

3.5. Environmental Gradients

3.5.1. CCA Identifies Key Soil Drivers of Vegetation Composition

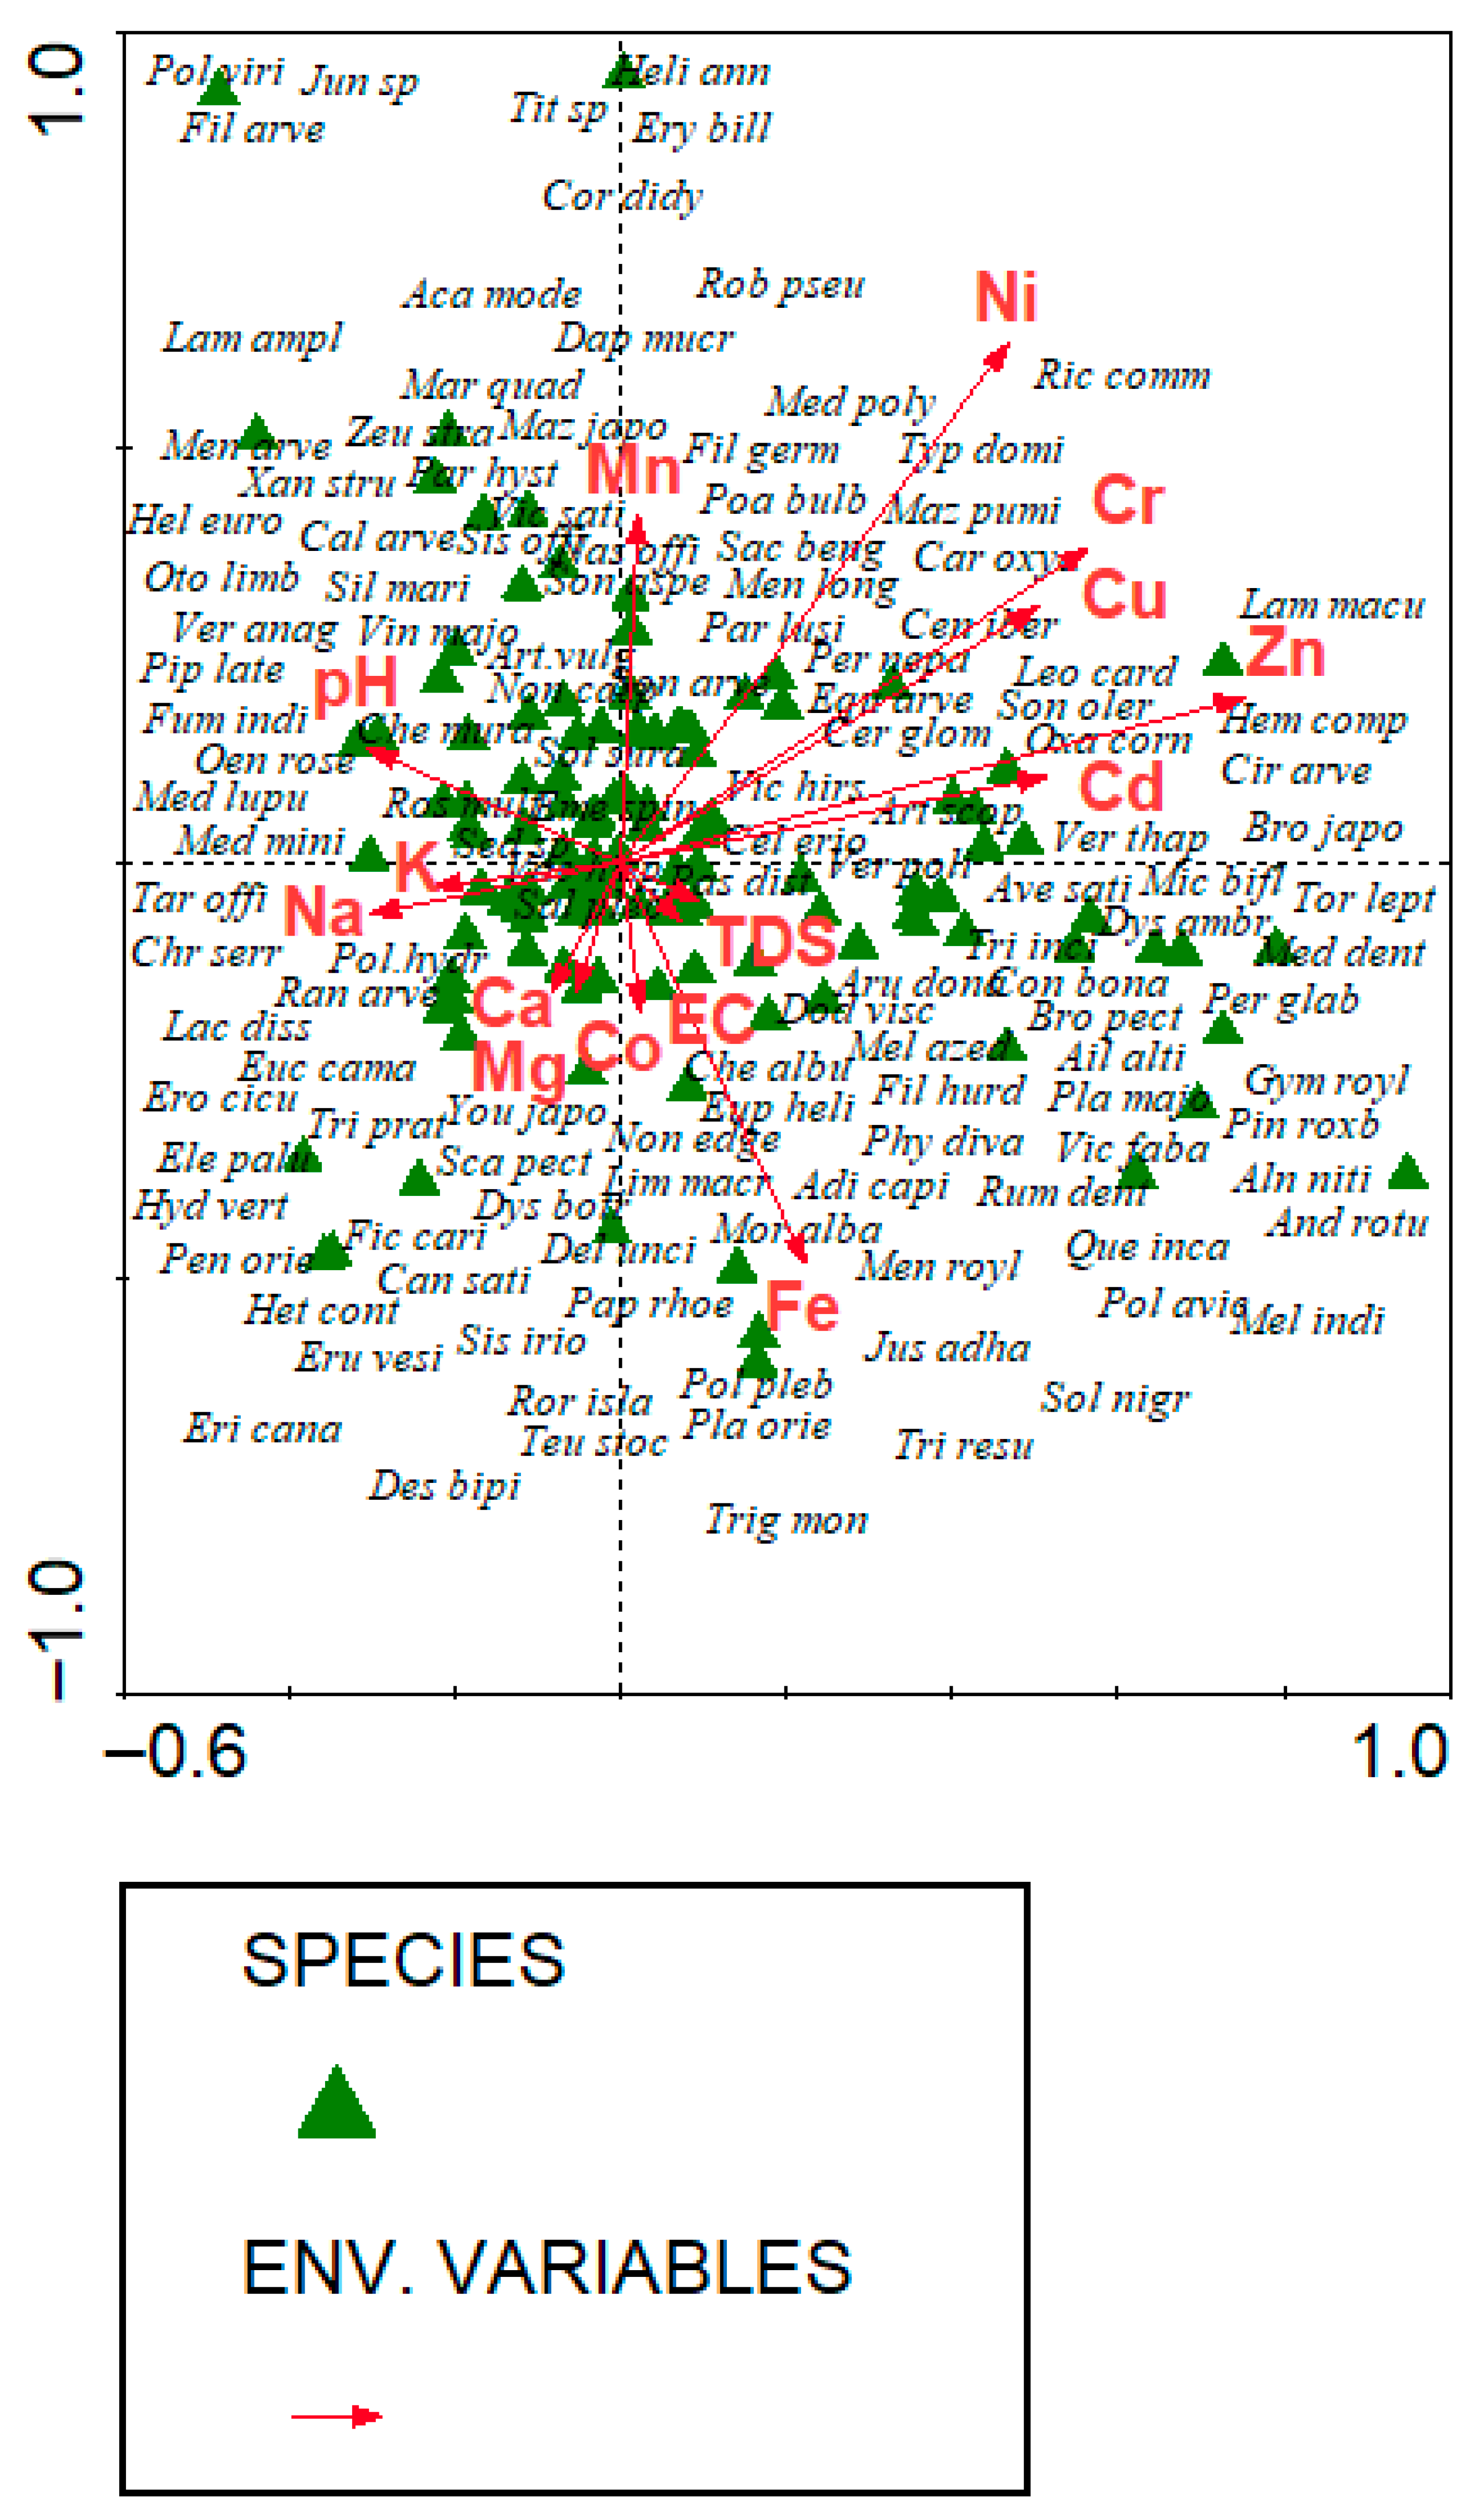
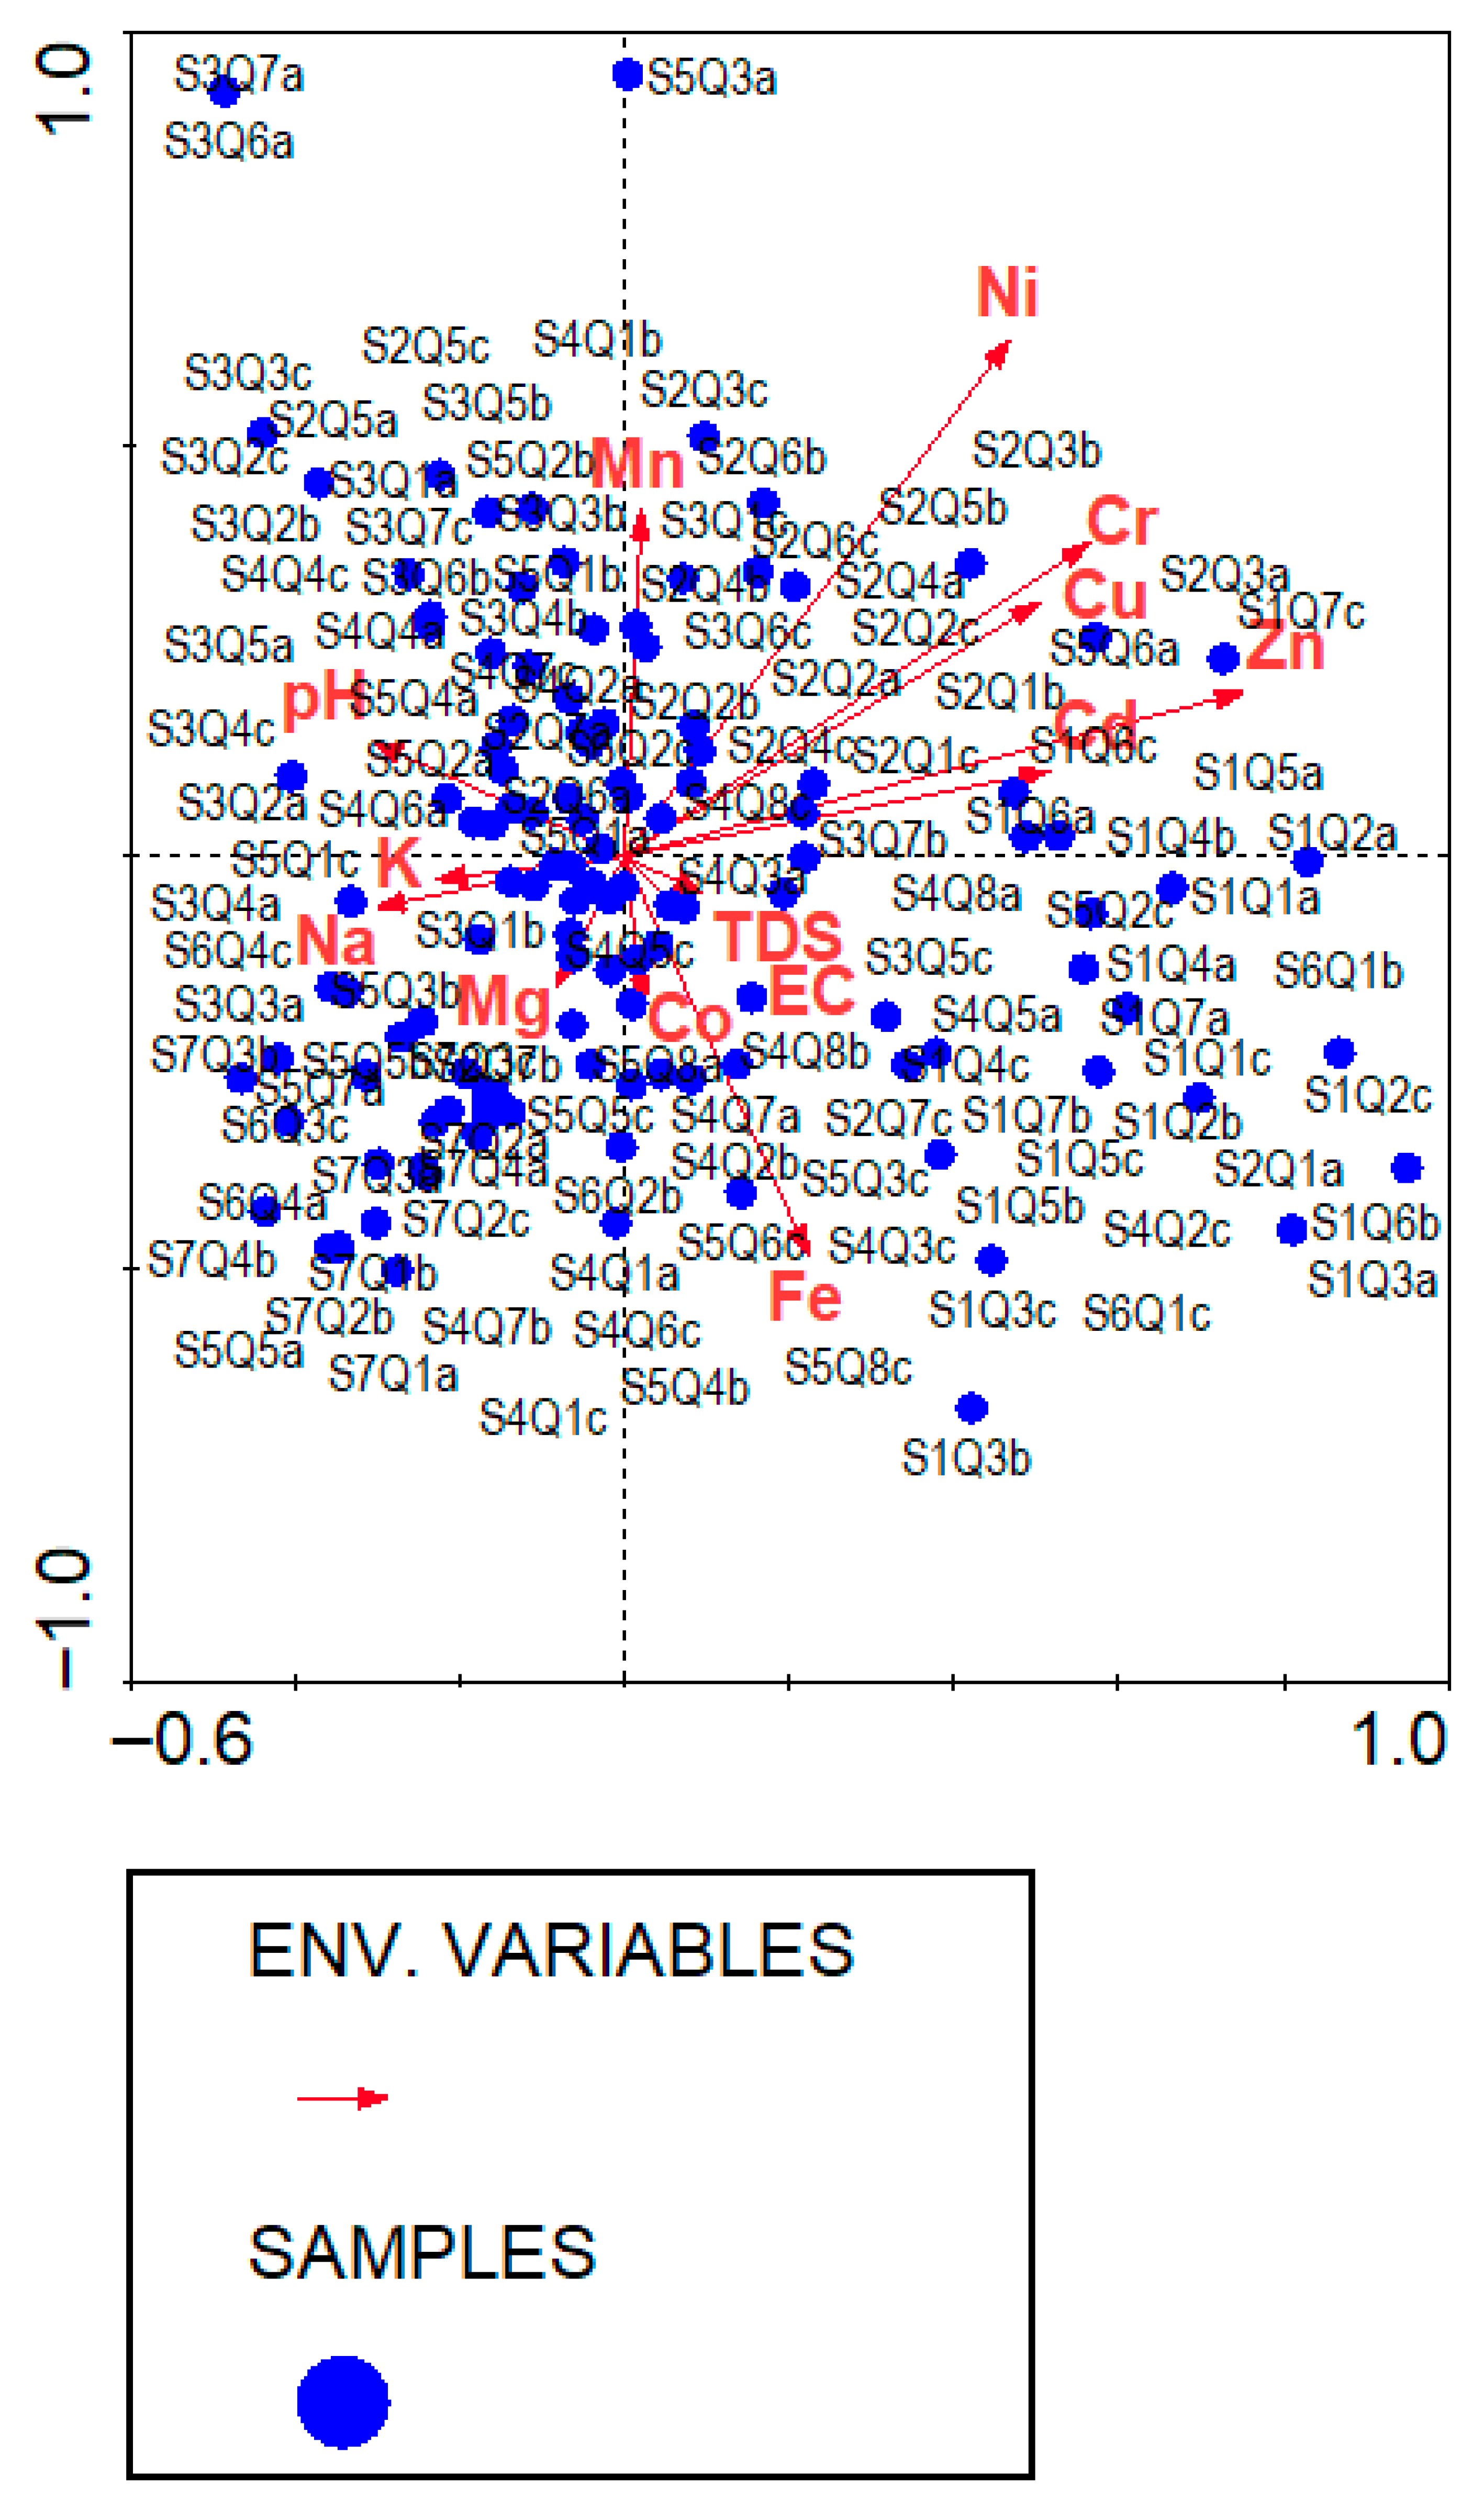
Canonical correspondence analysis (CCA) shows the distribution of plant species with different environmental variables such as pH, electric conductivity (EC), total dissolved solids (TDSs), K, Mg, Ca, Na, Fe, Zn, Cd, Cu, Cr, Co, Ni, and Mn. The first quadrant of canonical correspondence analysis shows that lower K and Na and higher Ni, Cu, Cd, and Zn influence most stations. In contrast, the second quadrant revealed that more stations were clustered under the environmental variables’ pH and Mg. The third quadrant shows most of the impact of Na and K, while the 4th quadrant shows a higher concentration of Fe and Co (Figure 10 and Figure 11).
To assess the impact of environmental variables on vegetation composition, canonical correspondence analysis (CCA) was performed using CANOCO v4.5. Figure 10 displays the biplot of species and environmental variables. The arrows’ length and direction indicate each environmental factor’s strength and gradient. Moreover, metals such as copper (Cu), cadmium (Cd), chromium (Cr), nickel (Ni), and manganese (Mn) show strong positive relationships with Axis 1 and Axis 2. This indicates higher concentrations of these metals along those axes, affecting the grouping of species tolerant to metal stress in that direction. Similarly, pH and sodium (Na) gradients seem to go in opposite directions, suggesting different species’ preferences based on soil alkalinity or salinity. The clear distinction of plant communities based on these environmental factors emphasizes the significance of soil chemical properties, especially metal contamination, salinity, and pH, in determining species distribution and community structure (Figure 10). The summary of the canonical correspondence analysis were shown in the Table 6.

3.5.2. DCA Reveals Species Turnover Across Elevation and Soil Gradients

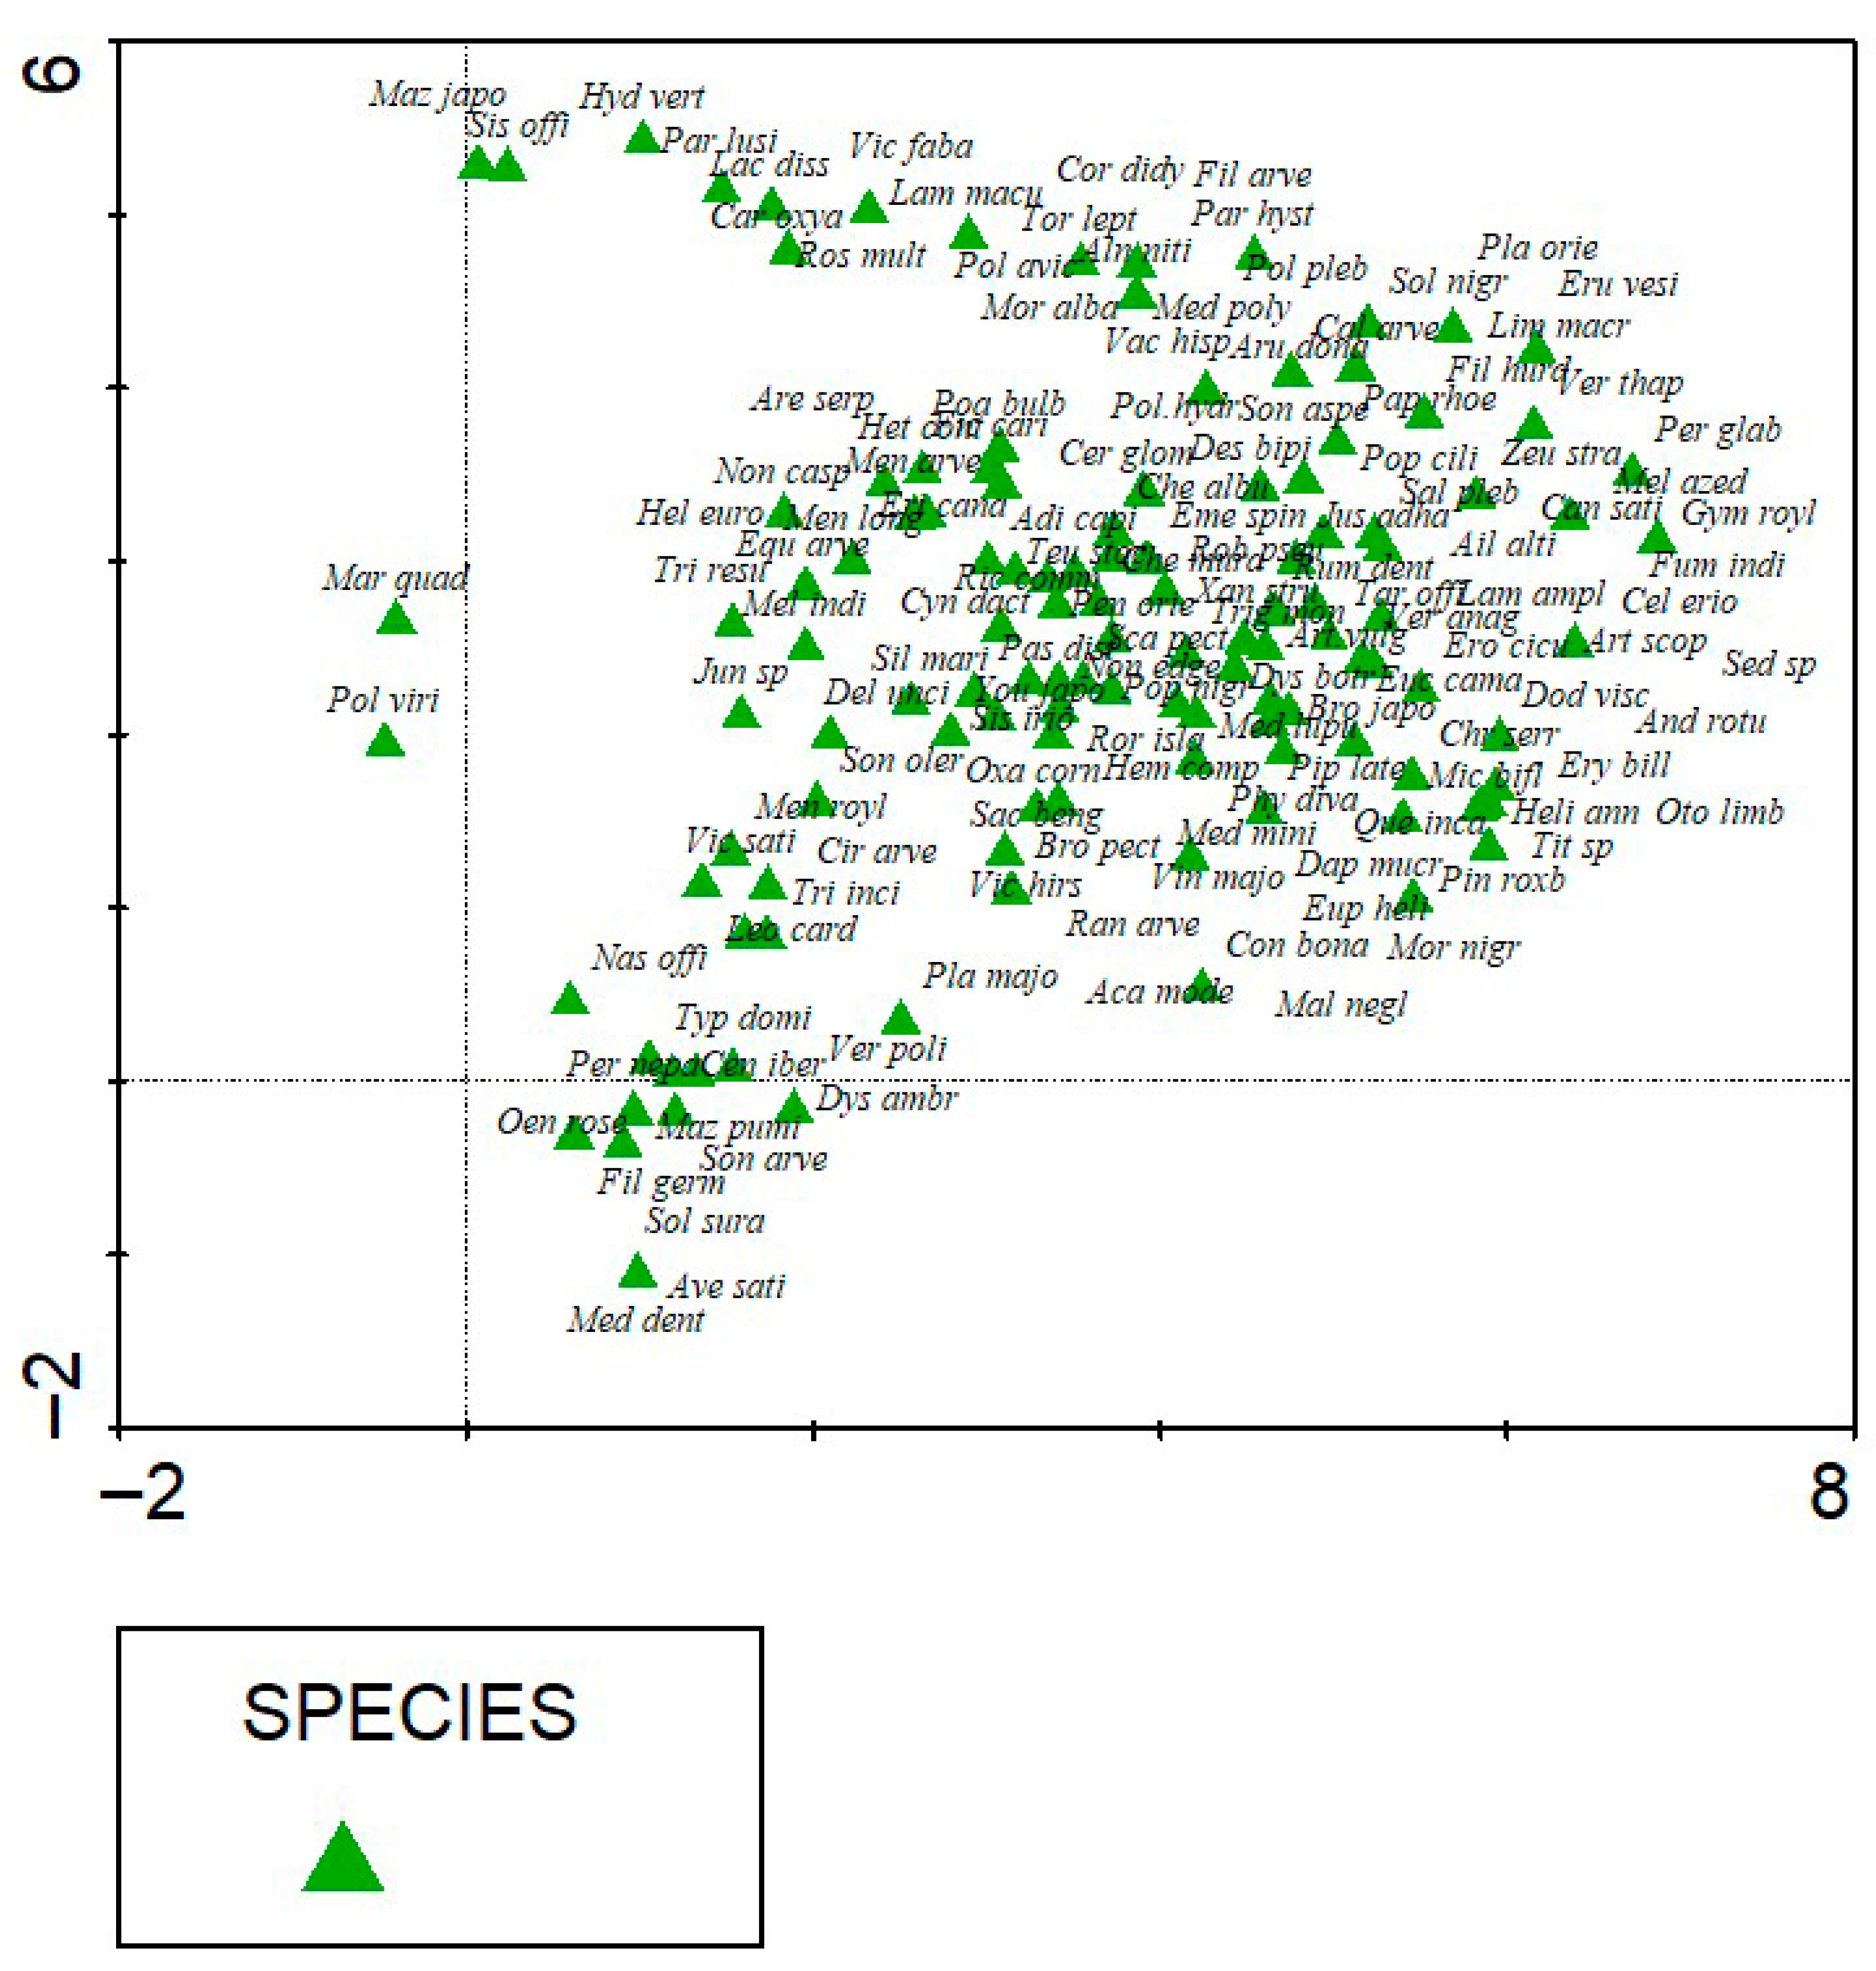
We determined the distribution pattern of 216 plant species in 135 quadrats (Figure 11 and Figure 12) while (Figure 13) shows the distribution of 135 quradats in the study area. The maximum gradient length recorded was 6.443, with an eigenvalue of 0.742. The second axis’s length gradient was recorded as 5.222, and its eigenvalue was 0.662. The axis length of the third gradient was 4.053, and its eigenvalue was 0.6. The maximum length gradient recorded for the fourth axis was 4.791, and its eigenvalue was 0.464 (Table 7).

4. Discussion

Modern vegetation ecology has revealed the complexity of plant community structures, especially with the development of advanced analytical tools and multivariate techniques that can uncover hidden ecological patterns [28,29]. Many contributions to vegetation science have demonstrated that interpreting plant community structures across diverse landscapes is challenging, but advances in statistical methods such as TWINSPAN, CCA, and DCA [26,30] have greatly improved understanding. PC-ORD and CANOCO are crucial for transforming complex ecological data into understandable formats like dendrograms and ordination plots. They provide some of the simplest and most effective ways to understand intricate community patterns [31]. In our study, multivariate analyses proved effective for classifying riparian vegetation and assessing its responses to environmental gradients, especially those involving soil and topographical variables. This aligns with global applications of such techniques in vegetation classification, though comprehensive studies are still rare in Pakistan [32]. The influence of ecological gradients on plant species distribution and composition was examined using these statistical tools, providing insights into how abiotic and biotic factors shape vegetation [33]. Our findings report that 216 plant species are distributed across five plant communities along the riparian zone of the River Panjkora. These species belong to 67 families and 163 genera, with herbs (178 species) being the most prevalent life form, followed by trees (24 species) and shrubs (14 species). The dominance of herbs indicates their ecological adaptability in riparian systems often exposed to disturbances like floods. The formation of these communities is influenced by various ecological factors, including soil pH, texture, electrical conductivity, nutrient levels (such as organic matter, phosphorus, and potassium), and topography. Previous research by Shuaib et al. [4] and others in Dir Lower also documented similar life-form patterns in riparian areas, with Asteraceae and Poaceae emerging as the most dominant families [34]. The ecological success of Asteraceae is likely due to their lightweight seeds that disperse easily and their inflorescence structure (capitulum), which enhances reproductive efficiency. The presence and abundance of certain species were linked to specific ecological optima that vary across microhabitats—a pattern also observed by [16,17]. Our results also align with [30], which identified four communities in which five community types were documented in the Thandiani forest. Similarly, in the alpine ecosystems of Manoor Valley, distinct community types are organized along elevation and soil gradients, demonstrating a comparable ecological pattern across different biomes. These findings collectively highlight that ecological gradients are key in shaping vegetation composition in riparian and alpine systems. Indicator species analysis for our study area identified representative species for each of the five riparian communities. Community 1 includes Melia azedarach, Punica granatum, and Asparagus racemosus; Community 2 features Populus alba, Debregeasia saeneb, and Youngia japonica; and Community 3 contains Pinus roxburghii, Rydingia limbata, and Cheilanthes pteridioides. Additionally, in Community 4, indicator species are Ficus carica, Polygonum plebeium, and Avena sativa. Ficus palmata, Rosa multiflora, and Heliotropium europaeum serve as indicators for Community 5. Like those in the alpine zones, these plant communities are influenced by soil factors, climate, topography, and altitude, affecting species diversity and abundance [35]. High IVI values, such as with Populus alba (674.04) and Morus alba (668.52), reflect their dominance and ecological significance in the riparian corridor. Conversely, species like Ziziphus nummularia and Vinca major exhibited low IVI values, indicating rarity. In community ecology, ordination techniques like DCA and CCA help identify ecological gradients and reveal correlations between species composition and environmental variables. As evidenced in alpine zones, our CCA ordination plots showed significant associations (p < 0.05) between species composition and factors such as elevation, pH, EC, TDSs, and key nutrients like Mg, Ca, Zn, and Cu. These results emphasize that both macro- and micro-environmental gradients influence riparian vegetation patterns. A study by [36] found similar results, where plants were grouped based on edaphic factors such as calcifuge and calcicole conditions, which affect species distribution, regeneration, and ground cover. Environmental changes, whether caused by climate shifts or human activities, alter species composition, modify competitive interactions, and impact community resilience. These changes are driven by variations in traits, physiological adaptations, and feedback mechanisms [34], underscoring the importance of understanding plant–environment interactions for conservation. Our study demonstrates that indicator species are valuable ecological classification and environmental assessment tools. As shown in alpine and riparian systems, species with strong ecological fidelity help define plant community boundaries and reflect underlying environmental heterogeneity [19].
This study mainly examined soil physico-chemical properties, but the limited explanatory power of the CCA suggests that other factors, such as topography, microclimate, hydrology, and human disturbance, may also play important roles. Future research should include these variables and adopt broader modeling approaches to better understand the complex factors driving vegetation communities.

5. Conclusions

Abiotic factors such as electrical conductivity (EC), total dissolved solids (TDSs), pH, potassium (K), magnesium (Mg), copper (Cu), chromium (Cr), cobalt (Co), nickel (Ni), manganese (Mn), calcium (Ca), cadmium (Cd), iron (Fe), zinc (Zn), and sodium (Na) show the significant effect on the distribution and composition of plant species, along with community formation and their indicator species, which are responsible for hosting diverse plant communities along the banks of River Panjkora in the Hindukush Range in Pakistan. The process of indicator species analysis can be used to conserve species and habitats.

Author Contributions

S.A.Z.: Data collection and writing of the main manuscript. S.M.K.: Supervision and research design. A.A.: Review and editing of the manuscript. Z.A.: Assistance in data analysis. T.A.Z.: Assistance with data collection. All authors have read and agreed to the published version of the manuscript.

Funding

We have here by acknowledge the Quaid-i-Azam University research fund URF for field work and data analysis.

Acknowledgments

We sincerely appreciate the Plant Ecology and Conservation Lab, Quaid-i-Azam University, Islamabad, for providing the necessary facilities and offering support throughout this study.

Conflicts of Interest

The authors declare no conflicts of interest.

References

  1. Singh, R.; Tiwari, A.; Singh, G. Managing riparian zones for river health improvement: An integrated approach. Landsc. Ecol. Eng. 2021, 17, 195–223. [Google Scholar] [CrossRef]
  2. Patowary, S.; Debnath, M.; Sarma, A.K. Best Management Practices in Stream: Debris and Runoff Reduction, Riparian Buffers and Plantings, and Stabilizing Stream Banks. In Hydrosystem Restoration Handbook; Elsevier: Amsterdam, The Netherlands, 2025; pp. 73–82. [Google Scholar]
  3. Beugnon, R.; Le Guyader, N.; Milcu, A.; Lenoir, J.; Puissant, J.; Morin, X.; Hättenschwiler, S. Microclimate modulation: An overlooked mechanism influencing the impact of plant diversity on ecosystem functioning. Glob. Change Biol. 2024, 30, e17214. [Google Scholar] [CrossRef]
  4. Shuaib, M.; Ali, K.; Ahmed, S.; Hussain, F.; Ilyas, M.; Hassan, N.; Khan, I.; Hussain, F. Impact of rapid urbanization on the floral diversity and agriculture land of district Dir, Pakistan. Acta Ecol. Sin. 2018, 38, 394–400. [Google Scholar] [CrossRef]
  5. Lindenmayer, D.B. Future directions for biodiversity conservation in managed forests: Indicator species, impact studies and monitoring programs. For. Ecol. Manag. 1999, 115, 277–287. [Google Scholar] [CrossRef]
  6. Shaheen, H.; Awan, S.N.; Aziz, S. Distribution pattern, conservation status, and associated flora of the genus Juniperus in subalpine pastures of the Kashmir Himalayas. Mt. Res. Dev. 2017, 37, 487–493. [Google Scholar] [CrossRef]
  7. Paudel, P.K.; Sipos, J.; Brodie, J.F. Threatened species richness along a Himalayan elevational gradient: Quantifying the influences of human population density, range size, and geometric constraints. BMC Ecol. 2018, 18, 6. [Google Scholar] [CrossRef]
  8. Brown, L.; Bezuidenhout, H. The vegetation of the farms Ingleside and Welgedacht of the Mountain Zebra National Park, Eastern Cape. Koedoe 2005, 48, 23–42. [Google Scholar] [CrossRef]
  9. Cleaver, G.; Brown, L.; Bredenkamp, G. The phytosociology of the Vermaaks, Marnewicks and Buffelsklip valleys of the Kammanassie Nature Reserve, Western Cape. Koedoe 2023, 48, 1–16. [Google Scholar] [CrossRef]
  10. Juárez–Fragoso, M.A.; Perroni, Y.; Dáttilo, W.; Gómez–Díaz, J.A.; Guevara, R. The landscape scale of effect on the alpha and beta diversities of woody species in a semideciduous tropical forest. Landsc. Ecol. 2024, 39, 33. [Google Scholar] [CrossRef]
  11. Tavili, A.; Jafari, M. Interrelations between plants and environmental variables. Int. J. Environ. Res. 2009, 3, 24981578. [Google Scholar]
  12. Rahman, A.U.; Khan, S.M.; Khan, S.; Hussain, A.; Rahman, I.U.; Iqbal, Z.; Ijaz, F. Ecological assessment of plant communities and associated edaphic and topographic variables in the Peochar Valley of the Hindu Kush mountains. Mt. Res. Dev. 2016, 36, 332–341. [Google Scholar] [CrossRef]
  13. Parmesan, C.; Burrows, M.T.; Duarte, C.M.; Poloczanska, E.S.; Richardson, A.J.; Schoeman, D.S.; Singer, M.C. Beyond climate change attribution in conservation and ecological research. Ecol. Lett. 2013, 16, 58–71. [Google Scholar] [CrossRef]
  14. Box, E.O.; Fujiwara, K. Vegetation Types and Their Broad-Scale Distribution. In Vegetation Ecology; Wiley: Hoboken, NJ, USA, 2013; pp. 455–485. [Google Scholar]
  15. Suding, K.N.; Lavorel, S.; Chapin Iii, F.; Cornelissen, J.H.; DIAz, S.; Garnier, E.; Goldberg, D.; Hooper, D.U.; Jackson, S.T.; Navas, M.L. Scaling environmental change through the community-level: A trait-based response-and-effect framework for plants. Glob. Change Biol. 2008, 14, 1125–1140. [Google Scholar] [CrossRef]
  16. Gauthray-Guyénet, V.; Schneider, R.; Paré, D.; Achim, A.; Loi, C.; Sirois, L. Influence of shifts over an 80-year period in forest composition on soil properties. Plant Soil 2018, 433, 111–125. [Google Scholar] [CrossRef]
  17. Smith, M.E.; Facelli, J.M.; Cavagnaro, T.R. Interactions between soil properties, soil microbes and plants in remnant-grassland and old-field areas: A reciprocal transplant approach. Plant Soil 2018, 433, 127–145. [Google Scholar] [CrossRef]
  18. Zeb, S.A.; Khan, S.M.; Ahmad, Z.; Abdullah. Phytogeographic elements and vegetation along the river Panjkora-Classification and ordination studies from the Hindu Kush Mountains range. Bot. Rev. 2021, 87, 518–542. [Google Scholar] [CrossRef]
  19. Dufrêne, M.; Legendre, P. Species assemblages and indicator species: The need for a flexible asymmetrical approach. Ecol. Monogr. 1997, 67, 345–366. [Google Scholar] [CrossRef]
  20. Hu, A.; Wang, J.; Sun, H.; Niu, B.; Si, G.; Wang, J.; Yeh, C.-F.; Zhu, X.; Lu, X.; Zhou, J. Mountain biodiversity and ecosystem functions: Interplay between geology and contemporary environments. ISME J. 2020, 14, 931–944. [Google Scholar] [CrossRef]
  21. Hussain, J.; Khan, S.M.; Khan, M.S.; Saqib, Z.; Ahmad, Z.; Shah, M.; Mohammad, N.; Batool, Z.; Sohail, A.; Liu, J. Distribution modelling and future prediction of a threatened species-Heracleum candicans Wall. ex DC.; Within the framework of biotic and abiotic interactions. J. Environ. Manag. 2025, 387, 125818. [Google Scholar] [CrossRef]
  22. Khan, M.S.; Khan, S.M.; Abdullah Liu, J.; Wu, Z.Y.; Hussain, J.; Zeb, S.A.; Mohammad, N.; Batool, Z.; Saqib, Z.; Afza, R. Ecological assessment of Iris hookeriana across subalpine and alpine regions of the Hindu-Himalayas. Front. For. Glob. Change 2025, 8, 1539025. [Google Scholar] [CrossRef]
  23. Ahmad, Z.; Khan, S.M.; Afza, R.; Ullah, A.; Zeb, S.A.; Issayeva, K.S.; Bekzatqyzy, I.S. Angiosperms distribution under the influence of microclimatic factors across a polluted ecosystem. J. Hazard. Mater. Adv. 2023, 9, 100223. [Google Scholar] [CrossRef]
  24. Naikoo, M.I.; Raghib, F.; Dar, M.I.; Khan, F.A.; Hessini, K.; Ahmad, P. Uptake, accumulation and elimination of cadmium in a soil-Faba bean (Vicia faba)-Aphid (Aphis fabae)-Ladybird (Coccinella transversalis) food chain. Chemosphere 2021, 279, 130522. [Google Scholar] [CrossRef] [PubMed]
  25. Khan, S.M.; Page, S.; Ahmad, H.; Harper, D. Identifying plant species and communities across environmental gradients in the Western Himalayas: Method development and conservation use. Ecol. Inform. 2013, 14, 99–103. [Google Scholar] [CrossRef]
  26. Tu, W.-q.; Lu, W.-x.; Gu, J.-q.; Lou, A.-r. The species diversity and phylogenetic structure patterns of desert plant communities in the Turpan-Hami region, Xinjiang. Glob. Ecol. Conserv. 2024, 55, e03239. [Google Scholar] [CrossRef]
  27. Xie, P.; Liu, T.; Chen, H.; Su, Z. Community Structure and Soil Mineral Concentration in Relation to Plant Invasion in a Subtropical Urban and Rural Ecotone. Forests 2021, 12, 185. [Google Scholar] [CrossRef]
  28. Rahman, I.U.; Afzal, A.; Iqbal, Z.; Bussmann, R.W.; Alsamadany, H.; Calixto, E.S.; Shah, G.M.; Kausar, R.; Shah, M.; Ali, N. Ecological gradients hosting plant communities in Himalayan subalpine pastures: Application of multivariate approaches to identify indicator species. Ecol. Inform. 2020, 60, 101162. [Google Scholar] [CrossRef]
  29. Mayor, J.R.; Sanders, N.J.; Classen, A.T.; Bardgett, R.D.; Clement, J.-C.; Fajardo, A.; Lavorel, S.; Sundqvist, M.K.; Bahn, M.; Chisholm, C. Elevation alters ecosystem properties across temperate treelines globally. Nature 2017, 542, 91–95. [Google Scholar] [CrossRef]
  30. Waqas Khan, W.K.; Khan, S.; Habib Ahmad, H.A.; Zeeshan Ahmad, Z.A.; Page, S. Vegetation mapping and multivariate approach to indicator species of a forest ecosystem: A case study from the Thandiani sub Forests Division (TsFD) in the Western Himalayas. Ecol. Indic. 2016, 71, 336–351. [Google Scholar] [CrossRef]
  31. Rahman, I.; Afzal, A.; Iqbal, Z.; Abd Allah, E.; Alqarawi, A.; Calixto, E.; Ali, N.; Ijaz, F.; Kausar, R.; Alsubeie, M. Role of multivariate approaches in floristic diversity of Manoor Valley (Himalayan Region), Pakistan. Appl. Ecol. Environ. Res 2019, 17, 1475–1498. [Google Scholar] [CrossRef]
  32. Haq, F.; Ahmad, H.; Iqbal, Z.; Alam, M.; Aksoy, A. Multivariate approach to the classification and ordination of the forest ecosystem of Nandiar valley western Himalayas. Ecol. Indic. 2017, 80, 232–241. [Google Scholar] [CrossRef]
  33. Bergmeier, E. The vegetation of the high mountains of Crete-a revision and multivariate analysis. Phytocoenologia 2002, 32, 205–249. [Google Scholar] [CrossRef]
  34. Badshah, L.; Hussain, F.; Sher, Z. Floristic inventory, ecological characteristics and biological spectrum of rangeland, District Tank, Pakistan. Pak. J. Bot 2013, 45, 1159–1168. [Google Scholar]
  35. Bardgett, R.D.; Manning, P.; Morriën, E.; De Vries, F.T. Hierarchical responses of plant–soil interactions to climate change: Consequences for the global carbon cycle. J. Ecol. 2013, 101, 334–343. [Google Scholar] [CrossRef]
  36. Yimer, F.; Ledin, S.; Abdelkadir, A. Soil property variations in relation to topographic aspect and vegetation community in the south-eastern highlands of Ethiopia. For. Ecol. Manag. 2006, 232, 90–99. [Google Scholar] [CrossRef]
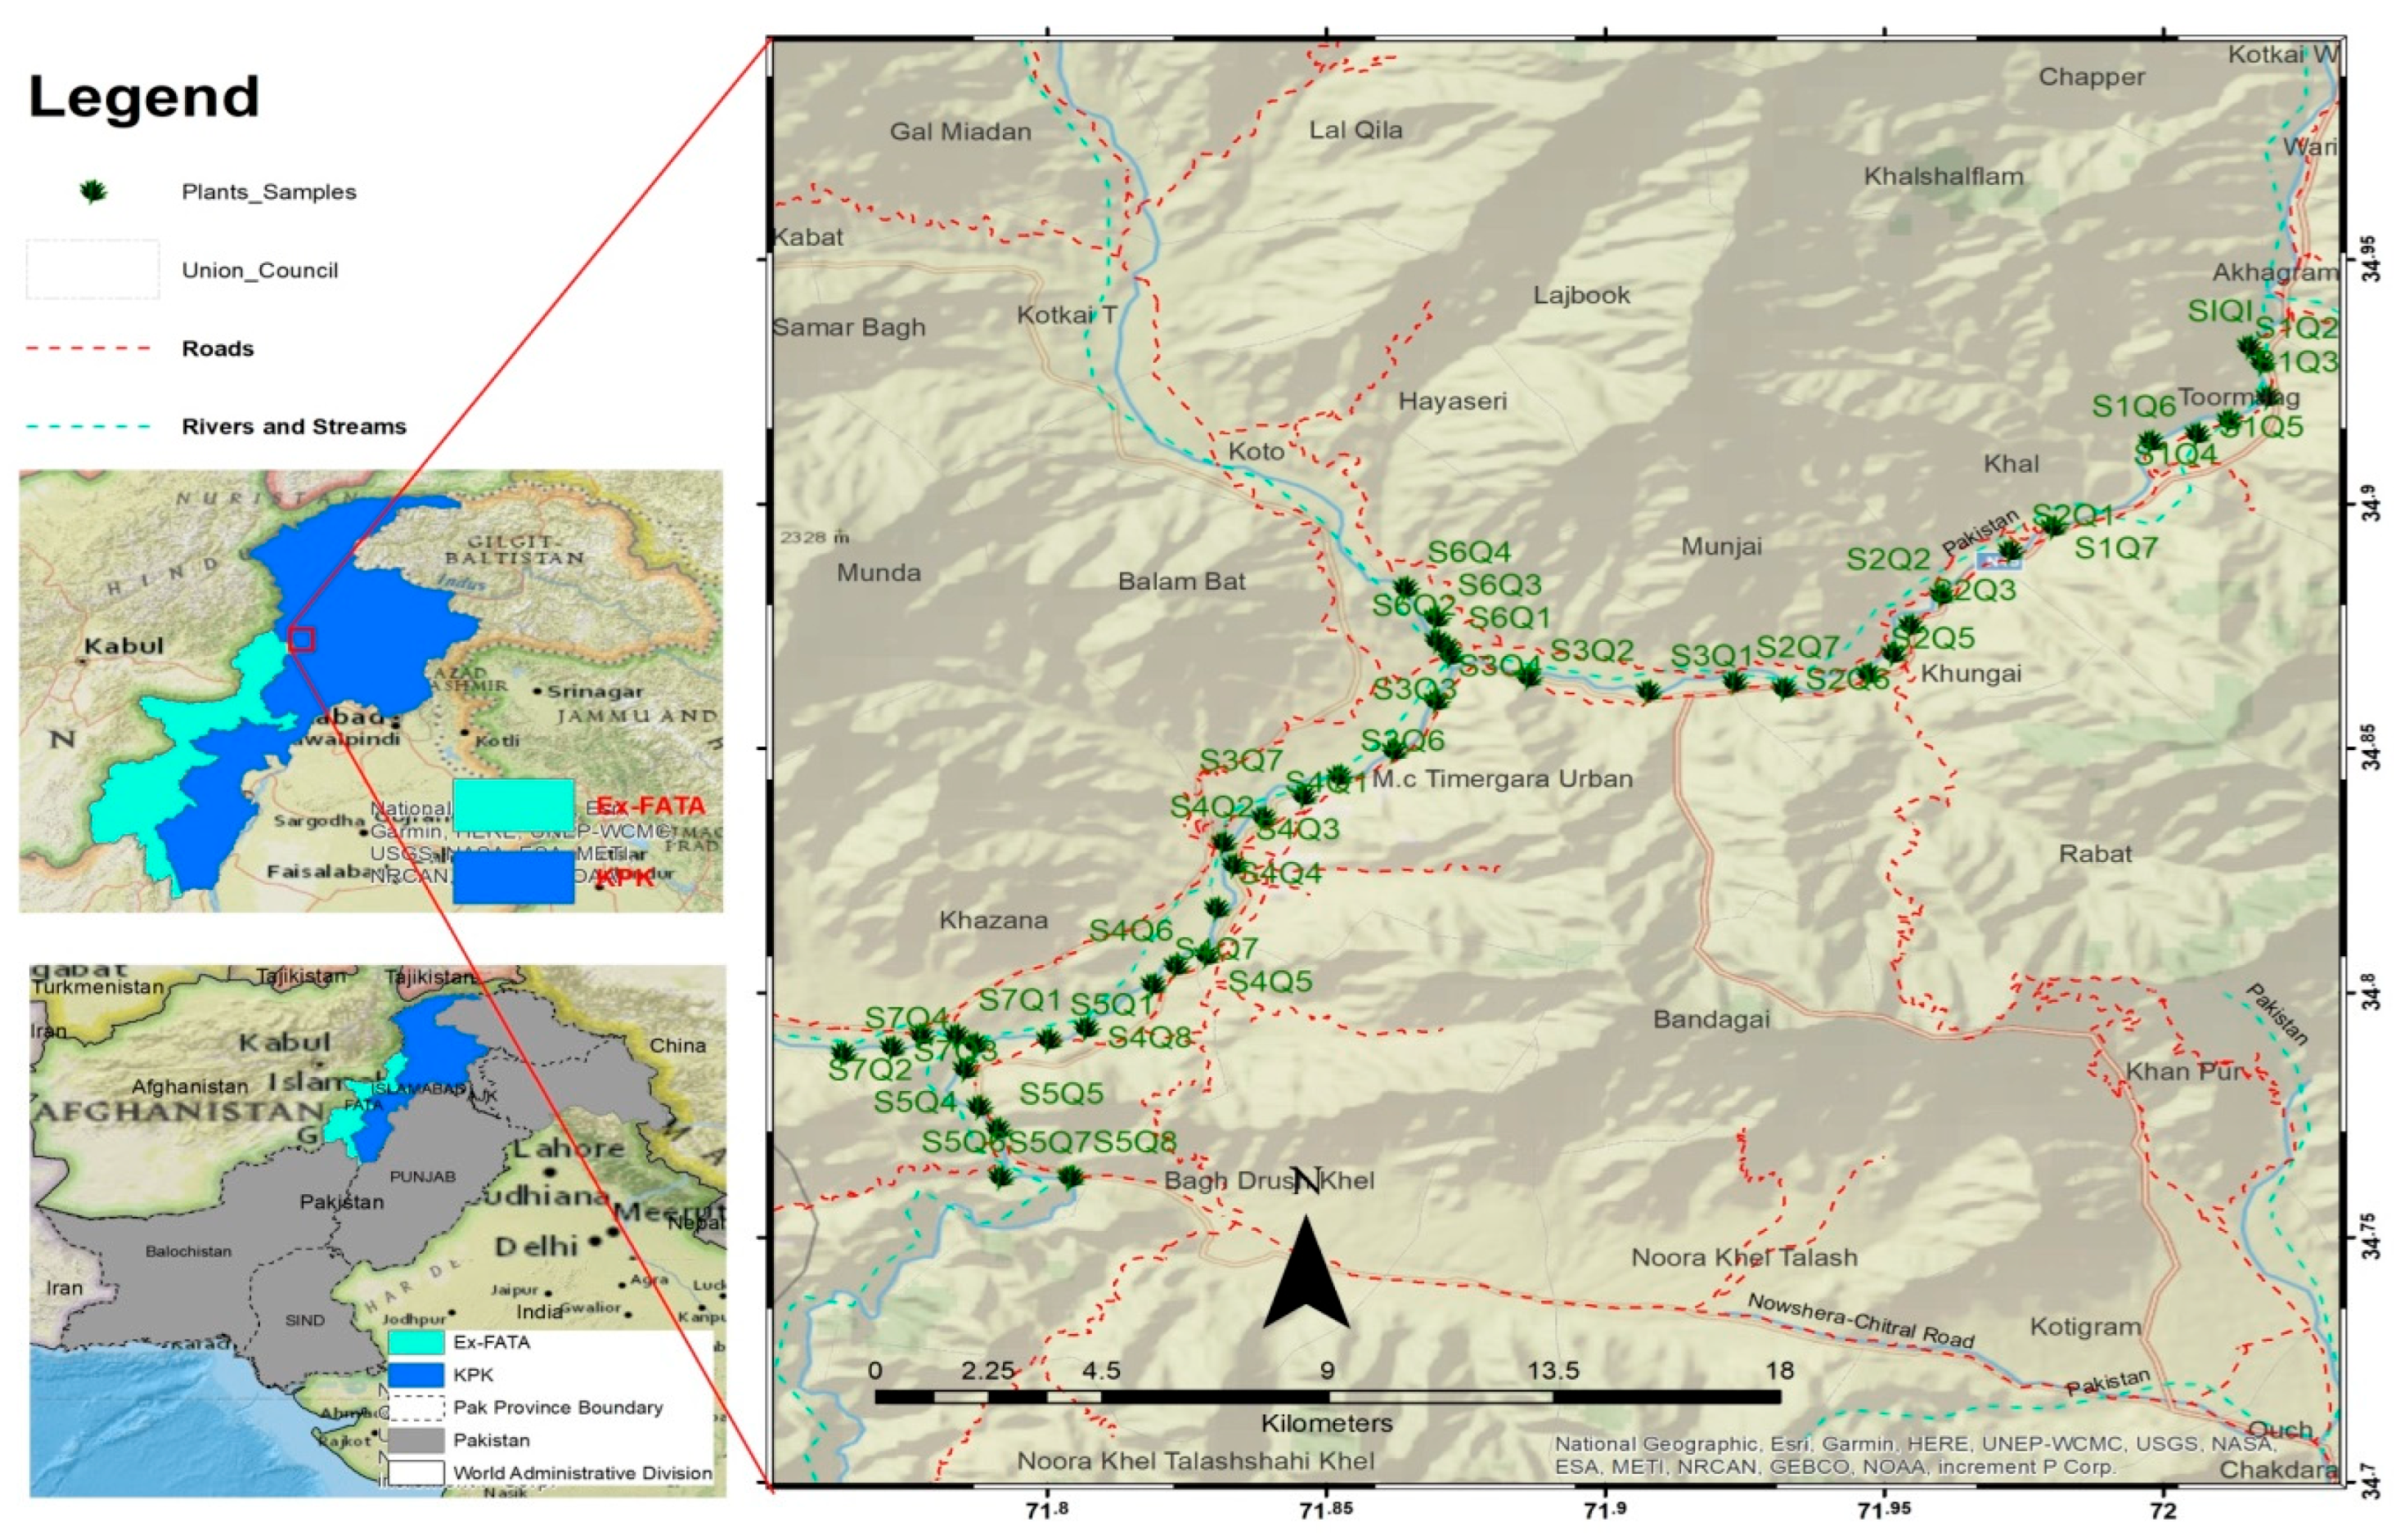
Figure 1. The map of the study area (created using Arc GIS, 10.5) shows the sampling points.
Wild 02 00037 g001
Figure 2. The species area curves show the sampling adequacy in the study area.
Wild 02 00037 g002
Figure 3. Cluster dendrogram of 135 quadrats showing plant communities based on the Sorenson measure.
Wild 02 00037 g003
Figure 4. Distribution of 216 plant species and 135 quadrats in a two-way cluster dendrogram.
Wild 02 00037 g004
Figure 5. Data attribute plots of the top indicator species of the 1st community, showing relation with environmental variables.
Wild 02 00037 g005
Figure 6. Data attribute plots of the top indicator species of the 2nd community, showing relation with environmental variables.
Wild 02 00037 g006
Figure 7. Data attribute plots of the top indicator species of the 3rd community, showing relation with environmental variables.
Wild 02 00037 g007
Figure 8. Data attribute plots of the top three indicator species of the 4th community, showing relation with environmental variables.
Wild 02 00037 g008
Figure 9. Data attributes plots of the top three indicator species of the 5th community, showing relation with environmental variables.
Wild 02 00037 g009
Figure 10. Canonical correspondence analysis (CCA) biplot illustrating the relationship between species (triangles) and environmental variables (arrows). The direction and length of each arrow indicate the gradient and strength of each ecological factor’s influence on species distribution. Key variables include Cu, Cd, Cr, Ni, Mn, pH, Na, and EC.
Wild 02 00037 g010
Figure 11. CCA shows the distribution of 135 quadrats with different environmental variables.
Wild 02 00037 g011
Figure 12. Detrended correspondence analysis plot shows the distribution of 216 plant species in the study area.
Wild 02 00037 g012
Figure 13. The detrended correspondence analysis plot shows the distribution of 135 quadrats across 5 plant communities.
Wild 02 00037 g013
Table 1. Top three indicator species of the community influenced by various environmental variables (* significance of the p value).
Indicator SpeciesInfluencing FactorsIVp * Value
1Melia azedarachCr46.20.01
Fe47.50.01
Zn20.70.04
2Punica granatumCr49.50.01
Fe49.70.008
Mg26.10.03
3Asparagus racemosusCr50.00.03
Fe50.00.01
Zn20.00.03
Table 2. Different environmental variables influence the top three indicator species of the 2nd community (* significance of the p value).
S.noIndicator SpeciesInfluencing FactorsIVp * Value
1Populus albaCo50.00.01
2Debregeasia saenebpH42.30.03
3Youngia japonicaCd45.50.04
EC36.60.03
TDSs25.30.03
Table 3. Different environmental variables influence the top three indicator species of the 3rd community (* significance of the p value).
S.noIndicator SpeciesInfluencing FactorIVp * Value
1Pinnus roxburgiiCr25.00.05
2Rydingia limbateCu50.00.02
3Cheilanthes pteridioidesCr50.00.03
Cu50.00.03
TDSs33.30.02
Zn20.00.03
Table 4. The top indicator species of Community 4 influenced under various environmental variables, (* significance of the p value).
S.noIndicator SpeciesInfluencing FactorIVp * Value
1Ficus caricaNa50.00.01
2Polygonum plebeiumK26.00.05
3Avena sativaK26.00.03
Fe27.00.04
Table 5. The top three indicator species of the 5th community influenced under various variables (* significance of the p value).
S.noIndicator SpeciesInfluencing FactorsIVp * Value
1Ficus palmatepH20.00.009
2Rosa multiflorapH28.00.04
3Heliotropium europaeumMn25.00.03
Table 6. Summary of the four axes of CCA for plant species.
Axes1234Total Inertia
Eigenvalues0.4040.3620.3580.29623.765
Species–environmental correlation0.8540.8540.8090.843
Cumulative percentage variance of species1.73.24.76.0
Species–environment relationship13.924.636.145.6
Summary of Monte Carlo test (499 permutations under reduced model)
Test of significance of the first canonical axisTest of significance of all canonical axes
Eigenvalue0.404Trace3.113
F-ratio2.058F-ratio1.196
p-value0.0780p-value0.0160
Table 7. Summary table of detrended correspondence analysis.
Axes1234Total Inertia
Eigenvalue0.7420.6620.5160.46423.665
Length gradients6.4435.2224.0534.791
Cumulative percentage variance of species data3.15.98.110.0
Disclaimer/Publisher’s Note: The statements, opinions and data contained in all publications are solely those of the individual author(s) and contributor(s) and not of MDPI and/or the editor(s). MDPI and/or the editor(s) disclaim responsibility for any injury to people or property resulting from any ideas, methods, instructions or products referred to in the content.