Abstract
Ageing in place is the ability to remain in one’s community, where living conditions foster a sense of attachment that enhances holistic well-being. To facilitate this, both the built and social environments within which the home is nested must be conducive to successful ageing. This paper deconstructs the merits of ageing in place, specifically how attachment to the lived environment contributes to holistic well-being. We analysed data from 6020 participants in the Singapore Life Panel® using path models, where we examined three dimensions of ageing in place: place identity, continuity, and social inclusion. Five path analyses show that two dimensions of ageing in place mediated the relationship between well-being and factors such as social isolation, number of close neighbours, social support, and satisfaction with amenities, but not living arrangements. Social inclusion consistently showed no significant relationship with well-being across all models. These findings suggest that the quality of social connections, rather than physical living arrangements, is important for well-being, and that social inclusion needs to be more appropriately contextualised. Our study contributes to policy discussions on how supporting older adults to age in place can enhance their overall well-being.
1. Introduction
As in much of Asia, Singapore has traditionally relied on family support to care for its vulnerable members, including older adults [1]. However, demographic shifts are rapidly transforming this landscape. With extended longevity and a burgeoning ageing population [2], the proportion of singles has risen by approximately 4% among those aged between 30 and 44 from 2013 to 2023 [3]. During this period, there had been a declining fertility rate from 1.19 to 0.97 births per female [4], coupled with the emergence of married or cohabiting couples who both work but do not plan to have children (dual-income no-kids, DINK) [5]. These societal changes are reshaping family structures and diminishing the effectiveness of traditional support systems [1]. Singapore’s trajectory towards becoming a “super aged” society is imminent, as the proportion of Singapore’s population aged 65 and above is projected to be 21% by 2026, thereby meeting the United Nations criterion for such a demographic shift [6]. Without adaptation, these emerging vulnerabilities risk leaving the older segments of the population in poorer health and reduced overall well-being.
Retirement communities with integrated eldercare services are scarce in Singapore due to limited land availability [7]. This has increased interest in ageing in place as an alternative. For instance, Age Well SG is a national programme that facilitates ageing in place by expanding community-based services, upgrading age-friendly homes, and improving access to healthcare [8]. As nearly 80% of Singapore’s population resides in public Housing Development Board (HDB) flats, with about 95% being owner-occupied [9], large-scale upgrading is comparatively easier to implement. Ageing in place can ease life transitions, such as the adjustments that older adults face as they enter retirement [10]. These transitions often bring challenges like health decline, social isolation, role adjustments, and economic instability [11]. In Singapore, about 82% of older adults prefer to remain in their homes as they age, rather than transit into long-term care homes or facilities [12]. Ageing in place may ease these life transitions by providing a stable avenue to support well-being amidst these demographic changes. The scope of the current research therefore examines how the built and social environments contribute to ageing in place, as well as its subsequent contribution to well-being.
1.1. Deconstructing Ageing in Place
Ageing in place is broadly defined as the ability to remain in one’s home and community [13] while promoting well-being [14]. However, measuring ageing in place remains challenging due to varied operationalisation in the literature [15,16,17]. Some studies rely on indicators such as relocation intentions or the presence of physical features (e.g., access to lifts and ramps) [18,19,20,21]. Recent scholars, however, noted a shift toward a more nuanced and subjective understanding of ageing in place, emphasising older adult’s sense of attachment to their environment [15,16,17]. For example, Bigonnesse and Chaudhury [15] explained that ageing in place is a process of balancing four areas: place attachment (the emotional bonds formed with the environment), social participation (the importance of social networks and support), mobility (the ability to navigate between places) and independence (the capacity to exert control and autonomy). Our conceptualisation of ageing in place follows these trends in the literature, which takes a psycho-social approach to assess the meaningful connections that older adults form with their surrounding neighbourhoods [15,22]. We therefore define ageing in place as consisting of three dimensions—(1) place identity, (2) sense of community, and (3) social inclusion.
1.1.1. Place Identity
In this study, place identity refers to an emotional or symbolic attachment that older adults form with their homes [23]. Place identity happens when individuals internalise features of their home environments—including memories, thoughts, and preferences—as part of their broader concepts of the self [24,25]. A stronger sense of place identity is typically associated with greater autonomy and independence, enabling older adults to maintain control over their lives within familiar settings [26]. Place identity is also linked to a preference for ageing in place, influenced by factors such as the presence of social capital and neighbourhood-based resources [26,27]. Notably, a study in Hong Kong highlighted that place identity is associated with multiple facets of older adults’ well-being, including positive life evaluations, positive affect, and social integration [28], thus underscoring the importance of place identity when ageing in place. These features create a sense of familiarity, which facilitates older adults’ navigation within their communities, reducing cognitive and physical demands [29,30].
1.1.2. Sense of Community
For the social and built environments to support ageing in place, they must remain relevant to the diverse needs of older adults [10,11]. Continuity theory posits that older adults strive to maintain consistent activities, behaviours, and relationships, preserving a connection to their past [26]. This sense of community fosters a stable self-concept, a sense of purpose, and a feeling of belonging as they age [26]. For example, a study in Taiwan found that satisfaction with welfare services—such as subsidies and senior centres—enhanced older adults’ ability to maintain social roles within their communities [31]. Social connections that encourage mutual support to maintain interests and activities as they age are also associated with improved mental and physical well-being [30,31]. Thus, the built and social environments should offer stability and a sense of continuity to help older adults maintain their activities and interests while ageing in place.
1.1.3. Social Inclusion
In the context of community-dwelling older adults, social inclusion often involves a deep sense of belonging, feeling accepted, and mutual dependency with those in their immediate surroundings [29,32]. Through close relationships with family, friends, and neighbours, older adults receive emotional support and practical assistance, creating a sense of purpose and security [29,32]. These inclusive social connections therefore strengthen their overall experience of ageing in place [32,33]. Therefore, we define social inclusion as the extent to which older adults feel a sense of belonging, through familiarity and comfort with family and friends in their neighbourhoods [29,32]. We therefore investigate the roles of the built and social environments in contributing to these perceptions of social inclusiveness within their neighbourhoods.
1.2. Ageing in Place and Well-Being
The importance of ageing in place lies in its ability to support well-being, through the built and social environments [15]. A systematic review by E et al. [34] highlighted the importance of access to amenities, such as healthcare clinics, community centres, and commercial spaces, that shape older adults’ quality of life. For instance, safe and well-maintained open spaces, like parks and gardens, promote mobility and physical activities that contribute to physical health [35,36]. Well-managed community services that support independent living can also improve overall health and well-being, which can ease economic burdens on health expenditure [37,38]. In Singapore, there are initiatives where private real estate developers partner with government agencies to adopt age-friendly designs in their buildings [39]. For instance, the Nee Soon Central Community Centre—a government initiative launched in partnership with the private developer Fraser Centrepoint Trust—integrates retail outlets with community services that cater to the needs and interests of older adults [40]. This was conducted to encourage intergenerational bonding and create an age-inclusive environment [41]. These would serve as ‘third places’, where public spaces serve not only functional purposes but also foster social interactions through community engagement [40]. For this study, we define conducive built environments as the perceived satisfaction with diverse shared spaces (i.e., parks, community centres, health clinics, etc.) that either encourage social engagement or serve the practical needs of older adults, consequently contributing to their well-being [35,36,37,38].
The social environment can promote older adults’ well-being by enabling ageing in place, but these factors are inherently complex and multifaceted. For instance, Peterson and Margolis found that older adults with strained familial relationships are less socially active compared to those with closer family ties [42]. Other research also underscores the importance of relationship quality over quantity [43]. For instance, positive social interactions and satisfaction with social ties are associated with fewer chronic illnesses among older adults, but not the frequency of social interactions [43]. As ageing in place implies that older adults spend more time in their residential areas, fostering quality social networks with immediate neighbours becomes increasingly significant [15]. Such networks are foundational to supportive social structures, which can address challenges like social isolation [44]. We therefore define conducive social environments as higher levels of perceived social support, closeness with neighbours, lower sense of social isolation, and living arrangements that allow daily interactions. Environments like these should allow the formation of quality social relationships in neighbourhoods, thus supporting ageing in place and contributing to older adults’ well-being.
1.3. Aims of the Study
In our study, we adopted Chen et al.’s [45] conceptual framework where they tested the mediating role of place attachment on psychological well-being and ageing perceptions. We conceptualised this to include place identity, sense of continuity, and social inclusion as mediators to capture the multidimensional nature of ageing in place for community-dwelling older adults. This approach increases our understanding of environmental mechanisms that underlie ageing in place while providing greater theoretical breadth and practical consistency for policy making [46]. As such, we will explore the merits of ageing in place through the built and social environments, and its implications for well-being. The social environment, however, is inherently complex and requires more nuanced measurements to understand its role in ageing in place. The paper adopts a psycho-social perspective of ageing in place, which entails the meaningful connections that older adults form with their lived environments [15,16]. This is to address its scarcity in the literature, where most rely on physical assessments or relocation intentions [15,16,18,19]. This study further addresses the gap in the literature by testing the mediating role of ageing in place, examining how living conditions facilitate older adults’ sense of attachment to neighbourhoods and its influence on well-being. Furthermore, this paper contributes to policy discourse by identifying specific aspects of the built and social environments that may support ageing in place. In this study, we hypothesise the following:
H1.
Satisfaction with amenities would significantly predict the three dimensions of ageing in place (place identity, sense of community, and social inclusion).
H2.
Each dimension of ageing in place would significantly mediate the relationship between the built environment and well-being.
H3.
A conducive social environment would significantly predict the three dimensions of ageing in place.
H4.
Each dimension of ageing in place would significantly mediate the relationship between the social environment and well-being.
2. Materials and Methods
2.1. Data
This study used data from the Singapore Life Panel® (SLP), which is a high-frequency panel survey comprising older Singaporean residents aged between 54 and 79 years old. Respondents may opt to complete the surveys online, via phone, or through physical interviews. To cater to Singapore’s multi-ethnic population, surveys are fielded in the English, Chinese, Malay, and Tamil languages, and respondents are compensated for their time with vouchers. The recruitment started in 2015 with an initial reach of about 11,500 households. The SLP has maintained an average response rate of 70% each month out of those who were invited to complete the survey since 2015. The SLP underwent an infrastructural change in 2020 and was then refreshed from 2021 to 2023. After accounting for attrition, mortality, and the removal of poor-quality data or inactive respondents, the SLP had 7672 participants who responded for the September 2024 wave. Of which, 6020 respondents consented to this module on ageing in place.
2.2. Measurements
2.2.1. Holistic Well-Being
Well-being was conceptualised as a multidimensional construct with four domains: (1) self-reported health (i.e., physical well-being), (2) satisfaction with economic situation (i.e., economic well-being), (3) psychological well-being, and (4) social well-being [47]. Self-reported health and economic satisfaction were each measured on a five-point Likert scale (1 = poor; 5 = excellent). Psychological well-being was averaged using 18 items on a six-point Likert scale (1 = strongly disagree; 6 = strongly agree) spanning six dimensions: autonomy, environmental mastery, personal growth, positive relations with others, purpose in life, and self-acceptance [48] (Cronbach’s α = 0.88). Social well-being was averaged using 15 items on a six-point Likert scale (1 = strongly disagree; 6 = strongly agree) that comprised five dimensions: social acceptance, social actualization, social coherence, social contribution, and social integration [49] (Cronbach’s α = 0.90). The aggregates of social and psychological well-being were normalised using min-max scaling, transforming the range of values into a standardised scale of 1 to 5 [50]. Subsequently, a composite index was derived by averaging all four domains [51], with a Cronbach alpha of 0.90 for 35 items, which indicates high index reliability.
2.2.2. Built Environment
The built environment was assessed by asking respondents to indicate how satisfied they were with amenities that were closest to their homes on a six-point Likert scale (1 = strongly dissatisfied, 6 = very satisfied). We included a mixture of amenities that meet the practical and social needs of our respondents. This included the following: (1) medical clinics including general practitioners (GPs), polyclinics or hospitals, (2) community centres, (3) eateries including hawker centres, restaurants or coffee shops, (4) provisional shops including supermarkets, wet markets, convenience stores or sundry shops, (5) banks or auto-teller machines, (6) bus stops or train stations, (7) parks, greenspaces or exercise spaces, (8) pre-schools or childcare centres, (9) eldercare or active ageing centres, and (10) shopping malls or retail outlets. We averaged these responses for an overall measure of satisfaction with amenities.
2.2.3. Social Environment
Respondents rated their perceptions of social isolation on a five-point scale (1 = none of the time, 5 = all the time). Participants were then asked to indicate the number of neighbours whom they felt close to. Living arrangement was coded as binary and classified as living alone if they were single (never married), separated, widowed, or divorced and had no other members living in their household.
Perceived social support was measured using seven items from the Medical Outcomes Study Social Support Survey [52]. These items assessed how often participants felt they were supported emotionally (e.g., “someone to confide in or talk to about your problems”) and in their daily provisions (i.e., instrumentally) (e.g., “someone to prepare meals if you are unable to do so”) on a five-point scale (1 = none of the time, 5 = all the time). A final social support index was derived by adding the scores to all seven items (α = 0.97).
2.2.4. Ageing in Place
Place identity was measured with four items that encapsulated emotional or symbolic identification with their surrounding neighbourhoods. These items were modified from the Abbreviated Place Attachment Scale [23] and received good reliability for our sample (Cronbach’s α = 0.96). Continuity evaluated residents’ perceptions of the suitability of local services, activities, and settings as they continue to live in their neighbourhoods with five items. Social inclusion measured their sense of belonging and social interactions with five items. These two scales were modified from the Place Attachment for Community-dwelling Older Adults [29] with good reliability (continuity, Cronbach’s α = 0.88, social inclusion, Cronbach’s α = 0.87). All sense of attachment measures used a 6-point Likert scale (1 = strongly disagree, 6 = strongly disagree). See Appendix A for all three scales used in this study.
2.2.5. Covariates
Age, gender, marital status, employment, education, and ethnicity were included as covariates in the model. In Singapore, housing type is commonly used to approximate socioeconomic status (SES) as it correlates with income [53]. For instance, among those employed in 2023, residents living in 1- to 3-room public housing flats reported an average monthly household income of SGD 729 to SGD 7904, followed by SGD 12,330 to SGD 16,026 for those living in 4- or 5-room public housing flats, and SGD 25,707 to SGD 40,884 for those living in private housing (condominiums and landed properties) [54].
2.3. Analytical Strategy
All data was analysed using Rv4.1. To examine our hypotheses, we applied structural equation modelling (SEM) to test relationships between factors for five of our path models. Model fit was evaluated using standard goodness-of-fit indices, including chi-square, Comparative Fit Index (CFI), Root Mean Square Error of Approximation (RMSEA), and Standardised Root Mean Square Residual (SRMR), adhering to widely accepted cut-offs (i.e., CFI ≥ 0.90, RMSEA ≤ 0.06, SRMR ≤ 0.08) [55]. All variables were standardised to minimise violations of normality. A total of 1000 bootstrap samples were applied to obtain robust confidence intervals (CI) with maximum likelihood for indirect effects. We report on the R2 values for endogenous variables, and demographic covariates were adjusted in all models [55].
3. Results
3.1. Sociodemographic Characteristics
Table 1 presents the demographic characteristics of the respondents, with a total sample size of 6020 (see Appendix B for the sociodemographic predictors for the five hypothesised models). Respondents were, on average, 65 years old. 53.5% of the respondents were female. Most respondents were married (77.1%) and a large proportion of the sample were of the Chinese ethnicity (88.4%). 63.0% of respondents did not attain post-secondary education. Half of the respondents were working for pay (50.1%) despite the older age profile of the sample, possibly due to efforts by the Singapore government to incentivise post-retirement employment through policies like the Retirement and Re-employment Act (RRA), allowing companies to offer re-employment contracts to older employees up to 67 years of age. Most respondents lived in 4- or 5-room HDB flats (61.5%), and a large proportion of the sample lived with other individuals in their households (91.4%).

Table 1.
Demographic characteristics of the participants (n = 6020).
3.2. Model Fit
Table 2 demonstrates that all five models exhibited acceptable model fit. Table 3 presents the estimated R2 values for the endogenous variables in the models. In Model 4, living arrangements accounted for less than 1% of the variance in sense of attachment. Overall, the explained variance of satisfaction with amenities for the three ageing in place dimensions were higher compared to all models of the social environments (Table 3). See Appendix C for all five hypothesised models.
Table 2.
Goodness of fits for all five models.
Table 3.
Estimated R2 values for the endogenous variables for all five models.
3.3. Hypothesised Models
3.3.1. H1: Amenity Satisfaction and Ageing in Place
We hypothesised that satisfaction with amenities would significantly predict the three dimensions of ageing in place. Table 4 presents the regression coefficients, in which satisfaction with amenities significantly predicted place identity (β = 0.42, p < 0.01), continuity (β = 0.56, p < 0.01), and social inclusion (β = 0.32, p < 0.01).
Table 4.
Regression coefficients of amenity satisfaction predicting the dimensions of ageing in place.
3.3.2. H2: Ageing in Place Mediates the Relationship Between Built Environment and Well-Being
We hypothesised that each of the three dimensions of ageing in place would significantly mediate the relationship between the built environment and well-being. From the results in Table 5, place identity (β = 0.07, p < 0.01) and continuity (β = 0.11, p < 0.01) significantly mediated the relationship between satisfaction with amenities and well-being. The total indirect effects of these three dimensions accounted for 54.8% of the total effects on well-being. Only social inclusion did not significantly mediate the relationship between satisfaction with amenities and well-being (β = 0.18, p = 73).
Table 5.
Indirect effects of amenity satisfaction to well-being through the three dimensions of ageing in place.
3.3.3. H3: Social Environment and Ageing in Place
We hypothesised that a conducive social environment would significantly predict the three dimensions of ageing in place. Table 6 indicates that an increase in the number of close neighbours, the amount of social support, or decreasing levels of social isolation were significantly associated with an increase in the scores of each dimension of ageing in place. However, only living arrangements were not associated with any dimensions of ageing in place.
Table 6.
Regression coefficients of various aspects of the social environment predicting the dimensions of ageing in place.
3.3.4. H4: Ageing in Place Mediates the Relationship Between Social Environment and Well-Being
We hypothesised that each of the three dimensions of ageing in place would significantly mediate the relationship between the social environment and well-being. Table 7 illustrates that three dimensions of ageing in place significantly mediate the relationship between three aspects of the social environment (social isolation, social support, and close neighbours) and well-being. Among these, the total indirect effect of close neighbours through ageing in place accounted for 60% of the total effects on well-being, which was the highest compared to the other models. However, the indirect effects of living arrangements on well-being were not statistically significant through the three dimensions of ageing in place.
Table 7.
Indirect effects of various aspects of the social environment to well-being through the three dimensions of ageing in place.
4. Discussion
This study examined the mediating role of ageing in place in promoting the holistic well-being of older adults, with respect to the built and social environments. The findings supported H1, demonstrating that greater satisfaction with neighbourhood amenities significantly predicts all three dimensions of ageing in place—place identity, continuity, and social inclusion. As for the social environment, forging close neighbourhood relationships, having greater social support, and reduced social isolation predicted the three dimensions of ageing in place. However, living arrangements showed no such associations. Therefore, our findings offered only partial support for H3. Finally, place identity and continuity—but not social inclusion—significantly mediated the relationships between the built and social environments and well-being, thus providing partial support for H2 and H4.
The results suggest that whether older adults lived alone had no relationship with how attached they feel to their neighbourhoods. This means that a conducive social environment ought to be defined by the quality of networks (i.e., closeness with neighbours, availability of social support, and low levels of social isolation) as opposed to the structural living environments (i.e., whether someone lives alone); and it is this quality of social networks that has bearing on older adults’ perceptions of ageing in place. Living alone may not necessarily suggest that older adults would feel disconnected from their communities; more importantly, older adults may feel socially isolated if they do not perceive adequate support from their social networks [56]. Social support from close relationships with neighbours can mitigate the difficulties of living alone, equipping them with appropriate psychosocial resources to cultivate or maintain resilience and agency [57,58,59]. Therefore, functional aspects of social interactions, like the provision of emotional and instrumental support is likely more critical than structural factors such as living arrangements for older adults’ well-being [60].
As satisfaction with amenities increases, older adults report a higher rating across three dimensions of ageing in place. This association and its explained variance were stronger as compared to the various factors of the social environment. Similarly, the WHO Global Age-Friendly framework noted that domains like civic participation often rank lower compared to physical infrastructures for ageing in place [61]. Choi [18] explained that this is because the built environment is more closely linked to health behaviours like exercise and healthcare utilisation, which has a more direct support to autonomy and independence. Other researchers explained that social factors should be supported by the built environment to address both functional and social needs of older adults [62,63]. This mirrors the concept of the ‘third place’, where building social capital should be embedded within the built environment like services and amenities [64].
In our study, social inclusion was not a strong predictor of well-being. However, this could be due to additional cultural factors that were not considered in our study. Singapore is a small, highly urbanised nation with limited rural areas, only about 30% of its citizens own cars and most rely on public transportation [65]. Having family and friends to live in proximity neighbourhoods, as measured by our scale, may not be as important as locals can travel with relative ease on a reliable public transportation network. Locally, the Family Housing Grant scheme subsidises public housing so that parents and children can live in proximity of each other, promoting intergenerational family relations. However, this mainly targets first-time homebuyers, and thus more frequently used by adult offspring than their parents. Therefore, social inclusion may be better captured by intergenerational dynamics, relationship quality, and frequency of social interactions, rather than older adults’ residential living arrangements (e.g., living close to friends or family). Our study does not suggest that social inclusion is unimportant for well-being; rather, the construct was not contextualised appropriately to Singapore’s unique cultural norms and practices.
Nevertheless, two dimensions of ageing in place emerged as significant mediators linking the lived environments to well-being. Ageing in place supports well-being when older adults feel attached to their neighbourhoods and perceive a stable source of social support [15]. The mediating role of place identity highlights that the built and social environments should be designed to support older adults’ familiarity to their surroundings. Accessible amenities and other age-friendly infrastructure should allow older adults to navigate within their neighbourhoods with ease and confidence [34]. Socially supportive structures provide older adults with a sense of identity in their neighbourhoods, which enables them live independently in their communities [66]. Additionally, the mediating role of continuity emphasises the importance of providing stable environments to support older adults’ well-being. Both the built and social environments must, therefore, offer older adults a sense that the neighbourhoods will remain suitable for their needs as they age.
4.1. Policy Implications
The transition to retirement and the loss of formal roles can profoundly affect older adults’ well-being, often leading to feelings of displacement and uncertainty. Ageing in place may address these issues by providing older adults with a sense of assurance and stability that their homes or neighbourhoods will remain conducive for them to age independently [22,67]. First, offering older adults a sense of continuity as they age through tailored amenities is important. In Singapore, the prevalence of public housing estates simplifies uniform age-friendly modifications like barrier-free walkways and accessible healthcare facilities. However, these efforts might be challenging in other dense urban settings like Hong Kong, which contends with mixed building standards and high costs. However, broader communities in Asia must recognise that ageing in place is not static; it is continuously influenced by social and cultural dynamics, such as the relocation and/or loss of family members and friends, alongside changes like urban gentrification [10,17]. These can disrupt older adults’ connections to their environment, which would require them to adapt to new conditions that may not always be conducive to their well-being [10].
Next, fostering place identity can be driven by improving neighbourhood safety along with creating age-friendly designs in public or private spaces. As mentioned, there are efforts in Singapore where private real estate developers partner with government agencies to adopt age-friendly designs in their buildings [40]. Therefore, private and public sectors should coordinate efforts to actively involve older adults in shaping public spaces that support organic interactions to anchor their decisions to age in place [67]. These should involve strengthening emotional ties with age-friendly designs to garner familiarity with their surroundings. Our study shows the importance of the built and social environments for social inclusion, but its relevance for well-being needs to be further contextualised, such as through accounting for intergenerational relationships. We acknowledge that there is huge cultural heterogeneity within Asian societies. However, policies should nevertheless emphasise connecting people regardless of their residential areas or living arrangements. This is important for building quality social networks and relationships which provide adequate instrumental and emotional support.
4.2. Limitations
This study is not without its limitations. Firstly, it must be acknowledged that the definition of ageing in place varies in the literature [15,16]. While this study conceptualised ageing in place as a process across three dimensions, future research should incorporate more objective measures to complement these findings. For instance, incorporating ageing in place intentions or the presence of age-friendly features could provide a more comprehensive understanding of the mechanisms linking ageing in place to well-being. Also, the reliance on cross-sectional data limits the ability to infer causality. We further acknowledge that our data may be biased towards ‘young–old’ age groups, with the ‘old–old’ groups being underrepresented. Moreover, we further urge researchers to cross-examine our findings with different segments of the population (e.g., those with disabilities, minority communities, etc.) to ensure our results are generalisable and representative. This is especially the case for social environments, seeing that its explained variance is smaller compared to build environments. Finally, we acknowledge that the substantial literature highlights the importance of social inclusivity for well-being [42,43], but this was not evident in the current study. The social inclusion scale used in this study may have conflated structural and functional social elements in its measurement, which may have diluted its effect on well-being [42,43,60]. Additionally, there could be inadequate contextualisation of social inclusion with respect to Singapore’s cultural context. Future research is encouraged to address this gap by developing more precise and culturally appropriate measures of social inclusivity that are more specific to ageing in place.
5. Conclusions
Taken together, conducive built and social environments ought to help anchor older adults’ choice to age in place by fostering a sense of attachment to their neighbourhoods. Although the availability of resources like amenities and social ties in the neighbourhood are important for older adults to age in place, we emphasise that the quality of these resources also matters. With life transitions like one’s entry to retirement, being embedded in a living environment with high-quality amenities and strong social networks is crucial in providing stability as they age. With demographic changes like the declining fertility rate and the increase in singles and DINK households, traditional support systems are unlikely to remain effective in the long run [1], emphasising the need for the neighbourhood or community to intervene in supporting ageing in place. Despite wide cultural heterogeneity across Asia, our study highlights some applicable insights such as the significance of (a) quality social relationships on non-kin ties where family ties are weak, (b) environments that provide a sense of continuity as they age, and (c) environments that allow older adults to develop a sense of emotional attachment with their surroundings. As such, this study provides evidence to suggest that these resources in the neighbourhood may be cultivated and leveraged to develop a sense of attachment among older adults, to empower them to age in place and experience greater levels of well-being.
Author Contributions
Conceptualisation, P.S.; Methodology, P.S.; Formal analyses, Z.Z., R.N., and Y.W.T.; data curation, R.N. and Z.T.; writing—original draft review and editing, P.S., Y.W.T., Z.T., W.T.H., R.N., and Z.Z. All authors have read and agreed to the published version of the manuscript.
Funding
This research was supported by The Ngee Ann Kongsi, and by the Ministry of Education, Singapore, under its Academic Research Fund Tier 3 programme (Award reference number MOE2019-T3-1-006). Any opinions, findings, conclusions, or recommendations expressed in this paper are those of the authors and do not reflect the views of the funding bodies.
Institutional Review Board Statement
The study was conducted according to the guidelines of the Declaration of Helsinki and approved by the Institutional Review Board of Singapore Management University (protocol code IRB-20-080-A052-M53(824) and approved on 21 August 2024).
Informed Consent Statement
Informed consent was obtained from all subjects involved in this study.
Data Availability Statement
As the SLP is an ongoing study, the data are not publicly available and are stored under an independent server managed by SMU. Access may be granted only through specific requests to rosa@smu.edu.sg.
Conflicts of Interest
The author declares that this study received funding from The Ngee Ann Kongsi, and by the Singapore Ministry of Education. The funders were not involved in the study design, collection, analysis, interpretation of data, the writing of this article or the decision to submit it for publication.
Appendix A
Appendix A presents three scales used to measure the sense of attachment.
Place identity
- This neighbourhood is very special to me.
- I identify strongly with this neighbourhood.
- I feel this neighbourhood is a part of me.
- This neighbourhood means a lot to me.
Continuity
- Lots of activities in my daily life are strongly connected with this neighbourhood
- I think the facilities and services for daily life in this neighbourhood will remain suitable for me in the future.
- I think the health, leisure, medical facilities and services in this neighbourhood will remain suitable for me in the future.
- I think the social activities and social occasions in this neighbourhood will remain suitable for me in the future.
- I feel safe in this neighbourhood.
Social inclusion
- I live in this neighbourhood because my family members and relatives are here.
- I live in this neighbourhood because my friends are here.
- I am very close to the residents of this neighbourhood.
- I often hang out with relatives and friends in this neighbourhood
- I have a familiar feeling toward this neighbourhood
Appendix B
Appendix B presents standardised coefficients of sociodemographic predictors of social isolation, social support, number of close neighbours, living arrangements, and amenity satisfaction. These covariates were included as exogenous variables in the five models.
Table A1.
Demographic variables that predicted social isolation, social support, number of close neighbours, living arrangements, and amenity satisfaction.
Table A1.
Demographic variables that predicted social isolation, social support, number of close neighbours, living arrangements, and amenity satisfaction.
| Model | |||||
|---|---|---|---|---|---|
| 1. Social Isolation | 2. Close Neighbours | 3. Social Support | 4. Living Arrangements | 5. Amenity Satisfaction | |
| Age | 0.04 * | 0.11 * | 0.07 ** | −0.36 ** | 0.03 |
| Gender (ref: male) | |||||
| Female | 0.06 ** | −0.04 * | −0.04 * | −0.12 | −0.02 |
| Ethnicity (ref: Chinese) | |||||
| Malay | −0.07 ** | 0.07 * | 0.06 ** | 0.003 | 0.02 |
| Indian | 0.02 | 0.05 * | 0.03 * | −0.004 | 0.03 ** |
| Others | −0.02 | 0.01 * | 0.04 * | −0.01 | 0.05 * |
| Marital status (ref: married) | |||||
| Single | 0.077 ** | −0.01 * | −0.17 ** | −0.47 ** | −0.036 ** |
| Separated/divorced/widowed | 0.05 | 0.01 * | −0.14 ** | −0.37 ** | −0.041 * |
| Employment (ref: working full/part-time) | |||||
| Retired | 0.00 | −0.02 * | 0.02 | −0.02 | −0.01 |
| Others | 0.07 ** | −0.04 * | −0.05 ** | −0.01 | −0.04 * |
| Education (ref: no formal/primary education) | |||||
| Secondary education | −0.05 ** | 0.01 * | −0.02 | −0.02 | 0.01 |
| Post-secondary education | −0.02 | 0.02 * | −0.05 ** | −0.03 | −0.02 |
| Tertiary education | −0.02 | 0.01 * | −0.01 | −0.32 * | −0.03 |
| Housing (ref: 1- to 3-room HDB flat) | |||||
| 4- or 5-room HDB flat | −0.01 | 0.02 * | 0.04 * | 0.17 ** | −0.02 |
| Private housing | −0.06 ** | 0.01 * | 0.10 ** | 0.14 ** | −0.08 * |
Notes. * p < 0.05, ** p < 0.01. HDB = Housing Development Board.
Appendix C
Appendix C presents the five hypothesised path models.
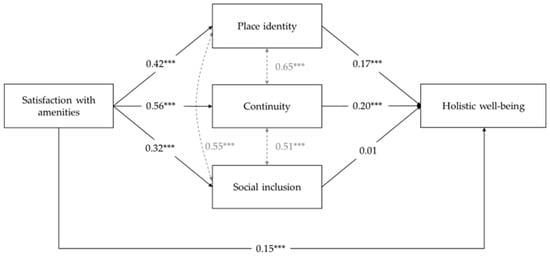
Figure A1.
Model 1: Amenity satisfaction. Notes. *** p < 0.01.
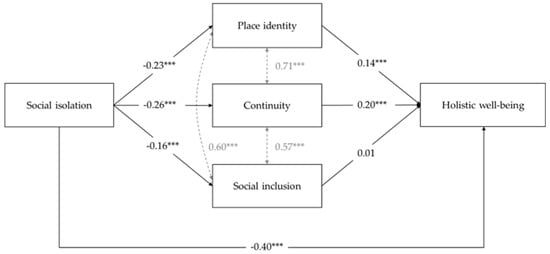
Figure A2.
Model 2: Social isolation. Notes. *** p < 0.01.
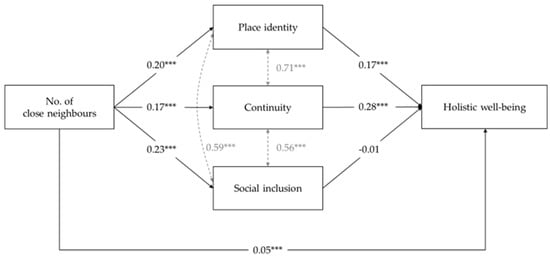
Figure A3.
Model 3: Close neighbours. Notes. *** p < 0.01.
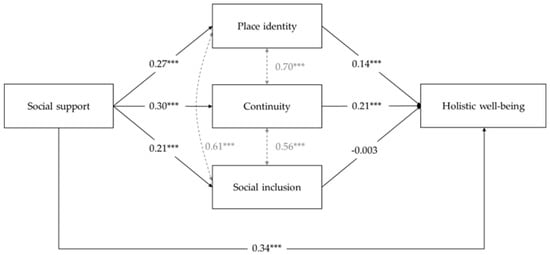
Figure A4.
Model 4: Social support. Notes. *** p < 0.01.
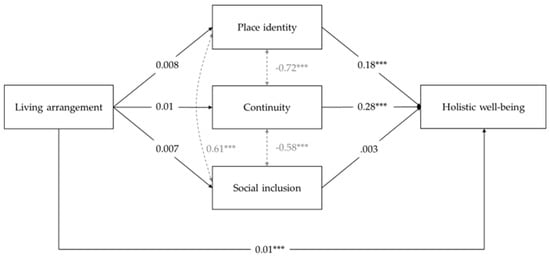
Figure A5.
Model 5: Living arrangement. Notes. *** p < 0.01.
References
- Dommaraju, P. Transformation of the Family Structure in Southeast Asia: Trends and Implications. In Populations and Precarity during the COVID-19 Pandemic: Southeast Asian Perspectives; ISEAS Publishing: Singapore, 2023; pp. 12–27. ISBN 978-981-4951-50-0. [Google Scholar]
- OECD; World Health Organization. Health at a Glance: Asia/Pacific 2022: Measuring Progress Towards Universal Health Coverage; Health at a Glance: Asia/Pacific; OECD: Paris, France, 2022; ISBN 978-92-64-42245-2. [Google Scholar]
- Ang, S. ‘If It Comes, It Comes’: Marriage? Kids? Singles Are in No Rush to Settle Down. The Straits Times, 3 July 2024. [Google Scholar]
- Singapore Department of Statistics Births and Fertility Rates. Available online: https://tablebuilder.singstat.gov.sg/table/TS/M810091#! (accessed on 26 December 2024).
- Ministry of Social and Family Development. Family Trends Report; Ministry of Social and Family Development: Singapore, 2024.
- United Nations, Economic and Social Commission for Asia and the Pacific (ESCAP). Asia-Pacific Report on Population Ageing 2022: Trends, Policies and Good Practices Regarding Older Persons and Population Ageing; ESCAP: Bangkok, Thailand, 2022. [Google Scholar]
- Khoo, L.-M.; Chan, D.D.; Firdaus, A. Towards Ageing Well: Planning a Future-Ready Singapore; Urban Systems Studies; Centre for Liveable Cities: Singapore, 2021; ISBN 9789811486876.
- Age Well SG Active Ageing. Available online: https://www.agewell.gov.sg/active-ageing/ (accessed on 6 June 2024).
- Khoo, T.C.; Wong, S.; Khoo, L.-M. (Eds.) Housing: Turning Squatters into Stakeholders; Cengage Learning: Singapore, 2013; ISBN 978-981-4510-12-7. [Google Scholar]
- Gibson, K.; Brittain, K.; McLellan, E.; Kingston, A.; Wilkinson, H.; Robinson, L. ‘It’s Where I Belong’: What Does It Mean to Age in Place from the Perspective of People Aged 80 and above? A Longitudinal Qualitative Study (Wave One). BMC Geriatr. 2024, 24, 524. [Google Scholar] [CrossRef]
- Kydd, A.; Fleming, A.; Gardner, S.; Hafford-Letchfield, T. Ageism in the Third Age. In Contemporary Perspectives on Ageism; Ayalon, L., Tesch-Römer, C., Eds.; International Perspectives on Aging; Springer International Publishing: Cham, Switzerland, 2018; Volume 19, pp. 115–130. ISBN 978-3-319-73819-2. [Google Scholar]
- Chin, S.F. 8 in 10 Older Adults in Singapore Prefer to Age in Their Current Homes: SMU Study. The Straits Times, 23 October 2024. [Google Scholar]
- Pani-Harreman, K.E.; Bours, G.J.J.W.; Zander, I.; Kempen, G.I.J.M.; van Duren, J.M.A. Definitions, Key Themes and Aspects of ‘Ageing in Place’: A Scoping Review. Ageing Soc. 2021, 41, 2026–2059. [Google Scholar] [CrossRef]
- Pinazo-Hernandis, S.; Blanco-Molina, M.; Ortega-Moreno, R. Aging in Place: Connections, Relationships, Social Participation and Social Support in the Face of Crisis Situations. Int. J. Environ. Res. Public Health 2022, 19, 16623. [Google Scholar] [CrossRef] [PubMed]
- Bigonnesse, C.; Chaudhury, H. Ageing in Place Processes in the Neighbourhood Environment: A Proposed Conceptual Framework from a Capability Approach. Eur. J. Ageing 2021, 19, 63–74. [Google Scholar] [CrossRef]
- Sixsmith, A.; Sixsmith, J. Ageing in place in the United Kingdom. Ageing Int. 2008, 32, 219. [Google Scholar] [CrossRef]
- Wiles, J.L.; Leibing, A.; Guberman, N.; Reeve, J.; Allen, R.E.S. The Meaning of “Aging in Place” to Older People. Gerontologist 2012, 52, 357–366. [Google Scholar] [CrossRef]
- Choi, Y.J. Understanding Aging in Place: Home and Community Features, Perceived Age-Friendliness of Community, and Intention Toward Aging in Place. Gerontologist 2022, 62, 46–55. [Google Scholar] [CrossRef]
- Ahn, M.; Kang, J.; Kwon, H.J. The Concept of Aging in Place as Intention. Gerontologist 2019, 60, 50–59. [Google Scholar] [CrossRef]
- Rioux, L.; Werner, C. Residential Satisfaction among Aging People Living in Place. J. Environ. Psychol. 2011, 31, 158–169. [Google Scholar] [CrossRef]
- Gorczyca, K.; Grabiński, T. Ageing in Place: Residential Satisfaction in Polish Housing-Estate Communities. Ageing Soc. 2018, 38, 2410–2434. [Google Scholar] [CrossRef]
- Webber, R.; May, V.; Lewis, C. Ageing in Place Over Time: The Making and Unmaking of Home. Sociol. Res. Online 2023, 28, 759–774. [Google Scholar] [CrossRef]
- Boley, B.B.; Strzelecka, M.; Yeager, E.P.; Ribeiro, M.A.; Aleshinloye, K.D.; Woosnam, K.M.; Mimbs, B.P. Measuring Place Attachment with the Abbreviated Place Attachment Scale (APAS). J. Environ. Psychol. 2021, 74, 101577. [Google Scholar] [CrossRef]
- Scannell, L.; Gifford, R. Defining Place Attachment: A Tripartite Organizing Framework. J. Environ. Psychol. 2010, 30, 1–10. [Google Scholar] [CrossRef]
- Lebrusán, I.; Gómez, M.V. The Importance of Place Attachment in the Understanding of Ageing in Place: “The Stones Know Me”. Int. J. Environ. Res. Public Health 2022, 19, 17052. [Google Scholar] [CrossRef]
- Atchley, R.C. A Continuity Theory of Normal Aging. Gerontologist 1989, 29, 183–190. [Google Scholar] [CrossRef]
- Li, X.; Zhang, T. Place Identity and Older Residents’ Coping Strategies While Ageing in Declining Neighbourhoods of Urban China. J. Environ. Psychol. 2021, 78, 101692. [Google Scholar] [CrossRef]
- Sun, Y.; Ng, M.K.; Chao, T.-Y.S.; He, S.; Mok, S.H. The Impact of Place Attachment on Well-Being for Older People in High-Density Urban Environment: A Qualitative Study. J. Aging Soc. Policy 2024, 36, 241–261. [Google Scholar] [CrossRef]
- Cheng, S.-P.; Tsai, T.-I.; Chen, I.-J. Development and Psychometric Evaluation of the Place Attachment for Community-Dwelling Older Adults Scale. J. Appl. Gerontol. 2021, 40, 620–628. [Google Scholar] [CrossRef]
- Hillcoat-Nallétamby, S.; Ogg, J. Moving beyond ‘Ageing in Place’: Older People’s Dislikes about Their Home and Neighbourhood Environments as a Motive for Wishing to Move. Ageing Soc. 2014, 34, 1771–1796. [Google Scholar] [CrossRef]
- Ng, S.-I.; Lim, X.-J.; Hsu, H.-C. The Importance of Age-Friendly City on Older People’s Continuity and Life Satisfaction. Int. J. Environ. Res. Public Health 2021, 18, 7252. [Google Scholar] [CrossRef]
- Van Orden, K.A.; Lutz, J. Peer Support for Older Adults. In Peer Support in Medicine: A Quick Guide; Springer Nature Switzerland AG: Cham, Switzerland, 2021; pp. 115–129. ISBN 978-3-030-58659-1. [Google Scholar]
- Raue, P.J. The Promise of Peer-Led Interventions for Older Adults. Am. J. Geriatr. Psychiatry 2023, 31, 596–597. [Google Scholar] [CrossRef]
- E, J.; Xia, B.; Chen, Q.; Buys, L.; Susilawati, C.; Drogemuller, R. Impact of the Built Environment on Ageing in Place: A Systematic Overview of Reviews. Buildings 2024, 14, 2355. [Google Scholar] [CrossRef]
- Bhuyan, M.R.; Yuen, B. Older Adults’ Views of the Connections between Neighbourhood Built Environment and Health in Singapore. Popul. Ageing 2022, 15, 279–299. [Google Scholar] [CrossRef]
- Aliyas, Z. Physical, Mental, and Physiological Health Benefits of Green and Blue Outdoor Spaces among Elderly People. Int. J. Environ. Health Res. 2021, 31, 703–714. [Google Scholar] [CrossRef]
- Angell, K. Ageing in Place and Autonomy: Is the ‘Age-Friendly’ City Initiative Too Elderly-Friendly? In Ageing without Ageism? Bognar, G., Gosseries, A., Eds.; Oxford University Press: Oxford, UK, 2023; pp. 214–228. ISBN 978-0-19-289409-0. [Google Scholar]
- Lowies, B.; Lushington, K. Ageing-in-Place. In Research Handbook on Housing, the Home and Society; Jacobs, K., Flanagan, K., De Vries, J., MacDonald, E., Eds.; Edward Elgar Publishing: Cheltenham, UK, 2024; pp. 387–411. ISBN 978-1-80037-597-0. [Google Scholar]
- Ministry of National Development Designing an Age-Friendly City. Available online: https://www.mnd.gov.sg/mndlink/2019/nov-dec/article2.htm (accessed on 18 December 2024).
- Ng, M. Nee Soon Central CC, First to Be Located in a Mall, Officially Opens, Pilots Govt Service Centre. Available online: https://www.straitstimes.com/singapore/nee-soon-central-cc-first-to-be-located-in-a-mall-officially-opens-pilots-govt-service-centre (accessed on 26 December 2024).
- Nee Soon Town Council. Nee Soon News. 2023. Available online: https://www.nstc.org.sg/wp-content/uploads/2023/03/NSN40-1.pdf (accessed on 26 December 2024).
- Patterson, S.E.; Margolis, R. Family Ties and Older Adult Well-Being: Incorporating Social Networks and Proximity. J. Gerontol. Ser. B 2023, 78, 2080–2089. [Google Scholar] [CrossRef]
- ZhaoYang, R.; Silwinski, M.; Martire, L.M.; Smyth, J.M. Social Interactions and Physical Symptoms in Daily Life: Quality Matters for Older Adults, Quantity Matters for Younger Adults. Psychol. Health 2019, 34, 867–885. [Google Scholar] [CrossRef]
- Melchiorre, M.G.; Socci, M.; Lamura, G.; Quattrini, S. Perceived Loneliness, Social Isolation, and Social Support Resources of Frail Older People Ageing in Place Alone in Italy. Healthcare 2024, 12, 875. [Google Scholar] [CrossRef]
- Chen, J.-J.; Liu, L.-F.; Chen, S.-M. The Role of Place Attachment in the Relationship between Attitudes toward Aging and Subjective Well-Being among Community-Dwelling Older Adults in Taiwan. Healthcare 2024, 12, 981. [Google Scholar] [CrossRef] [PubMed]
- The Mediating Effect of Place Attahcment on Attitude toward Aging and Psychological Wellbeing. Innov. Aging 2023, 7, 356. [CrossRef]
- Ruggeri, K.; Garcia-Garzon, E.; Maguire, Á.; Matz, S.; Huppert, F.A. Well-Being Is More than Happiness and Life Satisfaction: A Multidimensional Analysis of 21 Countries. Health Qual. Life Outcomes 2020, 18, 192. [Google Scholar] [CrossRef]
- Ryff, C.D. Happiness Is Everything, or Is It? Explorations on the Meaning of Psychological Well-Being. J. Personal. Soc. Psychol. 1989, 57, 1069–1081. [Google Scholar] [CrossRef]
- Keyes, C.L.M. Social Well-Being. Soc. Psychol. Q. 1998, 61, 121–140. [Google Scholar] [CrossRef]
- Booysen, F. An Overview and Evaluation of Composite Indices of Development. Soc. Indic. Res. 2002, 59, 115–151. [Google Scholar] [CrossRef]
- Straughan, P.; Cheong, G.; Lim, W.S.; Tan, Y.E.; Wong, Y.C. Singapore Resilience Study; Centre for Research on Successful Ageing: Singapore, 2023. [Google Scholar]
- Sherbourne, C.D.; Stewart, A.L. The MOS Social Support Survey. Soc. Sci. Med. 1991, 32, 705–714. [Google Scholar] [CrossRef]
- Ng, C.W.; Tan, W.S.; Gunapal, P.P.; Wong, L.Y.; Heng, B.H. Association of Socioeconomic Status (SES) and Social Support with Depressive Symptoms among the Elderly in Singapore. Ann. Acad. Med. Singap. 2014, 43, 576–587. [Google Scholar] [CrossRef]
- Department of Statistics Singapore. Report on the Household Expenditure Survey 2023; Department of Statistics Singapore: Singapore, 2024.
- Kline, R.B. Principles and Practice of Structural Equation Modeling; Guilford Press: New York, NY, USA, 2023. [Google Scholar]
- Barrenetxea, J.; Yang, Y.; Pan, A.; Feng, Q.; Koh, W.-P. Social Disconnection and Living Arrangements among Older Adults: The Singapore Chinese Health Study. Gerontology 2022, 68, 330–338. [Google Scholar] [CrossRef]
- Cohen, S.; Syme, S.L. Issues in the Study and Application of Social Support. In Social Support and Health; Cohen, S., Syme, S.L., Eds.; Academic Press: Cambridge, MA, USA, 1985. [Google Scholar]
- Cohen, S.; Wills, T.A. Stress, Social Support, and the Buffering Hypothesis. Psychol. Bull. 1985, 98, 310–357. [Google Scholar] [CrossRef] [PubMed]
- Tadai, M.E.; Straughan, P.T.; Cheong, G.; Yi, R.N.W.; Er, T.Y. The Effects of SES, Social Support, and Resilience on Older Adults’ Well-Being during COVID-19: Evidence from Singapore. Urban Gov. 2023, 3, 14–21. [Google Scholar] [CrossRef]
- Berkman, L.F.; Krishna, A. Social Network Epidemiology. In Social Epidemiology; Berkman, L.F., Kawachi, I., Glymour, M.M., Eds.; Oxford University Press: Oxford, UK, 2014; pp. 234–289. ISBN 978-0-19-537790-3. [Google Scholar]
- World Health Organization. Global Age-Friendly Cities: A Guide; World Health Organization: Geneva, Switzerland, 2007. [Google Scholar]
- Latham-Mintus, K.; Montgomery, L.; Wilson, J. Understanding the Role of Social Infrastructure for Older Adult Engagement across Geographic Context. Innov. Aging 2022, 6, 420. [Google Scholar] [CrossRef]
- Chong, K.H. Reclamation of Urban Voids and the Return of the “Kampung Spirit” in Singapore’s Public Housing. In Creative Ageing Cities; Chong, K.H., Cho, M., Eds.; Routledge: London, UK, 2018. [Google Scholar]
- Lane, A.P.; Hou, Y.; Hooi Wong, C.; Yuen, B. Cross-Sectional Associations of Neighborhood Third Places with Social Health among Community-Dwelling Older Adults. Soc. Sci. Med. 2020, 258, 113057. [Google Scholar] [CrossRef]
- Loi, E. One-Third of S’pore Resident Households Own Cars, down from 40 per Cent a Decade Ago. The Straits Times, 6 November 2023. [Google Scholar]
- Mack, R.; Salmoni, A.; Viverais-Dressler, G.; Porter, E.; Garg, R. Perceived Risks to Independent Living: The Views of Older, Community-Dwelling Adults. Gerontologist 1997, 37, 729–736. [Google Scholar] [CrossRef] [PubMed]
- Clark, W.A.V.; Ong ViforJ, R.; Phelps, C. Place Attachment and Aging in Place: Preferences and Disruptions. Res. Aging 2024, 46, 179–196. [Google Scholar] [CrossRef] [PubMed]
Disclaimer/Publisher’s Note: The statements, opinions and data contained in all publications are solely those of the individual author(s) and contributor(s) and not of MDPI and/or the editor(s). MDPI and/or the editor(s) disclaim responsibility for any injury to people or property resulting from any ideas, methods, instructions or products referred to in the content. |
© 2025 by the authors. Licensee MDPI, Basel, Switzerland. This article is an open access article distributed under the terms and conditions of the Creative Commons Attribution (CC BY) license (https://creativecommons.org/licenses/by/4.0/).