Article

Establishing and Validating a Predictive Model for the Risk of In-Hospital Mortality Post-Resuscitation in Patients with Sudden Death, as Well as Conducting Clinical Analysis Research: A Case-Control Study

1
Department of Emergency Medicine, The Central Hospital of Wuhan, Tongji Medical College, Huazhong University of Science and Technology, Wuhan 430014, China
2
Department of Cardiovascular, The Central Hospital of Wuhan, Tongji Medical College, Huazhong University of Science and Technology, Wuhan 430014, China
*
Author to whom correspondence should be addressed.
Emerg. Care Med. 2025, 2(1), 15; https://doi.org/10.3390/ecm2010015
Submission received: 24 November 2024 / Revised: 13 February 2025 / Accepted: 4 March 2025 / Published: 19 March 2025

Abstract

:
Objective: Sudden Death (SD) is a high-mortality emergency event that typically occurs within one hour of symptom onset. Accurate risk prediction is essential for optimizing post-resuscitation care. This study aims to enhance the survival rate of patients experiencing sudden death by developing and validating a risk prediction model for in-hospital mortality following successful resuscitation. Method: This study is a retrospective analysis of data that were collected prospectively from a standardized clinical database. All data were recorded at the time of patient admission using a predefined protocol to ensure consistency and accuracy. We retrospectively analyzed the data collected from 295 patients who experienced sudden death and achieved successful resuscitation at Wuhan Central Hospital from January 2017 to June 2024. The patients were assigned to groups using a randomization process into training and validation sets using k-fold cross-validation and further categorized within these sets based on in-hospital mortality as the outcome. A prediction model was constructed, and its efficacy was validated using logistic regression analysis, which was visualized with nomograms. Results: The results of this regression analysis of the training set demonstrated the actual length of hospital stay, in-hospital norepinephrine dosage, post-resuscitation respiratory rate, and sinus rhythm after resuscitation as independent influencing factors (p < 0.05), which formed the basis of the prediction model. The analysis of the training set exhibited high discriminative ability, with an area under the ROC curve (AUC) of 0.860, which exceeds the commonly accepted threshold for good classification performance, and the calibration, applicability, and reasonableness were all favorable. When the model was applied to the validation set, the AUC was 0.758, and the discrimination, calibration, applicability, and reasonableness of the validation set were also satisfactory. Conclusions: the main conclusion is that a risk prediction model for in-hospital mortality following resuscitation from sudden death was successfully developed and internally validated, offering a significant advancement in clinical decision-making support.

1. Introduction

Sudden death (SD) refers to death that occurs unexpectedly due to cardiac causes, typically within one hour after the onset of symptoms [1,2]. Previous studies have indicated [3,4] that the risk of sudden death is significantly elevated, with the incidence of cardiac-related sudden death events reaching 99.4 per 100,000 individuals in Australia. The overall incidence rate in Europe was 84.0 per 100,000. Survival rates appear to be significantly lower in Asia Pacific countries, with the PAROS (Pan-Asian Resuscitation Outcomes Study) reporting survival to hospital discharge rates as being 5.6% in Japan, 9.9% in Korea, 1.0% in Malaysia, 2.5% in Singapore, 2.7% in Thailand, and 4.8% in Taiwan [5]. In contrast, the annual incidence of out-of-hospital sudden-death patients is approximately 0.1%, with survival rates ranging from 3.1% to 20.4% in Western countries [6]. Sudden death is characterized by its high incidence and mortality rates, unpredictability [7], and significant sensitivity to emergency response times, which collectively pose a considerable burden on public health.
Cardiopulmonary resuscitation (CPR) is a critical emergency intervention for patients experiencing sudden death. However, even if a patient is successfully resuscitated and spontaneous circulation is restored, they remain at a significant risk of in-hospital mortality. A study conducted in the United States indicated that the survival rate after discharge was only 10.6% [8]. Therefore, it is essential to identify patients at high risk for in-hospital death following successful resuscitation from sudden death.
Previous studies [9,10,11,12,13] have demonstrated that various factors, including age, duration of CPR, serum albumin levels, procalcitonin-to-albumin ratio, neutrophil-to-lymphocyte ratio, lactate levels, initial cardiac rhythm, the use of sodium bicarbonate (SB), and the administration of epinephrine and norepinephrine, are associated with the risk of post-hospitalization mortality. Each study has examined different aspects of this issue, providing insights into factors that may influence the risk of re-hospitalization mortality following the return of spontaneous circulation in patients who have experienced sudden death. Our pre-specified hypotheses regarding the influencing factors on the recurrence of in-hospital mortality following the return of spontaneous circulation in patients with sudden death were tested based on these findings.
This study aims to investigate additional factors that may influence the risk of re-hospitalization and mortality following the return of spontaneous circulation in patients who have experienced sudden death. The goal is to enhance clinical assessments of risk factors for re-hospitalization and mortality in these patients, facilitate the early identification of high-risk individuals, and implement personalized treatment strategies to improve patient outcomes. We will develop a risk nomogram prediction model for re-hospitalization and mortality post-resuscitation circulation in patients with sudden death, which can provide valuable support for clinical decision-making.

2. Materials and Methods

2.1. Study Participants and Inclusion/Exclusion Criteria

This study retrospectively analyzed a cohort of 295 patients who successfully achieved spontaneous circulation following CPR in the emergency department of Wuhan Central Hospital between January 2017 and June 2024. All resuscitation efforts were conducted in accordance with established CPR protocols [14]. Furthermore, the study received approval from the Medical Ethics Committee of Wuhan Central Hospital.
(1)
Inclusion criteria: This study includes the medical records of patients who experienced out-of-hospital cardiac arrest as diagnosed by pre-hospital emergency services. Eligible participants are those who were successfully resuscitated and subsequently admitted to the hospital for further treatment, as well as individuals with a documented history of underlying medical conditions, such as hypertension, diabetes, and coronary artery disease.
(2)
Exclusion criteria: patients with identifiable causes such as trauma, pregnancy, drowning, and similar conditions, as well as those with an unclear medical history, significant deficiencies in research data, and discrepancies or conflicts between the patient and the medical team, will be excluded.

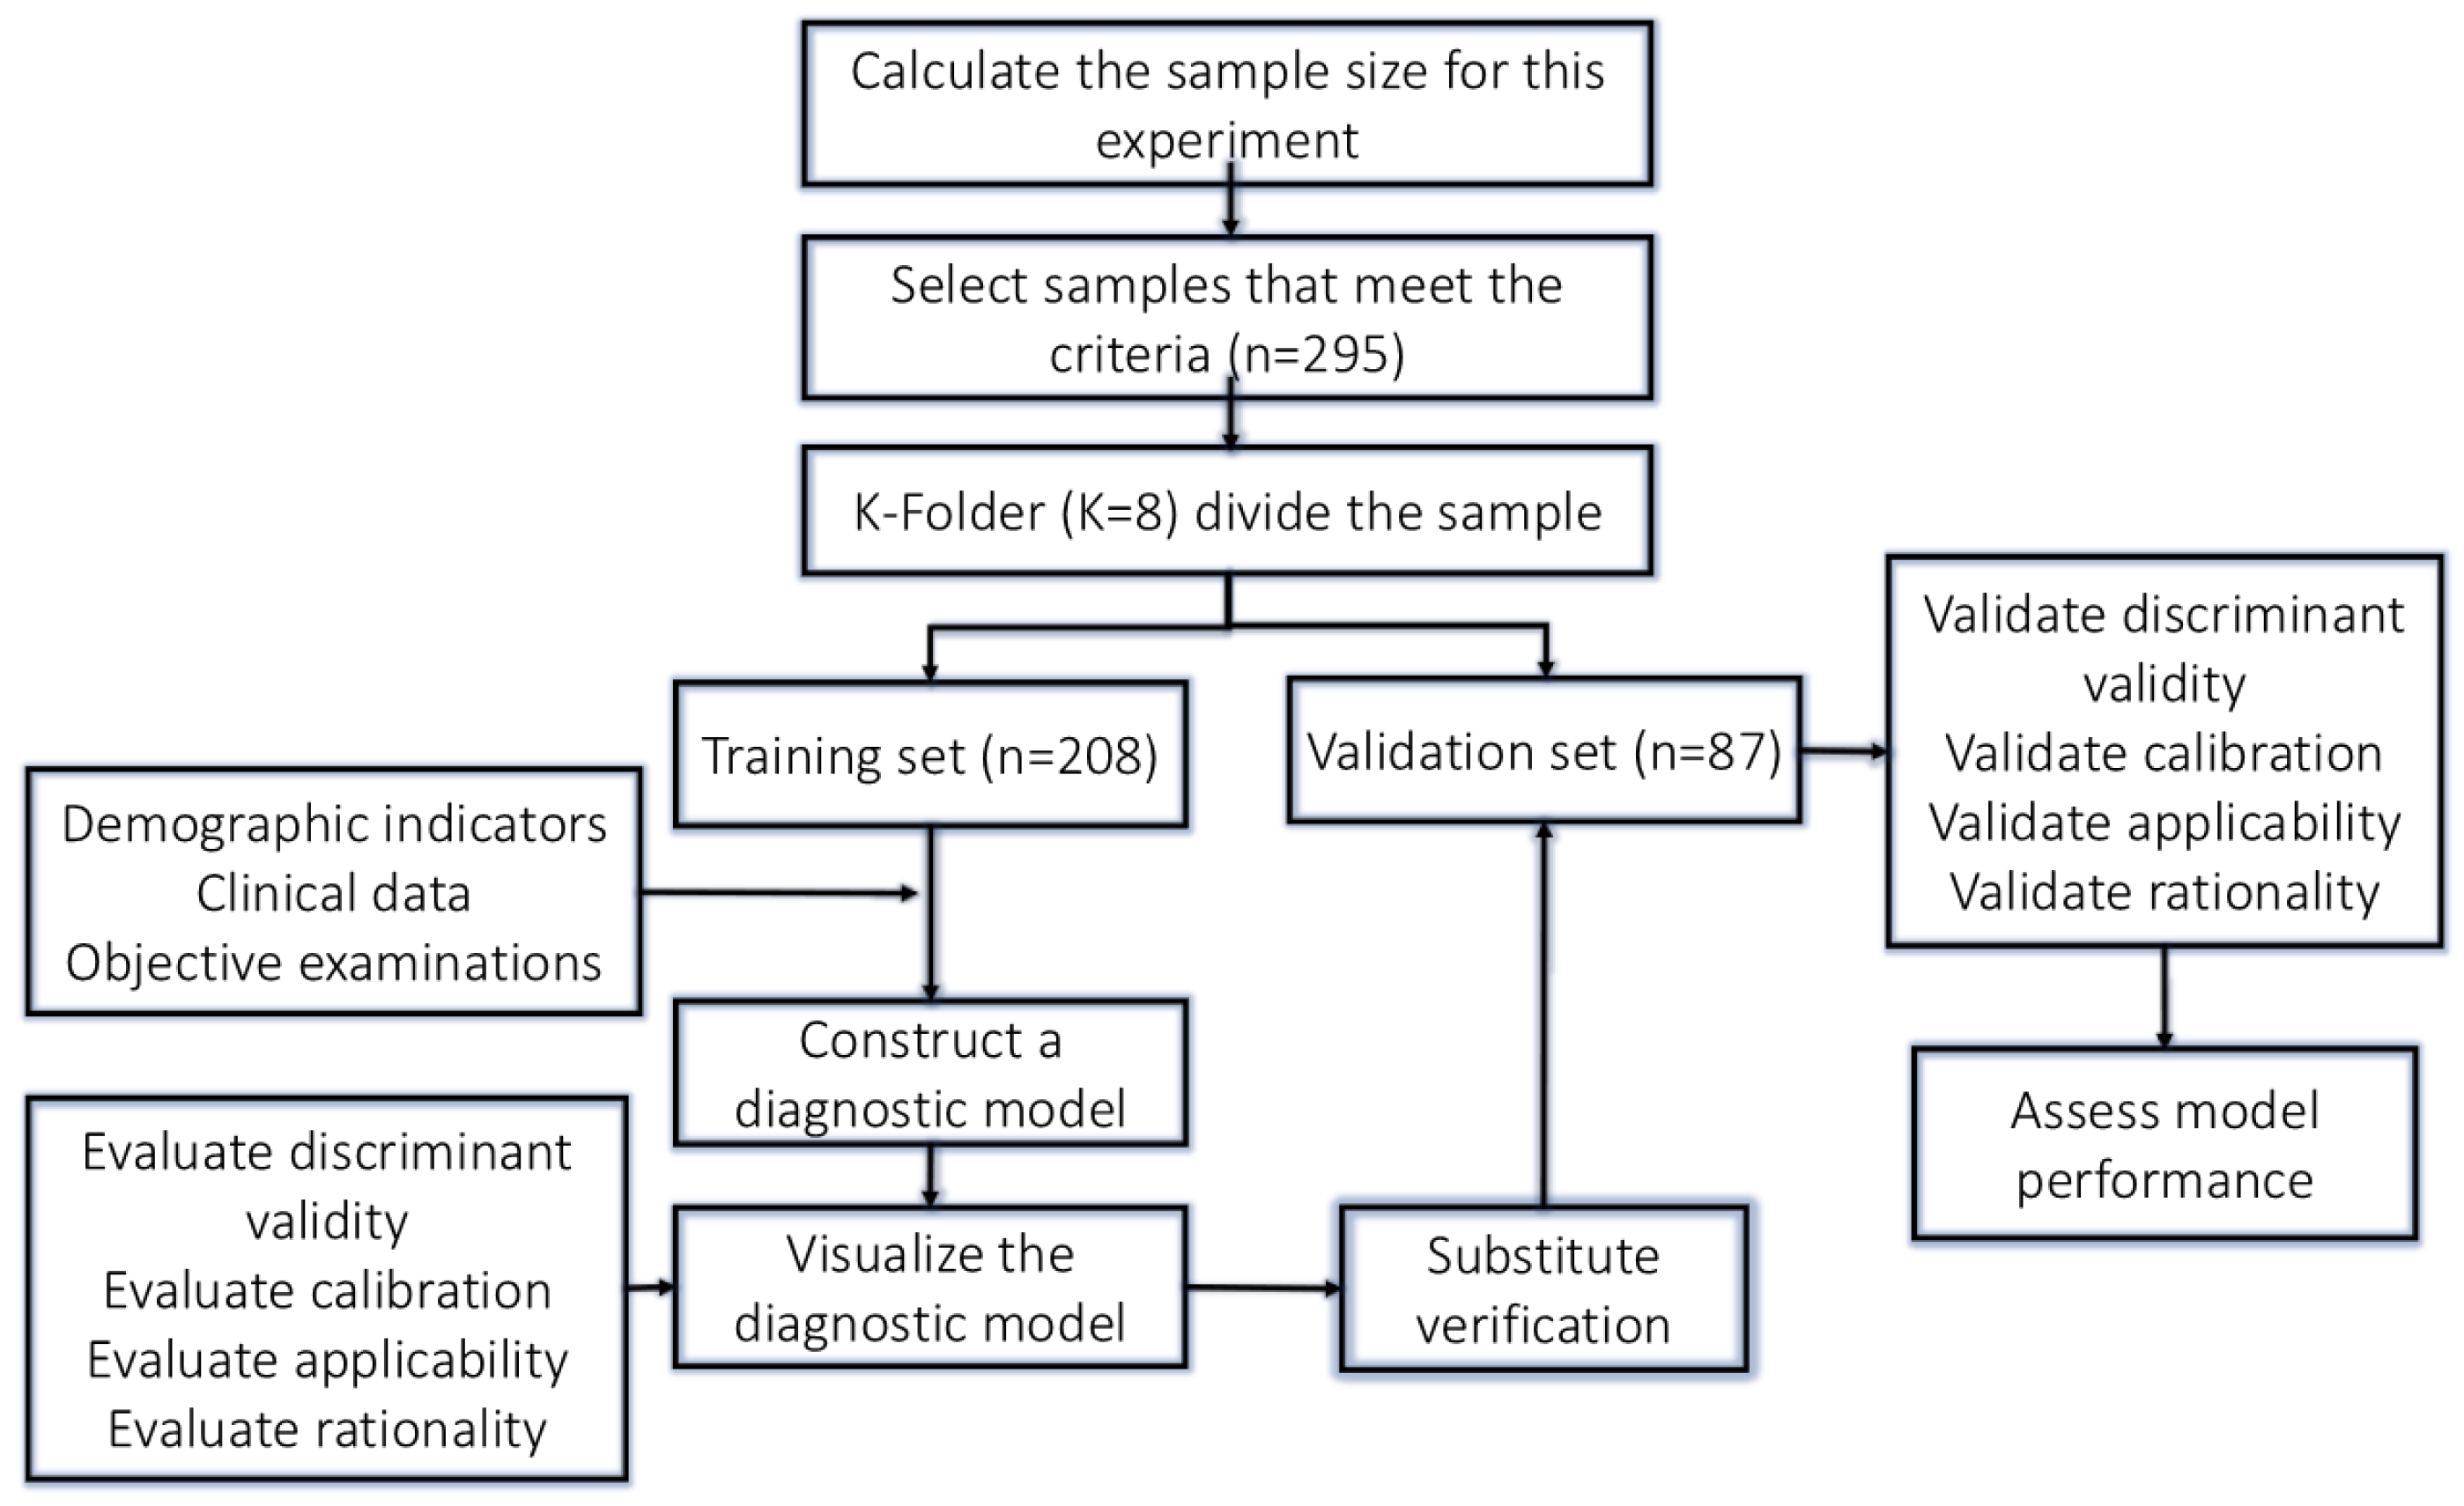
2.2. Sample Size Calculation

This study is a case-control investigation focusing on the risk of in-hospital death following the resuscitation of patients who have experienced sudden death. The primary research variable is binary, indicating whether or not in-hospital death occurs. The final determination of research parameters is as follows: (1) Based on the patient’s final outcome regarding in-hospital death, and considering the era and regional context of the aforementioned flow survey reports along with existing information bias, this study decided to use the American Heart Association Get With The Guidelines®—Resuscitation registry (GWTG-R) data from the 2017 survey as the main basis for this item’s parameters, specifically 25% reported by GWTG-R in 2017. (2) Research error: Based on a review of previous information as a pre-trial result, a simple observation of 150 cases revealed that 30 patients who experienced sudden death were successfully resuscitated and did not die in the hospital, resulting in an incidence rate of 20%. Therefore, the relative error is 5%, considering this study is a two-sided test, thus taking 10%. (3) The Type I error (α) of the confidence level is 5%; thus, 1–5% is 0.95. The above information is imported input the PASS 11.0 to calculate the initial sample size of 264 cases.

2.3. Research Sample Grouping

To ensure balanced representation of key variables and to minimize potential confounding effects, we used a stratified K-fold cross-validation approach to divide the dataset into training and validation sets. Specifically, the dataset was randomly divided into eight parts (with K set to eight), and each fold was stratified based on key variables such as age and initial cardiac rhythm. Seven parts were used for training the model, while the remaining part was used for validation. This process was repeated ten times, and the final model parameters and evaluation metrics were determined based on the average of the ten repetitions. The flow chart showed the selection of patients in the study (Figure 1).

2.4. Data Collection

Data were prospectively collected from all eligible patients using a standardized data collection form, which included demographic information, medical history, and laboratory results. The covariate data for the research population encompassed age, gender, past medical history (including hypertension, diabetes, coronary heart disease, malignant tumors, and significant surgical history, among others), duration of stay in the emergency department, the actual length of hospitalization, duration of CPR, initial vital signs following resuscitation (such as respiratory rate, pulse, and blood pressure), initial laboratory test results obtained within 24 h of admission (including albumin, lactate, prothrombin time, platelet count, and electrolytes, among others), in-hospital medication usage (including total doses of epinephrine or norepinephrine, mannitol, anti-infective treatments, and gastric protection therapies, among others), recovery of initial sinus rhythm post-resuscitation, and changes in ST-T segments on the electrocardiogram, among other factors.

2.5. Selection of Independent Variables

Given the numerous sample covariates, the Least Absolute Shrinkage and Selection Operator (LASSO) regression is utilized to independently screen clinical indicators and identify the optimal feature variables. The selection of the best independent variables is determined based on a specified number of variables and the choice between the best penalty coefficient or its one standard error (lambda.1 se) result. Theoretically, selecting lambda.1 se as the optimal lambda can more effectively mitigate the issue of model overfitting [15]. All independent variables are processed by constructing a penalty function using the glmnet package for LASSO regression, and the variables identified through LASSO regression undergo multicollinearity screening.

2.6. Statistical Analysis

We statistically explored these effects using R/R-Studio. The results were considered statistically significant when the p-value was less than 0.05. Categorical data are presented as the number of cases (n, %). Comparisons between two categorical datasets were conducted using chi-square tests, including the Pearson chi-square test, Yates’ corrected chi-square test, and Fisher’s exact probability test. Normally distributed measurement data are reported as mean ± standard deviation, while measurement data with a skewed distribution are expressed as median (M) and interquartile range [P25, P75]. The strategy for comparing two sets of measurement data is as follows: if the data are normally distributed and the variances are equal, the independent samples t-test is used; if the data are normally distributed or approximately normally distributed but the variances are unequal, Welch’s t-test is applied; and if the data are skewed, the nonparametric Mann–Whitney U test is utilized.
Binary logistic regression analysis was conducted to assess risk factors and model the relationships between variables. To investigate this statistically, we calculated the regression coefficients, odds ratios, 95% confidence intervals (95% CI), and p-values for each variable. The model’s performance was evaluated and validated using both training and validation datasets. Key metrics included the area under the receiver operating characteristic curve for assessing discrimination, the Hosmer–Lemeshow (H-L) goodness-of-fit test for evaluating calibration, and decision curve analysis (DCA) for assessing clinical applicability. The AUC, in conjunction with independent covariates and the DCA curve, was used to evaluate the model’s overall validity. Internal validation was conducted using bootstrapping with 1000 resamples to evaluate the model’s stability and generalizability. An AUC between 0.70 and 0.80 indicates moderate discrimination, while an AUC greater than 0.80 indicates high discriminative ability [16]. A p-value greater than 0.05 in the H-L test and a Brier score of less than 0.25 suggest that the model demonstrates good calibration. The DeLong test was employed for AUC comparison, with a p-value less than 0.05 indicating a significant difference between the AUCs of the two models, further assessing the discriminative ability of this model.

3. Results

3.1. Comparison of Patient Characteristics and Baseline Data

This study collected data from 295 patients who experienced sudden death but were successfully resuscitated and subsequently admitted to the hospital. Among these patients, 168 (56.9%) died during their hospital stay. In the training set of 208 patients, 110 died in the hospital following resuscitation, while in the validation set of 87 patients, 49 died in the hospital after successful resuscitation.
Patients who died in-hospital within the training set experienced a longer duration of CPR compared to those who survived. Older age was significantly associated with higher in-hospital mortality, likely due to a reduced physiological reserve and an increased burden of comorbidities. Differences in outcomes between sexes may reflect variations in underlying cardiovascular risk factors and responses to resuscitation efforts. Additionally, the dosages of epinephrine and norepinephrine administered to deceased patients were higher than those given to survivors. The deceased patients also exhibited elevated levels of serum sodium, red blood cell distribution width coefficient of variation, lactate, procalcitonin, partial pressure of carbon dioxide, arterial blood potassium, and serum potassium compared to their surviving counterparts. Furthermore, the activated partial thromboplastin time, prothrombin time, and thrombin time were significantly longer in patients who died in the hospital. Patients who experienced sudden death and had a longer actual hospital stay, a history of malignant tumors, hypothermia treatment, treatment with sodium bicarbonate, or who required tracheal intubation and mechanical ventilation and patients in the ICU were at a higher risk of in-hospital mortality. Conversely, patients with a history of diabetes and those who presented with an initial sinus rhythm following resuscitation had a lower risk of in-hospital death. Moreover, patients who died in-hospital had lower initial pulse rates, respiratory rates, systolic and diastolic blood pressures, pulse pressure differences, platelet counts, hemoglobin concentrations, serum albumin levels, platelet-to-lymphocyte ratios, and pH values compared to those who survived (p < 0.05). The data are presented in Table 1.

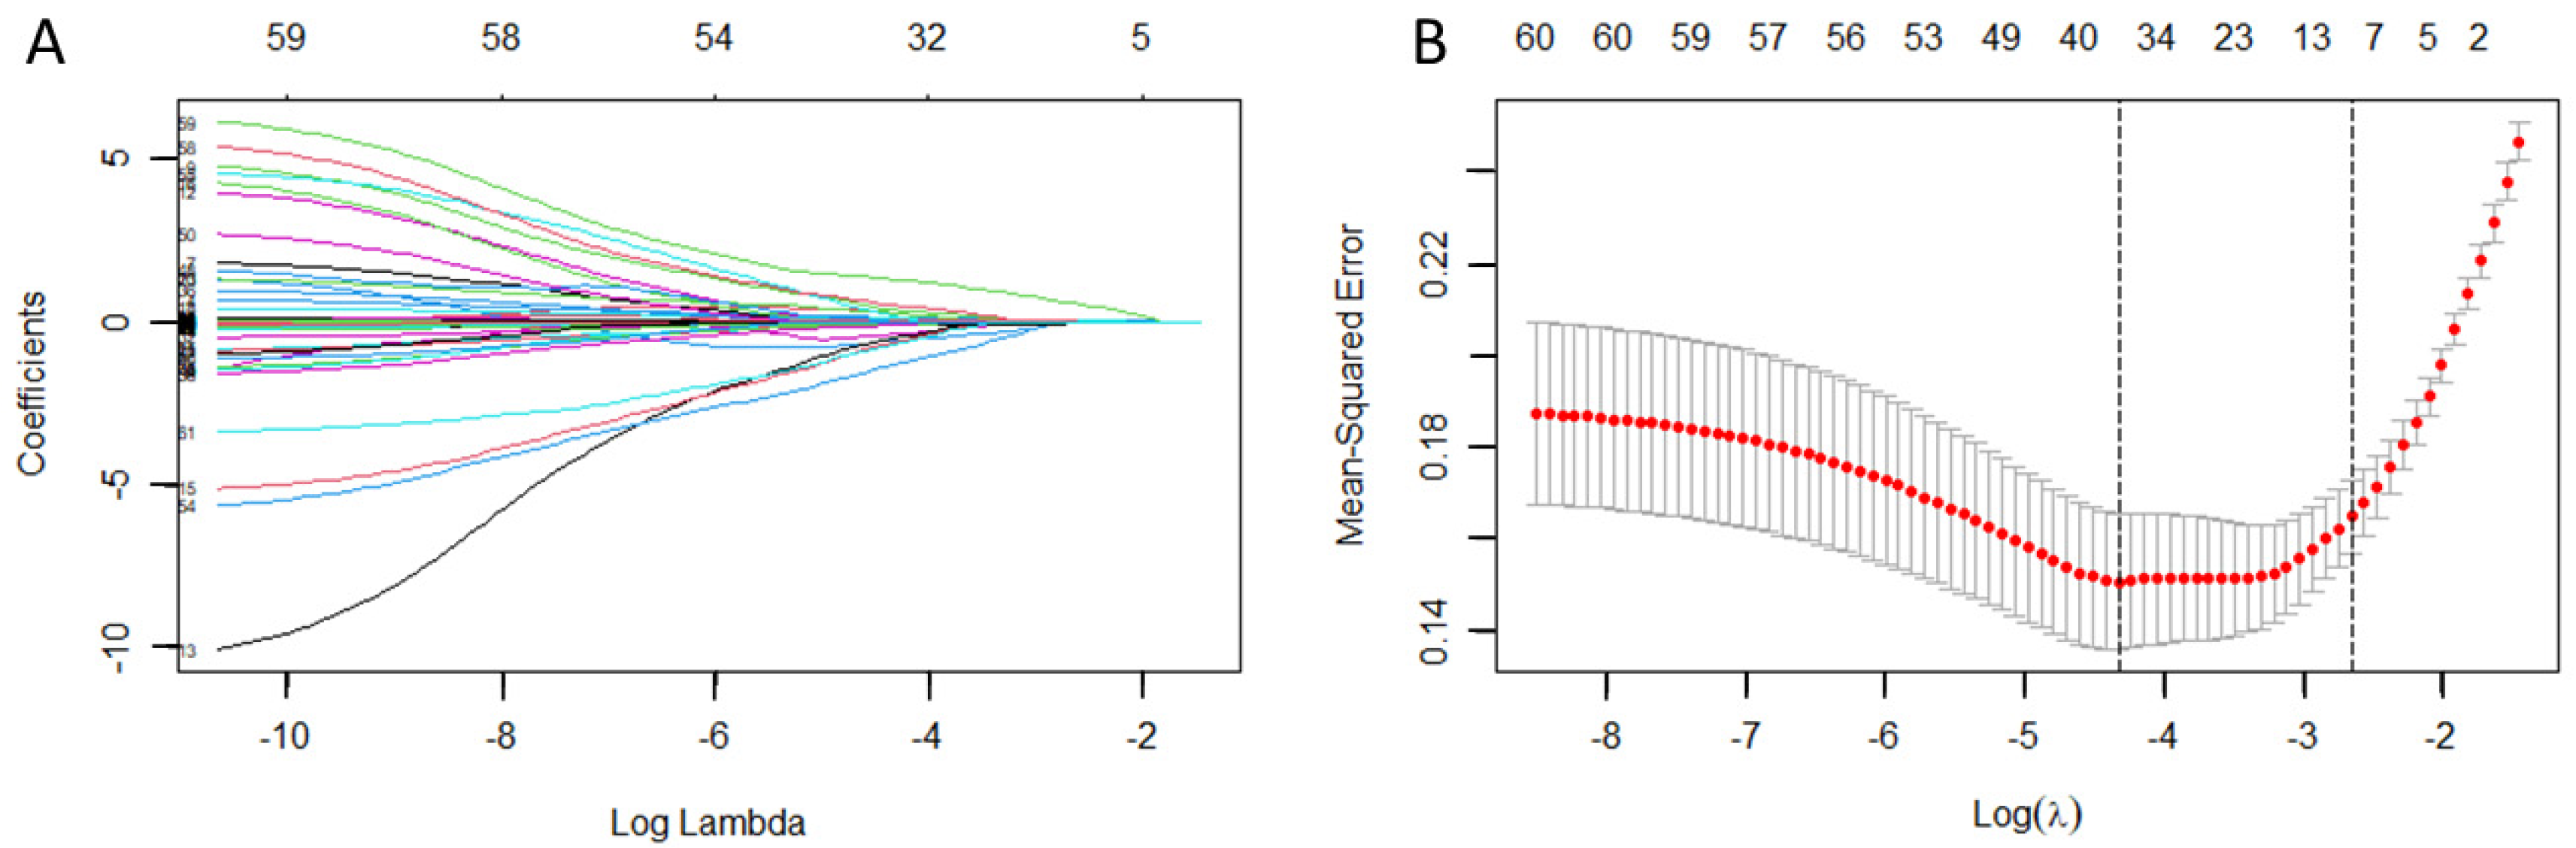
3.2. Identification of Risk Prediction Factors

Eight independent variables were screened using LASSO regression (Figure 2), and subsequent analysis with logistic regression identified the independent predictive factors for in-hospital mortality risk following successful resuscitation of patients who experienced sudden death (Table 2). Our algorithm demonstrated superior results. The multifactorial regression analysis revealed that the actual number of hospitalization days [OR: 1.15, 95% CI (1.06–1.25), p < 0.001], the total dose of in-hospital norepinephrine [OR: 0.99, 95% CI (0.98–0.99), p = 0.005], the respiratory rate after resuscitation [OR: 1.1, 95% CI (1.04–1.16), p = 0.001], and the presence of sinus rhythm after resuscitation [OR: 3.76, 95% CI (1.45–9.73), p = 0.006] were significantly associated with the risk of in-hospital death.

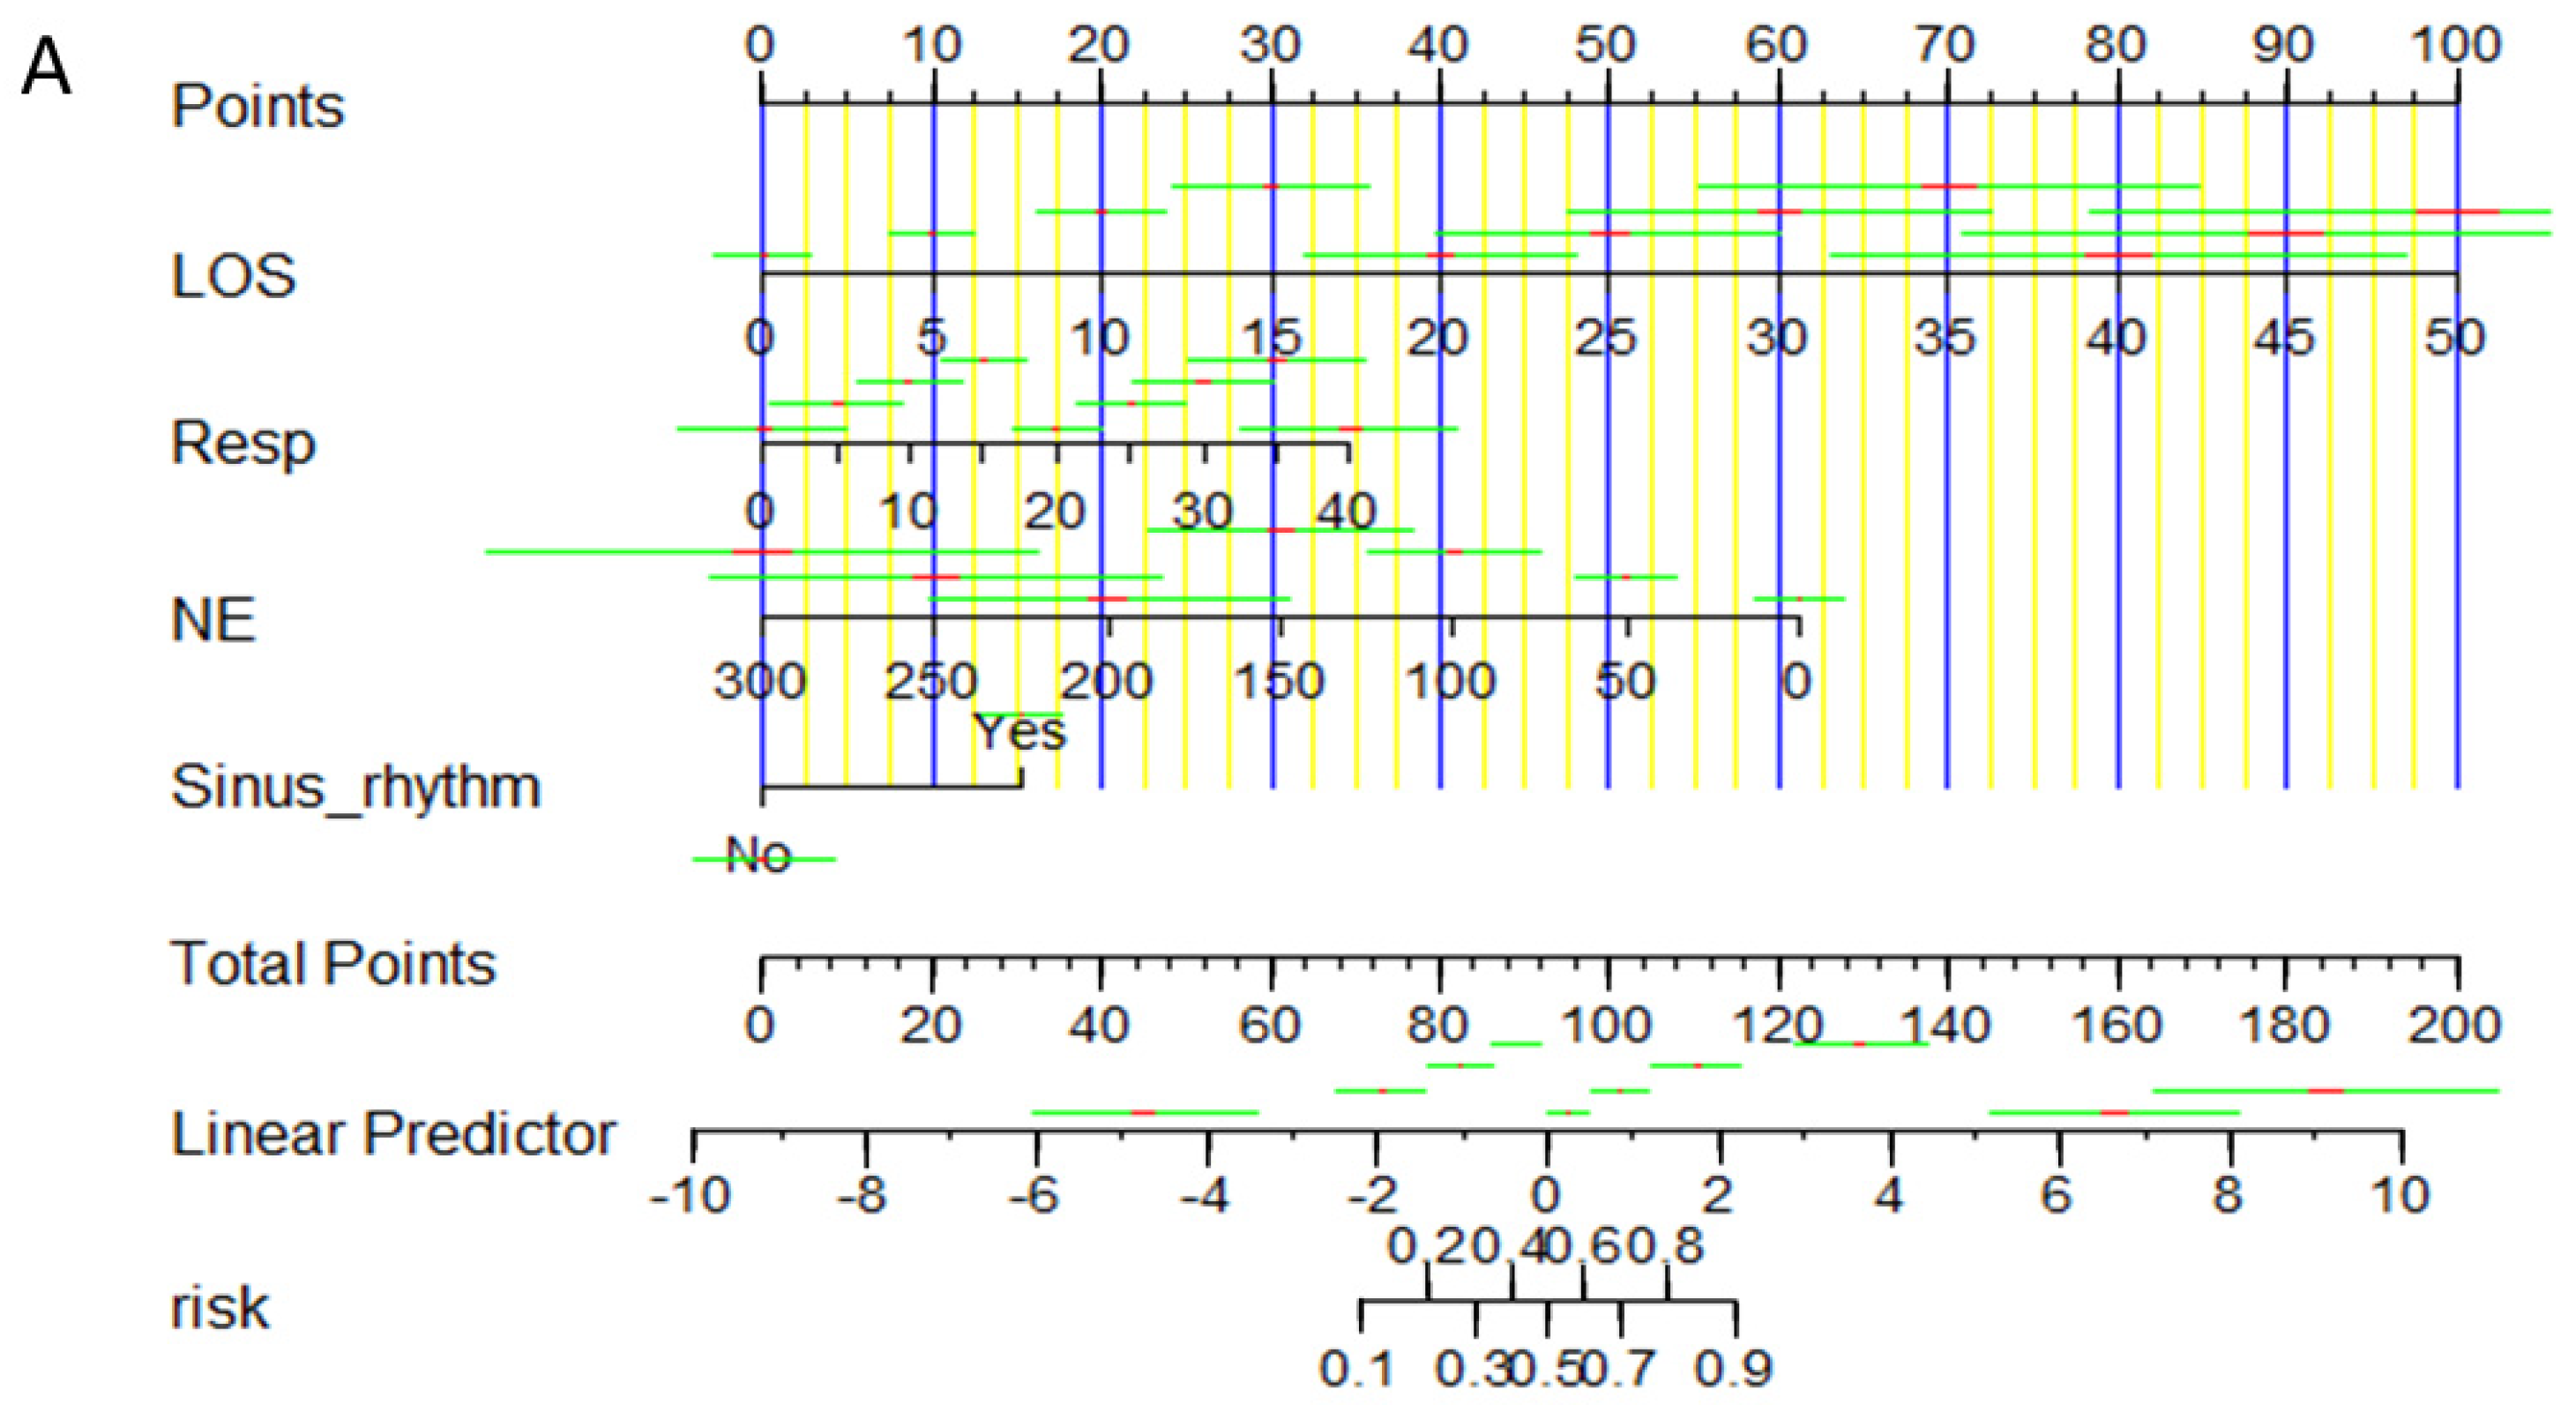
3.3. Construction of the Training Set Nomogram Prediction Model

Based on the logistic regression analysis, this study identified four independent predictive factors for constructing a risk prediction model. These factors are visually represented in a nomogram of the risk, which is presented in Figure 3A. The accumulation of points for each independent factor facilitates a rapid overall risk score, which can be used to determine whether a patient belongs to a high-risk group. The dynamic nomogram clearly illustrates the contribution of each predictive factor to the total risk score (Figure 3B). The visualization provided by the line chart is particularly important for making prompt clinical decisions.

3.4. Evaluation of the Prediction Model

We achieved favorable results with this method. The model’s training set demonstrated strong discrimination, calibration, applicability, and reasonableness. The area under the receiver operating characteristic (ROC) curve (AUC) was 0.860, indicating that the model has a high ability to differentiate between patients at high risk and those at low risk of recurrent in-hospital death (Figure 4A). The H-L test yielded a p-value of 0.765 and a Brier score of 0.147, suggesting that the model’s predicted probabilities closely align with the actual observed frequencies, thereby indicating good calibration (Figure 4B). The DCA curve illustrates that the model provides a high net benefit, further confirming its clinical utility; specifically, the model offers valuable insights for clinical decision-making across various thresholds (Figure 4C). The ROC curve provides a comprehensive evaluation of the model’s reasonableness within the actual clinical environment (Figure 4D). Additionally, the reasonableness curve assesses that each independent predictive factor remains within the full predictive variable model (Figure 4D, Model 1) curve at different risk levels, demonstrating that the model exhibits strong predictive performance across various risk categories.

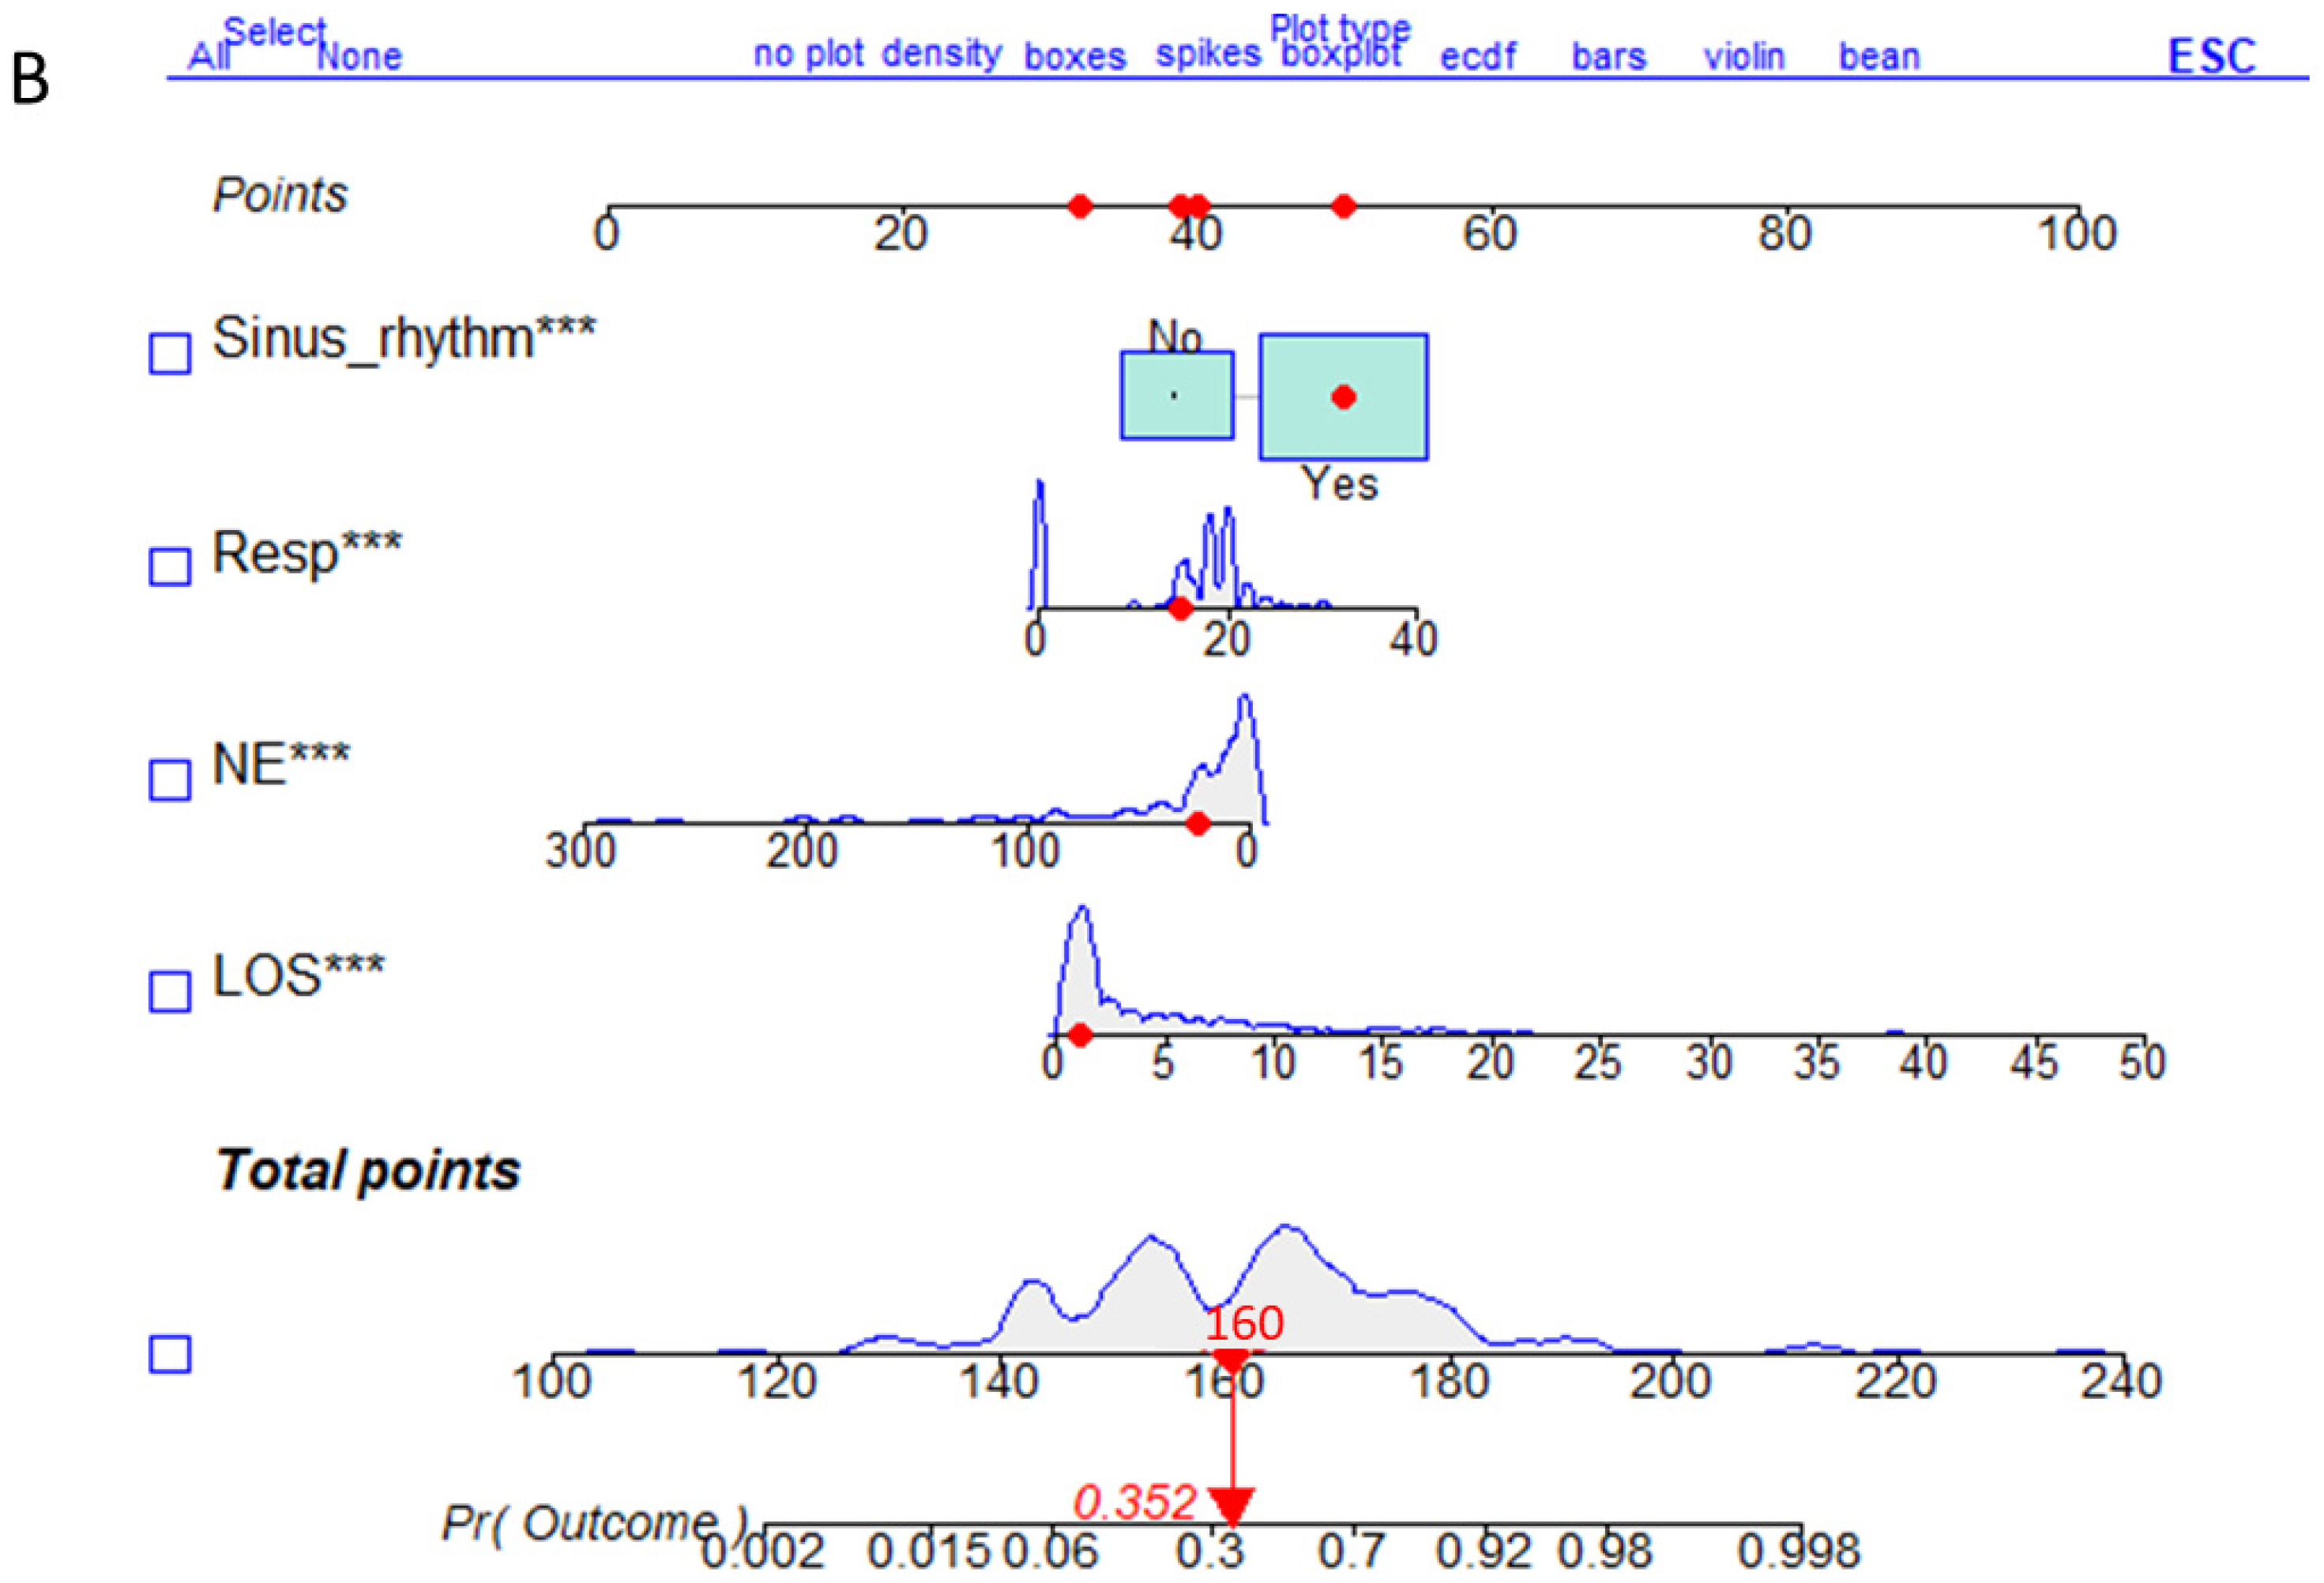
3.5. Validation Set Nomogram for the Risk Prediction Model

Importing the training set model into the validation set analysis revealed that the scores and trends of its independent influencing factors are essentially consistent with those of the training set nomogram (Figure 5).

3.6. Verification of the Risk Prediction Model

The results from the validation set revealed an area under the curve (AUC) of 0.758. Although the AUC for the validation set is slightly lower than that of the training set, it still demonstrates that the model exhibited high discriminative ability and can be effectively applied to a new, independent dataset (Figure 6A). The H-L test yielded a p-value of 0.042, indicating a significant difference between the model’s predicted probabilities and the actual observed event rates. The concordance index (C-index) was 0.758, and a Brier score of 0.201 suggests that the model exhibits a reasonable fit (Figure 6B). The DCA indicates that the model provides a high net benefit and is relatively applicable (Figure 6C). Some of the ROC curves for the independent predictive factors exceed those of the full predictive variable model, demonstrating overall good validity (Figure 6D). By comparing the ROC and DCA curves of the training and validation set models using the DeLong test, the results indicated that the training set model has a significant advantage in both discrimination and applicability (Figure 7). This finding underscores the model’s effectiveness in predicting the risk of recurrent in-hospital death following successful resuscitation of patients who experienced sudden death.

4. Discussion

4.1. Clinical Significance of the Model

The results indicate that the risk prediction model can rapidly identify the risk factors associated with in-hospital mortality following the resuscitation of patients who have experienced sudden death. First, by accurately determining the actual number of hospital days, the total dose of norepinephrine administered during hospitalization, the respiratory rate post-resuscitation, and the presence of sinus rhythm after resuscitation as four key predictive factors, the prognosis of patients can be assessed more precisely to inform treatment decisions. Second, the model exhibits strong predictive performance in both the training and validation sets. Through evaluations of discrimination, calibration, applicability, and reasonableness, the model further emphasizes its potential value for application in clinical settings.

4.2. Influencing Factors of In-Hospital Mortality

Sudden death patients who are successfully resuscitated often opt for hospitaliza-tion for further treatment. However, in-hospital treatment can lead to recurrent sudden death and even mortality. The rational use of medication can benefit patients who experience sudden death and undergo resuscitation. The results of this study suggest that high doses of norepinephrine are associated with an increased risk of in-hospital mortality. Specifically, higher doses of norepinephrine (OR: 0.99, 95% CI: 0.98–0.99, p = 0.005) may indicate more severe hemodynamic instability and the presence of complications associated with vasopressor use [17,18]. Norepinephrine is a potent vasoconstrictor, which can be administered following cardiopulmonary resuscitation to maintain blood pressure and ensure adequate organ perfusion. However, excessive doses of norepinephrine may lead to pronounced peripheral vasoconstriction and complications such as myocardial ischemia and arrhythmias, which can further deteriorate the patient’s condition and elevate the risk of in-hospital death. Our study also indicated that the initial respiratory rate following resuscitation is associated with the risk of in-hospital mortality. The initial respiratory rate after resuscitation (OR: 1.10, 95% CI: 1.04–1.16, p = 0.001) is a critical marker of respiratory function, with deviations from normal indicating significant physiological stress [19,20]. Both excessively high and excessively low respiratory rates can result in respiratory acid–base imbalances, which may impair the activity of various enzymes and cellular functions within the body, ultimately leading to functional damage to organ systems. Our study found that the recovery of sinus rhythm after resuscitation is associated with a lower risk of in-hospital death compared to those who do not recover sinus rhythm. Lastly, the presence of sinus rhythm after resuscitation (OR: 3.76, 95% CI: 1.45–9.73, p = 0.006) suggests better cardiac function and stability, reducing the risk of arrhythmias and other complications [21]. The restoration of sinus rhythm enhances cardiac pumping function to a cer-tain extent, helps maintain systemic organ perfusion, and contributes to cardiac elec-trophysiological stability, thereby reducing the risk of arrhythmias, which is beneficial for patient outcomes. The risk of in-hospital death following resuscitation and the return of spontaneous circulation in patients who experience sudden death is multifaceted and influenced by various factors. Our study indicated that a longer hospital stay is associated with a reduced risk of in-hospital mortality. The actual length of hospital stay (OR: 1.15, 95% CI: 1.06–1.25, p < 0.001) may serve as a proxy for the complexity of post-resuscitation care, reflecting the severity of the patient’s condition and the need for prolonged medical intervention [22]. This correlation may be attributed to the more comprehensive and intensive treatment provided during hospitalization, which can improve patient outcomes and decrease the likelihood of subsequent in-hospital death. However, due to current limitations in the available data, it is not feasible to conduct further subgroup analyses or trend studies that incorporate graded data on the duration of hospital stays. This issue remains a topic for future research. Collectively, these factors contribute to a more accurate prediction of in-hospital mortality and can guide clinical decision-making to improve patient outcomes.
Although this study focused on WBC and procalcitonin as key inflammatory markers, future research could explore the inclusion of additional parameters, such as high-sensitivity C-reactive protein (hs-CRP), to further refine the predictive model. The integration of hs-CRP may provide a more comprehensive assessment of the inflammatory response and improve the accuracy of risk prediction for in-hospital mortality following sudden death and resuscitation.

4.3. Limitations of the Model

One of the limitations of the current study is the reliance on a single source of research data, which may limit the generalizability of our findings. Future studies should address this limitation by incorporating data from multiple centers or registries. This approach would enhance the diversity of the study population and improve the robustness and generalizability of the findings. Additionally, we recommend prospective validation in diverse patient populations to further assess the model’s performance across different settings and patient demographics. By doing so, future research can better account for variations in clinical practices, patient characteristics, and healthcare systems, ultimately leading to more reliable and widely applicable results. Inconsistencies in data collection could undermine the model’s stability, and it is important to identify specific areas where these inconsistencies were most likely to occur. The primary areas of concern include: (1) Time-sensitive variables: The recording of time-sensitive variables, such as the duration of CPR and the timing of medication administration, is particularly susceptible to inconsistencies. These variables require precise documentation at the time of resuscitation and during the initial hospital stay. Variations in how these times are recorded by different healthcare providers or due to differences in emergency response protocols can introduce errors. (2) Laboratory testing protocols: Variations in laboratory testing protocols across different hospital units may also contribute to inconsistencies. For example, differences in the timing of blood draws, the specific tests ordered, and the methods used for analyzing laboratory results can lead to discrepancies in the data. This is especially relevant for variables such as lactate levels, procalcitonin, and other biomarkers that are critical for assessing the patient’s condition. (3) Clinical documentation practices: Differences in clinical documentation practices among healthcare providers can also affect data consistency. For instance, variations in how symptoms, comorbidities, and interventions are recorded in medical charts can lead to incomplete or inconsistent data entry.These inconsistencies can affect the accuracy and reliability of the data used to develop and validate the predictive model. While efforts were made to standardize data collection through predefined protocols, the inherent variability in clinical practice and documentation can still introduce some degree of error. Future studies should aim to standardize data collection processes more rigorously and use multiple data sources to mitigate these limitations.
Future investigations are essential to validate the conclusions drawn from this study. Several recommendations for future research are provided. Future studies should continue to explore the following areas: (1) Conduct prospective multicenter studies to enhance sample diversity and statistical power. (2) Develop personalized medical plans based on the results of the prediction model. (3) Implement long-term follow-up studies to evaluate the effectiveness of the prediction model on long-term clinical outcomes. (4) Regularly update and validate the model to ensure its clinical relevance and accuracy.

5. Conclusions

We developed a predictive nomogram for in-hospital mortality of sudden death patients. The results of this study indicate that the factors influencing in-hospital mortality include the total number of hospital days, the dose of norepinephrine administered during hospitalization, the initial respiratory rate post-resuscitation, and the restoration of sinus rhythm. With a high AUC of 0.860, a wide net benefit threshold range and high net benefit, this nomogram may be our model has the potential for broad clinical application in clinical decision-making. Looking forward, future efforts could be highly beneficial in enhancing clinical risk management for in-hospital mortality in patients who survive resuscitation from sudden death.

Author Contributions

Y.L. (Yu Li), Z.C. and F.A. contributed to conception and design; Z.C. and Y.L. (Yu Li) contributed to data analysis and interpretation; Y.L. (Yu Li), F.A. and Y.L. (Yifan Liang) contributed to drafting the manuscript for intellectual content; Y.L. (Yu Li) and Z.C. contributed to revision of the manuscript; J.W., J.L., X.G. and X.Y. contributed to data collection. All authors have read and agreed to the published version of the manuscript.

Funding

Hubei Provincial Department of Science and Technology Natural Science Foundation, General Surface Project, No. 2024AFB893.

Institutional Review Board Statement

The study was conducted in accordance with the Declaration of Helsinki, and approved by the Ethics Committee of the Central Hospital of Wuhan (protocol code WHZXKYL2024-019-01, approval date 30 July 2024).

Informed Consent Statement

Patient consent was waived for the following reason: The study utilizes medical records and biological specimens obtained from previous clinical diagnoses and treatments, with no possibility of identifying the subjects. Further-more, the research does not involve personal privacy concerns or commercial interests.

Data Availability Statement

No new data were created or analyzed in this study. Data sharing is not applicable to this article.

Conflicts of Interest

The authors declare no conflicts of interest.

References

  1. Kumar, A.; Avishay, D.M.; Jones, C.R.; Shaikh, J.D.; Kaur, R.; Aljadah, M.; Kichloo, A.; Shiwalkar, N.; Keshavamurthy, S. Sudden cardiac death: Epidemiology, pathogenesis and management. Rev. Cardiovasc. Med. 2021, 22, 147–158. [Google Scholar] [CrossRef] [PubMed]
  2. Bayés de Luna, A.; Elosua, R. Sudden death. Rev. Esp. Cardiol. (Engl. Ed.) 2012, 65, 1039–1052. [Google Scholar] [CrossRef] [PubMed]
  3. Pasupula, D.K.; Bhat, A.; Siddappa Malleshappa, S.K.; Munir, M.B.; Barakat, A.; Jain, S.; Wang, N.C.; Saba, S.; Bhonsale, A. Impact of Change in 2010 American Heart Association Cardiopulmonary Resuscitation Guidelines on Survival After Out-of-Hospital Cardiac Arrest in the United States: An Analysis From 2006 to 2015. Circ. Arrhythmia Electrophysiol. 2020, 13, e007843. [Google Scholar] [CrossRef]
  4. Wong, C.X.; Brown, A.; Lau, D.H.; Chugh, S.S.; Albert, C.M.; Kalman, J.M.; Sanders, P. Epidemiology of Sudden Cardiac Death: Global and Regional Perspectives. Heart Lung Circ. 2019, 28, 6–14. [Google Scholar] [CrossRef]
  5. OngOng, M.E.H.; Shin, S.D.; De Souza, N.N.A.; Tanaka, H.; Nishiuchi, T.; Song, K.J.; Ko, P.C.-I.; Leong, B.S.-H.; Khunkhlai, N.; Naroo, G.Y.; et al. Outcomes for out-of-hospital cardiac arrests across 7 countries in Asia: The Pan Asian Resuscitation Outcomes Study (PAROS). Resuscitation 2015, 96, 100–108. [Google Scholar] [CrossRef]
  6. Kiguchi, T.; Okubo, M.; Nishiyama, C.; Maconochie, I.; Ong, M.E.H.; Kern, K.B.; Wyckoff, M.H.; McNally, B.; Christensen, E.F.; Tjelmeland, I.; et al. Out-of-hospital cardiac arrest across the World: First report from the International Liaison Committee on Resuscitation (ILCOR). Resuscitation 2020, 152, 39–49. [Google Scholar] [CrossRef]
  7. Poole, K.; Couper, K.; Smyth, M.A.; Yeung, J.; Perkins, G.D. Mechanical CPR: Who? When? How? Crit. Care 2018, 22, 140. [Google Scholar] [CrossRef] [PubMed]
  8. Kumagai, K.; Oda, Y.; Oshima, C.; Kaneko, T.; Kaneda, K.; Kawamura, Y.; Ogino, Y.; Yamashita, S.; Ichihara, K.; Maekawa, T.; et al. Development of a prompt model for predicting neurological outcomes in patients with return of spontaneous circulation from out-of-hospital cardiac arrest. Acute Med. Surg. 2014, 2, 176–182. [Google Scholar] [CrossRef]
  9. Alshahrani, M.S.; Aldandan, H.W. Use of sodium bicarbonate in out-of-hospital cardiac arrest: A systematic review and meta-analysis. Int. J. Emerg. Med. 2021, 14, 21. [Google Scholar] [CrossRef]
  10. Lee, J.H.; Lee, D.H.; Lee, B.K.; Kim, D.K.; Ryu, S.J. Association Between Procalcitonin Level at 72 Hours After Cardiac Arrest and Neurological Outcomes in Cardiac Arrest Survivors. Ther. Hypothermia Temp. Manag. 2023, 13, 23–28. [Google Scholar] [CrossRef]
  11. Yoon, J.H.; Choi, W.S.; Lim, Y.S.; Jang, J.H. Comparison of Prognostic Performance between Procalcitonin and Procalcitonin-to-Albumin Ratio in Post Cardiac Arrest Syndrome. J. Clin. Med. 2023, 12, 4568. [Google Scholar] [CrossRef]
  12. Li, Z.; Gao, J.; Wang, J.; Xie, H.; Guan, Y.; Zhuang, X.; Liu, Q.; Fu, L.; Hou, X.; Hei, F. Mortality risk factors in patients receiving ECPR after cardiac arrest: Development and validation of a clinical prognostic prediction model. Am. J. Emerg. Med. 2024, 76, 111–122. [Google Scholar] [CrossRef]
  13. Lin, Q.; Zhang, N.; Zhu, H. The relationship between the level of NMLR on admission and the prognosis of patients after cardiopulmonary resuscitation: A retrospective observational study. Eur. J. Med. Res. 2023, 28, 424. [Google Scholar] [CrossRef] [PubMed]
  14. Perman, S.M.; Elmer, J.; Maciel, C.B.; Uzendu, A.; May, T.; Mumma, B.E.; Bartos, J.A.; Rodriguez, A.J.; Kurz, M.C.; Panchal, A.R.; et al. 2023 American Heart Association Focused Update on Adult Advanced Cardiovascular Life Support: An Update to the American Heart Association Guidelines for Cardiopulmonary Resuscitation and Emergency Cardiovascular Care. Circulation 2024, 149, e254–e273. [Google Scholar] [CrossRef]
  15. Waldmann, P.; Mészáros, G.; Gredler, B.; Fuerst, C.; Sölkner, J. Evaluation of the lasso and the elastic net in genome-wide association studies. Front. Genet. 2013, 4, 270. [Google Scholar] [CrossRef]
  16. White, N.; Parsons, R.; Collins, G.; Barnett, A. Evidence of questionable research practices in clinical prediction models. BMC Med. 2023, 21, 339. [Google Scholar] [CrossRef] [PubMed]
  17. Bougouin, W.; Slimani, K.; Renaudier, M.; Binois, Y.; Paul, M.; Dumas, F.; Lamhaut, L.; Loeb, T.; Ortuno, S.; Deye, N.; et al. Sudden Death Expertise Center Investigators. Epinephrine versus norepinephrine in cardiac arrest patients with post-resuscitation shock. Intensive Care Med. 2022, 48, 300–310. [Google Scholar] [CrossRef] [PubMed]
  18. Smida, T.; Crowe, R.P.; Martin, P.S.; Scheidler, J.F.; Price, B.S.; Bardes, J.M. A retrospective, multi-agency ‘target trial emulation’ for the comparison of post-resuscitation epinephrine to norepinephrine. Resuscitation 2024, 198, 110201. [Google Scholar] [CrossRef]
  19. Newell, C.; Grier, S.; Soar, J. Airway and ventilation management during cardiopulmonary resuscitation and after successful resuscitation. Crit. Care 2018, 22, 190. [Google Scholar] [CrossRef]
  20. Sun, Y.; He, Z.; Ren, J.; Wu, Y. Prediction model of in-hospital mortality in intensive care unit patients with cardiac arrest: A retrospective analysis of MIMIC -IV database based on machine learning. BMC Anesthesiol. 2023, 23, 178. [Google Scholar] [CrossRef]
  21. Sagris, D.; Korompoki, E.; Ntaios, G.; Tzeis, S.; Manios, E.; Kanakakis, J.; Milionis, H.; Papanagiotou, P.; Andrikopoulos, G.; Lip, G.Y.; et al. Sinus rhythm restoration and improved outcomes in patients with acute ischemic stroke and in-hospital paroxysmal atrial fibrillation. Eur. Stroke J. 2022, 7, 421–430. [Google Scholar] [CrossRef] [PubMed]
  22. Ohbe, H.; Kudo, D.; Kimura, Y.; Matsui, H.; Yasunaga, H.; Kushimoto, S. In-hospital mortality of patients admitted to the intermediate care unit in hospitals with and without an intensive care unit: A nationwide inpatient database study. Crit. Care 2025, 29, 34. [Google Scholar] [CrossRef] [PubMed]
Figure 1. Flowchart of patient selection (n  =  296), model development flowchart.
Ecm 02 00015 g001
Figure 2. (A) LASSO regression for screening independent variables, (B) Plotting the distribution of LASSO coefficients for all potential independent variables.
Ecm 02 00015 g002
Figure 3. (A) represents the nomogram for the training set, while (B) illustrates the dynamic nomogram for the same training set. Items marked with “***” (such as Sinus _rhythm, Resp, NE, LOS) indicate that these variables have a highly sig-nifi-cant impact on the outcomes in the predictive model, with a p-value of less than 0.001. This suggests that these variables significantly influence the model’s prediction of the risk of in-hospital mortality.
Ecm 02 00015 g003aEcm 02 00015 g003b
Figure 4. (A) represents the ROC curve for the training set, (B) presents the calibration curve for the training set, (C) depicts the DCA curve for the training set, and (D) illustrates the reasonableness curve for the training set.
Ecm 02 00015 g004
Figure 5. (A) represents the nomogram for the validation set, while (B) illustrates the dynamic nomogram for the same validation set. Items marked with “*” (such as LOS) indicate that this variables have a significant impact on the outcomes in the predictive model, with a p-value of less than 0.05.
Ecm 02 00015 g005aEcm 02 00015 g005b
Figure 6. Panel (A) displays the ROC curve for the validation set, Panel (B) presents the calibration curve for the validation set, Panel (C) illustrates the DCA curve for the validation set, and Panel (D) depicts the reasonableness curve for the validation set.
Ecm 02 00015 g006
Figure 7. Panel (A) displays the receiver operating Characteristic curve for the DeLong test, while Panel (B) illustrates the Decision Curve Analysis curve for the same test.
Ecm 02 00015 g007
Table 1. Comparison of training set and validation set groups with and without in-hospital death.
ItemsTraining Set (N = 208)Validation Set (N = 87)
Death (N = 119)Survival (N = 89)pDeath (N = 49)Survival (N = 38)p
CPR Duration (minutes)30.0 (15.5, 47.0)12.0 (5.00, 20.0)<0.001 *29.0 (19.0, 40.0)10.0 (5.00, 19.5)<0.001 *
Gender (n, %) -0.996--0.029 *
Female75 (63.0)57 (64.0) 40 (81.6)22 (57.9)
Male44 (37.0)32 (36.0) 9 (18.4)16 (42.1)
Age (years)68.0 (56.5, 77.0)62.0 (56.0, 73.0)0.18067.0 (53.0, 75.0)65.0 (56.2, 73.8)0.990
Hospital Stay (days)3.14 (3.89)8.91 (9.34)<0.001 *3.27 (4.40)6.97 (6.14)0.002 *
Emergency Department Stay (minutes)56.0 (42.5, 77.0)65.0 (42.0, 127)0.06059.0 (44.0, 86.0)86.5 (49.0, 147)0.044 *
History of Coronary Heart Disease (n, %)33 (27.7)22 (24.7)0.7439 (18.4)10 (26.3)0.530
Inpatient ward (n, %) 0.001 * 0.019 *
General ward (n, %)1 (0.84)10 (11.2) 1 (2.04)7 (18.4)
ICU ward (n, %)118 (99.2)79 (88.8) 48 (98.0)31 (81.6)
History of Diabetes (n, %)31 (26.1)36 (40.4)0.040 *10 (20.4)5 (13.2)0.547
History of Malignant Tumors (n, %)24 (20.2)7 (7.87)0.023 *4 (8.16)0 (0.00)0.128
History of Major Surgery (n, %)38 (31.9)26 (29.2)0.78816 (32.7)10 (26.3)0.686
History of Stroke(n, %)24 (20.2)19 (21.3)0.97210 (20.4)8 (21.1)1.000
Chronic Obstructive Pulmonary Disease (n, %)9 (7.56)2 (2.25)0.1214 (8.16)2 (5.26)0.692
Deep Vein Thrombosis History(n, %)2 (1.68)2 (2.25)1.0002 (4.08)0 (0.00)0.502
Chronic Kidney Disease Stage 3 or Above (n, %)10 (8.40)4 (4.49)0.4052 (4.08)2 (5.26)1.000
Other Past Medical Histories (n, %)41 (34.5)26 (29.2)0.51620 (40.8)15 (39.5)1.000
Pulse (beats/minute)82.0 (0.00, 104)90.0 (78.0, 107)0.006 *85.0 (0.00, 104)84.0 (75.0, 100)0.429
Respiration (breaths/minute)16.0 (0.00, 20.0)18.0 (16.0, 20.0)<0.001 *18.0 (0.00, 20.0)18.0 (16.2, 20.0)0.089
Systolic Blood Pressure (mmHg)80.0 (50.0, 122)120 (97.0, 142)<0.001 *93.0 (62.0, 116)124 (107, 139)<0.001 *
Diastolic Blood Pressure (mmHg)45.0 (22.5, 66.0)70.0 (52.0, 82.0)<0.001 *55.0 (35.0, 70.0)74.5 (56.0, 88.2)0.001 *
Pulse Pressure Difference (mmHg)34.0 (16.0, 45.0)46.0 (35.0, 64.0)<0.001 *32.0 (15.0, 45.0)51.0 (30.0, 59.2)0.006 *
Blood Glucose on Admission (mmol/L)10.5 (7.20, 14.9)10.1 (7.70, 14.8)0.63410.2 (7.70, 15.5)10.2 (6.20, 14.5)0.617
Serum Calcium (mmol/L)2.07 (0.72)2.16 (0.24)0.2442.06 (0.41)2.11 (0.27)0.525
Serum Sodium (mmol/L)146 (11.9)141 (5.92)<0.001 *144 (8.07)143 (5.56)0.309
Serum Chloride (mmol/L)102 (7.91)103 (5.93)0.665102 (7.25)104 (9.07)0.176
Activated Partial Thromboplastin Time (s)35.6 (28.2, 62.3)28.1 (24.1, 32.0)<0.001 *35.1 (28.8, 54.2)28.3 (23.6, 47.1)0.041 *
Prothrombin Time (s)17.5 (9.14)13.0 (3.81)<0.001 *18.5 (9.60)14.9 (7.44)0.054
Fibrinogen (g/L)2.72 (1.28)2.98 (1.09)0.1182.63 (1.45)2.38 (0.84)0.315
Thrombin Time (s)18.8 (17.0, 25.1)17.5 (15.5, 19.1)<0.001 *19.0 (17.7, 22.3)18.7 (16.4, 20.5)0.168
Hemoglobin Concentration (G/L)113 (32.0)124 (28.8)0.017 *121 (35.5)128 (28.3)0.262
White Blood Cell Count (×109/L)13.7 (6.24)13.0 (5.54)0.44812.7 (6.28)12.2 (5.41)0.643
Neutrophil Count (×109/L)10.5 (5.95, 14.2)9.90 (6.30, 13.3)0.9899.20 (6.50, 11.9)10.3 (7.28, 13.6)0.171
Platelet Count (×109/L)166 (89.3)205 (77.8)0.001 *161 (84.3)208 (73.3)0.006*
Mean Platelet Volume (FL)11.7 (14.3)11.8 (12.3)0.97410.5 (1.23)10.4 (1.23)0.685
Red Blood Cell Distribution Width—Coefficient of Variation (%)14.3 (2.85)13.5 (1.47)0.005 *13.8 (1.83)13.6 (1.56)0.574
Lymphocyte Count (×109/L)2.42 (1.94)1.98 (1.89)0.1054.66 (18.1)1.72 (1.47)0.262
Lactate (mmol/L)13.4 (7.13)6.34 (6.45)<0.001 *13.3 (7.22)6.18 (5.79)<0.001 *
Total Bilirubin (μmol/L)14.9 (12.8)14.8 (12.9)0.93428.2 (54.1)16.3 (13.8)0.145
Direct Bilirubin (μmol/L)6.77 (7.53)6.32 (7.42)0.66514.2 (35.5)7.05 (8.73)0.179
Albumin (g/L)32.6 (8.35)37.1 (5.79)<0.001 *33.4 (7.47)36.6 (5.30)0.021 *
Neutrophil-to-Lymphocyte Ratio9.37 (12.8)10.9 (10.7)0.35611.3 (14.9)10.9 (10.5)0.886
Platelet-to-Lymphocyte Ratio143 (172)207 (197)0.017 *186 (201)193 (137)0.836
Procalcitonin (ng/mL)0.40 (0.10, 3.10)0.10 (0.00, 1.00)0.004 *0.40 (0.10, 1.30)0.10 (0.10, 2.38)0.576
B-Type Natriuretic Peptide (pg./mL)323 (83.5, 1354)324 (80.2, 1278)0.961305 (43.2, 1160)156 (51.0, 486)0.392
D-Dimer (ug/mL.FEU)29.0 (57.2)16.2 (40.7)0.06117.6 (20.1)12.2 (23.3)0.257
Oxygen Partial Pressure (mmHg)166 (142)151 (103)0.374208 (162)127 (55.8)0.002 *
Carbon Dioxide Partial Pressure (mmHg)55.6 (29.8)47.0 (19.9)0.014 *50.7 (25.5)42.5 (19.3)0.093
PH Value (mmHg)7.09 (0.30)7.27 (0.21)<0.001 *7.12 (0.20)7.32 (0.21)<0.001 *
Arterial Blood Potassium (mmol/L)4.61 (1.72)4.18 (1.03)0.027 *4.53 (1.58)3.75 (0.85)0.004 *
Serum Potassium (mmol/L)4.70 (1.57)4.17 (0.89)0.002 *4.86 (1.89)4.04 (0.72)0.007 *
Epinephrine Dose (mg)43.9 (59.0)15.8 (36.1)<0.001 *31.5 (44.5)16.2 (35.6)0.079
Norepinephrine Dose (mg)41.7 (59.9)19.4 (33.1)0.001 *29.4 (41.9)21.4 (35.1)0.336
Mannitol Treatment (n, %)26 (21.8)17 (19.1)0.75612 (24.5)6 (15.8)0.467
34–36 degrees Celsius Hypothermia treatment (n, %)84(70.6)44(49.4)0.003 *36(73.5)17(44.7)0.012 *
Antibiotic Treatment (n, %)83 (69.7)69 (77.5)0.27435 (71.4)29 (76.3)0.789
The Use of Sodium Bicarbonate (n, %)69 (58.0)35 (39.3)0.012 *21 (42.9)16 (42.1)1.000
Tracheal Intubation and Mechanical Ventilation Assistance (n, %)102 (85.7)58 (65.2)0.001 *41 (83.7)20 (52.6)0.004 *
Gastric Protection Treatment (n, %)39 (32.8)37 (41.6)0.24721 (42.9)15 (39.5)0.922
Sinus Rhythm Recovery After Resuscitation (n, %)64 (53.8)79 (88.8)<0.001 *31 (63.3)33 (86.8)0.026 *
ST-T Changes After Resuscitation (n, %)61 (51.3)50 (56.2)0.57328 (57.1)25 (65.8)0.550
Time of Cardiac Arrest Occurrence (hours)13.5 (6.31)13.2 (6.69)0.71213.0 (6.04)13.6 (6.16)0.662
The Time of Sudden Death Occurrence (n, %) 0.055 0.614
22:00–6:00 (n, %)26 (21.8)31 (34.8) 11 (22.4)6 (15.8)
6:00–22:00 (n, %)93 (78.2)58 (65.2) 38 (77.6)32 (84.2)
Note: * p < 0.05.
Table 2. Univariate and multivariate logistic regression analysis.
VariablesUnivariate RegressionMultivariate Regression
BSE0R95% CIZpBSEOR95% CIZp
Albumin0.0870.0221.091.04–1.144.009<0.001 *0.0550.0311.060.99–1.121.7810.075
CPR Duration−0.0740.0120.930.91–0.95−6.027<0.001 *------
Lactate−0.1560.0260.860.81–0.9−5.967<0.001 *------
Actual Hospital Stay0.1660.0331.181.11–1.264.95<0.001 *0.1410.0421.151.06–1.253.3490.001 *
In-Hospital Norepinephrine Dose−0.0120.0040.990.98–1−2.8520.004 *−0.0150.0050.990.98–0.99−2.8400.005 *
Respiratory Rate After Resuscitation0.0960.0211.11.06–1.154.636<0.001 *0.0910.0281.101.04–1.163.2230.001 *
Sinus Rhythm After Resuscitation1.9150.3836.793.2–14.385.005<0.001 *1.3250.4853.761.65–9.732.7320.006 *
Tracheal Intubation and Mechanical Ventilation Assistance−1.1650.3440.310.16–0.61−3.3010.001 *−0.7560.5370.470.16–1.34−1.4090.159
Note: * p < 0.05.
Disclaimer/Publisher’s Note: The statements, opinions and data contained in all publications are solely those of the individual author(s) and contributor(s) and not of MDPI and/or the editor(s). MDPI and/or the editor(s) disclaim responsibility for any injury to people or property resulting from any ideas, methods, instructions or products referred to in the content.

