Article

ESP32-Powered PPG Signal Acquisition: Open-Source Hardware and Software for Research and Education

by
Jesús E. Miranda-Vega
1,
Erick Y. Nuñez-Patrón
1,
Guillermo Prieto-Avalos
1,*,
Wendy Flores-Fuentes
2,
Oleg Sergiyenko
3,
Wendy García-González
2,
Loriz Victoria Márquez-Ramirez
4,
Rubén Castro-Contreras
5 and
Rafael I. Ayala-Figueroa
1
1
Department of Electrical and Electronic Engineering, Tecnológico Nacional de México/IT Mexicali, Mexicali 21376, Mexico
2
Faculty of Engineering, Autonomous University of Baja California, Blvd. Benito Juárez, Mexicali 21280, Mexico
3
Institute of Engineering, Autonomous University of Baja California, Calle Normal, Mexicali 21100, Mexico
4
Faculty of Idioms, Autonomous University of Baja California, Calle Normal, Mexicali 21100, Mexico
5
Department of Chemical and Biochemical Engineering, Tecnológico Nacional de México/IT Mexicali, Mexicali 21376, Mexico
*
Author to whom correspondence should be addressed.
Hardware 2025, 3(4), 15; https://doi.org/10.3390/hardware3040015
Submission received: 19 June 2025 / Revised: 13 September 2025 / Accepted: 23 October 2025 / Published: 12 November 2025

Abstract

To support the understanding of cardiovascular monitoring and physiological signal processing, we present a portable, open-source photoplethysmography (PPG) acquisition platform developed for educational and research applications. The system is built entirely with commercial off-the-shelf components and centers around an ESP32 microcontroller, which performs high-speed analog signal acquisition at 500 samples per second, alongside real-time control, and wireless communication. A cross-platform, Python-based graphical user interface enables real-time signal visualization, peak detection, and the computation of heart rate variability (HRV) metrics, including RMSSD and SDNN, during offline analysis. All hardware and software resources are openly available to enable replication and further development. This project emphasizes accessibility, transparency, and hands-on learning in biomedical signal acquisition. System functionality is validated offline through controlled data collection from human subjects, demonstrating results consistent with established HRV benchmarks.

1. Introduction

In 2019, heart disease was the leading cause of death worldwide, accounting for about 32% of all deaths, according to the World Health Organization (WHO) [1]. Monitoring cardiac activity is a widely used preventive tool in clinical practice and remains a crucial method for diagnosis.
Biomedical instrumentation focuses on the design of systems capable of detecting physiological variables associated with cardiac activity, such as cardiac electrical signals (electrocardiography, ECG) and photoplethysmography (PPG), which is based on blood volume changes. These biosignals are typically acquired as time-series data and analyzed to understand the underlying physiological mechanisms and sources of variability [2].
Although ECG, seismocardiography (SCG), and ballistocardiography (BCG) are commonly used to measure cardiac activity, PPG has become popular due to its unique benefits. PPG is a simple, low-cost optical technique whose core components, typically an LED and a photodiode, can be easily integrated into compact wearable devices such as smartwatches. [2]. Unlike ECG, which requires electrode placement and skin preparation, PPG sensors can be applied directly to various sites (e.g., finger, wrist, or ear) without prior preparation. Wearable PPG devices often incorporate pulse oximetry, enabling simultaneous monitoring of HRV and blood oxygen saturation using a single sensor [3]. This multi-parameter capability is not feasible with ECG alone. Additionally, compared to mechanical methods like SCG or BCG, which require chest-mounted sensors or instrumented platforms, PPG is fully ambulatory and can be unobtrusively embedded into everyday accessories [4]. In summary, PPG offers a comfortable, non-invasive, and scalable solution for HRV monitoring. Its simplicity and integration into consumer-grade wearables make it especially suitable for long-term home or ambulatory applications compared to ECG, SCG, or BCG techniques [4].
In this study, we present an open-source graphical user interface (GUI) designed for the real-time visualization, acquisition, and analysis of PPG signals. Our platform bridges the gap between low-cost embedded hardware and high-resolution biomedical signal processing. By supporting flexible experimentation and data export, it serves as a practical tool for research and educational use. The project promotes transparency, collaboration, and reproducibility for the development of physiological monitoring systems.
The main contributions and strengths of the proposed system are detailed below.
  • The compact, portable hardware is based on the ESP32 microcontroller and integrates an ADC and processing capabilities, allowing for a standalone, portable PPG acquisition system.
  • The open-source software provides access to a wide range of libraries for filtering, peak detection, real-time HRV offline analysis, and real-time data acquisition and visualization.
  • Its low power consumption makes it suitable for wearable or continuous monitoring setups.
  • Its cost-effective, simple sensor design uses an infrared LED as a photosensor.

1.1. Related Works

In this subsection, we provide an overview of representative PPG-based systems reported in the literature. Each work is analyzed in terms of the development platform, core functionality, GUI features, hardware integration, and experimental validation or application context. The reviewed implementations were developed using widely adopted software environments such as MATLAB, Python, and LabVIEW, offering a comparative perspective on their capabilities and limitations.
A MATLAB toolbox with a built-in GUI for fiducial-point extraction from PPG [5], this is called the PPGFeat toolbox. PPGFeat runs on Windows/Mac/UNIX via MATLAB and supports raw PPG pre-processing (filtering, baseline correction, smoothing), derivative computation, and automatic detection of systolic peaks, notch, dicrotic peak, etc. Its GUI allows users to load a PPG trace, apply filters, visualize PPG derivatives, and identify/adjust fiducial points on the waveform in real time. The toolbox was validated on the public PPG-BP dataset (3066 fiducials) and correctly identified 99% of landmarks. No special hardware is needed (it uses offline PPG data), so this tool is mainly for research analysis and teaching PPG features.
The authors developed a MATLAB application (with a GUI) for PPG data augmentation called PPGTempStitch [6]. It stitches together short annotated PPG pulse templates to create longer synthetic PPG records. The platform is MATLAB; users interact through a GUI “dialog” where they select one of four template types and configure stitching parameters. The output is a long PPG waveform with labeled fiducial points (suitable for training or testing algorithms). This toolbox is free and open-source, and was demonstrated to generate diverse PPG waveforms under simulated arrhythmic conditions. Hardware: none (uses user-provided templates). Context: helps PPG researchers and machine-learning practitioners by creating large annotated datasets from limited real pulses.
A MATLAB-based toolbox for simulating PPG signals (regular and arrhythmic), this application can be consulted in [7]. It includes a GUI front-end for waveform synthesis. In the GUI, the user selects the type of PPG to generate (e.g., normal, skipped beat, extra beat) via dropdown menus, and the software synthesizes a PPG waveform model based on cardiac and respiratory parameters. The GUI then plots the resulting PPG time series. PPGSynth is intended for algorithm development (e.g., testing peak detectors, HRV extraction) under controlled, customizable conditions. No hardware integration is involved (signals are purely simulated). Validation: The toolbox was published with several examples; it can export the generated data for offline analysis.
pyVHR works with the Python framework for remote PPG (rPPG) and cardiovascular signal extraction from video [8]. Runs as a desktop app on Windows/Linux with a Python backend. The core includes face/skin detection and standard rPPG algorithms (CHROM, POS, etc.). Crucially, pyVHR provides an interactive GUI (built in Qt or similar) for real-time analysis: it displays live webcam video alongside plots of the estimated heart rate (BPM) and the skin-segment time series. Controls allow starting/stopping acquisition, selecting algorithms, and saving results. Hardware: any standard webcam or video input. Validation: tested on public rPPG datasets (e.g., LGI-PPGI) with known heart rates. Context: research tool for contactless PPG analysis and for teaching rPPG methods.
In [9], the package vital_sqi was developed, based on a Python package (with a GUI) for signal quality assessment of ECG and PPG waveforms. It offers pipelines to compute dozens of signal-quality indices (SQIs) and peak detectors. The GUI (implemented in Python) enables users with minimal coding experience to select PPG/ECG input files, choose SQI pipelines, and visualize both raw waveforms and quality metrics. For example, users can load a PPG recording from a wearable and see a table of SQI values (motion artifact metrics, etc.) computed by the pipeline. Hardware: none (works with offline analysis of recorded signals). Validation: the package includes suggested SQI thresholds derived from annotated PPG data. Context: intended for clinical researchers to quickly flag bad PPG data (e.g., motion-corrupted) prior to further analysis.
pyPPG was proposed as a comprehensive Python toolbox for PPG signal analysis [10]. While not GUI-centric, it is a major open-source software package that runs on desktop Python. pyPPG implements algorithms for beat detection, fiducial point identification, and the computation of 74 PPG biomarkers. It was validated on large datasets (91 million heartbeats from polysomnography records), showing high accuracy (F1 ~88% vs. prior methods). The toolbox is modular (command-line or script use), but documentation and examples facilitate use by researchers. Hardware: can ingest data from a standard finger pulse oximeter or wearable PPG. Validation: tested against annotated reference beats and fiducials. Context: provides a standardized platform for long-term PPG biomarker research (e.g., blood pressure or vascular age estimation).
HeartView represents an open-source web-based signal-quality GUI for ambulatory ECG and PPG data [11]. Implemented in Python/JavaScript, HeartView provides a dashboard that visualizes ECG and PPG waveforms along with beat detection and artifact flags. It specifically generates plots of PPG/ECG traces, inter-beat intervals, and segment-by-segment data-quality metrics. Users upload sensor data (e.g., from Empatica E4 PPG or RespiBAN) and the GUI highlights missing/invalid beats. The published application features a browser GUI (online dashboard) that allows researchers to filter, zoom in, and review PPG segments. The authors reported that HeartView’s GUI helps compare signal quality, e.g., showing that autism patients had more missing PPG beats. Hardware: supports data from common wearables (e.g., E4). Validation: demonstrated on public datasets (WESAD) to illustrate group differences. Context: a research tool for quality control of wearable PPG data.
LOTUS is a Python-based GUI tool for wearable PPG/EDA data processing [12]. Developed for the EmbracePlus research smartwatch, LOTUS provides a graphical interface to compile and process raw multi-sensor wearable data. In the GUI, users load EmbracePlus recordings and select time windows; the software then aggregates accelerometry, EKG, PPG, and other channels and exports them in standard formats. The LOTUS GUI (built with PyQt) allows selection of segments and processing options, and shows preview plots of signals. Hardware: targets the Empatica EmbracePlus smartwatch (wrist PPG/EDA sensor). Validation: shown to successfully reconstruct long-term datasets for offline analysis. Context: simplifies handling of proprietary wearable PPG data for physiologists and data scientists.
The Multi-Wavelength SPAD PPG System is a custom embedded PPG sensor with LabVIEW monitoring [13]. This system uses a CMOS SPAD (single-photon avalanche diode) chip as the detector and three LEDs (525 nm green, 650 nm red, 940 nm IR) to acquire PPG in transmission mode. A microcontroller streams raw counts to a PC, where a LabVIEW GUI displays the PPG waveforms in real time. The GUI allows adjusting parameters (integration time, LED currents) and shows live traces of each color channel. The authors integrated the sensor into a fingertip probe and validated it on volunteers; they showed stable PPG signals even under movement, and successfully extracted heart rate and respiratory rate from the triple-wavelength data. The GUI’s real-time display and control made the system suitable for physiological monitoring experiments.
ZenTBI is a LabVIEW-controlled multi-LED PPG/NIRS system for traumatic brain injury (TBI) monitoring [14]. ZenTBI comprises a wearable probe (four LEDs + three photodiodes) that measures scalp blood volume changes (PPG) and cerebral oxygenation (NIRS). Its instrumentation box connects via USB to a PC running a LabVIEW application. The LabVIEW GUI provides real-time plots of the distal and proximal PPG signals and allows the user to adjust each LED current during acquisition. In the lab, the system was validated with phantoms and volunteers: the GUI-aided data capture confirmed correct multiplexing of wavelengths and collected high-quality PPG waveforms. Hardware integration: custom analog boards and digital potentiometers controlled by LabVIEW. Context: a research prototype for continuous non-invasive intracranial monitoring, demonstrating LabVIEW’s utility in custom PPG device control.
These representative systems primarily rely fundamentally on licensed software and costly subscription models, with annual fees that can reach approximately USD 2000. Such arrangements often tie functionality to subscription tiers, requiring frequent updates to the toolbox and restricting access to features according to the subscription level purchased. Another important constraint is the cost and commercial availability of specialized sensors. For instance, the cost of single-photon avalanche diodes (SPADs) typically ranges from 50 to 500 USD, while that of standard LEDs is approximately 1 USD. These economic and supply barriers increase the overall cost of the system and hinder accessibility. In contrast, our Python-based GUI coupled with the proposed low-cost circuit eliminates recurring license fees and uses readily available components, thereby enhancing reproducibility, affordability, and accessibility for research and prototype development.

1.2. Working Principles of PPG

There are two types of PPG sensors: transmittance and reflectance [15,16]. Both methods measure changes in light detection with each cardiac pulse. These light changes are primarily caused by pulsatile variations in the arterial blood volume of the illuminated tissue (the AC component of the PPG signal). However, the PPG signal also contains a DC component from static tissue, venous blood, and ambient/optical factors. In the first method, light is directed through the skin, and a photodetector measures the intensity of the light that is transmitted through the different skin layers. In the reflectance PPG method, the light source and photodetector are placed on the same side of the tissue. This method measures the back-scattered light, which varies with pulsatile changes in microvascular blood volume, see Figure 1.

2. Design

This section describes the hardware components, firmware implementation, and software tools used in the development of the proposed bio signal acquisition system. All procedures, configurations, and communication protocols are detailed to ensure full reproducibility. The source code, data structures, and signal processing routines used for acquisition, visualization, and analysis are included in the Supplementary Materials to allow other researchers to reproduce and extend this work.
A custom acquisition system was developed using the following components:
  • An ESP32-WROOM-32 module was used for analog signal acquisition and serial data transmission.
  • A PPG sensor using an LED as the photosensor was connected to the ESP32’s ADC input for bio signal acquisition.
  • The system was powered via USB or a regulated 3.3V external supply.

2.1. Hardware Implementation

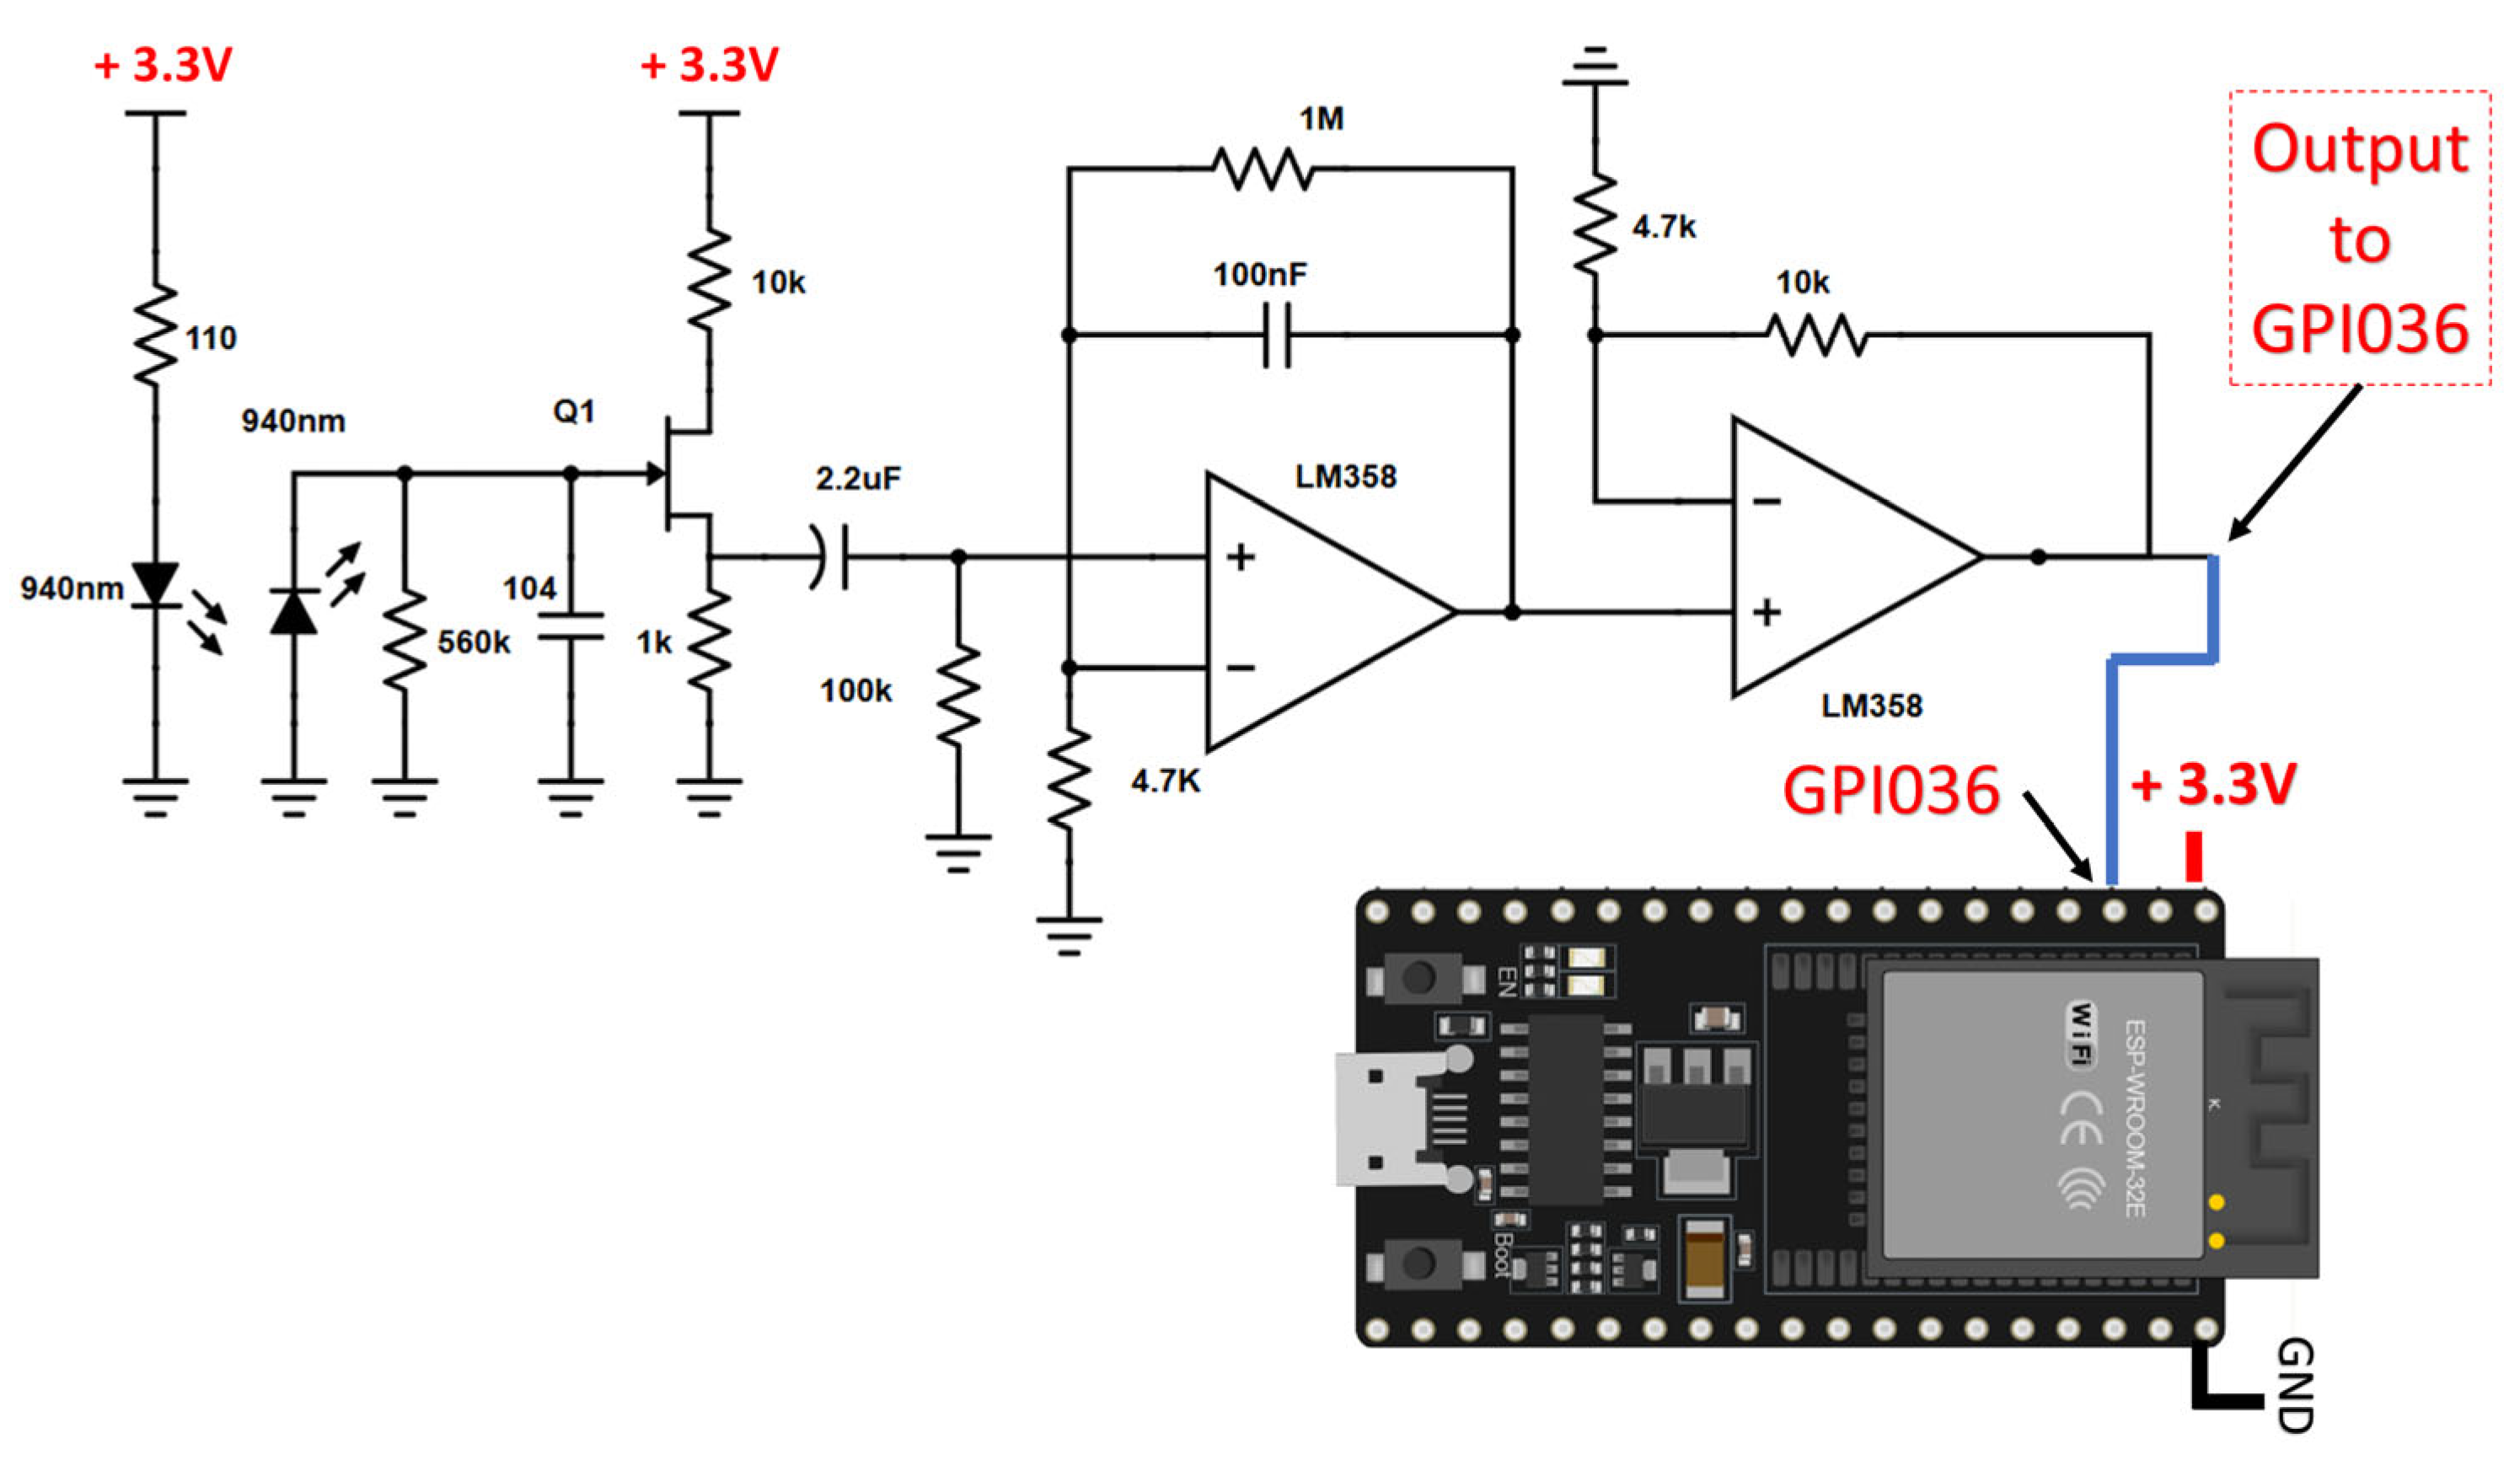
Figure 2 represents an infrared sensor interface designed for use with an ESP microcontroller. It employs infrared LEDs and a phototransistor to detect infrared radiation. The resulting signal is amplified using LM358 operational amplifiers and is subsequently routed to GPIO36 of the ESP microcontroller, as illustrated in Figure 2. While the current configuration performs effectively, alternative types of photosensors may also be considered depending on the specific application requirements.
Key components:
  • Infrared LED: Emits infrared light at 940 nm.
  • Infrared LED used as a photosensor: Detects reflected infrared light at 940 nm.
  • Transistor JFET 2N5457: Provides initial signal amplification.
  • LM358 Op-Amps: Performs further amplification.
  • Resistors and Capacitors: Controls signal filtering and amplification.
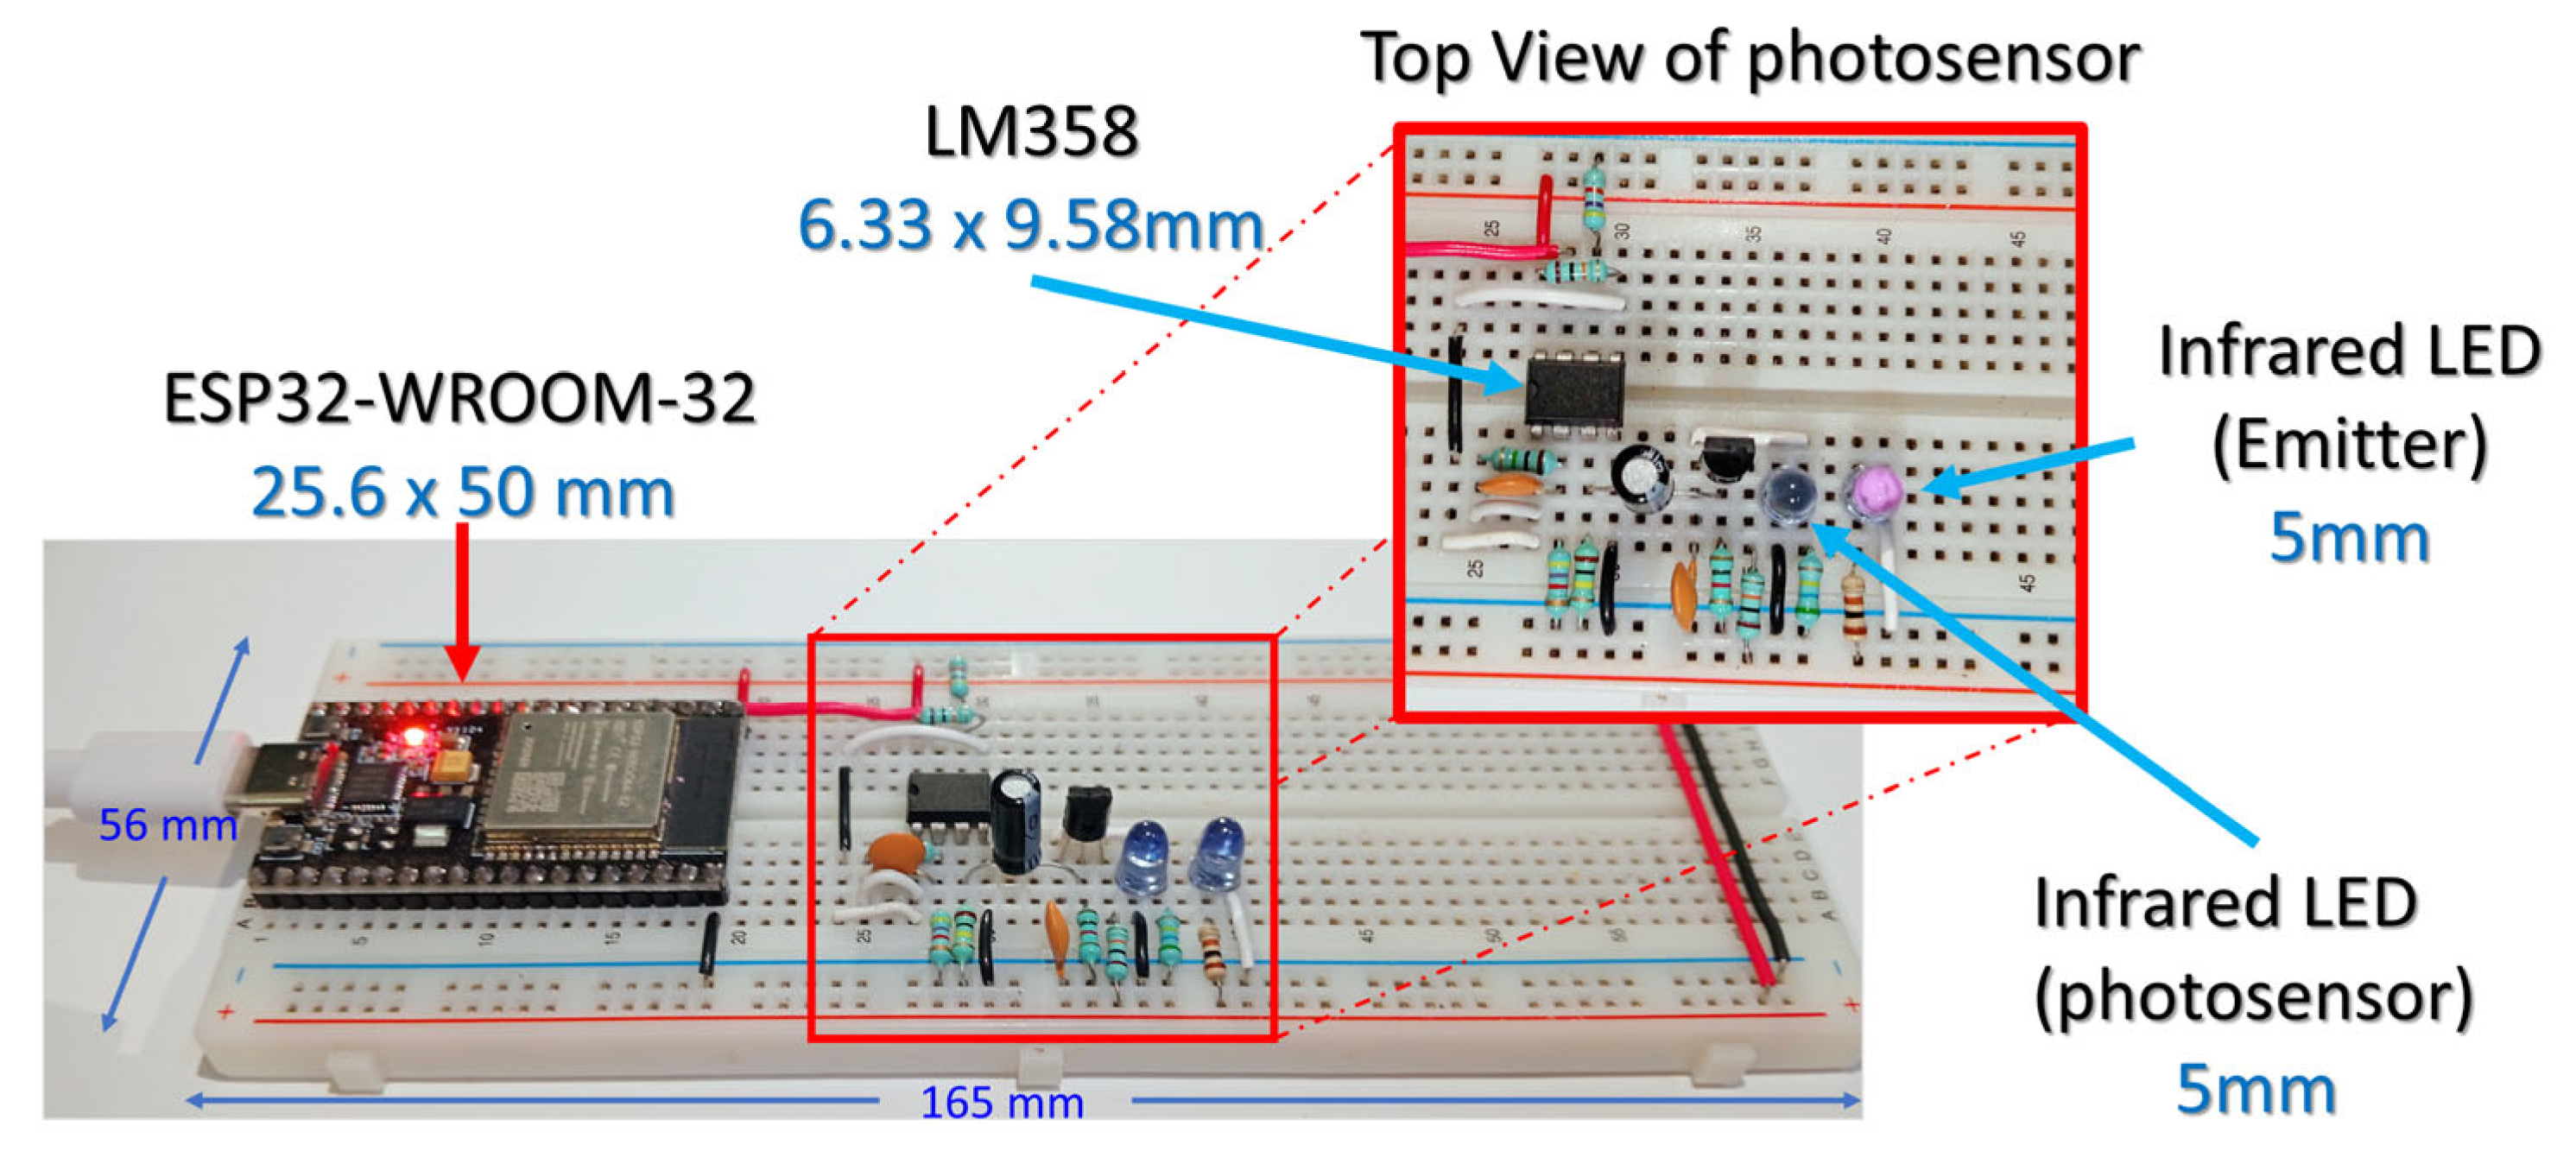
Figure 3 shows the circuit used in this work; this employs one IR LED as an emitter and a second IR LED as a photosensor of the PPG signals. The analog signal is conditioned via the LM358 and digitized by the ESP32 for real-time transmission to a GUI. This configuration demonstrates a minimalist, component-accessible approach to optical biosensing suitable for embedded systems and educational applications.
The PPG signal must be pre-processed in the analog domain to eliminate unwanted low-frequency components. For this purpose, a passive RC high-pass filter is proposed. Equation (1) presents the design of the filter employed in this work, with component values of R = 100 kΩ and C = 2.2 µF, resulting in a cutoff frequency f c (−3 dB) of approximately 0.72 Hz, this represents a high-pass cutoff frequency.
f c = 1 2 π R C
Low-pass cutoff frequency calculated from feedback resistor of the opam is Rf = 1MΩ and feedback capacitor is Cf = 100 nF yields ≈ 1.59  Hz. A narrow (0.72 Hz–1.59 Hz), well-defined pass-band minimizes waveform wander and high-frequency jitter, yielding a stable, high-contrast PPG trace on the display. Users see a clean, reproducible pulse contour, which simplifies envelope detection, beat-to-beat interval calculation, and real-time visualization.

2.2. Firmware Implementation

The ESP32 firmware was developed using the Arduino framework in the Arduino IDE. It implements a finite state machine (FSM) to manage command-based acquisition control, real-time signal display, and UART-based data transmission. Analog signals are acquired via the onboard 12-bit ADC (The signal in the ~0–3.3 V range with a sampling rate of 500 samples/s (2 ms), then transmitted in fixed-size blocks to a host computer for real-time processing. Figure 4 illustrates the PPG capture mode in the GUI, which relies on this firmware.
The signal acquisition process of the PPG System for acquiring signals starts by sampling the photodetector output via ADC of the microcontroller (ESP32 or any other MCU) based on the firmware of this project. Once samples are collected, they are packaged (e.g., in binary blocks of 64 samples) and transmitted via UART/Serial communication to the host computer or GUI.
The communication protocol supports commands provided by state machines (CONNECT, STREAM_ON, START_STREAM, STOP_STREAM, etc.) to synchronize acquisition with the GUI. This allows visualizing the waveform in real-time, while also extracting cardiovascular parameters for monitoring and analysis. The sampling frequency (e.g., 100–500 Hz) is chosen to capture cardiovascular dynamics accurately while minimizing noise and aliasing.
The GUI connectivity of this work can be improved by leveraging the ESP32’s Wi-Fi (TCP/UDP) capabilities. Studies have highlighted this advantage of the MCU, making it ideal for energy-efficient, low-cost, edge-based Wi-Fi IoT applications. Most importantly, the ESP32 does not require additional hardware for IoT development [17,18].

2.3. Graphical User Interface

A custom desktop GUI was developed in Python 3.13.0 (64-bit) using the PyQt5 and PyQtGraph libraries. The application enables serial communication with the ESP32 microcontroller, displays the acquired PPG signal in real time, and computes physiological metrics such as heart rate. All acquired data is saved in CSV format, including timestamps, to facilitate post-processing and offline analysis using scientific Python tools such as NumPy. For validation purposes, signals were also acquired using a PSoC-based module with a basic configuration and analyzed offline to verify consistency in signal acquisition. However, this work focuses on the ESP32 to validate the electrical circuit and the GUI. The PSoC is employed solely to confirm that the data signals were correctly captured through the platform design.
The digital filter used in this work was implemented on the GUI side and corresponds to a second-order (N = 2) low-pass IIR Butterworth filter with a cutoff frequency f c of 5 Hz and a sampling frequency f s of 500 Hz. This filter was selected because it provides a smooth response; for example, it exhibits no ripples in the pass band, thereby preserving the morphology of the PPG signals. The parameters adopted here offer an appropriate balance between performance and computational cost when compared to an FIR filter. To obtain the filter coefficients, the butter function in Python was used as follows:
b ,   a   =   butter ( N ,   W n ,   btype   =   low )
Equation (2) is used for calculate W n .
W n = f c f s / 2
The coefficients of the second-order low-pass Butterworth filter, with a cutoff frequency of 5 Hz and a sampling frequency of 500 Hz, are as follows:
b = [ 0.00094469 , 0.00188938 , 0.00094469 ] a = [ 1.0 , 1.91119707 , 0.91497583 ]
Coefficients b and a correspond to the numerator and denominator, respectively. In Equation (3), the resulting difference-equation form of the IIR filter used is presented.
y n = 0.00094469 · x n + 0.00188938 · x n 1 + 0.00094469 · x n 2 1.91119707 · y n 1 0.91497583 · y n 2

3. Build Instructions

Table 1 presents the bill of materials and a cost breakdown for the system components and Supplementary Materials. The design file summary is available in the Supplementary Materials.

4. Operating Instructions

To operate the PPG signal acquisition platform, ensure that the ESP32 microcontroller is properly connected to the host computer via USB and has been successfully programmed with the corresponding firmware. The device must remain powered and recognized by the system before launching the GUI. The following steps detail how to execute the GUI and initiate the data acquisition process:
  • Environment Setup
Authors must verify that the required software packages listed below are installed in the execution environment before running the code.
Third-party packages (install via pip or your package manager)
  • PyQt5—Graphical user-interface toolkit. Install with pip install PyQt5.
  • NumPy—Library for numerical computing, array manipulation, and linear-algebra operations. Install with pip install numpy.
  • pandas—Library for data manipulation and CSV/table input–output. Install with pip install pandas.
  • pyqtgraph—Library for real-time plotting and visualization. Install with pip install pyqtgraph. Note: pyqtgraph depends on PyQt5 and NumPy.
  • SciPy—Collection of scientific computing tools, including signal-processing routines. Install with pip install scipy.
  • serial (found at site-packages\serial)—This corresponds to the PySerial package; install with pip install pyserial.
  • Launching the GUI
Run the main Python script (e.g., main.py) from the project directory using a terminal or an integrated development environment (IDE). This launches the custom GUI application designed for serial communication and real-time signal visualization.
  • To launch the GUI application, users may proceed in one of the following ways:
  • Option 1: Run the script directly using Python by executing the following command in the terminal:
  • python main.py
  • Option 2: Alternatively, the application can be launched by executing the standalone binary file (gui.exe) included in the Supplementary Materials. No Python installation is required for this option.
  • Device Connection
Upon launching, select the appropriate serial port corresponding to the ESP32 device from the dropdown menu. Click the “Connect” button to establish communication. The GUI will send an initialization command and await a response from the microcontroller.
  • Starting Streaming PPG
Once connected, press the “Real-time PPG viewer tab” to display the waveform in real time.
  • Start Capture
Users can press the “Start Capture” button to save the acquired signal in CSV format, including timestamps and physiological metrics, enabling offline analysis.
  • Stopping and Disconnecting
To terminate the session, click the “Stop” button. The ESP32 halts acquisition and returns to idle mode. Press “Disconnect” to close the serial connection before exiting the GUI.
  • HRV Analysis from Captures folder
The user must run the file hrv_batch, located in the folder named “captures”, which contains CSV files saved from the GUI. This file is used for HRV analysis and to perform offline processing. The Supplementary Files include PPG signals from four different subjects, with ten one-minute signals each, allowing visualization of the performance of the developed hardware and software.
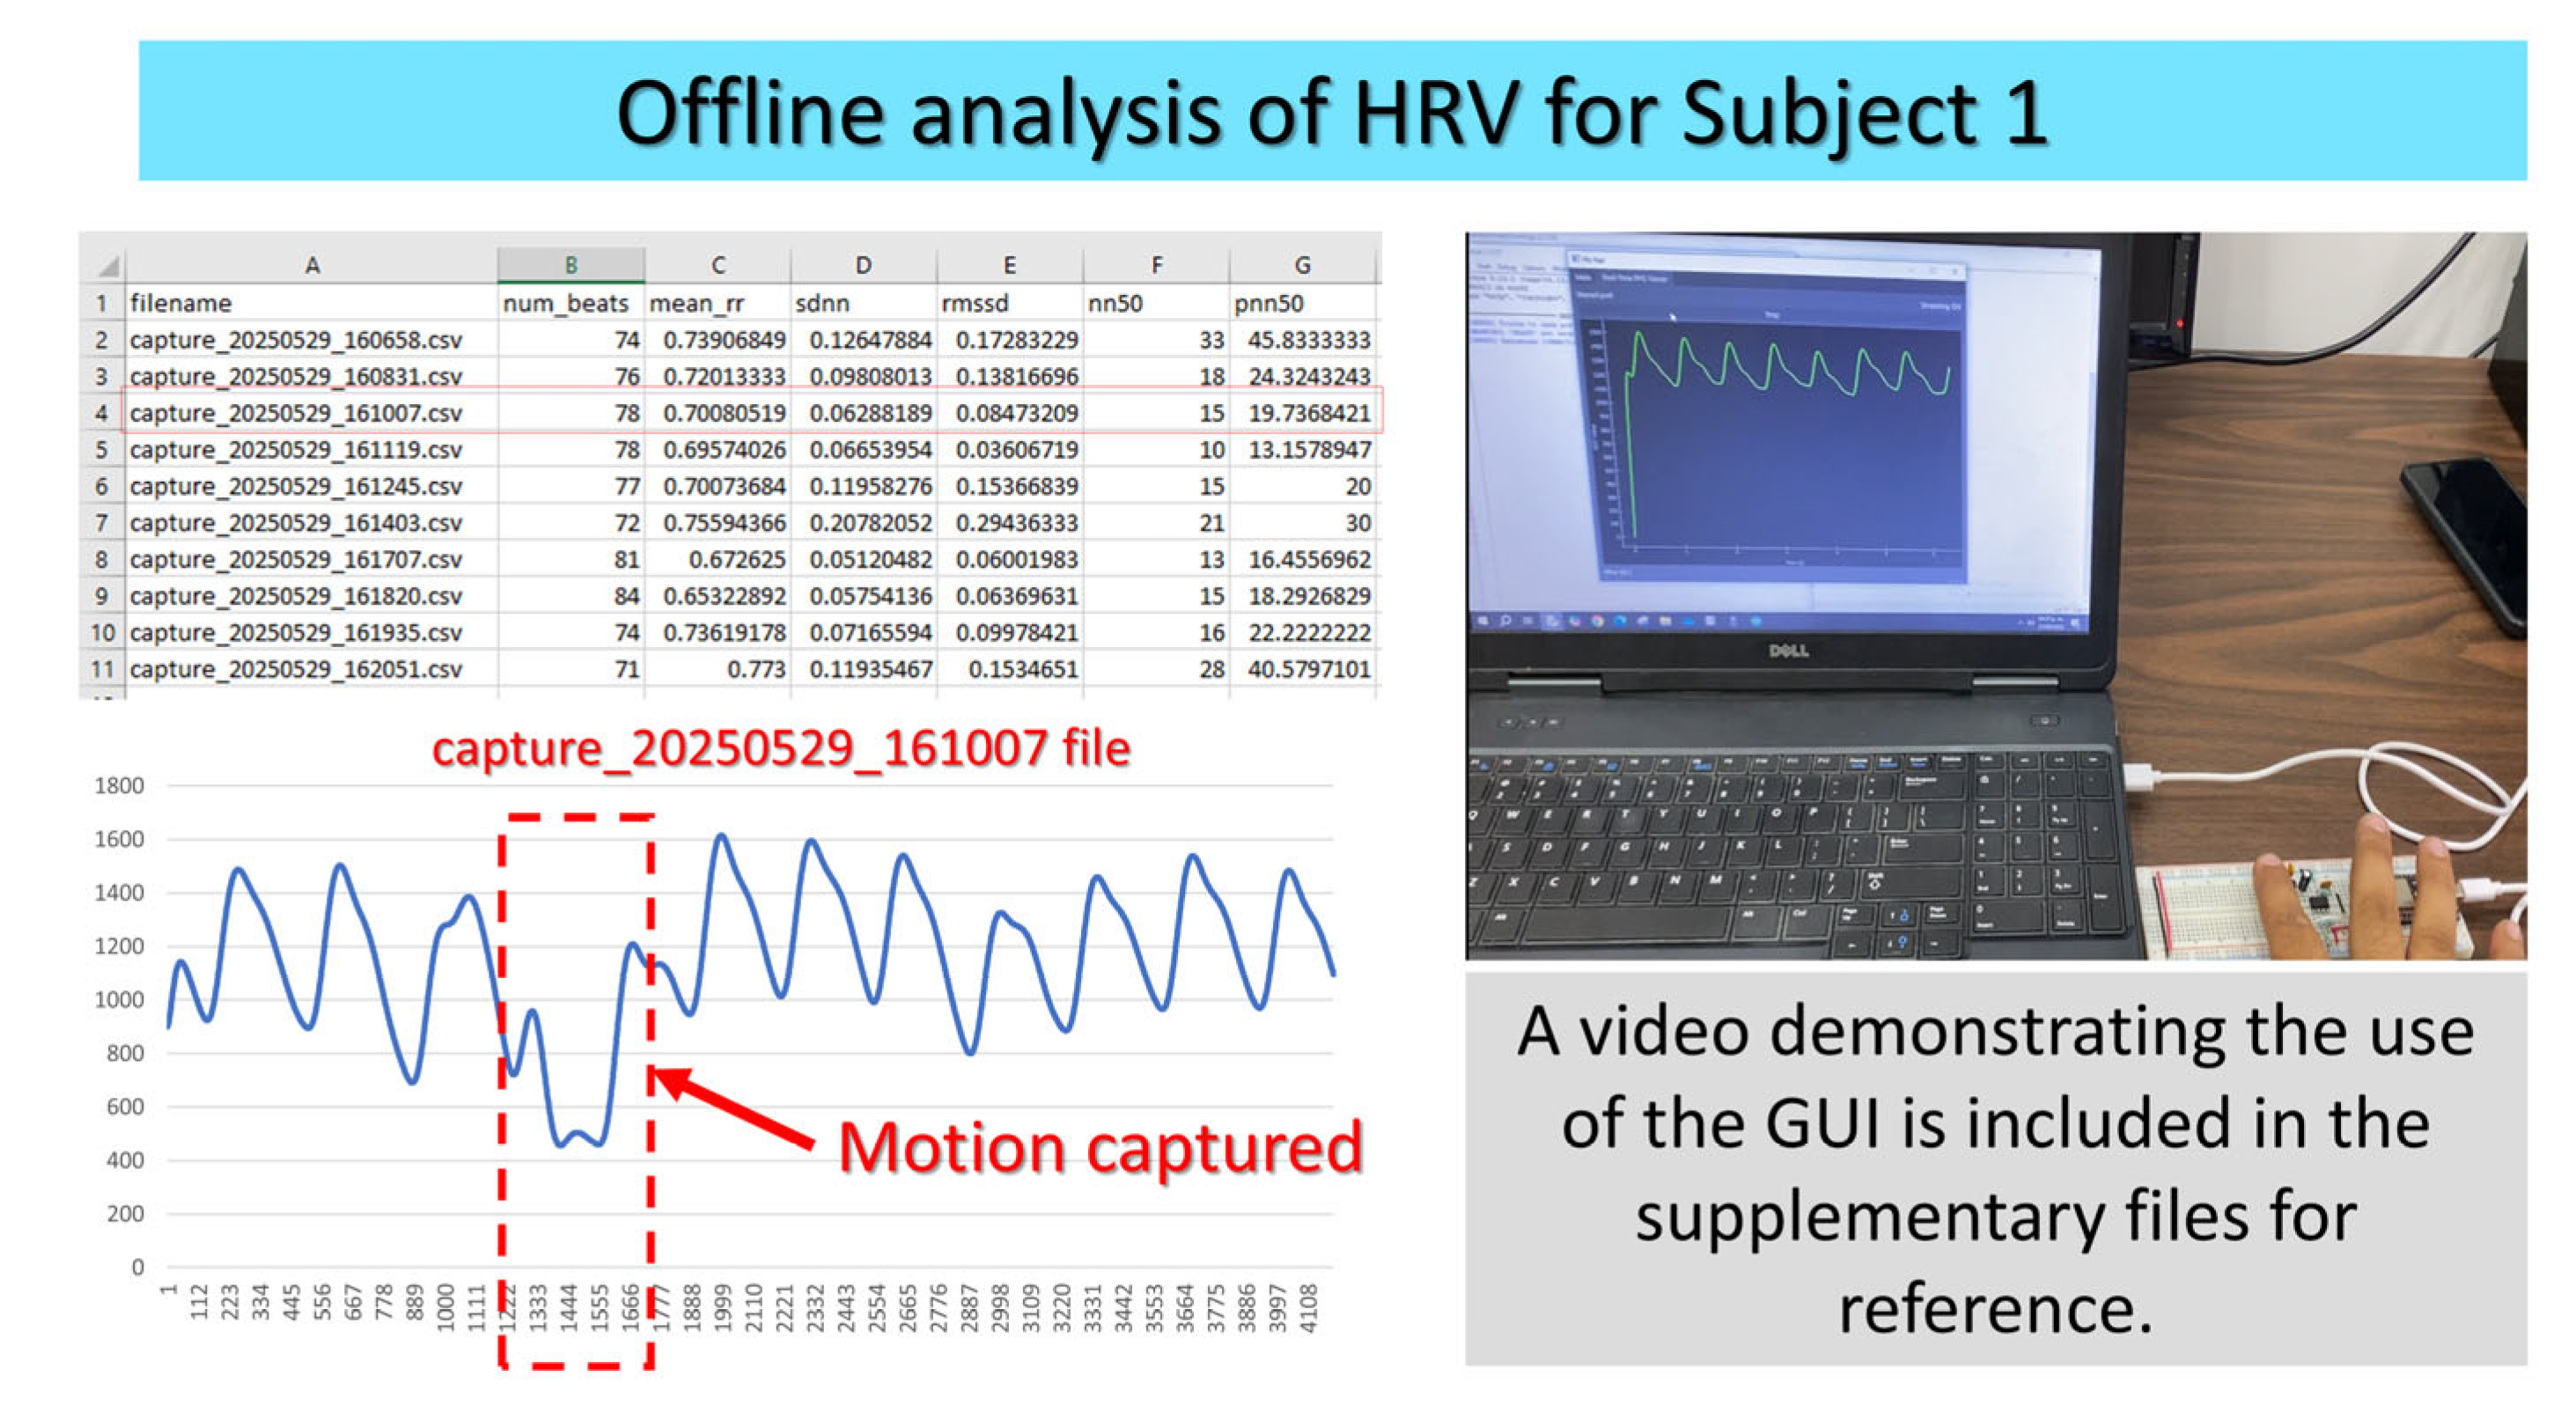
Figure 5 shows a modular GUI-based analysis of HRV data. Left: summary table of HRV metrics (meanNN, SDNN, RMSSD, NN50, pNN50); Pulse Amplitude Variability (PAV) metrics (mean_amp, std_amp, cv_amp, RMSSD_amp, NN50_amp, pNN50_amp); pulse morphology descriptors that capture waveform dynamics (mean_rise, std_rise, mean_fall, std_fall). All metrics were extracted from timestamped capture files. Bottom left: waveform visualization from file capture_20250529_161007, with motion artifact segment annotated. Top right: Image of a video of GUI in use, showing real-time interaction with sensor hardware. This demonstration video is included in Supplementary Materials in the folder named ‘’images’’. Note that, these signals were taken in an educational environment; the signals shared in this work can vary due to changes in the desired frequencies of the pass-band filter due to this.
  • Ensure that the sensor is properly attached to the measurement site (e.g., fingertip) and that environmental noise is minimized for optimal signal quality.

5. Validation

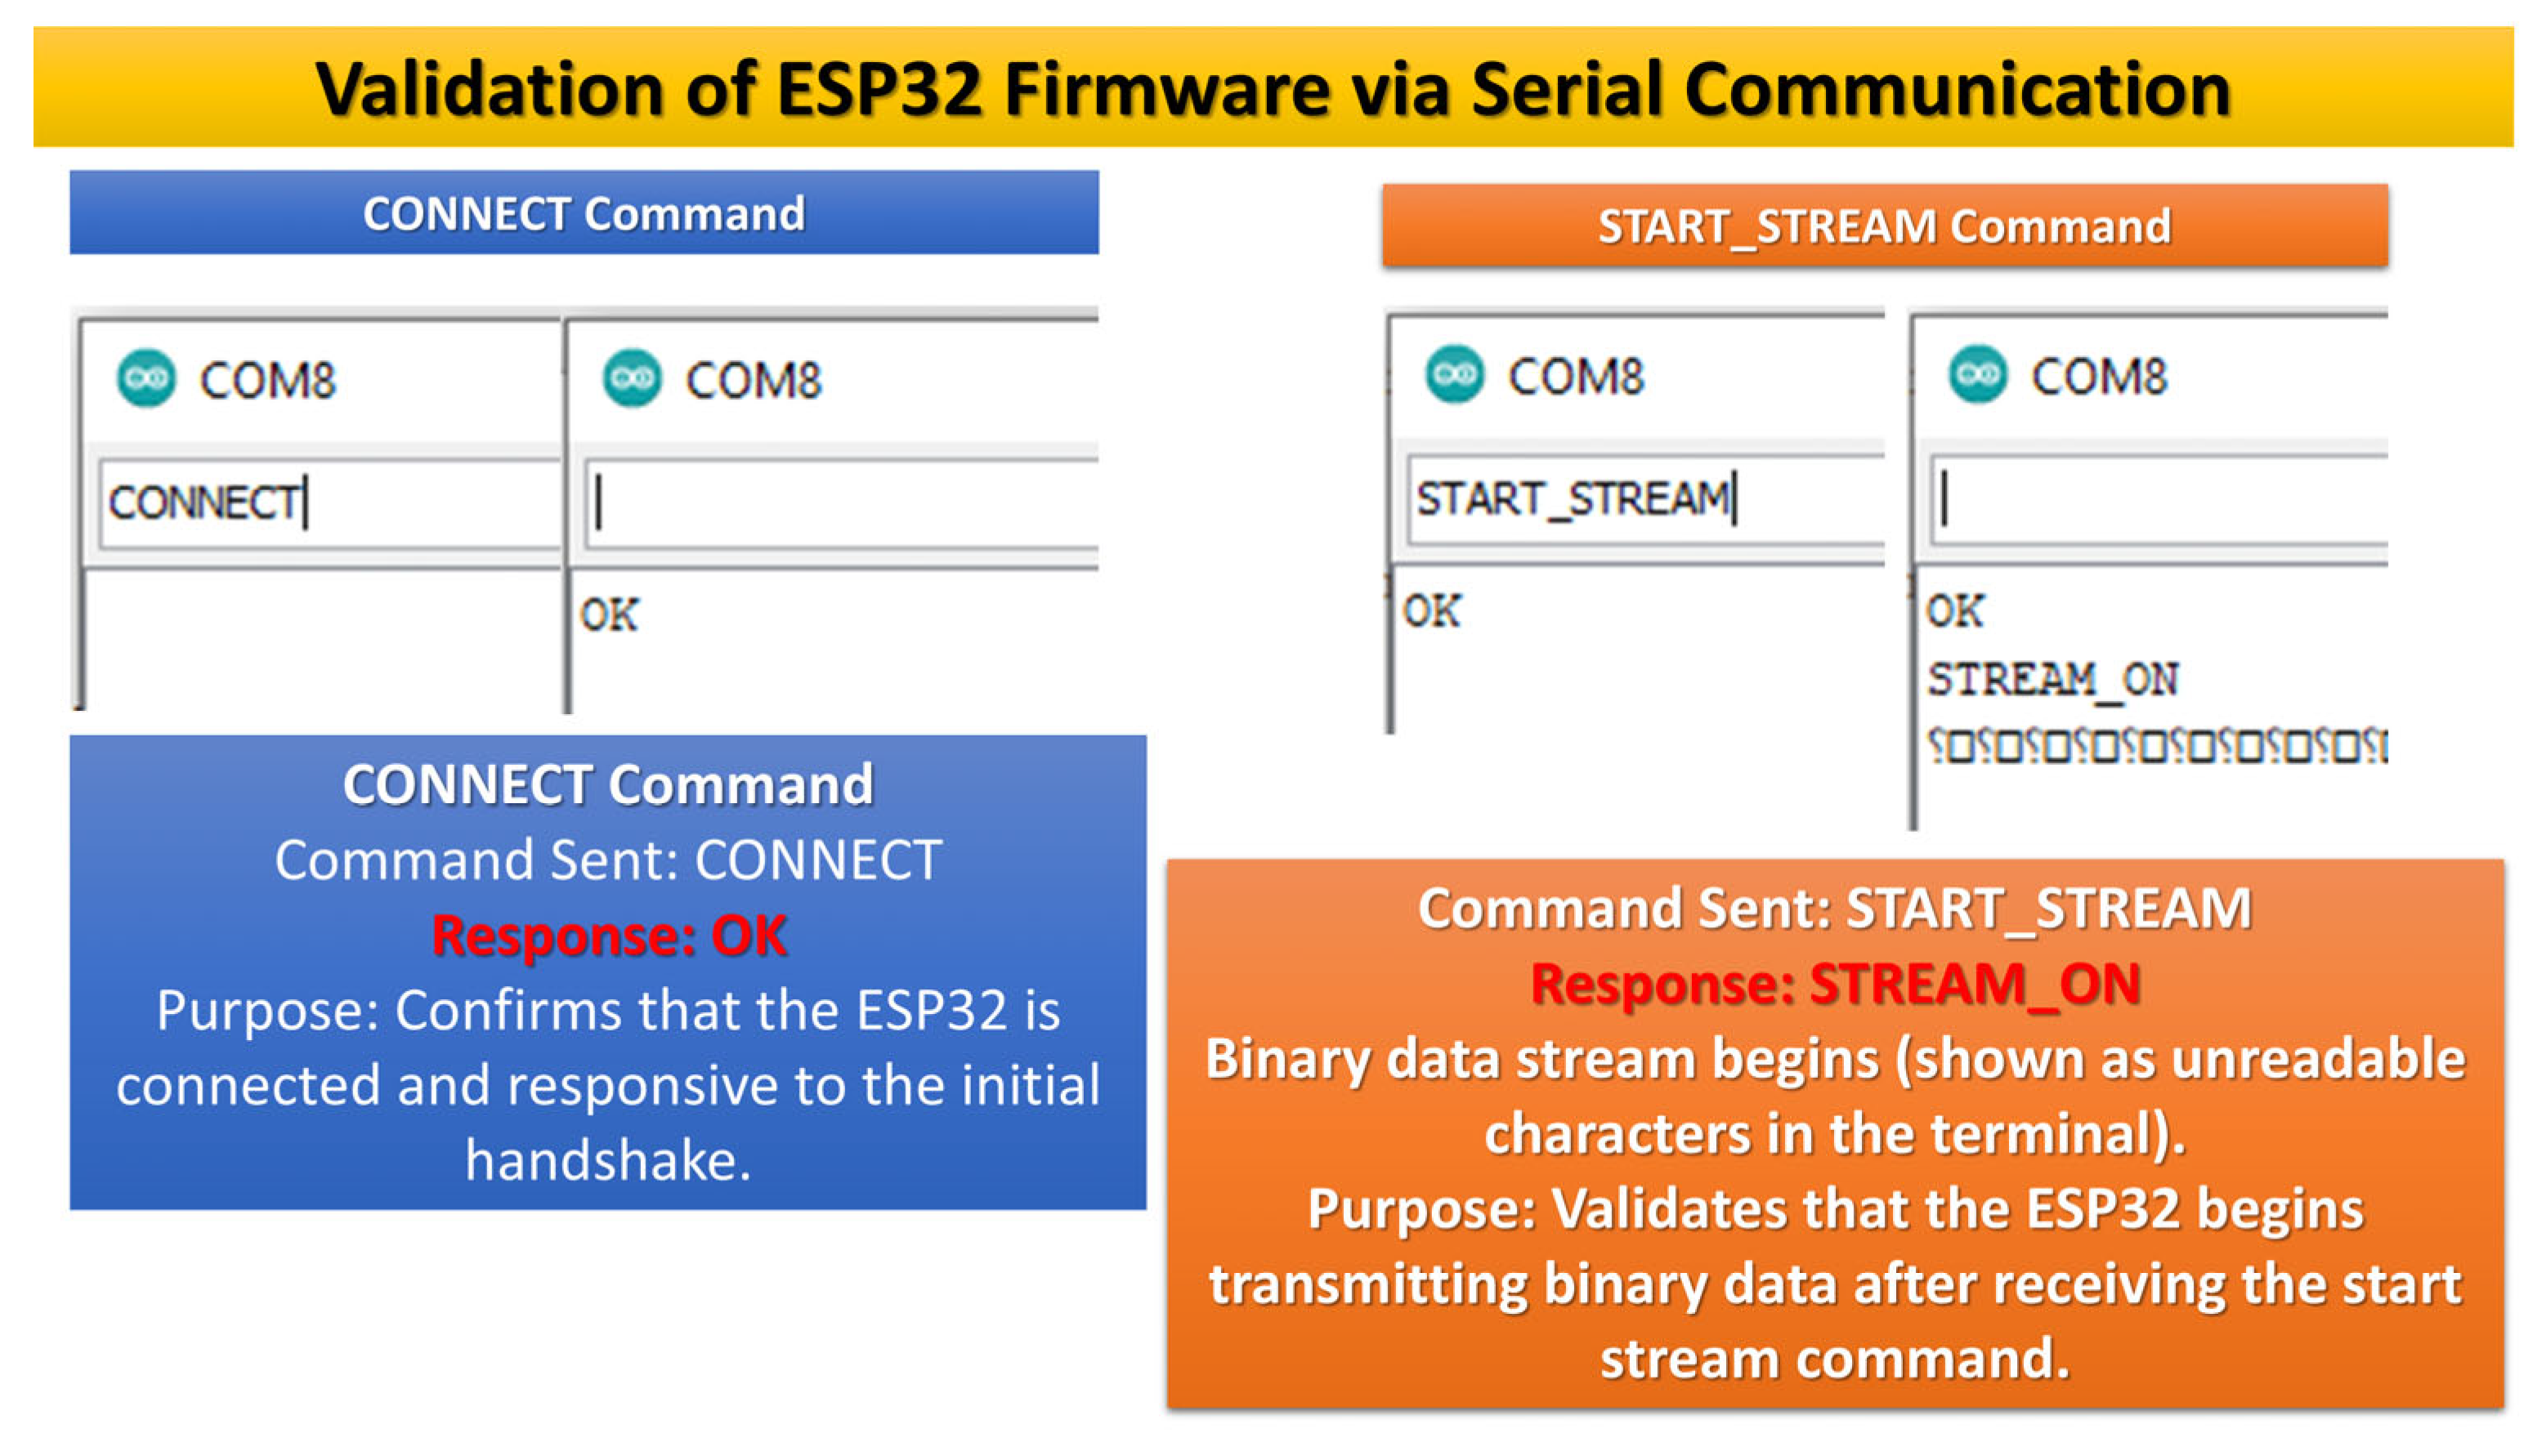
This section describes the validation of the ESP32 firmware via serial communication. Once the firmware is loaded onto the ESP32 board, it is recommended to verify and validate its operation using the Arduino Serial Monitor at 230400 Bauds. The following steps outline the procedure for validating the ESP32 firmware through serial commands on port COMX. Figure 6 and Figure 7 show the CONNECT, START_STREAM, STOP_STREAM, and DISCONNECT commands, respectively.
To validate the device’s capability to capture and analyze PPG signals, test measurements were performed using a custom Python-based GUI. The interface enables real-time signal visualization, data storage, and instant computation of physiological metrics such as heart rate. Representative measurements are displayed as plots and summary tables, demonstrating the extraction of reliable biometric data. To evaluate the hardware and software, the synchronization of an ESP32-based system with the GUI was compared to a PSoC module. The PSoC firmware was employed only as a basic configuration and is not reported here, as the PSoC provides analog modules, such as op-amps and comparators, which are not available in the ESP32.
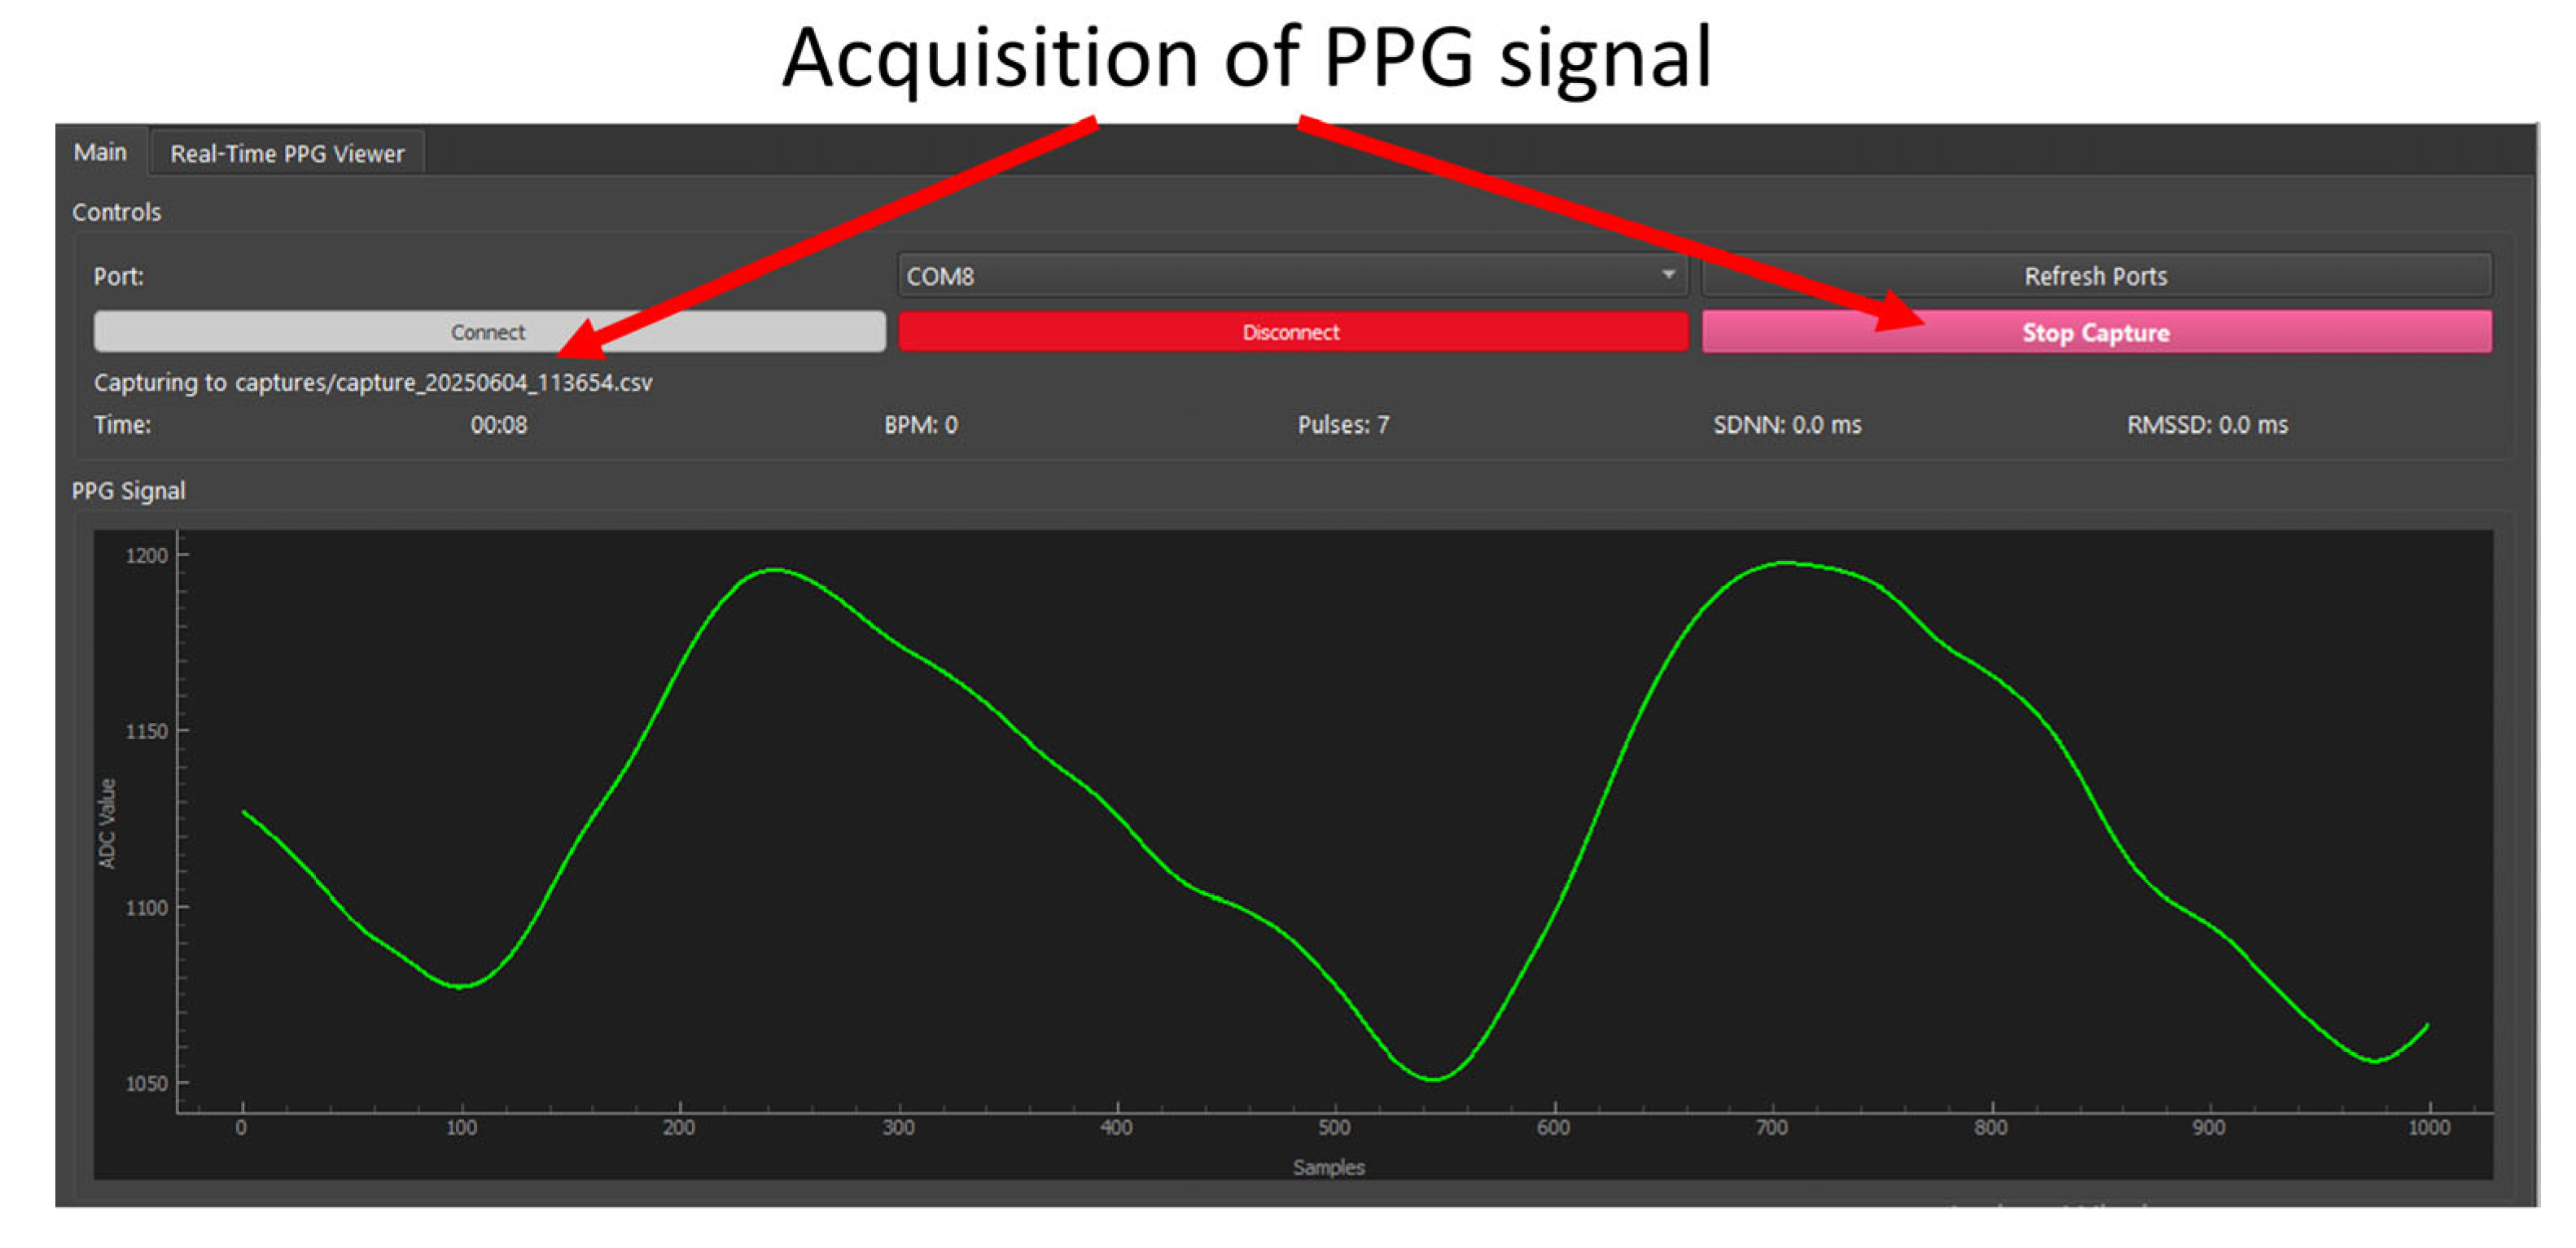
Figure 8 illustrates the main graphical user interface as displayed upon launching the application (python gui.py) developed for this project.
Figure 9 shows the PPG signal capture mode within the custom-developed Python GUI. In this mode, the GUI establishes a serial connection with the ESP32 and sends a command to initiate data streaming. Upon receiving the command, the ESP32 transitions to the streaming state within its finite state machine (FSM). In this state, it triggers periodic ADC sampling at a fixed rate (e.g., 500 Hz). The sampled data is buffered and transmitted in binary blocks via UART to the host computer, where the GUI decodes and visualizes the PPG waveform while computing relevant physiological metrics, such as heart rate (BPM) and heart rate variability (HRV). Integrated user controls facilitate acquisition management, adjustable visualization scaling, and optional data logging, optimizing real-time signal analysis.
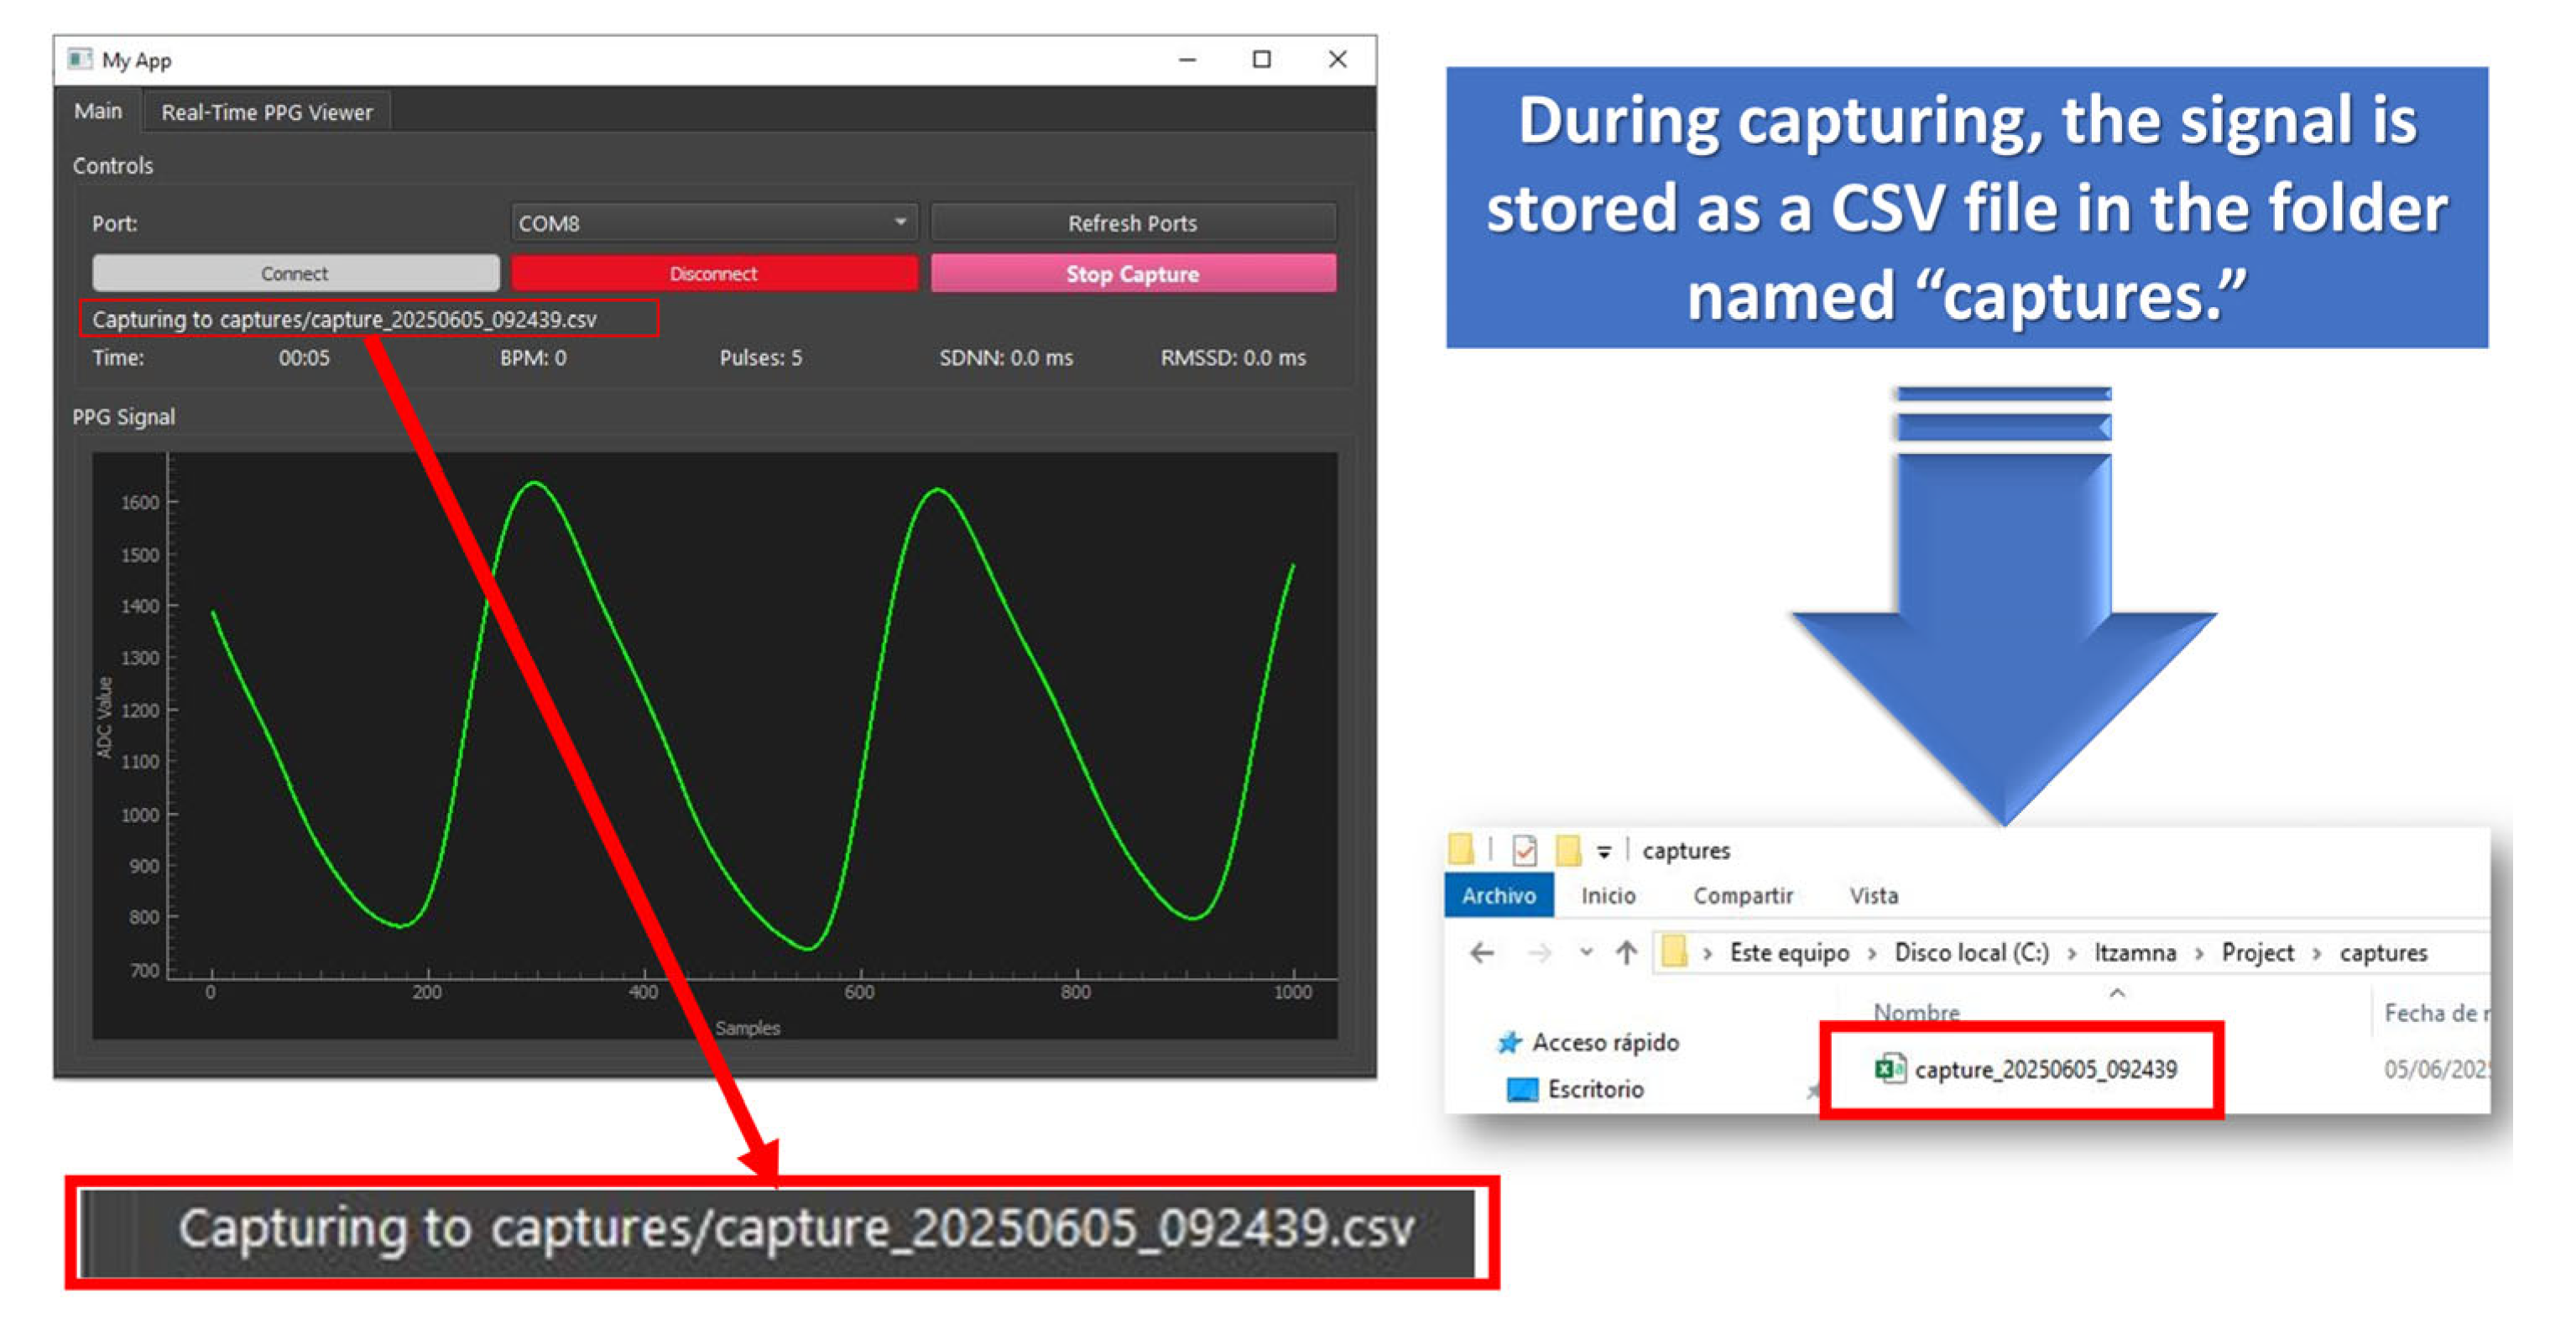
Figure 10 illustrates the real-time PPG acquisition interface and the subsequent storage of the recorded signal. The upper panel displays the application window during an active capture session, indicating the elapsed time, current BPM, pulse count, and HRV metrics, while a status bar at the bottom confirms that data is being written to a CSV file. The lower panels depict the “captures” directory in the host file system, where the CSV file—named according to the capture date and time—is automatically created and stored. This arrangement demonstrates the seamless transfer of time-series PPG data from the GUI front end to persistent storage for later analysis.
Figure 11 shows the “REAL-TIME PPG Viewer” tab with the streaming process activated. In this view, the PPG signal is plotted in real time, allowing the user to observe its dynamic behavior. Additionally, the BPM is computed in real time based on the duration of the most recent RR interval.
The data stream can be stopped at any time using the “STOP” button, offering flexibility for analysis. This real-time visualization is particularly useful for monitoring system performance, as it enables users to evaluate whether the analog and digital filters are effectively attenuating noise and preserving the integrity of the physiological signal.

6. Conclusions

This work presents a comprehensive and unified platform for PPG signal acquisition and real-time visualization, integrating an ESP32-based hardware module with a Python-based desktop GUI. The system samples PPG signals at 500~Hz and transmits data in buffered blocks of 64 samples via a robust serial connection operating at 230400 baud, ensuring lossless and continuous data streaming. The designed module demonstrated reliable performance in sustained data transfer and efficient handling of 16-bit PPG samples. Custom digital filtering and peak detection algorithms applied offline in the GUI enabled accurate computation of BPM and HRV metrics with minimal latency, facilitating effective real-time physiological monitoring. Recordings from four subjects were used to validate the PPG signals against the waveforms reported in the literature. Notably, subject 4 is an elderly individual, at 77 years old.
From the hardware perspective, the analog front-end, including an LED operating in photovoltaic mode, combined with a 2N5457-based amplifier and optimized resistor network, was carefully engineered to maximize the signal-to-noise ratio and maintain appropriate input impedance for precise PPG acquisition via the ESP32 ADC. All source code and firmware have been released under an open-source license to encourage further development and adaptation. The modular design facilitates integration of novel signal processing algorithms or hardware enhancements with minimal modification effort. The user can modify the analog and digital passband filters presented in this work (0.72 Hz–1.59 Hz) according to the desired frequencies.
As part of future work, the system will be extended to support real-time HRV computation over one-minute capture windows using the PSoC, which leverages integrated op-amps and comparators to auto-calibrate the threshold used for BPM measurements. This approach will enable short-term variability analysis directly from the live acquisition stream, improving temporal resolution and enhancing clinical relevance in ambulatory cardiovascular monitoring.
Overall, this platform provides a cost-effective, scalable, and accurate tool for non-invasive cardiovascular monitoring, with promising applications in both clinical and research settings.

Supplementary Materials

The following supporting information can be downloaded at: https://www.mdpi.com/article/10.3390/hardware3040015/s1.
NameTypeDescription
S1bpm_detector (.py)Script of python source code used
S2data_capture (.py)Script of python source code used
S3gui (.py)Script of python source code used
S4main (.py)Script of python source code used
S5ppg_plot_widget (.py)Script of python source code used
S6serial_utils (.py)Script of python source code used
S7Style (.py)Script of python source code used
S8images (Folder) supplementary files (video, images and captures of GUI in use)
S9Capture (Folder)Optionally or automatically generated (.Csv files captured)
S10firmware_esp32wroom Arduino file (Ino)Firmware use for ESP32-WROOM-32
S11Subject_1 (.Csv)10 captures of Subject_1
S12Subject_2 (.Csv)10 captures of Subject_1
S13Subject_3 (.Csv)10 captures of Subject_1
S14Subject_4 (.Csv)10 captures of Subject_1
S15hrv_batch (.py)Script for HRV analysis offline from Python IDLE
S16Video (.mov)Video demonstrating the hardware in use
S17gui (.exe)Executable file of the GUI

Author Contributions

Conceptualization, J.E.M.-V.; methodology, J.E.M.-V.; software, J.E.M.-V.; validation, E.Y.N.-P.; formal analysis, R.C.-C.; investigation, W.G.-G.; resources, G.P.-A., W.F.-F.; data cura-tion, R.I.A.-F.; writing—original draft preparation, J.E.M.-V.; writing—review and editing, L.V.M.-R.; supervision, O.S.; project administration, W.F.-F.; funding acquisition, G.P.-A., W.F.-F. All authors have read and agreed to the published version of the manuscript.

Funding

This research received no external funding.

Institutional Review Board Statement

Not applicable.

Informed Consent Statement

Not applicable.

Data Availability Statement

The original contributions presented in this study are included in the article/Supplementary Material. Further inquiries can be directed to the corresponding author.

Conflicts of Interest

The authors declare no conflicts of interest.

References

  1. Caturano, A. (Ed.) Cardiovascular and Metabolic Disease: New Treatment and Future Directions 2.0; MDPI Books: Basel, Switzerland, 2024; Available online: https://www.mdpi.com/books/reprint/9573 (accessed on 1 May 2025).
  2. Scardulla, F.; Cosoli, G.; Spinsante, S.; Poli, A.; Iadarola, G.; Pernice, R.; Busacca, A.; Pasta, S.; Scalise, L.; D’Acquisto, L. Photoplethysmograhic sensors, potential and limitations: Is it time for regulation? A comprehensive review. Measurement 2023, 218, 113150. [Google Scholar] [CrossRef]
  3. Castiglioni, P.; Meriggi, P.; Di Rienzo, M.; Lombardi, C.; Parati, G.; Faini, A. Heart Rate Variability from Wearable Photoplethysmography Systems: Implications in Sleep Studies at High Altitude. Sensors 2022, 22, 2891. [Google Scholar] [CrossRef] [PubMed]
  4. Cui, H.; Wang, Z.; Yu, B.; Jiang, F.; Geng, N.; Li, Y.; Xu, L.; Zheng, D.; Zhang, B.; Lu, P.; et al. Statistical Analysis of the Consistency of HRV Analysis Using BCG or Pulse Wave Signals. Sensors 2022, 22, 2423. [Google Scholar] [CrossRef] [PubMed]
  5. Abdullah, S.; Hafid, A.; Folke, M.; Lindén, M.; Kristoffersson, A. PPGFeat: A novel MATLAB toolbox for extracting PPG fiducial points. Front. Bioeng. Biotechnol. 2023, 11, 1199604. [Google Scholar] [CrossRef] [PubMed]
  6. Tang, Q.; Chen, Z.; Menon, C.; Ward, R.; Elgendi, M. PPGTempStitch: A MATLAB Toolbox for Augmenting Annotated Photoplethsmogram Signals. Sensors 2021, 21, 4007. [Google Scholar] [CrossRef] [PubMed]
  7. Tang, Q.; Chen, Z.; Allen, J.; Alian, A.; Menon, C.; Ward, R.; Elgendi, M. PPGSynth: An innovative toolbox for synthesizing regular and irregular photoplethysmography waveforms. Front. Med. 2020, 7, 597774. [Google Scholar] [CrossRef] [PubMed]
  8. Boccignone, G.; Conte, D.; Cuculo, V.; D’Amelio, A.; Grossi, G.; Lanzarotti, R.; Mortara, E. pyVHR: A Python framework for remote photoplethysmography. PeerJ Comput. Sci. 2022, 8, e929. [Google Scholar] [CrossRef] [PubMed]
  9. Le, V.D.; Ho, H.B.; Karolcik, S.; Hernandez, B.; Greeff, H.; Nguyen, V.H.; Phan, N.Q.K.; Le, T.P.; Thwaites, L.; Georgiou, P.; et al. vital_sqi: A Python package for physiological signal quality control. Front. Physiol. 2022, 13, 1020458. [Google Scholar] [PubMed]
  10. Goda, M.Á.; Charlton, P.H.; Behar, J.A. pyPPG: A Python toolbox for comprehensive photoplethysmography signal analysis. Physiol. Meas. 2024, 45, 045001. [Google Scholar] [CrossRef] [PubMed]
  11. Yamane, N.; Mishra, V.; Goodwin, M.S. HeartView: An Extensible, Open-Source, Web-Based Signal Quality Assessment Pipeline for Ambulatory Cardiovascular Data. In Proceedings of the International Conference on Pervasive Computing Technologies for Healthcare, Malmö, Sweden, 27–29 November 2023; pp. 107–123. [Google Scholar]
  12. Fogarty, J.S. LOTUS Software to Process Wearable EmbracePlus Data. Sensors 2024, 24, 7462. [Google Scholar] [CrossRef] [PubMed]
  13. Cusini, I.; Rinaldi, R.; Castiglioni, P.; Faini, A.; Villa, F. Multi-wavelength SPAD photoplethysmography for cardio-respiratory monitoring. Front. Phys. 2023, 11, 952103. [Google Scholar] [CrossRef]
  14. Roldan, M.; Kyriacou, P.A. A Non-Invasive Optical Multimodal Photoplethysmography-Near Infrared Spectroscopy Sensor for Measuring Intracranial Pressure and Cerebral Oxygenation in Traumatic Brain Injury. Appl. Sci. 2023, 13, 5211. [Google Scholar] [CrossRef]
  15. Přibil, J.; Přibilová, A.; Frollo, I. Comparative Measurement of the PPG Signal on Different Human Body Positions by Sensors Working in Reflection and Transmission Modes. Eng. Proc. 2020, 2, 69. [Google Scholar] [CrossRef]
  16. Chatterjee, S.; Kyriacou, P.A. Monte Carlo Analysis of Optical Interactions in Reflectance and Transmittance Finger Photoplethysmography. Sensors 2019, 19, 789. [Google Scholar] [CrossRef]
  17. Hernandez, S.M.; Bulut, E. Wifi sensing on the edge: Signal processing techniques and challenges for real-world systems. IEEE Commun. Surv. Tutor. 2022, 25, 46–76. [Google Scholar] [CrossRef]
  18. Khalid, W.; Jamil, M.; Khan, A.A.; Awais, Q. Open-source Internet of Things-based supervisory control and data acquisition system for photovoltaic monitoring and control using HTTP and TCP/IP protocols. Energies 2024, 17, 4083. [Google Scholar] [CrossRef]
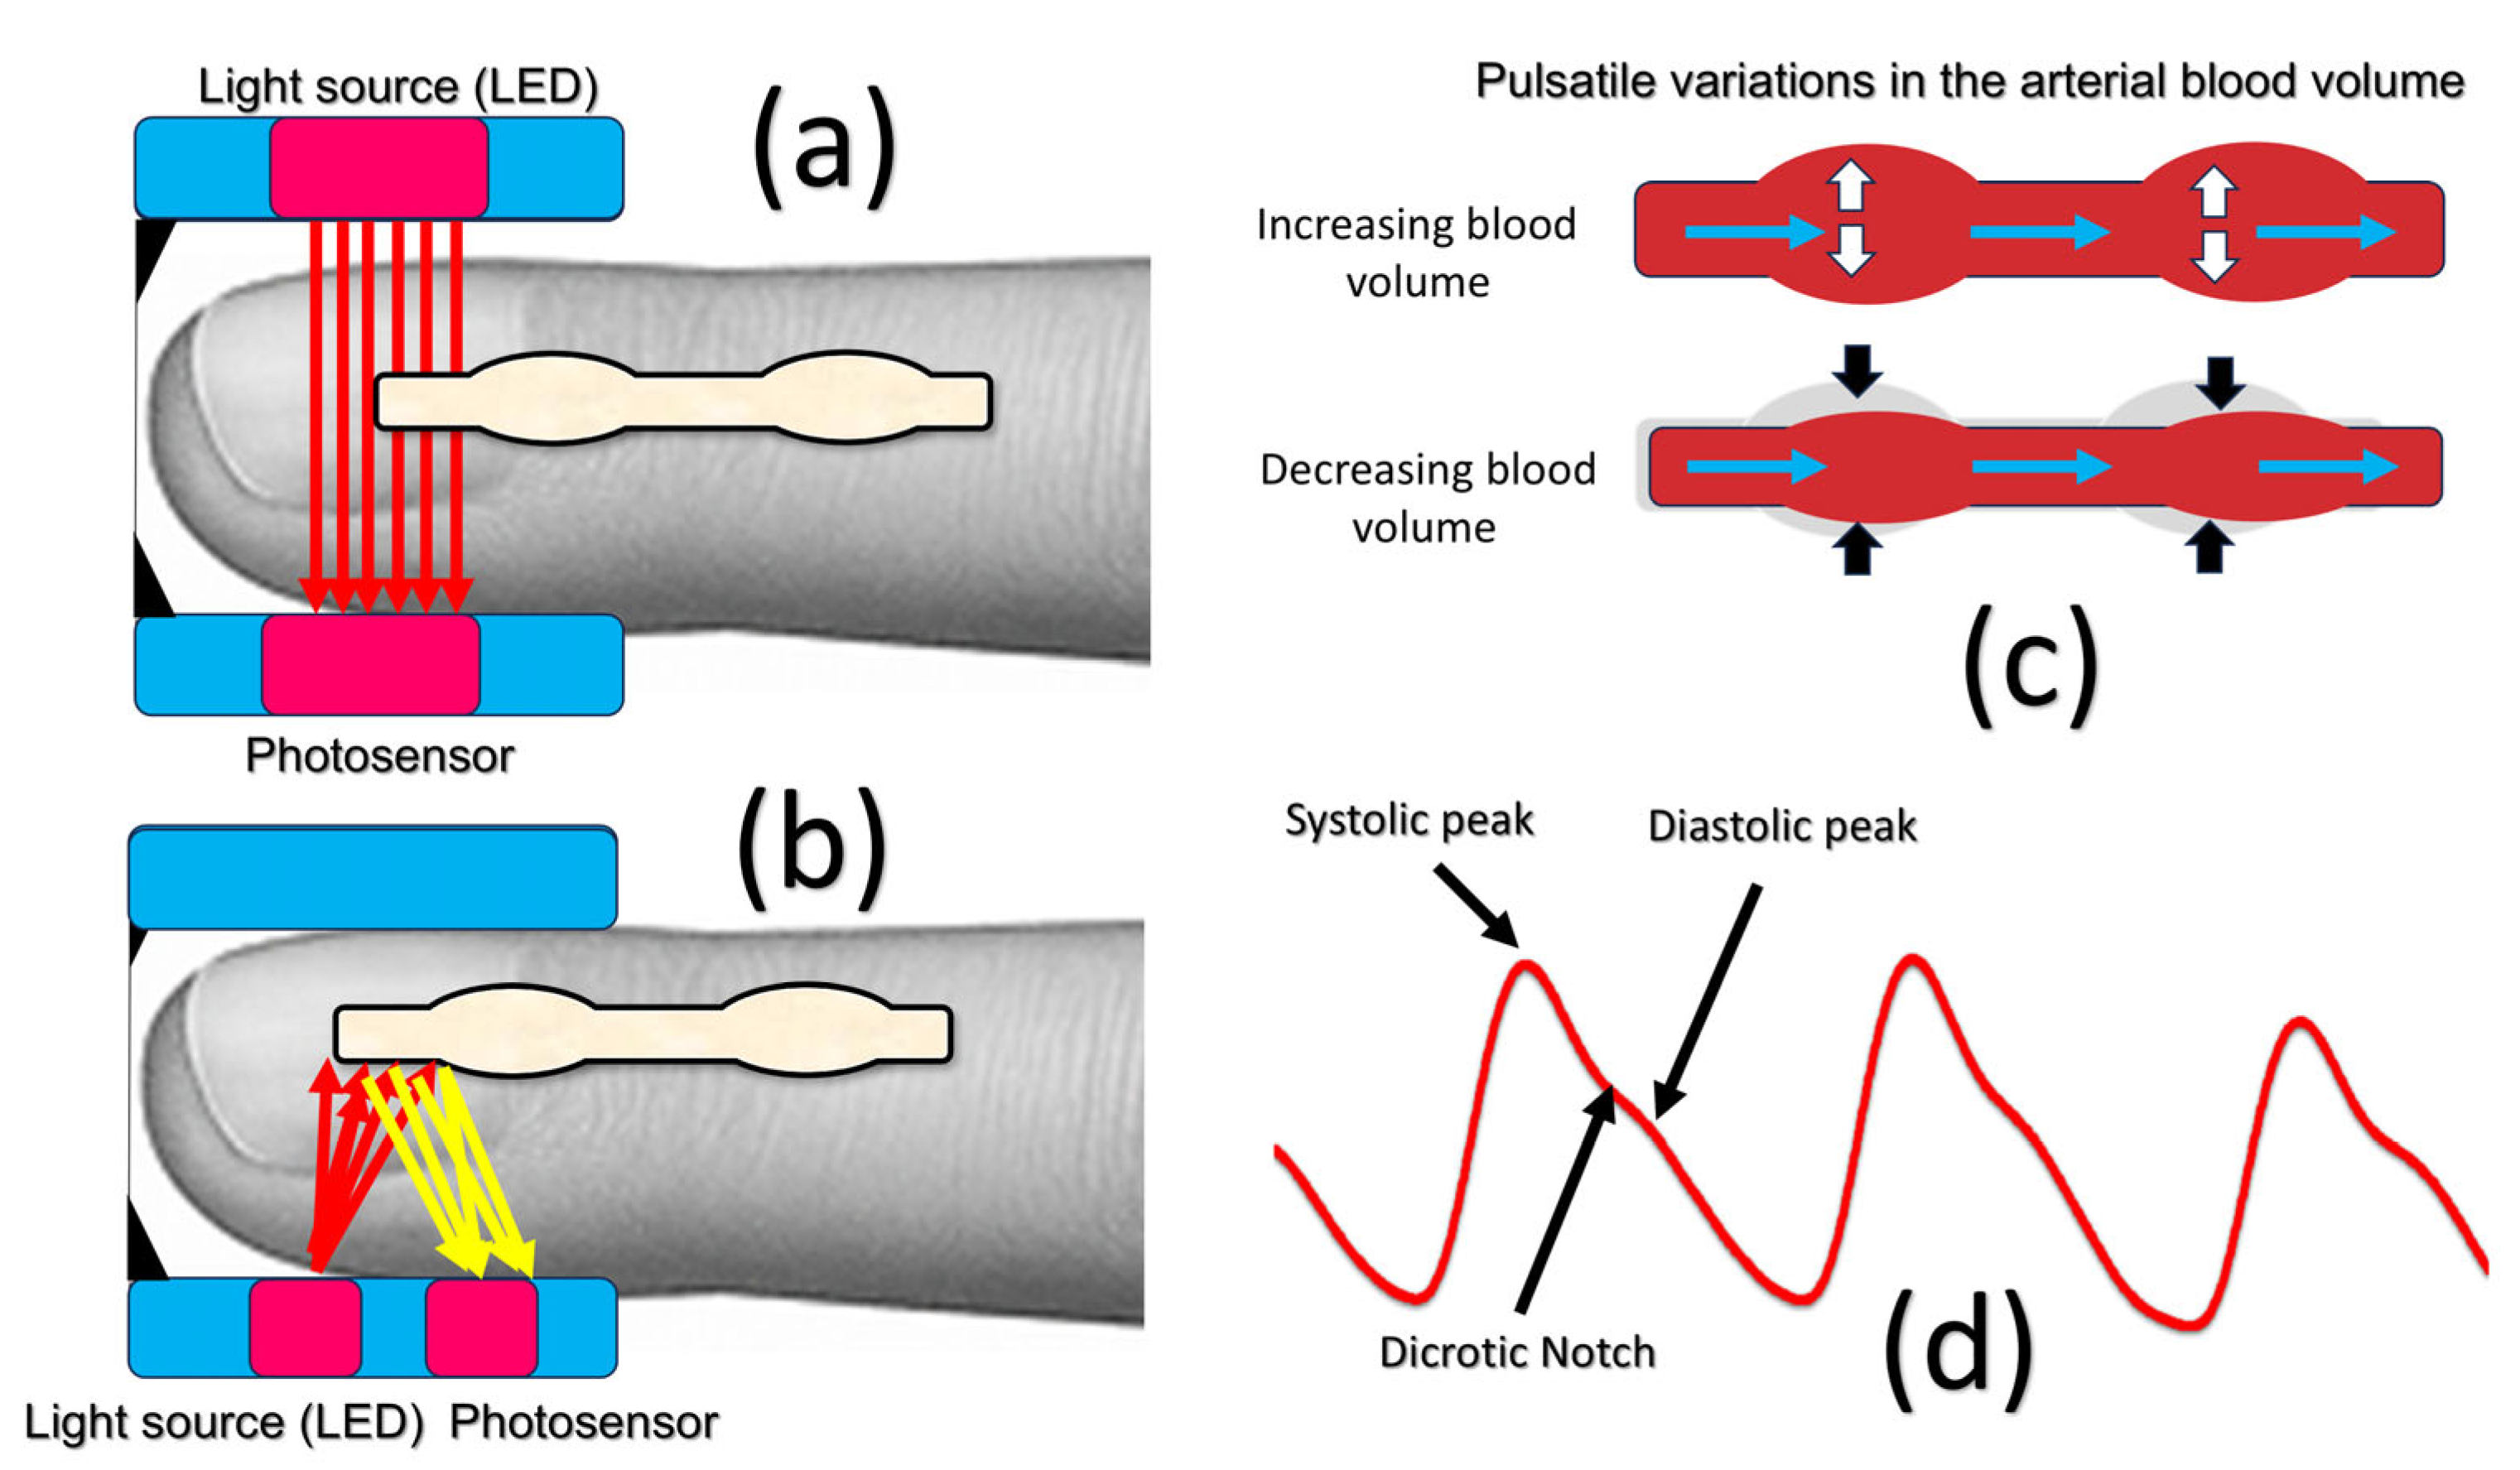
Figure 1. Principles and Configurations of PPG. (a) Transmission-mode PPG setup: LED and photodetector on opposite sides of the finger, (b) Reflection-mode PPG setup: LED (yellow—reflected light) and photodetector on the same side of the finger, (c) Blood volume modulation and light absorption: arterial pulsations affect light transmission/reflection and (d) Typical PPG waveform: systolic peak, diastolic peak, and dicrotic notch indicating cardiac cycle phases.
Hardware 03 00015 g001
Figure 2. Schematic diagram of the PPG sensor circuit implemented with a JFET, using two infrared LEDs for emission and photodetection, and two operational amplifiers; the circuit is integrated with an ESP32 microcontroller. The entire circuit operates at 3.3 V supplied by the ESP32, with its output connected to the analog input pin GPIO36.
Hardware 03 00015 g002
Figure 3. Real-world circuit in breadboard implementation of a low-cost photoplethysmography (PPG) sensor using an ESP32-WROOM-32 microcontroller, LM358 operational amplifier, and infrared LEDs. Main components are shown with dimensions.
Hardware 03 00015 g003
Figure 4. Firmware level flowchart of the UART-based data acquisition and control architecture for the PPG system. The diagram illustrates the interaction between the command parser, finite state machine, ADC sampling routine, circular buffer, and UART transmission, as implemented on the embedded microcontroller to interface with the Python-based GUI for real-time signal streaming and session control.
Hardware 03 00015 g004
Figure 5. Offline HRV Analysis Workflow for Subject 1 and use of a video for running the GUI from Python.
Hardware 03 00015 g005
Figure 6. Validation of the CONNECT and START_STREAM commands to test the firmware loaded into the ESP32’s memory.
Hardware 03 00015 g006
Figure 7. Validation of the STOP_STREAM and DISCONNECT commands to test the firmware loaded into the ESP32’s memory.
Hardware 03 00015 g007
Figure 8. The window is displayed upon launching the developed GUI. Note that the “Refresh Ports” option helps identify the port to which the MCU is connected. The first step, after selecting the correct port, is to enable the “Connect” state to synchronize the GUI with the MCU (in this case, the ESP32).
Hardware 03 00015 g008
Figure 9. GUI during PPG signal acquisition. In this mode, the GUI disables the “Connect” state to avoid errors. The “Stop Capture” option is enabled automatically once the acquisition has started.
Hardware 03 00015 g009
Figure 10. PPG signal acquisition and capturing mode. The interface initiates real-time data collection via the selected UART port, displaying the analog waveform dynamically. During acquisition, sampled data is buffered and stored as a CSV file for post-processing and analysis.
Hardware 03 00015 g010
Figure 11. Real-time PPG viewer tab active, showing continuous streaming and visualization of the PPG signal, displayed as a green line. This interface enables immediate cardiovascular monitoring with dynamic signal plotting and basic metric display during data acquisition.
Hardware 03 00015 g011
Table 1. Bill of the main materials.
QuantityComponentSource of MaterialsMaterial TypeCost
1ESP32 WROOM 32DigikeyMCU$ 8.09
12N5457DigikeyTransistor$ 0.70
1LM358DigikeyOpamp$ 1.00
2Irled 940 nmDigikeyLED$ 0.55
This illustrates the most important elements for data acquisition of PPG signals.
Disclaimer/Publisher’s Note: The statements, opinions and data contained in all publications are solely those of the individual author(s) and contributor(s) and not of MDPI and/or the editor(s). MDPI and/or the editor(s) disclaim responsibility for any injury to people or property resulting from any ideas, methods, instructions or products referred to in the content.