Article

Elucidation of Electrical Characteristics for Apples (Malus domestica) Using Electrochemical Impedance Spectroscopy

by
Shubhra Shekhar
1,*,
Francisco J. Trujillo
1,
Shubhpreet Kaur
2 and
Kamlesh Prasad
3,*
1
School of Chemical Engineering, University of New South Wales, Sydney 2052, Australia
2
Department of Physics and Photonics, National Institute of Technology, Hamirpur 177005, Himachal Pradesh, India
3
Department of Food Engineering and Technology, Sant Longowal Institute of Engineering and Technology, Longowal 148106, Punjab, India
*
Authors to whom correspondence should be addressed.
Submission received: 5 September 2025 / Revised: 10 October 2025 / Accepted: 15 October 2025 / Published: 19 October 2025
(This article belongs to the Special Issue Non-Destructive Testing and Evaluation in Food Engineering)

Abstract

Dielectric characterization offers valuable insights into fruit structure, ripening, and storage stability. However, systematic studies on apples are still limited. This work elucidates the electrical and physicochemical properties of a specific variety of apples, Malus domestica, using Electrochemical Impedance Spectroscopy (EIS), a non-destructive, fast and cost-effective technique, suitable for real-time quality assessments. The apple samples were analyzed over the frequency range of 20 Hz–120 MHz at 25 °C, and impedance data were modeled using equivalent circuits and dielectric relaxation models. Physicochemical analyses confirmed a high moisture content (84%, wwb), pH 4.81, TSS 14.58 °Brix, and acidity 0.64%, which is typical of fresh Red Delicious apples. Impedance spectra revealed semicircular and Warburg elements in Nyquist plots, indicating resistive, capacitive, and diffusive processes. Equivalent circuit fitting with the proposed R-C-Warburg impedance model outperformed (R2 = 0.9946 and RMSE = 6.610) the classical Cole and Double-Shell models. The complex permittivity (ε) represented a frequency-dependent ionic diffusion, space-charge polarization, and dipolar relaxation decay, while electrical modulus analysis highlighted polarization and charge carrier dynamics. The translational hopping of charge carriers was confirmed through AC conductivity following Jonscher’s power law with an exponent of ƞ = 0.627. These findings establish a comprehensive dielectric profile and advanced circuit fitting for biological tissues, highlighting a promising non-invasive approach using EIS for real-time monitoring of fruit quality, with direct applications in post-harvest storage, supply chain management, and non-destructive quality assurance in the food industry.

1. Introduction

Apples (Malus domestica) are one of the most widely consumed and economically important fruits, with a global production of 83.11 million metric tons in 2023 and a 10-year average of 78.2 million metric tons (2014–2023) [1]. Their popularity is not merely due to their delicious taste but also due to their remarkable health benefits and year-round availability. However, this widespread consumption and extended supply chain make apples vulnerable to quality losses during storage and distribution. Due to their high sugar and high moisture content, and their climacteric nature, apples are susceptible to water loss and fungal spoilage (leading to decay and potential mycotoxin formation). As a result, maintaining quality during the post-harvest period is a critical challenge [2].
Quality monitoring of apples during storage is challenging due to their perishable nature and sensitivity to both internal and external changes. Conventional approaches used for quality assessment, such as firmness, sugar content, and/or acidity, are time-consuming, costly, and not scalable for large volumes [3]. Several non-destructive sensing methods include optical techniques such as NIR spectroscopy and hyperspectral imaging, for predicting soluble solids [4], acoustic firmness sensors for texture [5], radiation for detecting internal disorders [6], and gas sensing for volatile monitoring [7]. While these approaches have been studied for detection, they face challenges due to the complex nature of changing cell structures. In contrast, EIS provides a powerful non-destructive tool to overcome these limitations. By applying a small perturbation in the alternating electrical signal and measuring the system’s response, EIS can probe both the extracellular and intracellular environments. Unlike optical or machine vision systems, which have the potential for scalable and low-cost solutions, their limitation of detecting only surface-level changes reduces their usability [8].
EIS is typically conducted over a range of frequencies, with each frequency region corresponding to a distinct process. Each polarization mechanism, such as dipolar orientation, interfacial polarization, and ionic diffusion, occurs on a distinct time scale. As a result, each process is characterized by a specific relaxation time, which manifests as separate dispersion regions in the frequency spectrum [9]. For biological tissues, the β-dispersion (typically 1 kHz–10 MHz) is associated with cell membrane polarization. Thus, every observed dispersion region in the dielectric spectrum corresponds to a different relaxation time, reflecting the underlying physicochemical process. Depending on the relation time, the physicochemical state of the fruit can be captured by assessing the changes in dielectric properties, ionic conductivity, and diffusion processes [10].
This makes EIS particularly effective for monitoring internal quality attributes such as firmness, moisture content, and the onset of tissue degradation in real-time. In addition, being a low-cost, easily implementable, and fast method, it can offer a valuable, cost-effective solution for the industry. It has been employed in various applications within the food sector, demonstrating its versatility and efficacy. For example, for dehydration assessment, EIS has been utilized to monitor and evaluate the process in various vegetables, including onions [11], potatoes [12,13], cucumber [14], carrots [15], and spinach [16]. This method provides valuable insights into the dehydration kinetics and changes in electrical properties associated with moisture loss. In the realm of beverage characterization, EIS has been instrumental in analyzing the properties of different liquids, like milk [17], beverages [18], and saline solutions [19], highlighting its capability to detect and quantify compositional changes and quality parameters effectively. Furthermore, EIS has been extensively used to study the ripening process of fruits, offering a non-destructive means to monitor physiological changes. It has been applied to the banana [20], orange [21], mango [22], avocado [23], and tomato [24]. These studies demonstrate EIS’s ability to track ripening stages and predict optimal harvest and consumption times by measuring impedance changes depending on the measurement procedures and correlating with biochemical transformations during ripening.
The objective of this study is to systematically characterize the electrical properties of apple (Malus domestica, cv. Red Delicious) tissue through EIS. By employing the equivalent electrical circuit and dielectric modeling, the work aims to elucidate the mechanistic basis for understanding the impedance behavior of apple tissues, demonstrating the potential of EIS as a robust, non-destructive approach for quality evaluation and post-harvest monitoring.

2. Materials and Methods

2.1. Raw Materials

Apple (Malus domestica) of variety Red Delicious used in this study was procured from a local supermarket in Sangrur, Punjab, India (Figure 1). Procurement for the apples was repeatedly performed and transported to the experiment area using a refrigerated vehicle. The stored apples at 4 ± 2 °C were used to identify uniformity and outliers, thereby obtaining characteristic representative samples for experimentation. More than 100 apples were used to screen 20 representative samples. Before analyzing, stored apples were stabilized at ambient temperature (25 °C) for at least 2 h and then washed three times with running tap water. Wherever necessary, peeling was performed manually using a stainless-steel peeler. Slicing of apples was performed using a Mandoline slicer to obtain a uniform thickness (2.20 mm), which was verified using an electronic digital Vernier caliper, General Tools and Instruments, New York, NY, USA.

2.2. Physical Properties

2.2.1. Dimensional Characteristics

All possible dimensions were selected to determine the physical characteristics of the apple. Three linear dimensions, length (l); the equivalent distance of the stem (top) to the calyx (bottom), width (w); the next longest dimension perpendicular to l, and thickness (t); the least dimension perpendicular to l and w (Figure 1), were measured using a digital precision Vernier caliper of ±0.01 mm accuracy [25,26]. Measurements were taken for more than twenty apples, and the average was mentioned. Geometric mean diameter (Dg), equivalent, and arithmetic diameters were calculated using the following equations:
D g = l w t 1 / 3
D p = [ l ( w + t ) 2 / 4 ] 1 / 3
D a = l w t 3
where Dg is geometric mean diameter, Dp is equivalent diameter, Da is arithmetic diameter, and l, w, and t are linear dimensions, length, width, and thickness, respectively (in cm).

2.2.2. Determination of Shape

The shape of the fruit was expressed in terms of its sphericity index and aspect ratio. Sphericity (Sp) is defined as the ratio of the surface area of the sphere having the same volume as that of the fruit to the surface area of the fruit, determined as
S p = D g l 2
The Aspect Ratio (Ra) was calculated as recommended [24]
R a = l w
The equation used for calculating surface area (S) is shown below [24].
S = π D g 2

2.2.3. Packing Coefficient

The packing coefficient was defined by the ratio of the volume (cm3) of fruit packed to the total and calculated by the following formula.
λ = V o V c
where Vo is the true bulk of fruits present in the carton and Vc is the volume of the box, both were expressed in (mL3) or (cm3).

2.2.4. Gravimetric and Frictional Characteristics

For the determination of gravimetric and frictional characteristics, the prescribed standard methods of analytical procedure are provided in the Supplementary File.

2.3. Chemical Properties

2.3.1. Moisture Content

The moisture content of the sample was determined using the method as described [27]. The apple slice of a uniform size was pre-weighted and put in a vacuum oven at a temperature of 70 °C for a time span of 24 h [27]. The experiment was performed in triplicate, and the mean moisture was used. The moisture content of the samples came out to be 84% on a wet weight basis (wwb).

2.3.2. Total Soluble Solids (TSS)

The fruit pulp was obtained on crushing, and the juice was squeezed through muslin cloth. The juice was immediately used for the determination of TSS using a hand refractometer of 0–32% range. The average value was expressed as TSS%.

2.3.3. pH

pH of the fruit was recorded using an Elico digital pH meter after blending the sample.

2.3.4. Acidity (%)

The procedure, as described, was followed to determine acidity [28]. The percentage acidity in terms of citric acid was calculated using the following formula:
A c i d i t y % = T i t r e   v a l u e × e q . w t .   o f   a c i d × 100 W t .   o r   v o l .   o f   s a m p l e   t a k e n × 1000

2.3.5. Ascorbic Acid (mg/100 g)

Ascorbic acid content was estimated by taking 10 g of blended apple extract of the fruit with 3% metaphosphoric acid, and the volume was made up to 100 mL [28]. The extract was filtered, and a 5 mL aliquot was titrated against the dye (2,6-dichlorophenol-indophenol dye) until a faint pink color appeared at the endpoint. The results were expressed in mg/100 g of fresh weight.
The ascorbic acid content of the sample was calculated from the following formula:
A s c o r b i c   a c i d m g 100   g = T i t r e   × d y e   f a c t o r × v o l u m e   m a d e   u p A l i q u o t   o f   e x t r a c t   t a k e n   f o r   e s t i m a t i o n × V o l u m e   o f   s a m p l e   t a k e n   f o r   e s t i m a t i o n × 100

2.3.6. Brix Acid Ratio

The brix acid ratio is an indication of a sweeter product and vice versa. It is calculated as below, the formula as reported [28].
Brix   acid   ratio   = B r i x a c i d i t y

2.4. Optical Properties

The color analysis was carried out by a colorimeter (Model i5 Green Macbeth, New Windsor, NY, USA), and data were recorded as L*, a*, and b* values. L* value signifies (light-dark), a* value (red-green), and b* value (yellow-blue). This color system is one of the uniform color spaces and is recommended as a way of more closely representing perceived color and color difference (by CIE in 1976) [28].

2.5. Measurement of Electrical Properties

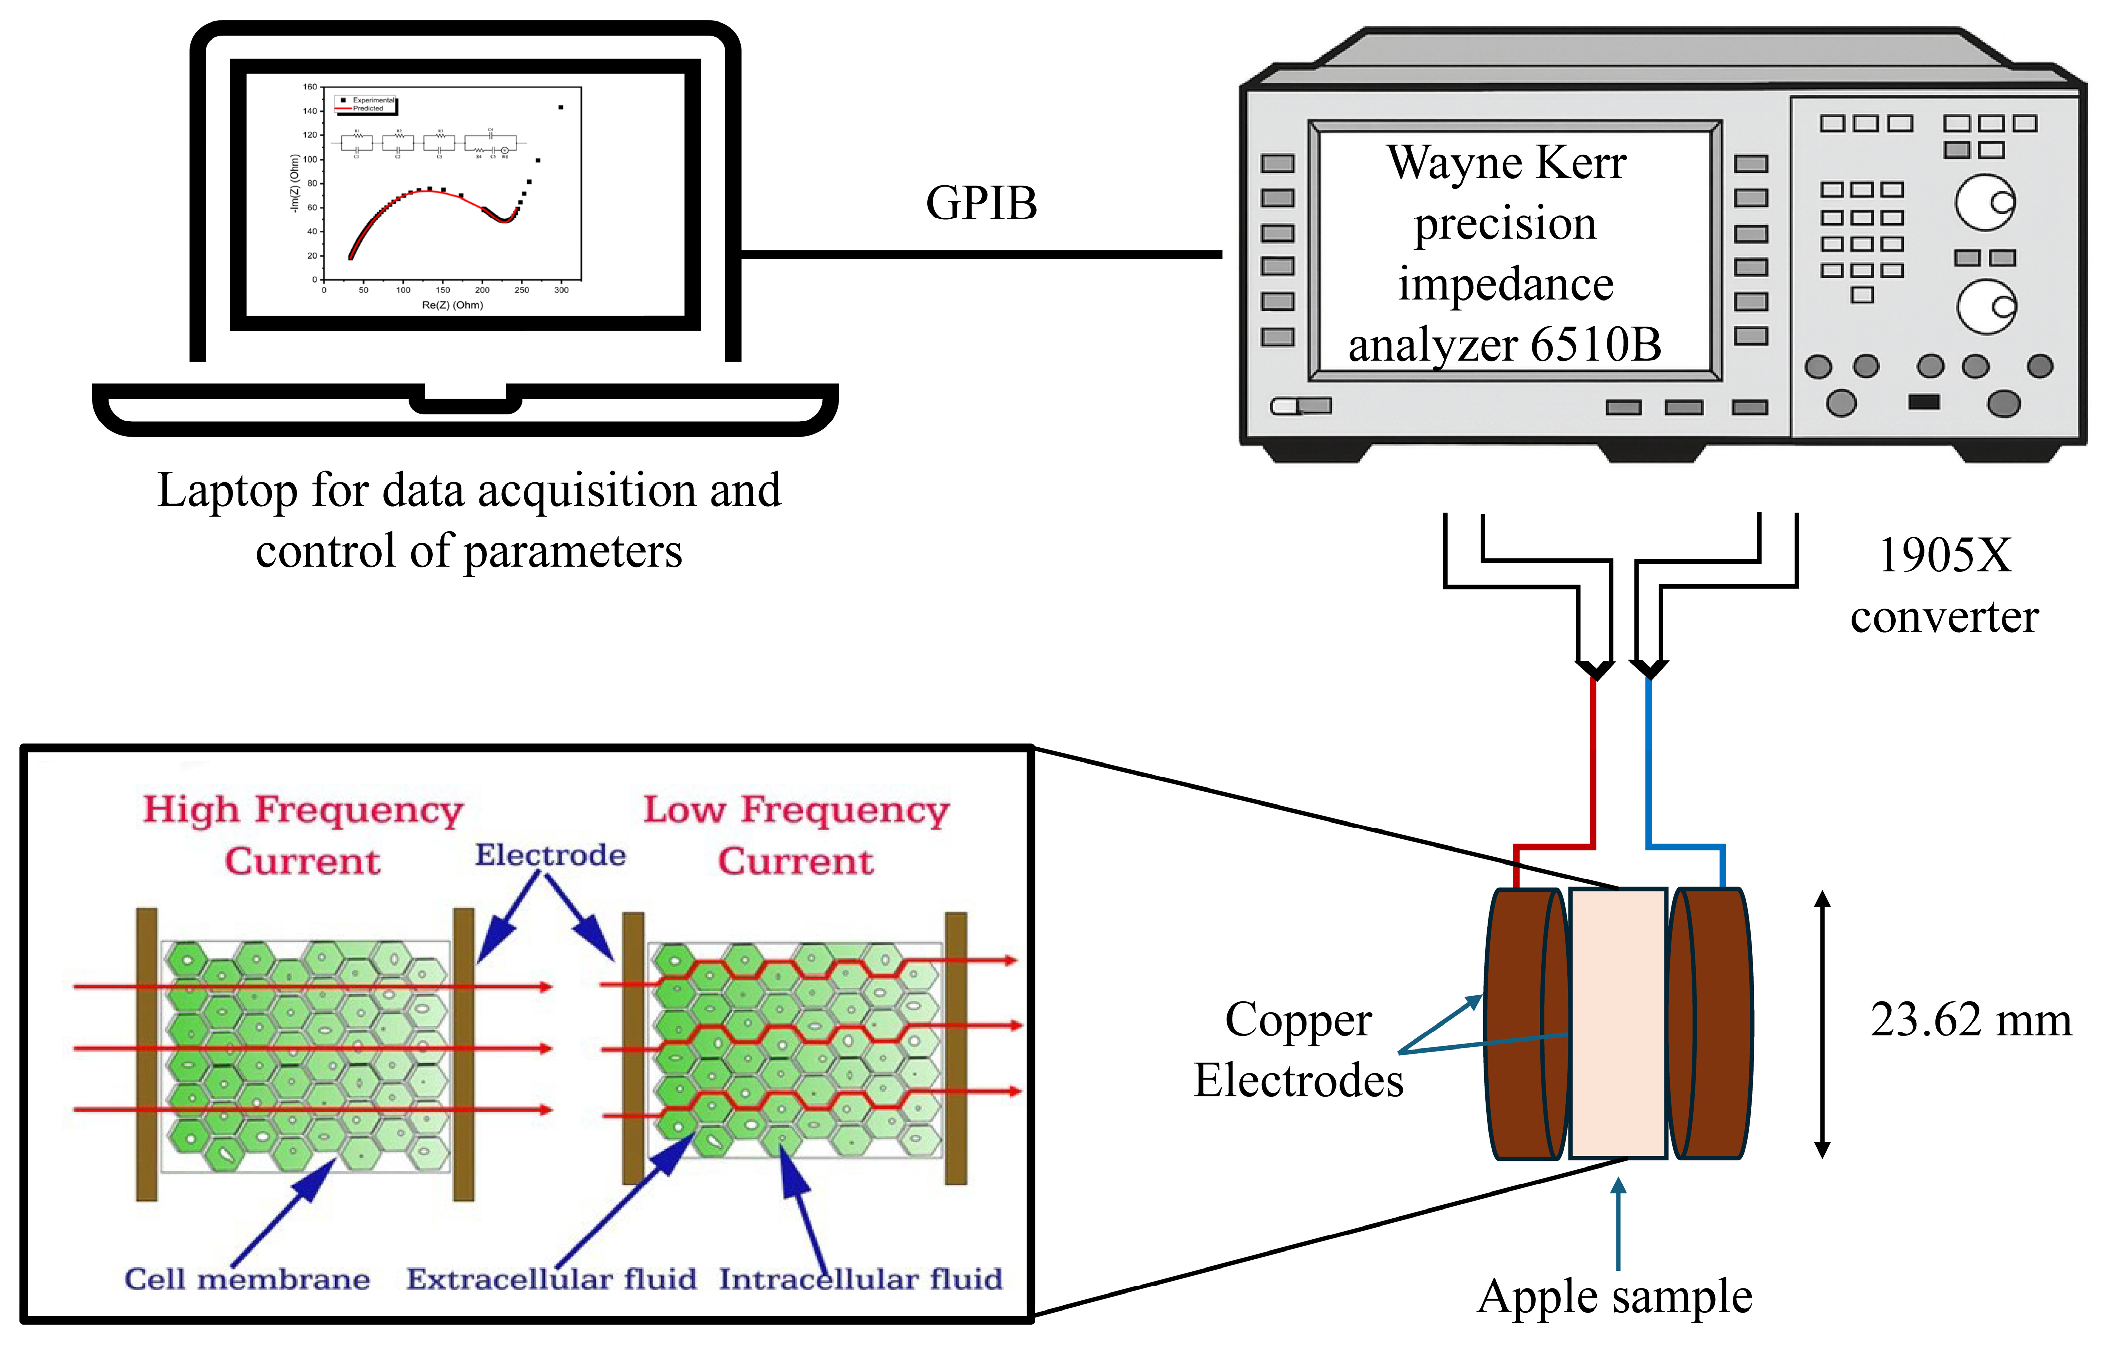
Electrical properties measurements of an apple slice were carried out using a Wayne Kerr precision impedance analyzer 6510B (Wayne Kerr Electronics Ltd., West Sussex, PO22 9QT, UK). To prepare the sample for the measurement, the sliced apple representing the entire selected lot was cut into a cylindrical shape having the same diameter as the electrode (23.62 mm). Copper electrodes without any oxidized portion were positioned in a parallel plate arrangement connected to the designed and developed Impedance Analyser Fixture [29]. The frequency sweep was carried out in the entire spectrum range of the equipment, from 20 Hz to 120 MHz, at constant room temperature (25 °C) on 250 data points. The accuracy of the set frequency was ±0.005%, and the measuring voltage was set to 1.0 V in a series arrangement, following the methodology reported in [16,30,31]. The impedance analyzer was attached to the computer, and a General-Purpose Interface Bus (GPIB) was used to control the instrument and retrieve measured values. The EIS measurement was repeated twice, and the average value was used. The frequency range was further trimmed as per the area of interest and requirement. Impedance vs. phase angle (Z vs. θ) plots have been recorded using an impedance analyzer. Parameters like Z′, Z″, ε′, ε″, M′, M″, and σac were calculated from the impedance and phase angle data by applying conversion factors.
Equivalent circuit fitting was performed using BioLogic EC-Lab software v11.50 (BioLogics, Vaucanson, Seyssinet-Pariset, France). Origin (64-bit, Version 10.0.0.154, Academic; OriginLab Corporation, Northampton, MA, USA) and MATLAB R2017b (MathWorks, Natick, MA, USA.) software were used to plot the graphs and perform model fitting.

2.6. Statistical Analysis

Statistical parameters such as normal root mean square (NRMSE), root mean square error (RMSE), mean percentage error (MPE), normal mean square error (NMSE), mean square error (MSE), average absolute deviation (AAD), and coefficient of multiple determination (R2), were used for the comparison of different equivalent circuit models, including Cole [32], Hyden [33], Double Shell [34], and P. Ibba et al. [35], with the proposed model. The best model for expressing the electrical property of the chosen sample is the one with the highest R2 and the lowest NRMSE, RSME, MPE, AAD, and MSE.

3. Results

3.1. Physico-Chemical and Optical Properties

Table 1 represents the average values with standard deviation (±) of the studied opto-physico-chemical properties of the Red Delicious apple. The physico-chemical and optical properties determined and compared are length, width, thickness, volume, mass, geometric mean diameter, equivalent diameter, arithmetic diameter, sphericity, surface area, aspect ratio, sphericity index, volume, density, packing coefficient, static coefficient of friction, moisture, total soluble solid, pH, titratable acidity, vitamin C, acid to brix ratio, and color. The length, width, thickness, geometric mean diameter, and equivalent diameter were 7.53 ± 0.64, 7.53 ± 0.55, 8.37 ± 0.45, 7.87 ± 0.56, and 7.88 ± 0.67, respectively. Red Delicious has shown higher values of dimensional parameters, such as length, width, thickness, geometric mean diameter, and equivalent diameter, compared to other apple varieties reported elsewhere [36]. Surface area, sphericity, aspect ratio, mass, volume, density, bulk density, porosity, and packing coefficient were 195.57 ± 27.78, 1.03 ± 0.02, 1.05 ± 0.07, 233.29 ± 32.79, 266.25 ± 42.62, 878.92 ± 33.56, 644.50 ± 90.32, 26.44 ± 11.43, and 0.74 ± 0.14, respectively.
Frictional properties on glass, steel, and plywood (with perpendicular and parallel) were 0.70 ± 0.02, 0.49 ± 0.04, 0.46 ± 0.05, and 0.46 ± 0.02, respectively. The static coefficient of friction was found to be highest with 0.70 ± 0.02 on the glass surface and lowest on plywood at 0.46 ± 0.02 in the case of plywood grains parallel with the fruit. Similar findings have been reported for other commodities. Plywood with grains parallel (Π) surface was found to exhibit the least friction, followed by plywood with grains (┴), and a galvanized steel plate was intermediate. The glass surface exhibited the highest coefficient of friction because the surface of the fruit was sticky, with almost negligible air space between the fruit skin and the glass surface in contact, which was not present in the case of plywood.
Moisture content, Total soluble solids, Titratable acidity, pH, Ascorbic acid content, and Brix: acid ratio were found to be 84.00 ± 1.40%, 14.58 ± 0.28%, 0.64 ± 0.02%, 4.81 ± 0.25, 12.3 ± 3.13 mg/100 g, and 22.64 ± 0.16, respectively. The results of TSS, acidity, pH, and sugar/acid are in good agreement with earlier reported data [37]. The variations in the chemical properties could mainly be due to fruit maturity and climatic conditions of a particular environment, as the same cultivar grown in other places shows significant differences in taste and aroma.
The optical properties of apples were defined in terms of L*, a*, and b* values, which were 32.27 ± 7.54, 43.44 ± 6.37, and 21.57 ± 4.28, respectively. Color preferences depend on the uniformity of external color, repeatability of fruit color in the crop, differences between high and ground color, intensity of blush and ground color (saturation of red), size of the high color area, brightness, darkness, whiteness, physical defects, dents, browning, bruising, and stage of maturity [38].

3.2. Nyquist Plot

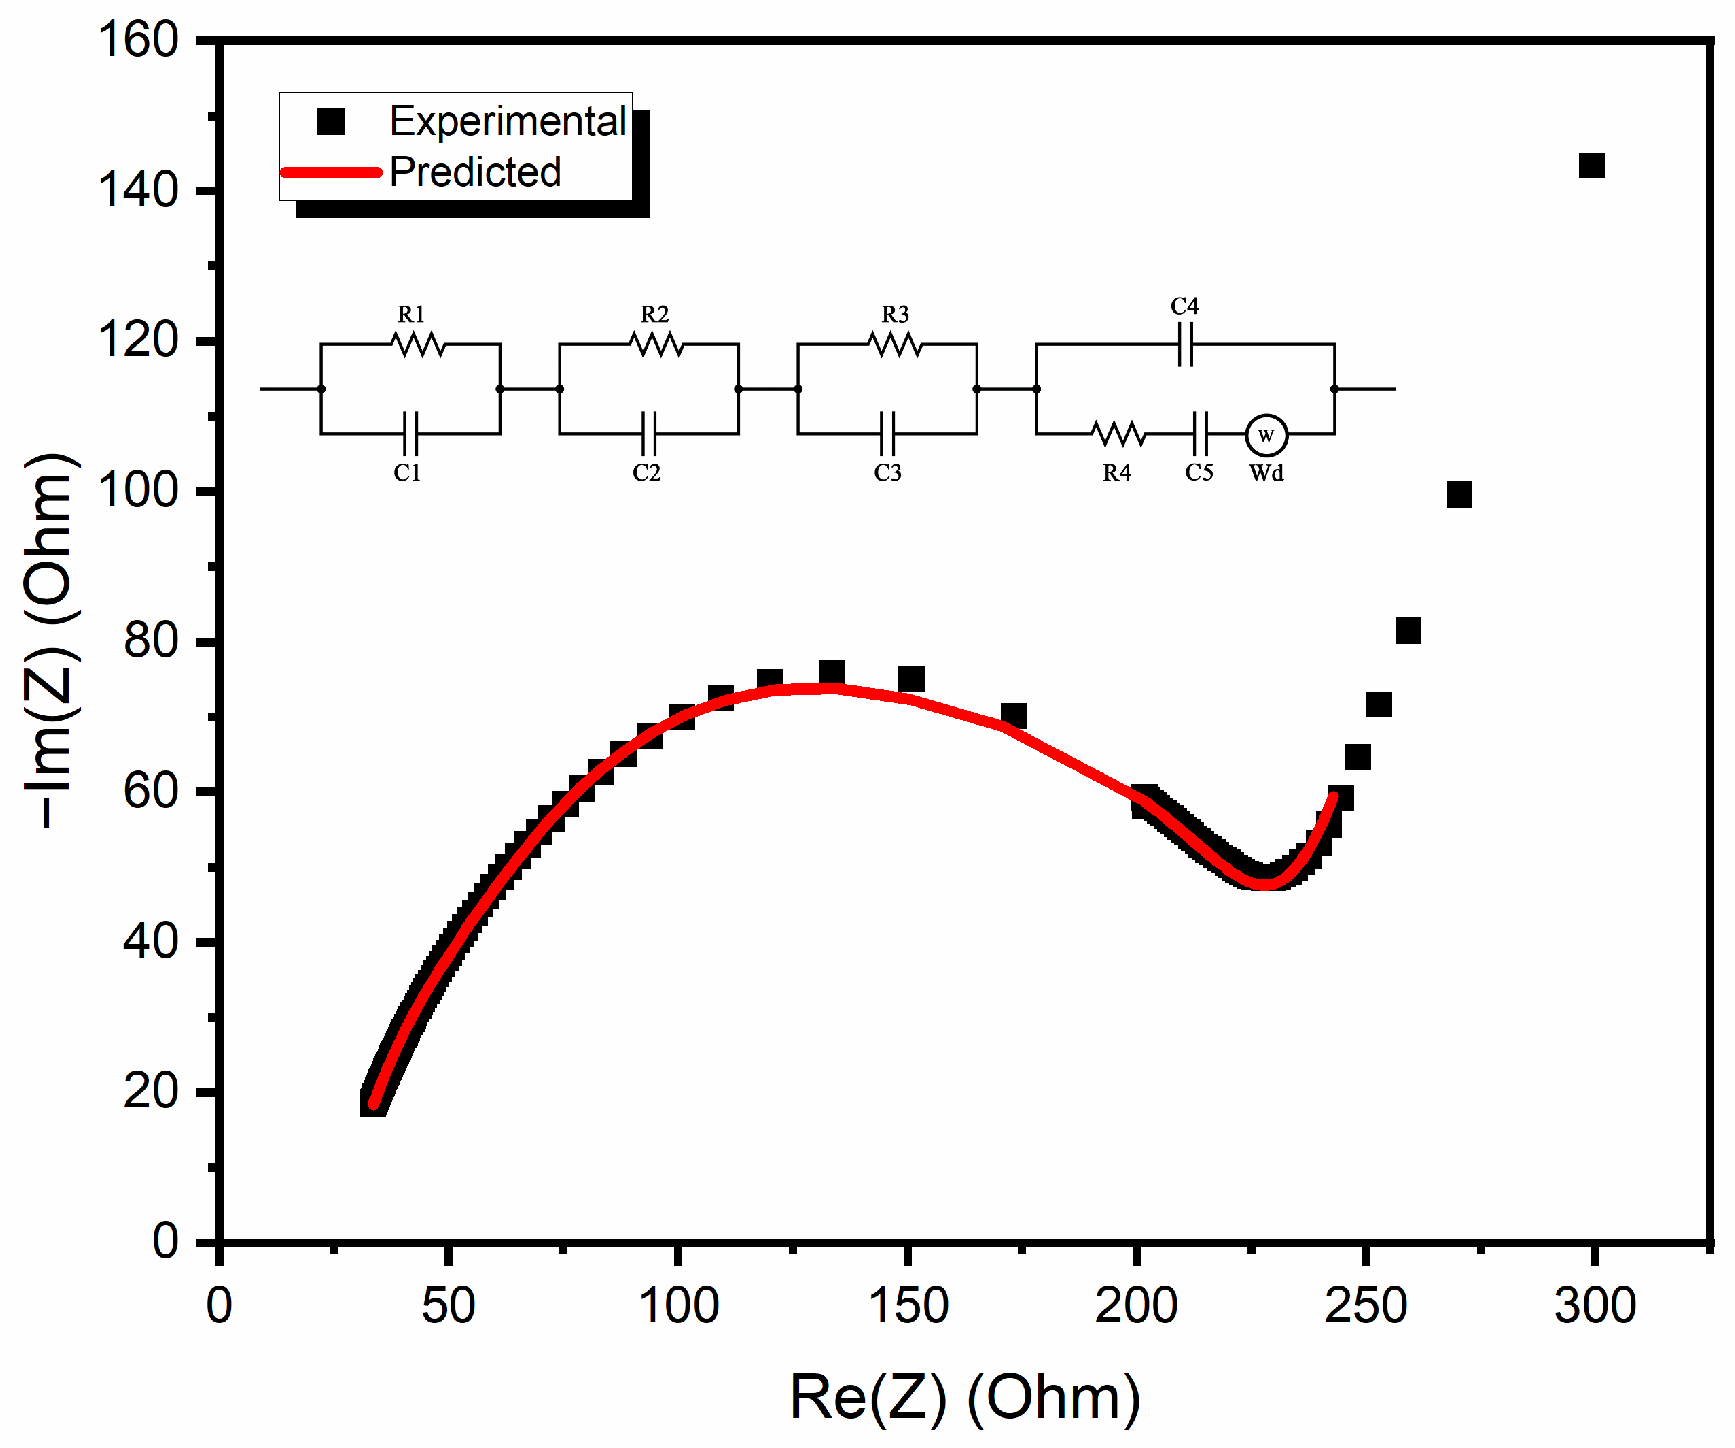
Figure 2 shows the Nyquist plot of the sliced Red Delicious apple. The sample exhibits a characteristic semi-circle at higher frequencies, while a straight line is observed at the end of the semicircle in the lower frequency range. The experimental data of the Nyquist plot were fitted with an equivalent circuit model. The model fitting was performed with weights assigned to |Z|, considering resistance, capacitance, and Warburg components. The values of resistance, capacitance, and the Warburg element in the circuit, as predicted by the data, are shown in Table 2. Each R-C component represents a particular part and phenomenon within the frequency range. A straight-line present at an angle of nearly 45° with the X-axis signifies the presence of the Warburg element [39]. This Warburg impedance represents the mass diffusion within the sample that is dominated by the diffusion of ions or molecules to and from the electrode surface, a process that inherently reflects frequency dependence [40]. Deviation in the straight-line angle either toward the X-axis or Y-axis represents the presence of resistive or capacitive elements in the circuit, respectively. In the present case of apple slices, the angle of the Warburg element was higher than 45°, making it more inclined toward the Y axis, which represents the dominance of the capacitive element. This dominance of the capacitive element may be due to the presence of double-layer formation at the point of contact between the sample and the electrode. When a potential is applied, an excess of ions forms near the electrode surface, creating a region of stored charge that behaves like a capacitor [41]. In Figure 2, the semicircle appears depressed, with its center located in the fourth quadrant, below the X-axis. According to the fitted models, a semi-circle formed after the Warburg element comprises three small circles [42]. The remaining circles are formed due to the phenomenon of electrical impedance caused by the cell membrane. The cell membrane is an integral part of the plant cell, which generally acts like a capacitor. At lower frequencies, the current passes from the extracellular fluid while avoiding the cell membrane. Whereas at higher frequencies, the current passes through the membrane, which acts as a conductor, having more electrolytes than the extracellular fluid (Figure 3) [30]. This phenomenon causes the impedance to be higher at lower frequencies and lower at higher frequencies. This correlates with the similar properties exhibited by the grain and the grain boundary in the case of ceramics. In ceramics, grain boundaries typically exhibit higher impedance at lower frequencies due to their insulating properties, similar to the cell membrane. At higher frequencies, the grains themselves, which are more conductive, dominate the impedance characteristics, leading to lower overall impedance [43]. Impedance spectroscopy may thus be effectively used to monitor any changes in the characteristics of biomaterials.

3.3. Bode Plot

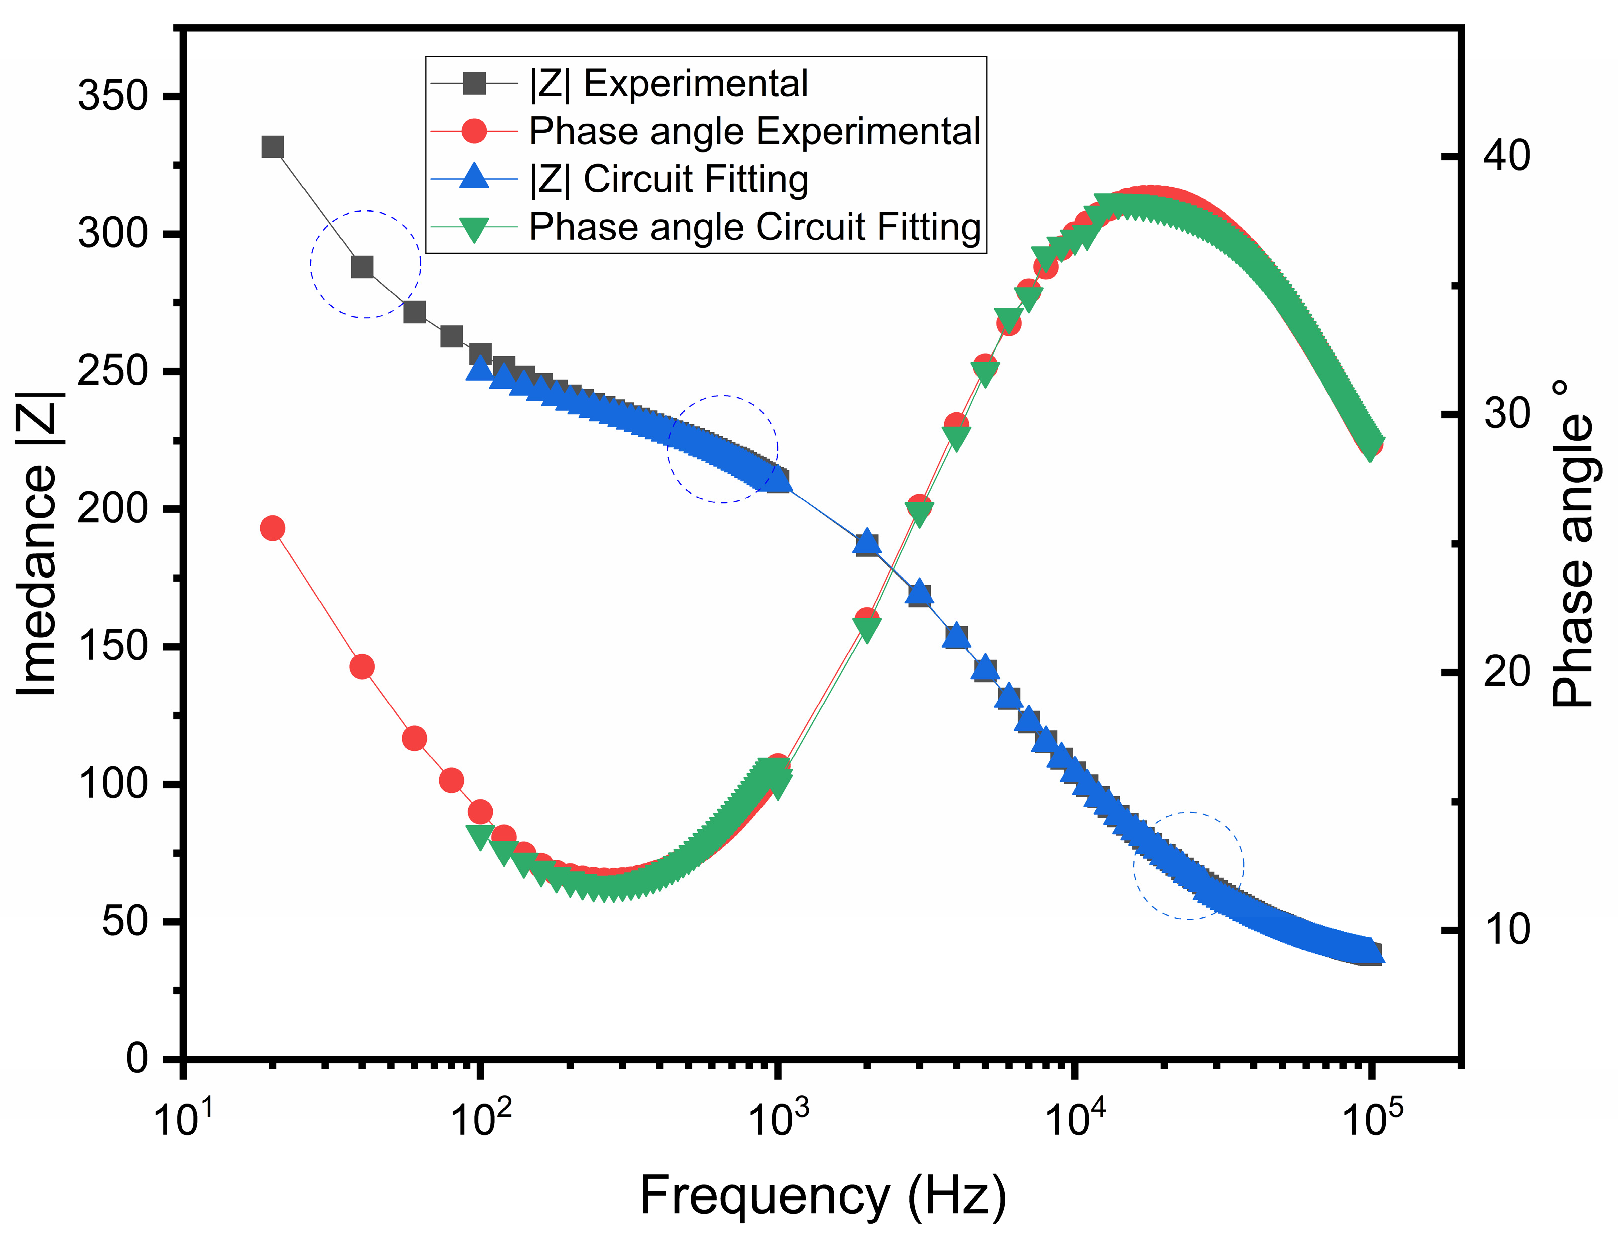
The Bode plot shown in Figure 4 reflects the change in Impedance and phase angle with respect to the frequency range on the log scale. The phase angle line shows 3 breaking points, also termed as points of inflection, and may be determined using derivative analysis. These breaking points in the trend line at lower, intermediate, and higher frequencies are due to the characteristic time constant (τ) shown with the circle, which can also be visualized with the change in the slope of the impedance curve with respect to frequency [44]. These points reflect the similar phenomena observed in the Nyquist plot (Figure 2). The corresponding phase angle represents the presence of the R-C circuit at the corresponding frequency range.

3.4. Dielectric Constant

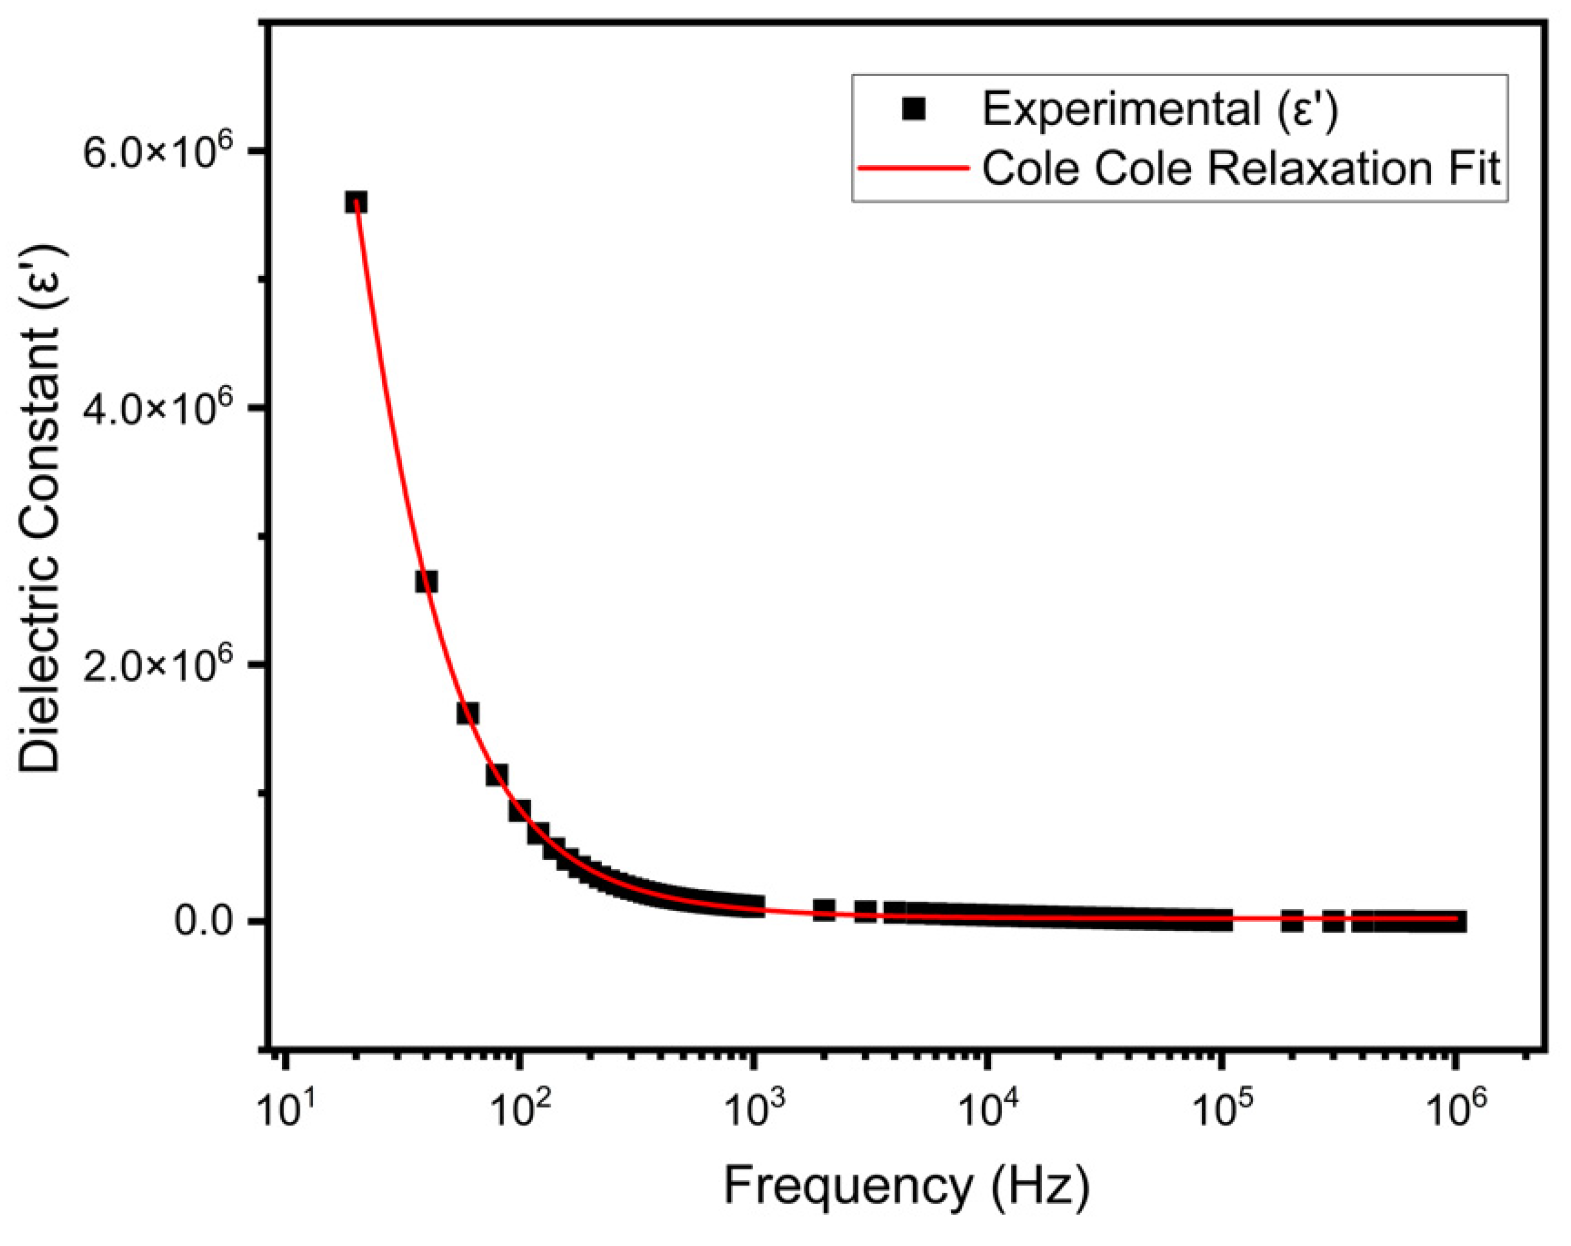
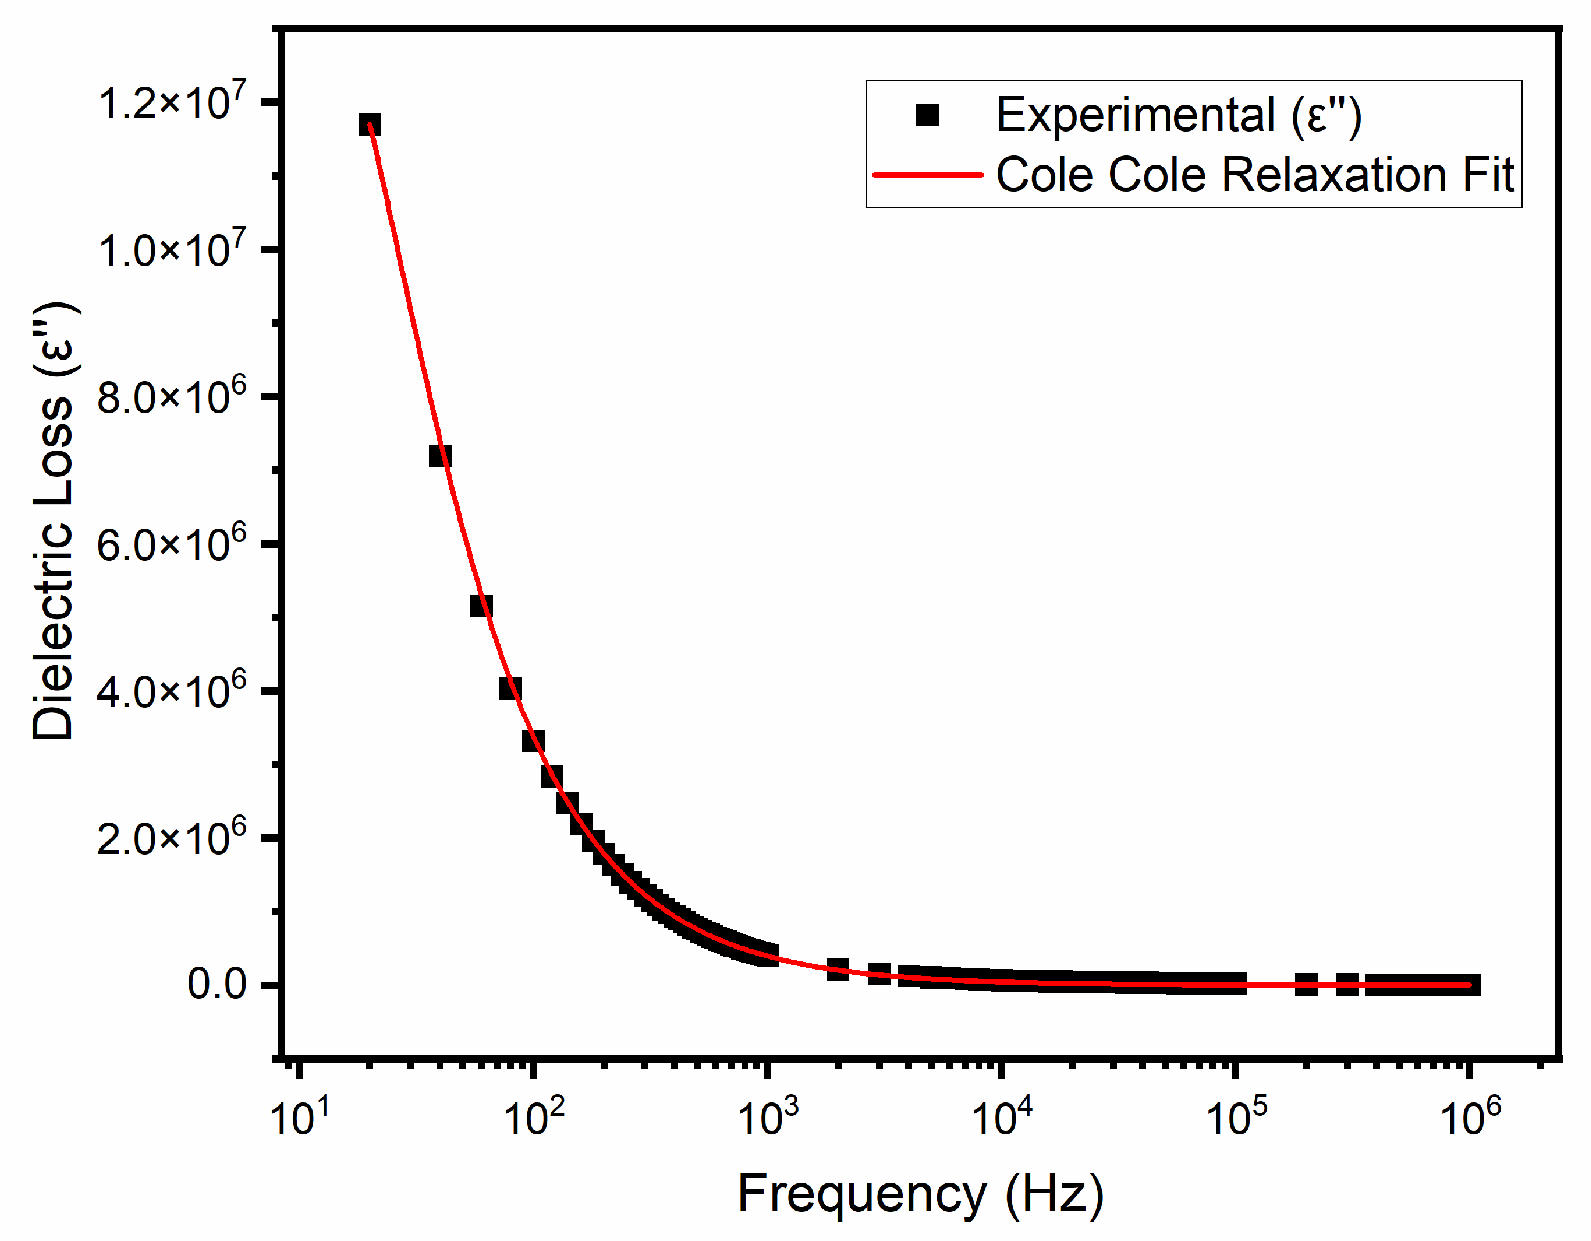
Figure 5 and Figure 6 show the variation in the dielectric constant (ε′) and loss (ε″) across the frequency sweep. ε′ represents the net polarization of the material on the application of an external field, whereas ε′ measures the energy dissipated within a material when it is subjected to an alternating electric field, and several mechanisms contribute to this loss. In biological tissues, such as those found in apples, counterions hop between fixed sites, including charged groups on cell walls, creating ionic polarization [45]. This hopping leads to energy dissipation, especially at intermediate frequencies where the ions can keep up with field changes but still encounter resistance. It is evident that the values of ε’ and ε″ reduce with frequency, mainly due to the phenomena of ionic diffusion and the accumulation of space charge group [46]. In the case of biological samples like apples, the ions that are present inside the intracellular region of the cell tend to diffuse to the extracellular region, creating ionic polarization. These polarized charges tend to move at the interface of the cell membrane, i.e., the charged region creates a region of high local polarization, causing space charge accumulation [47]. This movement can also be verified by the Warburg element observed at a lower frequency region, as shown in Figure 2.
Another phenomenon that can explain this behavior is dipole relaxation. Dipole relaxation refers to the lagging response of dipolar molecules present in the sample to an applied alternating electric field [48]. Apple, which is a biological material, consists of several such dipolar molecules, e.g., water, sugar, acids, etc. [49]. Apple, consisting of 84% moisture on a weight-to-weight basis, represents a significant contribution to the dielectric behavior because water molecules act as dipoles.
The total polarization within a material, including apples having moisture, consists of different types of polarization, such as ionic, interfacial, and dipolar polarization. In the low-frequency region, all these polarization mechanisms respond effectively to the oscillating field, resulting in high values of both ε′ and ε″ [50]. However, with the increase in frequency, some of these mechanisms cannot switch rapidly enough in response to the changing electric field. Consequently, some dipole orientations fail to contribute to the net polarization and loss, leading to lower values of both ε′ and ε″. At higher frequencies, the response of the material is primarily due to the limitations of several polarization mechanisms. While electronic and ionic polarizations can still follow the rapidly changing electric field, slower mechanisms like dipolar and interfacial polarization cannot switch quickly enough. As a result, the slower polarization mechanisms do not contribute significantly to the net polarization at high frequencies, leading to a decrease in overall polarization and loss, and lowering the values of both ε′ and ε″ [51]. Consequently, the dielectric properties of the material tend to stabilize at high frequencies, with the contributions from electronic and ionic polarization predominating. Thus, the combined effect of these polarization mechanisms determines the material’s dielectric behavior across different frequency ranges [52].

3.5. Relaxation Model and Cole–Cole Fitting

The relaxation phenomenon of the material can be explained using different relaxation models that deviate from the Debye approach of dielectric relaxation. According to the Debye relaxation process, all the dipoles present in a system relax at a single relaxation time, and the response function is purely exponential, which is only possible in an ideal material having the presence of a single conformational state or polar type. However, biological materials contain several polar molecules, which cause different polarization processes and kinetics. This intermolecular interaction becomes complex and ceases to be a first-order reaction [53].
Havriliak–Negami’s model of relaxation was used to explain the relaxation laws and relation for our sample. The relaxation model expression, as proposed [54]:
ε H N = ε + ε s ε ( 1 ( i ω τ ) α ) β = j σ 0 ε 0 ω n + ε s ε ( 1 + ( j ω τ ) α ) β + ε
In this expression, σ0 represents the conductivity, and the ƞ parameter gives the exponent of the frequency dependence of ε″; α and β are the distribution parameters in the range 0 < α < 1 and 0 < β < 1. εs is the permittivity at low frequency, ε is the permittivity at the high-frequency limit, ω is the angular frequency, and τ is the relaxation time of the system.
The Havriliak–Negami relaxation model reduces to the Cole–Cole (CC), Cole–Davidson (CD), and Debye (D) model equivalent at the value of β = 1, α = 1, and α = 1 and β = 1, respectively [55].
ε C D = ε + ε s ε ( 1 i ω τ ) β = ε C D i ε C D
ε C C = ε + ε s ε 1 ( i ω τ ) α = ε C C i ε C C
ε D = ε + ε s ε 1 i ω τ = ε D i ε D
The value of the dielectric constant and loss can be obtained with separate real and imaginary components using the equation below of the Cole–Cole relaxation model:
ε = ε + ε s ε 1 + ω τ 0 1 α sin 1 2 α π 1 + 2 ( ω τ 0 ) sin 1 2 α π + ω τ 0 2 ( 1 α )
ε = ε s ε ω τ 0 1 α cos 1 2 α π 1 + 2 ( ω τ 0 ) 1 α sin 1 2 α π + ω τ 0 2 ( 1 α )
The dielectric data with frequency change were fitted using the Havriliak–Negami model; however, the value of β was found to be equal to 1, making it equivalent to the Cole–Cole model. The value of the different fitting parameters is represented in Table 3. From the table, it is evident that α is greater than “0”, representing a stretched relaxation response within the material. The broad relaxation over a wide frequency range confirms that the sample exhibits non-Debye relaxation. The Cole–Cole plot of ε′ and ε″ shown in Figure 7, clearly represents an arc that, on extrapolation, will look nearly a semi-circle, which also confirms that the Cole–Cole model is the best fit for the acquired data [53].

3.6. Electrical Modulus Analysis

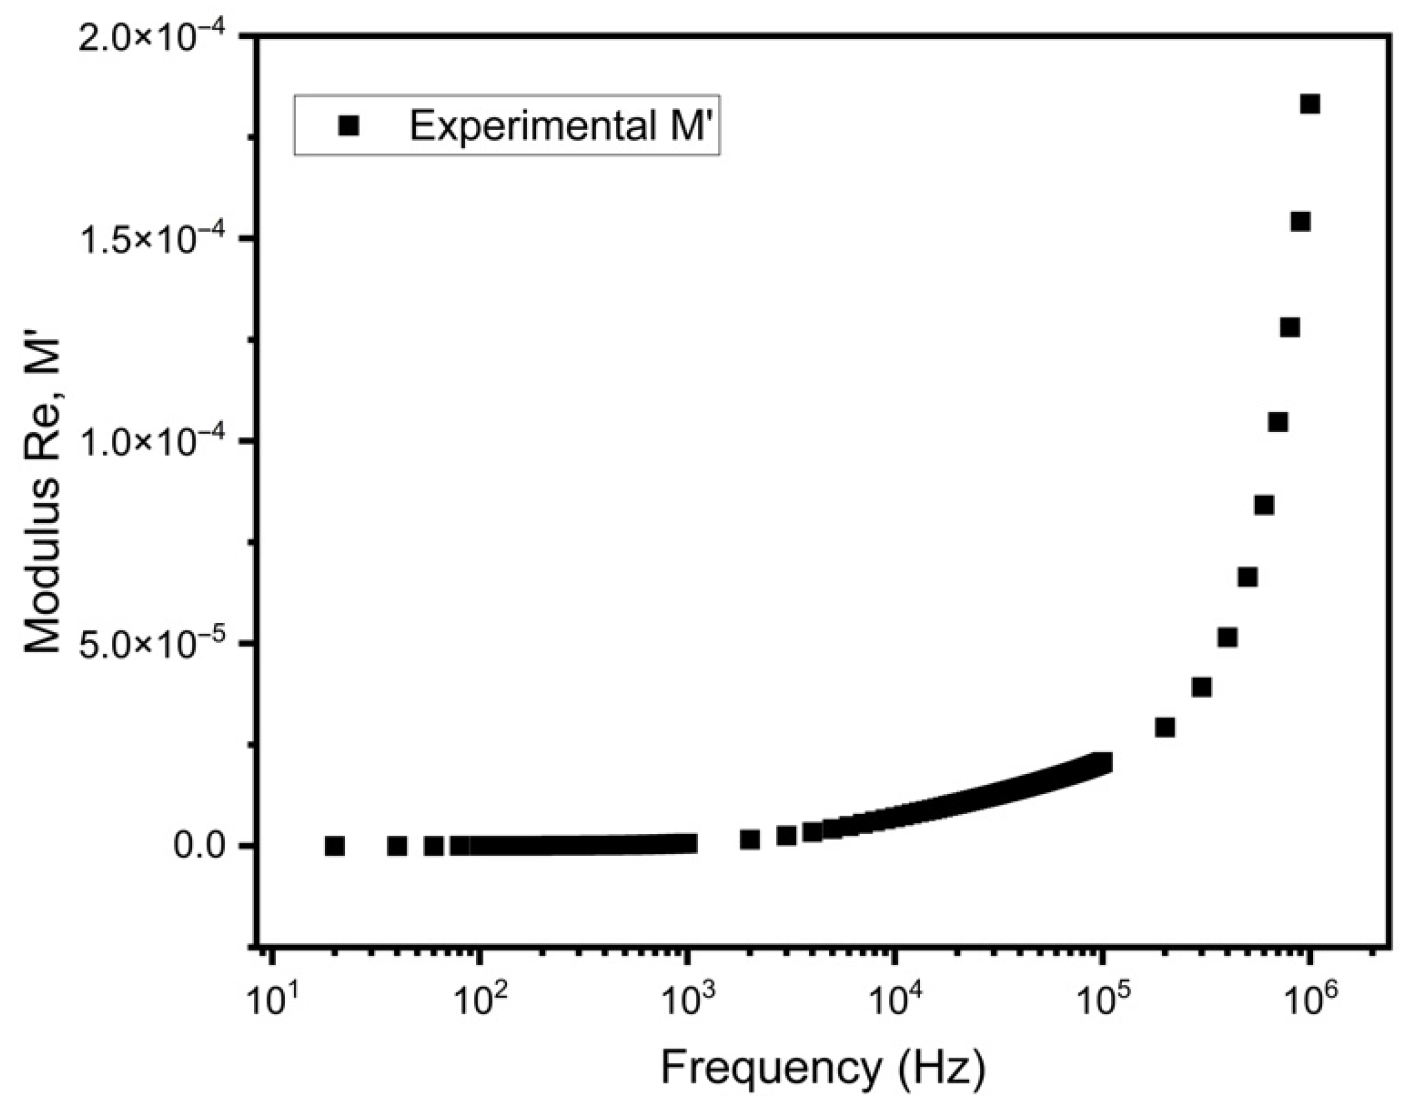
Figure 8 and Figure 9 show the behavior of the real and imaginary parts of the electrical modulus for the apples over the frequency range, providing significant insight into the mechanisms of dipole polarization. At low frequencies, in the range of 20 Hz to 10 kHz, the real part of the electrical modulus (M′) and imaginary part of the electrical modulus (M′′) were observed to be very low, representing the minimal energy loss because of efficient polarization. This suggests that the dipoles and ions within the apple tissues can easily align with the gradually varying electrical field, allowing maximum energy to be stored with minimal dissipation. Complex modulus can be represented with the inverse of the electrical complex dielectric constant (ε*).
M * = 1 ε *
M * = M + i M = ε ( ε ) 2 + ( ε ) 2 + ε ( ε ) 2 + ( ε ) 2
As the frequency increased to the intermediate range (10 kHz to 100 kHz), the value of M′ and M″ began to rise. This increase indicated the onset of the relaxation processes as dipoles and ions began to lag behind the change in the electrical field. This lag in response caused an increase in the resistance to the polarization effect, as shown in M′ values and greater energy dissipation, as reflected in M″. This represents the transition phase of the material’s ability to polarize from highly efficient to less efficient [56].
At frequencies even higher (above 100 kHz), both M′ and M″ increase drastically, indicating the inability to polarize and to follow the rapid oscillations of the electric field. This rapid oscillation also indicates that only faster polarization processes, such as electronic polarization, are effective within this frequency range. Meanwhile, the high values of M′′ at these frequencies reflect significant energy dissipation due to the inability of the slower mechanisms, i.e., ionic and dipolar polarization, to keep up with the field changes. The observed pattern may be explained through the ions’ short-range movement within the apple tissue, indicating that the restoring force that controls the motion of mobile ions in the presence of an electric field is absent [57,58].
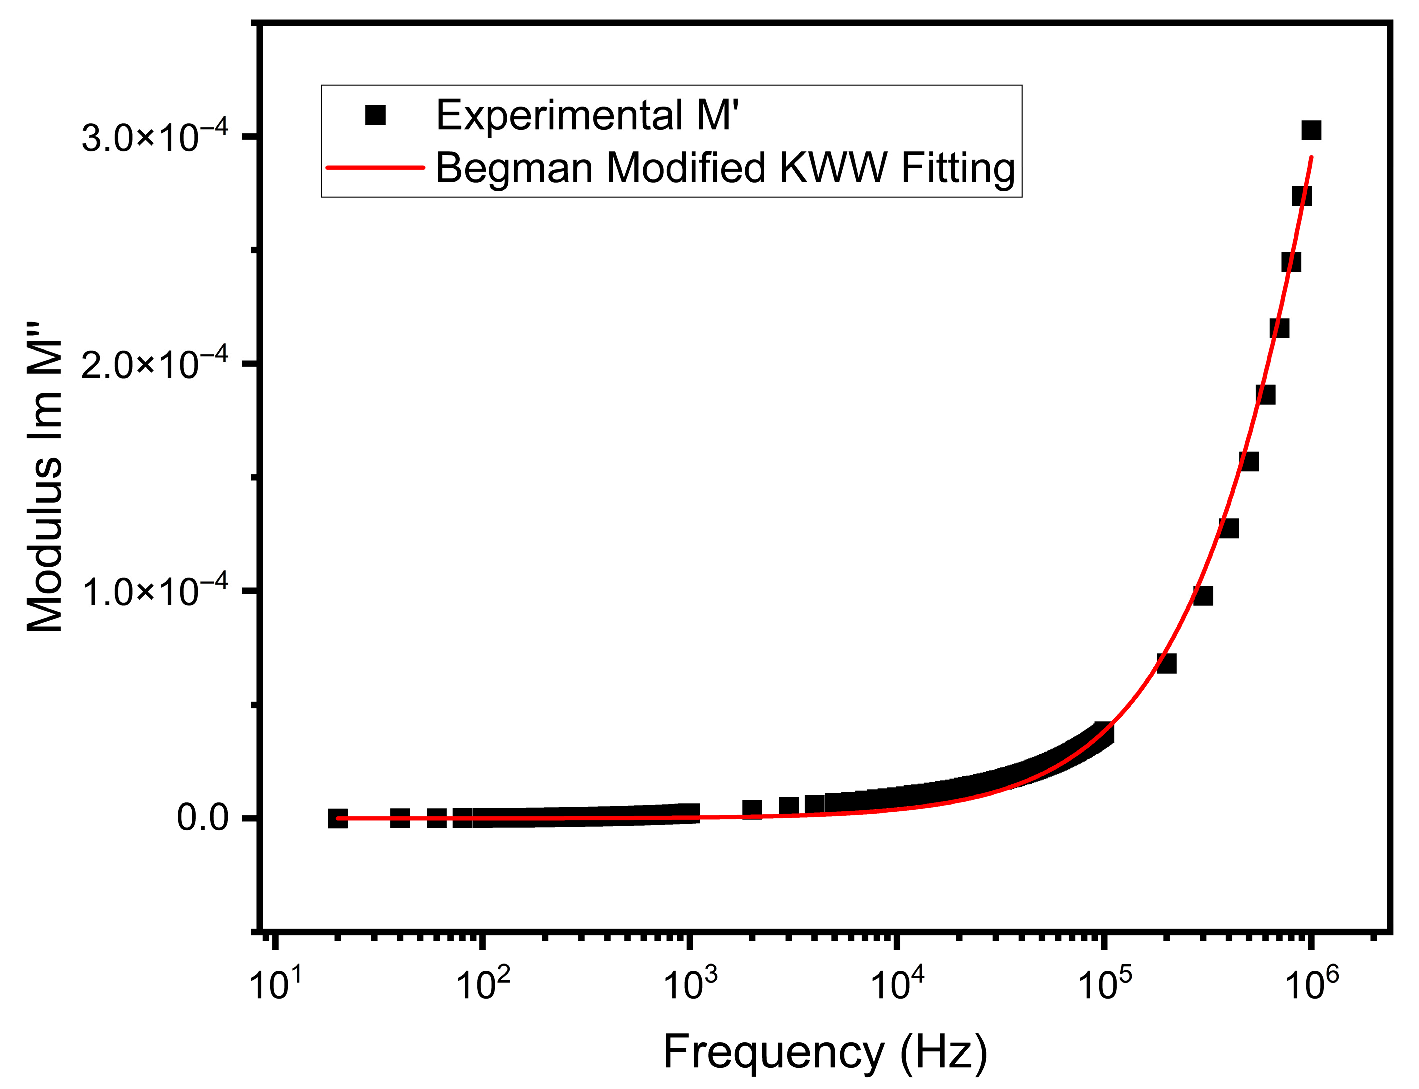
Kohlrausch–Williams–Watts (KWW) function modified by Bergman [59] was used to fit the data to explain the relaxation behavior of the apple sample.
M = M m a x ( 1 β ) + β 1 + β β × ω m a x ω + ω ω m a x β
where M″ is the imaginary part of the electrical modulus, Mmax is the peak value of M″, ωmax is the maximum/peak angular frequency, and β shows the deviation from Debye material-like relaxation. A β value less than 1 represents the non-Debye behavior. The value of β for the sample was found to be 0.019, which is less than 1, confirming the non-Debye-like behavior with stretched exponential relaxation, a common feature in systems with a wide distribution of relaxation times. The value closer to 0 also represents the higher interaction of the dipoles present in the system.

3.7. AC Conductivity

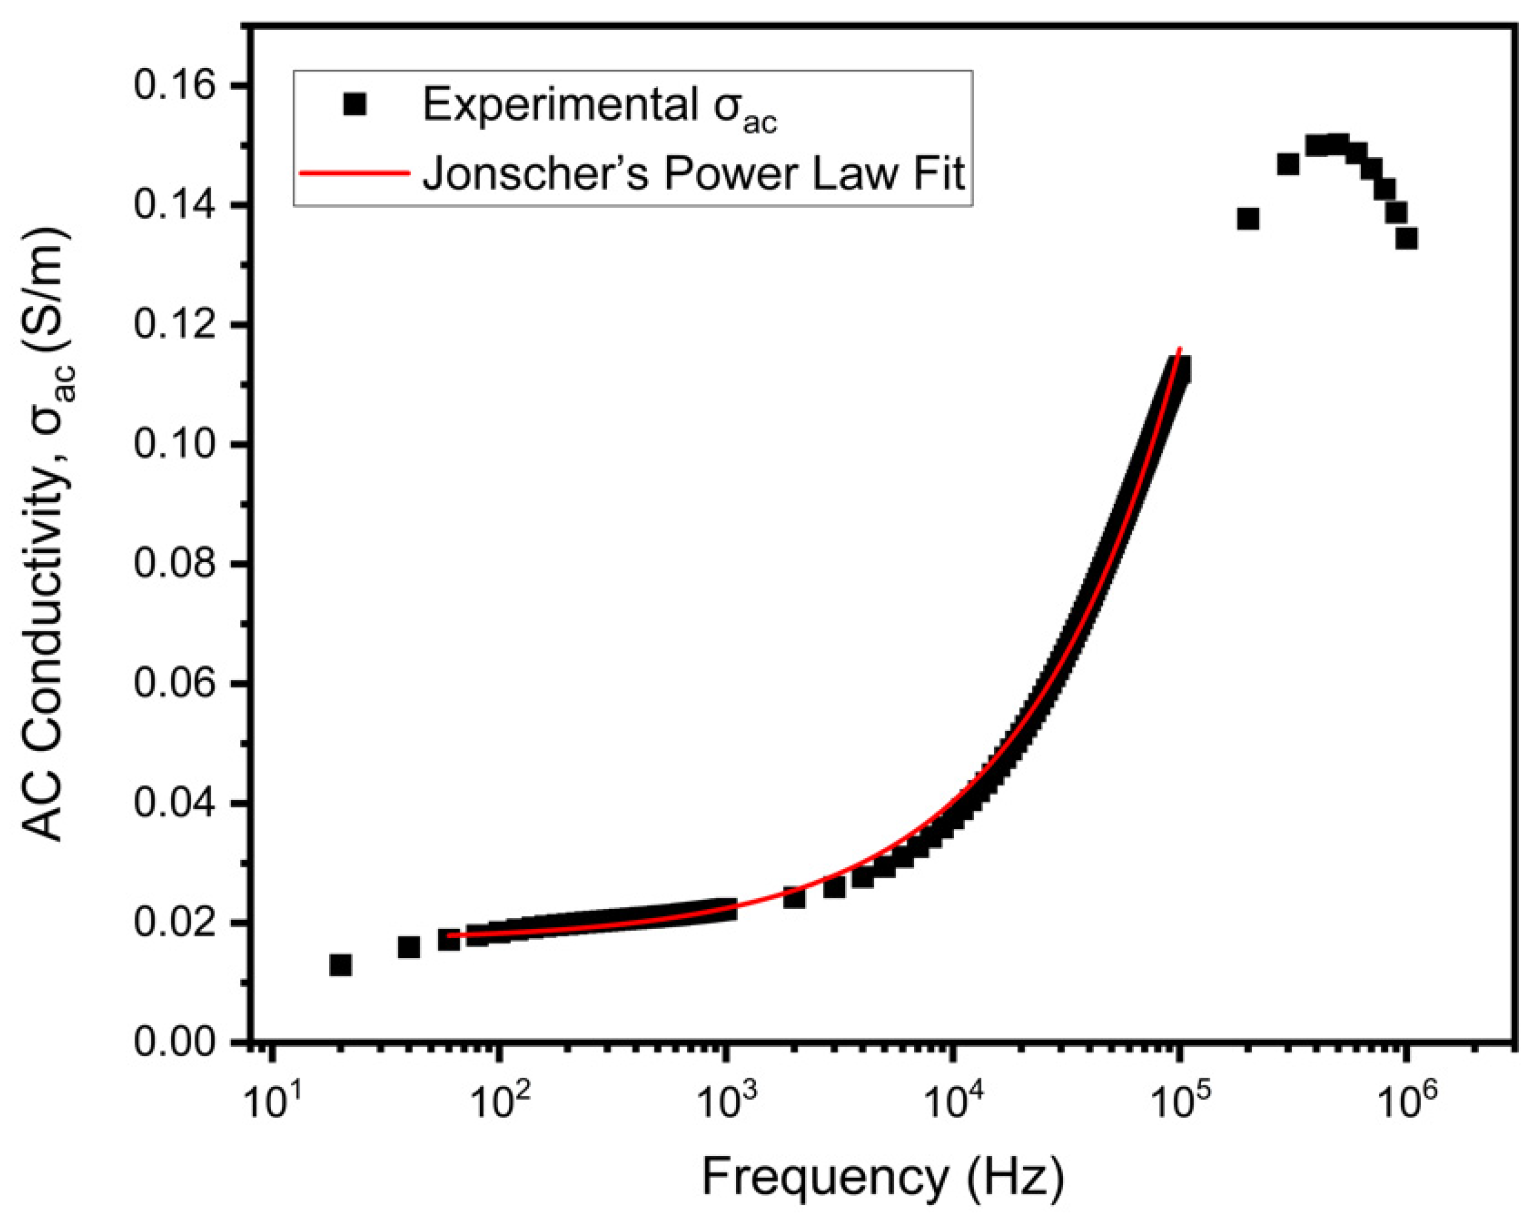
This evaluation of AC conductivity (σac) is integral to understanding the complex interplay between the dielectric properties and the electric modulus of the material. The conductivity of the apple sample over the specified frequency range is illustrated in Figure 10. σac can be determined using the following equation [60]:
σ a c = ε 0 ε ω tan δ
where ε0 is the free space permittivity and tan δ is the loss tangent, ω and ε′ are the same as the angular and dielectric constant as in the above equations. The frequency dependence of σac is analyzed by Jonscher’s power law [61], indicating that σac varies with ω following a power law behavior and is represented as follows:
σ a c = σ d c + A ω n
where both “A” and “n” represent the interactions of the mobile ions with neighboring lattices, “A” represents the dispersion parameter and describes the polarizability power, and “n” is the dimensionless frequency exponent.
By fitting the σac data with Jonscher’s power law equation, the values of parameters σdc, A, and n can be extracted, providing insights into the charge carrier dynamics and the nature of the conduction processes within the sample. The values of the different parameters are represented in Table 4.
The value of n represents the charged carrier’s translational motion with sudden hopping if the value of n < 1, or localized hopping without leaving their area if n > 1.
n = 1 6 K B T W M K B T ln 1 ω τ 0
The plot shown in Figure 10 typically indicates the two distinct regions. First, in the plateau region at a lower frequency range, the conductivity is frequency-independent, representing the DC conductivity σdc. In this region, the conductivity remains constant, indicating that the charge carriers have sufficient time to move through the material without being influenced by the frequency of the applied electric field. This represents the DC conductivity, where the movement of charge carriers is primarily due to direct current paths [62].
As the frequency increases, a second region, the dispersion region, emerges, where the conductivity begins to rise, corresponding to σac. The region at which the value of σac starts rising is called the hopping frequency, represented by ωp. This indicates that the rapidly oscillating electric field influences the charge carriers. This increase in σ is because of σac, where charge carriers experience localized hopping and enhanced mobility.
The exponent “n” is crucial for understanding the conduction mechanism. The value of “n” for the experimental apple sample was 0.627, which is less than 1. This clearly suggests that the charge carriers undergo translational motion with abrupt hopping between localized states. This type of motion is characteristic of ionic conductors and biological tissues, where ions move between fixed sites, contributing to the overall conductivity.

3.8. Statistical Analysis

The predicted values of different equivalent circuit models were compared using different statistical parameters such as Root Mean Square Error (RMSE), Normalized Mean Square Error (NMSE), Mean Square Error (MSE), Normalized Root Mean Square Error (NRMSE), Mean Percentage Error (MPE), Average Absolute Deviation (AAD), Correlation Coefficient (R), Coefficient of Determination (R2), and Adjusted Coefficient of Determination (Adj. R2). The statistical parameters of these models are presented in Table 5, from which it can be inferred that all models were predictive to varying degrees. However, the proposed model exhibited superior performance compared to the Cole, Hyden, Double-Shell, and P. Ibba et al. [35] models.
The proposed model demonstrated the lowest values of RMSE, NMSE, MSE, NRMSE, MPE, and AAD, indicating its higher accuracy and better predictive capability for the apple sample. The RMSE value for the proposed model was 6.610, which is the lowest among all the models. Similarly, the proposed model showed the smallest NMSE (0.059), MSE (43.696), NRMSE (0.392), and MPE (0.025) values, reflecting its enhanced precision.
Furthermore, the AAD for the proposed model was significantly lower at 2.857, demonstrating its superior consistency in prediction. In terms of correlation, the proposed model achieved the highest R-value (0.9973), R2 (0.9946), and Adjusted R2 (0.9945), underscoring its robustness and reliability in fitting the data. The higher R2 and lower error values (RMSE, NMSE, MSE, NRMSE, MPE, and AAD) confirm that the proposed model is the most effective in capturing the underlying patterns and relationships in the data, making it a superior choice for equivalent circuit modeling prediction of equivalent circuit behavior for the apple sample.

4. Discussion

The results from the study clearly confirm that EIS, as a non-destructive method, has the potential to effectively capture the complex dielectric and conductive behavior of apple tissue, providing insights beyond conventional destructive assays [63]. The equivalent fitting model and the component responses were in correspondence with earlier reports on biological material, highlighting the technique’s sensitivity to internal composition and microstructure. The non-Debye relaxation behavior, with α < 1, revealed by Cole–Cole fitting, shows consistency with biological systems exhibiting heterogeneous relaxation processes. Meanwhile, the improved accuracy of the proposed equivalent circuit model over established Cole, Hyden, and Double-Shell models suggests that tailored modeling can significantly enhance fruit quality assessment.
The illustrated Nyquist plot shows the characteristic semicircle and Warburg component, which correlates with the data as presented by Liu [64]. The radius of the semicircle and the transitional frequency, where the transition from the semicircle to the Warburg occurs, exhibit several features that correlate with the changes that occur during the storage of the apples. The radius of the semicircle increases with the increase in TSS or the reduction in moisture content, representing the strong correlation in which an increase in the degree Brix of the Red Delicious leads to a linear increase in impedance. During storage of the apple, there is an increase in water loss, resulting in a reduction in the total moisture content. The reduction in moisture decreases the overall conductivity of the sample, leading to increased impedance values. Meanwhile, the transitional frequency (the point where there is a dip) indicates the characteristic point where electrode polarization impedance (EPI) becomes significant, showing where meaningful quality-related constituent alteration occurs beyond this point. These changes can serve as a digital signature, a distinguishing feature for monitoring the quality of apples during storage.
These results not only reinforce the EIS as a low-cost, fast, non-destructive tool but also point toward practical postharvest applications. For example, in commercial cold storage, EIS could be deployed to monitor firmness loss, internal browning, or chilling injuries even without removing fruit from storage bins. During controlled atmosphere (CA) storage, where oxygen and carbon dioxide levels are tightly regulated, EIS could provide real-time information about physiological disorders such as internal breakdown or moisture loss, which are challenging to detect externally. Similarly, in transportation and retail distribution chains, portable EIS devices integrated with analog-to-digital converters (ADCs) could allow rapid, on-site assessment of apple quality, reducing reliance on destructive sampling and minimizing waste. However, the work is limited by its focus on a single cultivar under controlled conditions, leaving open questions about varietal differences, environmental influences, and robustness in field settings. Future studies could therefore extend the analyses to diverse cultivars, examine temporal changes during storage and ripening, and integrate data-driven approaches, such as machine learning, to classify impedance patterns for automated quality grading. In a broader context, the study contributes to the growing evidence that EIS can bridge fundamental plant biophysics with practical applications in agriculture, paving the way toward scalable, non-destructive quality monitoring solutions.

5. Conclusions

This study demonstrates the application of EIS to investigate the electrical properties of the apple variety Red Delicious (Malus domestica). The analysis provides significant insight into the approach of assessing spectral electrical signals to adjudge the structural and compositional implications of evaluating quality, freshness, ripeness, and storage changes. The Nyquist and Bode plots provided a comprehensive understanding of impedance characteristics across different frequencies. The equivalent circuit model, comprising resistive (R) and capacitive (C) elements, along with a Warburg element, effectively describes the observed impedance behavior. Investigation of dielectric constant (ε′) and loss (ε″) highlights the roles of ionic diffusion, space charge accumulation, and dipolar relaxation in determining apples’ electrical properties. The frequency-dependent behavior of these parameters confirms non-Debye relaxation characteristics, as described by the Cole–Cole relaxation model, indicating multiple relaxation processes with different time constants. Electrical modulus analysis further illustrates the polarization mechanisms within the apple tissue, while the Kohlrausch–Williams–Watts (KWW) function, modified by Bergman, confirms non-Debye behavior with stretched exponential relaxation. AC conductivity measurements fitted Jonscher’s power law and provided insights into charge carrier dynamics. The frequency-dependent conductivity showed a transition from DC to AC conductivity, indicating charge carrier hopping and translational motion. These findings have significant implications for the food industry, particularly in improving quality assessment, monitoring ripeness, and optimizing storage practices.

Supplementary Materials

The following supporting information can be downloaded at: https://www.mdpi.com/article/10.3390/ndt3040025/s1.

Author Contributions

Conceptualization, S.S. and K.P.; methodology, S.S.; software, S.S.; validation, S.S., S.K. and K.P.; formal analysis, S.S.; investigation, S.S.; resources, S.S.; data curation, S.S.; writing—original draft preparation, S.S.; writing—review and editing, S.S., S.K., F.J.T. and K.P.; visualization, S.S. and F.J.T.; supervision, S.K., F.J.T. and K.P.; project administration, F.J.T. and K.P. All authors have read and agreed to the published version of the manuscript.

Funding

This research received no external funding.

Institutional Review Board Statement

Not applicable.

Informed Consent Statement

Not applicable.

Data Availability Statement

All research data has been reported in this manuscript.

Acknowledgments

The first author is thankful to the Director, SLIET, Longowal, Punjab, India, for providing the necessary research facilities.

Conflicts of Interest

The authors declare no conflicts of interest.

Abbreviations

The following abbreviations are used in this manuscript:
AADAverage Absolute Deviation
EISElectrochemical Impedance Spectroscopy
GPIBGeneral-Purpose Interface Bus
MPEMean Percentage Error
MSEMean Square Error
NMSENormal Mean Square Error
NRMSENormal Root Mean Square
RMSERoot Mean Square Error
TATitratable Acidity
TSSTotal Soluble Solids
wwbWeight Wet Basis

References

  1. USDA. Supply and Distribution Online (PS&D). In United States Department of Agriculture Production Commodity Data; USDA: Gainesville, FL, USA, 2023. [Google Scholar]
  2. Hasan, M.U.; Singh, Z.; Shah, H.M.S.; Kaur, J.; Woodward, A. Water Loss: A Postharvest Quality Marker in Apple Storage. Food Bioprocess Technol. 2024, 17, 2155–2180. [Google Scholar] [CrossRef]
  3. Grabska, J.; Beć, K.B.; Ueno, N.; Huck, C.W. Analyzing the Quality Parameters of Apples by Spectroscopy from Vis/NIR to NIR Region: A Comprehensive Review. Foods 2023, 12, 1946. [Google Scholar] [CrossRef]
  4. Lin, Y.; Fan, R.; Wu, Y.; Zhan, C.; Qing, R.; Li, K.; Kang, Z. Combining hyperspectral imaging technology and visible-near infrared spectroscopy with a data fusion strategy for the detection of soluble solids content in apples. J. Food Compos. Anal. 2025, 137, 106996. [Google Scholar] [CrossRef]
  5. Fathizadeh, Z.; Aboonajmi, M.; Beygi, S.R.H. Nondestructive firmness prediction of apple fruit using acoustic vibration response. Sci. Hortic. 2020, 262, 109073. [Google Scholar] [CrossRef]
  6. Tempelaere, A.; Van Doorselaer, L.; He, J.; Verboven, P.; Nicolai, B.M. BraeNet: Internal disorder detection in ‘Braeburn’ apple using X-ray imaging data. Food Control 2024, 155, 110092. [Google Scholar] [CrossRef]
  7. Guo, Z.; Zhang, Y.; Xiao, H.; Jayan, H.; Majeed, U.; Ashiagbor, K.; Jiang, S.; Zou, X. Multi-sensor fusion and deep learning for batch monitoring and real-time warning of apple spoilage. Food Control 2025, 172, 111174. [Google Scholar] [CrossRef]
  8. Yagüe, M.C.; Zhang, X.; Volpatti, M.; Wei, Y.; Lebedev, G.; Gamby, J.; Barakat, A.I. Noninvasive real-time monitoring of cellular spatiotemporal dynamics via machine learning–enhanced electrical impedance spectroscopy. Sci. Adv. 2025, 11, eadx4919. [Google Scholar] [CrossRef]
  9. Lazanas, A.C.; Prodromidis, M.I. Electrochemical Impedance Spectroscopy—A Tutorial. ACS Meas. Sci. Au 2023, 3, 162–193. [Google Scholar] [CrossRef]
  10. Dean, D.; Ramanathan, T.; Machado, D.; Sundararajan, R. Electrical impedance spectroscopy study of biological tissues. J. Electrost. 2008, 66, 165–177. [Google Scholar] [CrossRef]
  11. Islam, M.; Wahid, K.A.; Dinh, A.V.; Bhowmik, P. Model of dehydration and assessment of moisture content on onion using EIS. J. Food Sci. Technol. 2019, 56, 2814–2824. [Google Scholar] [CrossRef]
  12. Chee, G.; Rungraeng, N.; Han, J.H.; Jun, S. Electrochemical Impedance Spectroscopy as an Alternative to Determine Dielectric Constant of Potatoes at Various Moisture Contents. J. Food Sci. 2014, 79, E195–E201. [Google Scholar] [CrossRef] [PubMed]
  13. Ando, Y.; Mizutani, K.; Wakatsuki, N. Electrical impedance analysis of potato tissues during drying. J. Food Eng. 2014, 121, 24–31. [Google Scholar] [CrossRef]
  14. Liu, X.; Fang, Q.; Zheng, S.; Cosic, I.; Cao, P. Electrical Impedance Spectroscopy Investigation on Cucumber Dehydration. Acta Hortic. 2008, 637–644. [Google Scholar] [CrossRef]
  15. Ando, Y.; Maeda, Y.; Mizutani, K.; Wakatsuki, N.; Hagiwara, S.; Nabetani, H. Effect of air-dehydration pretreatment before freezing on the electrical impedance characteristics and texture of carrots. J. Food Eng. 2016, 169, 114–121. [Google Scholar] [CrossRef]
  16. Shekhar, S.; Prasad, K. Nondestructive Evaluation of Moisture Content for Spinach Leaf Powder Using Complex Impedance Spectroscopy. J. ASABE 2023, 66, 415–421. [Google Scholar] [CrossRef]
  17. de Lima, L.K.R.; dos Santos, I.T.C.; da Silva, B.D.L.; dos Anjos, V.C.; Bell, M.J.V.; Nascimento, W. Electrical characterization of milk samples by Electrical Impedance Spectroscopy (EIS). Quarks Braz. Electron. J. Phys. Chem. Mater. Sci. 2022, 4, e022003. [Google Scholar]
  18. Soares, C.; Machado, J.T.; Lopes, A.M.; Vieira, E.; Delerue-Matos, C. Electrochemical impedance spectroscopy characterization of beverages. Food Chem. 2020, 302, 125345. [Google Scholar] [CrossRef] [PubMed]
  19. Grossi, M.; Parolin, C.; Vitali, B.; Riccò, B. Electrical Impedance Spectroscopy (EIS) characterization of saline solutions with a low-cost portable measurement system. Eng. Sci. Technol. Int. J. 2019, 22, 102–108. [Google Scholar] [CrossRef]
  20. Chowdhury, A.; Bera, T.K.; Ghoshal, D.; Chakraborty, B. Electrical Impedance Variations in Banana Ripening: An Analytical Study with Electrical Impedance Spectroscopy. J. Food Process Eng. 2016, 40, 12387. [Google Scholar] [CrossRef]
  21. Chowdhury, A.; Singh, P.; Bera, T.K.; Ghoshal, D.; Chakraborty, B. Electrical impedance spectroscopic study of mandarin orange during ripening. J. Food Meas. Charact. 2017, 11, 1654–1664. [Google Scholar] [CrossRef]
  22. Neto, A.F.; Olivier, N.C.; Cordeiro, E.R.; de Oliveira, H.P. Determination of mango ripening degree by electrical impedance spectroscopy. Comput. Electron. Agric. 2017, 143, 222–226. [Google Scholar] [CrossRef]
  23. Islam, M.; Wahid, K.; Dinh, A. Assessment of Ripening Degree of Avocado by Electrical Impedance Spectroscopy and Support Vector Machine. J. Food Qual. 2018, 2018, 4706147. [Google Scholar] [CrossRef]
  24. Li, J.; Xu, Y.; Zhu, W.; Wei, X.; Sun, H. Maturity assessment of tomato fruit based on electrical impedance spectroscopy. Int. J. Agric. Biol. Eng. 2019, 12, 154–161. [Google Scholar] [CrossRef]
  25. Kaur, R.; Shekhar, S.; Kumar, P.; Prasad, K. Image analysis as a non-destructive approach in selective characterization of promising Indian chickpea cultivars. Biol. Life Sci. Forum. 2021, 6, 112. [Google Scholar] [CrossRef]
  26. Prasad, K.; Vairagar, P.; Bera, M. Temperature dependent hydration kinetics of Cicer arietinum splits. Food Res. Int. 2010, 43, 483–488. [Google Scholar] [CrossRef]
  27. AOAC. Official Methods of Analysis of the Association of Official Analytical Chemists; Association of Official Analytical Chemists: Rockville, MD, USA, 1990. [Google Scholar]
  28. Ranganna, S. Handbook of Analysis and Quality Control for Fruit and Vegetable Products; Tata McGraw-Hill Education: Noida, India, 1986. [Google Scholar]
  29. Shekhar, S.; Prasad, K. Impedance Analyser Fixture for Testing Electrical Properties of Solid, Liquid, and Powder Materials. GB Patent 6,420,816, 2025. [Google Scholar]
  30. Watanabe, T.; Ando, Y.; Orikasa, T.; Kasai, S.; Shiina, T. Electrical impedance estimation for apple fruit tissues during storage using Cole–Cole plots. J. Food Eng. 2018, 221, 29–34. [Google Scholar] [CrossRef]
  31. Watanabe, T.; Orikasa, T.; Shono, H.; Koide, S.; Ando, Y.; Shiina, T.; Tagawa, A. The influence of inhibit avoid water defect responses by heat pretreatment on hot air drying rate of spinach. J. Food Eng. 2016, 168, 113–118. [Google Scholar] [CrossRef]
  32. Cole, K.S. Permeability and Impermeability of Cell Membranes for Ions. Cold Spring Harb. Symp. Quant. Biol. 1940, 8, 110–122. [Google Scholar] [CrossRef]
  33. Hayden, R.I.; Moyse, C.A.; Calder, F.W.; Crawford, D.P.; Fensom, D.S. Electrical Impedance Studies on Potato and Alfalfa Tissue. J. Exp. Bot. 1969, 20, 177–200. [Google Scholar] [CrossRef]
  34. Zhang, M.I.N.; Willison, J.H.M. Electrical Impedance Analysis in Plant Tissues8. J. Exp. Bot. 1993, 44, 1369–1375. [Google Scholar] [CrossRef]
  35. Ibba, P.; Falco, A.; Abera, B.D.; Cantarella, G.; Petti, L.; Lugli, P. Bio-impedance and circuit parameters: An analysis for tracking fruit ripening. Postharvest Biol. Technol. 2020, 159, 110978. [Google Scholar] [CrossRef]
  36. Kheiralipour, K.; Tabatabaeefar, A.; Mobli, H.; Rafiee, S.; Sharifi, M.; Jafari, A.; Rajabipour, A. Some physical and hydrodynamic properties of two varieties of apple [Malus domestica Borkh L.]. Int. Agrophysics 2008, 22, 225–229. [Google Scholar]
  37. Wu, J.; Gao, H.; Zhao, L.; Liao, X.; Chen, F.; Wang, Z.; Hu, X. Chemical compositional characterization of some apple cultivars. Food Chem. 2007, 103, 88–93. [Google Scholar] [CrossRef]
  38. Dobrzanski, B.; Rybczynski, R. Colour change of apple as a result of storage, shelf-life, and bruising. Int. Agrophysics 2002, 16, 261–268. [Google Scholar]
  39. Motshakeri, M.; Sharma, M.; Phillips, A.R.J.; Kilmartin, P.A. Electrochemical Methods for the Analysis of Milk. J. Agric. Food Chem. 2022, 70, 2427–2449. [Google Scholar] [CrossRef]
  40. Brett, C.M.A. Electrochemical Impedance Spectroscopy in the Characterisation and Application of Modified Electrodes for Electrochemical Sensors and Biosensors. Molecules 2022, 27, 1497. [Google Scholar] [CrossRef] [PubMed]
  41. Allagui, A.; Benaoum, H.; Olendski, O. On the Gouy–Chapman–Stern model of the electrical double-layer structure with a generalized Boltzmann factor. Phys. A Stat. Mech. Its Appl. 2021, 582, 126252. [Google Scholar] [CrossRef]
  42. Joshi, M. Importance of impedance spectroscopy technique in materials characterization: A brief review. Mech. Mater. Sci. Eng. MMSE J. 2017, 9. [Google Scholar]
  43. Rout, S.K.; Bera, J. Grain and Grain-Boundary Study of Acceptor Doped SrTiO3 Ceramics Using Impedance Spectroscopy. Ferroelectrics 2005, 323, 79–84. [Google Scholar] [CrossRef]
  44. Laschuk, N.O.; Easton, E.B.; Zenkina, O.V. Reducing the resistance for the use of electrochemical impedance spectroscopy analysis in materials chemistry. RSC Adv. 2021, 11, 27925–27936. [Google Scholar] [CrossRef] [PubMed]
  45. Bera, T.K.; Bera, S.; Chowdhury, A.; Ghoshal, D.; Chakraborty, B. Electrical impedance spectroscopy (EIS) based fruit characterization: A technical review. In Computer, Communication and Electrical Technology; CRC Press: Boca Raton, FL, USA, 2017; pp. 279–288. [Google Scholar]
  46. Ikyumbur, J.T.; McAsule, A.A.; Akiiga, N.S.; Andrawus, Z.E.; Kungur, S.T. The Analysis of Dielectric Constant, Loss Factor and Q-Factor of Selected Fruits at Microwave Frequency Range. J. Sci. Res. Rep. 2020, 26, 57–66. [Google Scholar] [CrossRef]
  47. Juansah, J.; Budiastra, I.W.; Dahlan, K.; Seminar, K.B. Electrical properties of garut citrus fruits at low alternating current signal and its correlation with physicochemical properties during maturation. Int. J. Food Prop. 2014, 17, 1498–1517. [Google Scholar] [CrossRef]
  48. Li, Y.; Han, M.; Zhou, W.; Chen, Z. Radio-frequency dielectric relaxation behavior of selected vegetable tissues: Spectra analysis with logarithmic derivative method and simulation with double-shell model. J. Food Eng. 2020, 277, 109914. [Google Scholar] [CrossRef]
  49. Kafarski, M.; Wilczek, A.; Szypłowska, A.; Lewandowski, A.; Pieczywek, P.; Janik, G.; Skierucha, W. Evaluation of apple maturity with two types of dielectric probes. Sensors 2018, 18, 121. [Google Scholar] [CrossRef]
  50. Pal, J.; Kumar, S.; Kaur, S.; Malhi, P.S.; Kumar, Y.; Singh, M.; Singh, A. Study of the magnetic, electrical and magneto-dielectric properties and dielectric relaxation in 0.8BiFeO3-0.2Ba0·8Sr0·2TiO3 solid solution. Solid State Sci. 2020, 103, 106193. [Google Scholar] [CrossRef]
  51. Mafé, S.; Manzanares, J.A.; Ramirez, P. Modeling of surface vs. bulk ionic conductivity in fixed charge membranes. Chem. Chem. Phys. 2003, 5, 376–383. [Google Scholar]
  52. Tıraş, B.; Dede, S.; Altay, F. Dielectric properties of foods. J. Agric. Food Sci. Technol. 2019, 7, 1805–1816. [Google Scholar] [CrossRef]
  53. Mainardi, F.; Barelli, E. Dielectric Relaxation in Biological Materials. In Scuola di Scienze; Alma Mater Studiorum Universita di Bologna: Bologna, Italy, 2015; p. 101. [Google Scholar]
  54. Havriliak, S.; Negami, S. A complex plane analysis of α-dispersions in some polymer systems. J. Polym. Sci. Part C Polym. Symp. 2007, 14, 99–117. [Google Scholar] [CrossRef]
  55. Zhao, C.; Zhao, C.Z.; Werner, M.; Taylor, S.; Chalker, P. Dielectric relaxation of high-k oxides. Nanoscale Res. Lett. 2013, 8, 456. [Google Scholar] [CrossRef]
  56. Kaur, S.; Arora, M.; Sharma, L.; Kumar, S.; Malhi, P.S.; Singh, M.; Singh, A. Hopping Mechanism and Impedance Properties of Mg Doped NBT-KBT Solid Solution near Ambient Temperature. ECS J. Solid State Sci. Technol. 2022, 11, 103010. [Google Scholar] [CrossRef]
  57. Macdonald, J.R. Impedance spectroscopy. Ann. Biomed. Eng. 1992, 20, 289–305. [Google Scholar] [CrossRef]
  58. Chenari, H.M.; Golzan, M.; Sedghi, H.; Hassanzadeh, A.; Talebian, M. Frequency dependence of dielectric properties and electrical conductivity of Cu/nano-SnO2 thick film/Cu arrangement. Curr. Appl. Phys. 2011, 11, 1071–1076. [Google Scholar] [CrossRef]
  59. Bergman, R. General susceptibility functions for relaxations in disordered systems. J. Appl. Phys. 2000, 88, 1356–1365. [Google Scholar] [CrossRef]
  60. Prakash, V.; Choudhary, S.; Sinha, T. Dielectric relaxation in complex perovskite oxide BaCo1/2W1/2O3. Phys. B Condens. Matter 2008, 403, 103–108. [Google Scholar] [CrossRef]
  61. Jonscher, A.K. The ‘universal’ dielectric response. Nature 1977, 267, 673–679. [Google Scholar] [CrossRef]
  62. Halder, S.; Bhuyan, S.; Choudhary, R. Structural, dielectric and electrical characteristics of lead-free electro-ceramic:Bi(Ni2/3Ta1/3)O3. Eng. Sci. Technol. Int. J. 2019, 22, 376–384. [Google Scholar] [CrossRef]
  63. Prasad, K. Advances in Nondestructive Quality Measurement of Fruits and Vegetables. Postharvest Biol. Technol. Hortic. Crops Princ. Pract. Qual. Maint. 2015, 51, 51–87. [Google Scholar]
  64. Liu, X. Electrical Impedance Spectroscopy Applied in Plant Physiology Studies. Master’s Thesis, RMIT University, Melbourne, Australia, 2024; p. 102. [Google Scholar]
Figure 1. Three linear dimensions: length (l), the equivalent distance of the stem (top) to the calyx (bottom), width (w), the longest dimension perpendicular to l, and thickness (t), and the longest dimension perpendicular to l and w.
Ndt 03 00025 g001
Figure 2. Nyquist plot of real and imaginary parts of impedance with an inset showing the proposed equivalent circuit model representing the accuracy of fitting with experimental findings.
Ndt 03 00025 g002
Figure 3. Schematics for acquiring electrical parameters and reflecting the alternate current conduction pathway at higher and lower frequencies in biological tissue.
Ndt 03 00025 g003
Figure 4. Bode plot shows frequency dependence of Impedance and phase angle; the circles show the relaxations (τ).
Ndt 03 00025 g004
Figure 5. Dielectric constant and its fitting using the Cole–Cole relaxation model as a function of frequency.
Ndt 03 00025 g005
Figure 6. Dielectric loss and its fitting using the Cole–Cole relaxation model as a function of frequency.
Ndt 03 00025 g006
Figure 7. Cole–Cole plot of Dielectric constant vs. Dielectric loss showing 1/4th of a symmetrical semicircle.
Ndt 03 00025 g007
Figure 8. Electrical modulus of the apple as a function of frequency.
Ndt 03 00025 g008
Figure 9. Electrical modulus using the modified Bergman KWW fitting model as a function of frequency.
Ndt 03 00025 g009
Figure 10. Frequency-dependent AC conductivity with Jonscher’s Power law fitting.
Ndt 03 00025 g010
Table 1. Physicochemical and optical properties of Red Delicious apple.
Physical PropertyRed Delicious
Length (cm)7.53 ± 0.64
Width (cm)7.53 ± 0.55
Thickness (cm)8.37 ± 0.45
Geometric mean diameter (Dg) cm7.87 ± 0.56
Equivalent Diameter (Dp) cm7.88 ± 0.67
Arithmetic diameter (Da) cm7.88 ± 0.87
Surface Area (S) cm2196 ± 28
Sphericity (Sp) %1.03 ± 0.02
Aspect Ratio (Ra)1.05 ± 0.07
Mass of fruit (g)233 ± 33
Volume (mL)266 ± 43
Density (kg/m3)879 ± 34
Bulk Density (kg/m3)645 ± 90
Porosity (%)26 ± 11
Packaging coefficient (v/v)0.74 ± 0.14
Coefficient of static friction on:
Glass0.70 ± 0.02
Steel0.49 ± 0.04
Plywood with Grains perpendicular0.46 ± 0.05
Plywood with grains parallel.0.46 ± 0.02
Moisture, % w.b84.00 ± 1.40
TSS, (°B)14.58 ± 0.28
TA, (%)0.64 ± 0.02
pH4.81 ± 0.25
Vitamin C (mg/100 g)12.30 ± 3.13
Brix: Acid ratio22.64 ± 0.16
Optical parameters
L*32 ± 8
a*43 ± 6
b*21 ± 4
Table 2. Value of different elements present in the equivalent circuit model.
R-C CircuitResistance (Ohm)Capacitance (F)Warburg Element (Ohm∙s−1/2)
117.842.343 × 10−9-
2240.823.39 × 10−6-
343.330.491 × 10−6-
4176.24.713 × 10−611,693
0.668 × 10⁻⁶
Table 3. Model fitting parameters of the frequency-dependent complex dielectric constant.
Model
Parameters
Harvrialiak–Negami
Relaxation Model
ε*
τ0.024
α0.892
Table 4. Model fitting parameters of frequency-dependent AC conductivity.
Model ParametersJohn’s Power Law
σdc0.016
n0.627
Table 5. Statistical comparison of different equivalent circuit models with the proposed model.
Statistical ParametersCole ModelHyden ModelDouble-Shell ModelP. Ibba et al. [35]Proposed Model
RMSE11.48110.0807.4336.8526.610
NMSE0.1030.0910.0670.0620.059
MSE131.824101.61655.25446.95043.696
NRMSE1.1840.9130.4960.4220.392
MPE0.0590.0550.0440.0520.025
AAD7.1696.5725.1834.9142.857
R0.99060.99390.99580.99720.9973
R20.98130.98790.99170.99440.9946
Adj. R20.98090.98760.99150.99430.9945
Disclaimer/Publisher’s Note: The statements, opinions and data contained in all publications are solely those of the individual author(s) and contributor(s) and not of MDPI and/or the editor(s). MDPI and/or the editor(s) disclaim responsibility for any injury to people or property resulting from any ideas, methods, instructions or products referred to in the content.