Article

Artificial Intelligence for Forensic Image Analysis in Bullet Hole Comparison: A Preliminary Study

by
Guilherme Pina Cardim
1,*,
Thiago de Souza Duarte
2,
Henrique Pina Cardim
1,
Wallace Casaca
3,
Rogério Galante Negri
4,
Flávio Camargo Cabrera
1,
Renivaldo José dos Santos
1,
Erivaldo Antônio da Silva
2 and
Mauricio Araujo Dias
2,*
1
School of Engineering and Sciences, São Paulo State University (UNESP), Rosana 19274-000, Brazil
2
School of Technology and Sciences, São Paulo State University (UNESP), Presidente Prudente 19060-900, Brazil
3
Institute of Biosciences, Humanities and Exact Sciences, São Paulo State University (UNESP), São José do Rio Preto 15054-000, Brazil
4
Institute of Science and Technology, São Paulo State University (UNESP), São José dos Campos 12245-000, Brazil
*
Authors to whom correspondence should be addressed.
Submission received: 22 March 2025 / Revised: 18 June 2025 / Accepted: 22 June 2025 / Published: 8 July 2025

Abstract

The application of artificial intelligence within forensic image analysis marks a significant step forward for the non-destructive examination of evidence, a crucial practice for maintaining the integrity of a crime scene. While non-destructive testing (NDT) methods are established, the integration of AI, particularly for analyzing ballistic evidence, requires further exploration. This preliminary study directly addresses this gap by focusing on the use of deep learning to automate the analysis of bullet holes. This work investigated the performance of two state-of-the-art convolutional neural networks (CNNs), YOLOv8 and R-CNN, for detecting ballistic markings in digital images. The approach treats digital image analysis itself as a form of non-destructive testing, thereby preserving the original evidence. The findings demonstrate the potential of AI to augment forensic investigations by providing an objective, data-driven alternative to traditional assessments and increasing the efficiency of evidence processing. This research confirms the feasibility and relevance of leveraging advanced AI models to develop powerful new tools for Forensic Science. It is expected that this study will contribute worldwide to help (1) the police indict criminals and prove innocence; (2) the justice system judges and proves people guilty of their crimes.

1. Introduction

Non-destructive testing [1,2,3] is a major area of interest within the field of Forensic Science [4]. It is relevant because non-destructive testing is important to avoid altering the crime scene and to preserve evidence during artifact collection and analysis [5,6,7,8,9,10,11]. Evidence obtained from non-destructive testing is a major contributor to helping the police and justice system incriminate, judge, and prove guilty of a crime [9]. Comparative testing of ballistics [12] is a key strategy for forensic scientists because it allows forensic experts to identify the characteristics of firearms used to commit crimes. The most popular comparative ballistics testing compares the marks left on bullets when fired from the gun barrel. This test seeks to identify a firearm based on the correspondence between the marks of the projectiles found at the scene of the crime and the marks of the projectiles fired in a forensic laboratory with the alleged murder weapon. However, criminals often remove bullets and cartridges (cases) from crime scenes, as well as weapons, making this testing from internal ballistics [13] unfeasible.
On the other hand, removing surfaces targeted by gunfire at the scene of the crime sounds very unusual. Therefore, comparative ballistics testing focused on bullet holes is best suited for forensic cases dealing with the absence of bullets and cartridges (cases) at crime scenes. Another important test of ballistics compares images of bullet holes from surfaces targeted by gunfire. Several studies related to this type of testing, using different approaches and with different purposes, can be found in the scientific literature, as in [14,15,16,17,18,19,20,21,22]. This testing seeks to identify characteristics (such as caliber and type) of a firearm based on the correspondence between the image of the bullet holes found at the crime scene and images of previously categorized bullet holes composing a dataset, which is studied in terminal ballistics [13]. Debate continues about the best strategies that utilize artificial intelligence for the management of comparative testing of ballistics.
Figure 1 shows the main steps of the terminal ballistics test. It is performed in four steps: evidence collection, bullet hole detection, classification, and matching. Artificial intelligence is usually applied to the last three steps, and each step can apply a different artificial intelligence strategy if necessary. The complete testing is so complex that it is divided here into two parts, as shown in Figure 1. The current study fits into the first part, which is more directly related to non-destructive testing than the second part.
In the first part, the evidence collection step must follow some practices to preserve evidence at the crime scene and in forensic laboratories. There are many publications that describe guidelines for preserving evidence during the collection and analysis of artifacts found at crime scenes, such as [6,7,8,9,10,11]. Regarding the second step, several articles express a wide variety of strategies for detecting bullet holes in digital images based on artificial intelligence and other sources [13,23,24,25,26,27]. However, to the knowledge of the authors, none of the previously published papers presents testing that utilizes artificial intelligence to compare bullet holes in surfaces targeted by gunfire within the context of terminal ballistics as a non-destructive technique for Forensic Science.
This paper highlights the importance of addressing bullet hole detection by artificial intelligence as a non-destructive testing method. In this sense, artificial intelligence was applied to data from diversified datasets to investigate the accuracy of the proposed strategy. For that, convolutional neural networks, Recursive (R-CNN) and You Only Look Once (YOLOV8) [1,28,29], were used to train and detect bullet holes found in digital images.
It is important to note that the evidence collection step can be performed with an ultrasonic technique or by charge-coupled device (CCD) sensors. While the ultrasonic technique can, for example, use antisymmetric Lamb waves, as seen in [30], the CCD sensors detect electromagnetic waves across a wavelength range, as seen in [1,31]. This work was performed with images acquired by CCD sensors because the datasets were already available in the literature.
This paper innovates by addressing the topic of comparing bullet holes in surfaces targeted by gunfire by using artificial intelligence in the context of terminal ballistics for Forensic Science as a non-destructive testing method, as presented in Figure 2.
The main contribution of this paper is to be a reference to researchers and forensic experts to ensure that comparative testing will really be performed by AI-based tools as a non-destructive testing method to detect bullet holes. This is a central issue for solving crimes aided by artificial intelligence since a not rigorous investigation can impact the accuracy of the results achieved by artificial intelligence and, consequently, the crime-solving.
This paper is organized as follows: Section 2 presents information about principles, rules, and protocols in the field of Forensic Science, general concepts regarding convolutional neural networks, and an introduction to the You Only Look Once algorithm. Section 3 describes the methodology. Section 4 presents the results, and Section 5 presents conclusions and suggestions for future studies.

2. Background

2.1. Non-Destructive Testing in Forensic Ballistics

2.1.1. Forensic Ballistics

Forensic ballistics investigates not only firearms and their respective ammunition but also the phenomena and effects caused by shots from these weapons [13]. It is an applied science that aims to clarify the circumstances of the use of firearms while also understanding and solving crimes. It is related to different types of testing that serve to determine, among other characteristics, the caliber and type of weapon used, the number of shots fired, the distance of the shot or the trajectory of the bullet, both in relation to the target surface, and the shooter’s position.
Forensic ballistics testing is grouped and classified into four different groups: internal ballistics, intermediate ballistics, external ballistics, and terminal ballistics [13], as described below.
  • Internal ballistics investigates the phenomena that occur internally within the firearm.
  • Intermediate ballistics (or transition ballistics) investigates the phenomena and behavior of the projectile, influenced by the gases remaining from the shot, immediately after leaving the gun barrel.
  • External ballistics investigates the behavior of the bullet as it travels through the air in the distance between the weapon and the target surface of the shot.
  • Terminal ballistics investigates the phenomena, behavior, and effects of the bullet as it collides with and pierces the target surface of the shot.

2.1.2. Evidence Collection in Forensic Science

When commenting on the guidelines used in Forensic Science to ensure that testing is non-destructive, in this work, the evidence collection step was not separated from the artifact analysis steps. These steps were kept as part of the same set because many of the professionals who investigate crime scenes are part of the crime laboratory staff (administratively) [4]. Furthermore, forensic scientists increasingly participate in crime scene investigations to assist crime scene investigators (CSIs) in their tasks [4]. Therefore, the widely-held belief that many people linked to Forensic Science still have not considered investigations carried out at the crime scene as part of Forensic Science tends to become increasingly outdated.
Even important publications in the area of Forensic Science, such as [4,5,6,7,8,9,10,11], include at least one chapter or section on collecting evidence at crime scenes. There are several different types of publications, such as awareness protocols for non-forensic personnel [6], collection guides [7,8], manuals [9,10], and online test banks [11]. Together, these publications seek to raise awareness among police departments around the world about the need and importance of applying guidelines for conducting forensic investigations in criminal investigation activities.

2.1.3. Relevance

Although the content of these publications may appear redundant or obvious to some forensic scientists in developed countries, these same guidelines still remain at least somewhat distant from the reality of many developing countries, which suffer from a high crime rate and a low number of forensic experts to investigate all crimes occurring within the respective territorial borders. Furthermore, these same countries have low criminal conviction rates due to the high rate of unsolved or incorrectly solved crimes. In these countries, impunity often serves as an incentive to commit crimes. Therefore, this study presents itself as an important and necessary publication to try to change this reality across the world by raising awareness of the police and justice systems in these countries. This time, however, it approaches this issue in an innovative way to the knowledge of the authors, i.e., in the context of non-destructive testing carried out by artificial intelligence to help resolve a terminal ballistic problem.

2.1.4. Guidelines for Carrying out Non-Destructive Testing

According to the guidelines for carrying out forensic examinations [6,7,8,9,10,11], some of which are briefly discussed, upon discovering the occurrence of a criminal act, an ordinary citizen, a rescuer, or even an unprepared police officer may, even without meaning to, alter the crime scene. Interference with the evidence present at the crime scene can be mitigated if there is intense work to raise awareness among teams that carry out non-forensic work [6]. Therefore, crime scene preservation work should begin as soon as possible. To do this, the crime scene must be isolated, and only personnel essential to the investigation should be authorized to enter this perimeter. These precautions are essential to preserve the integrity of the crime scene, thus avoiding contamination, loss, or destruction of evidence.
According to these guidelines, each crime scene is unique. Therefore, the requirements for its investigation may require adaptations or changes, as new evidence can be recognized during the investigation of the scene. Therefore, the assignment of responsibilities and tasks must be dynamic and flexible but always planned to meet the specifics of the unique scenario. Therefore, for each crime scene, experts must organize themselves and prepare their functions in order to seek the veracity of the facts.
Often, the fidelity of facts can be hidden in a small and seemingly insignificant clue at first glance, such as a simple strand of hair, but which, after forensic analysis, may prove to be essential for solving the crime. Therefore, by assigning responsibilities to experts, limiting the number of people at the crime scene is paramount. Moreover, adequate communication is critical to prevent these clues from being neglected, lost, contaminated, compromised, or even destroyed. In parallel, false clues can be introduced accidentally, disorienting experts and influencing the final outcome of the investigation.
The considerations made in the previous paragraph are valid both for activities carried out at the crime scene, as well as for the handling of instruments and packaging used for handling samples analyzed in forensic laboratories. Therefore, unpreparedness in attending and staying in these places may cause a loss of evidence or compromise the analysis process that would determine someone’s guilt or innocence.

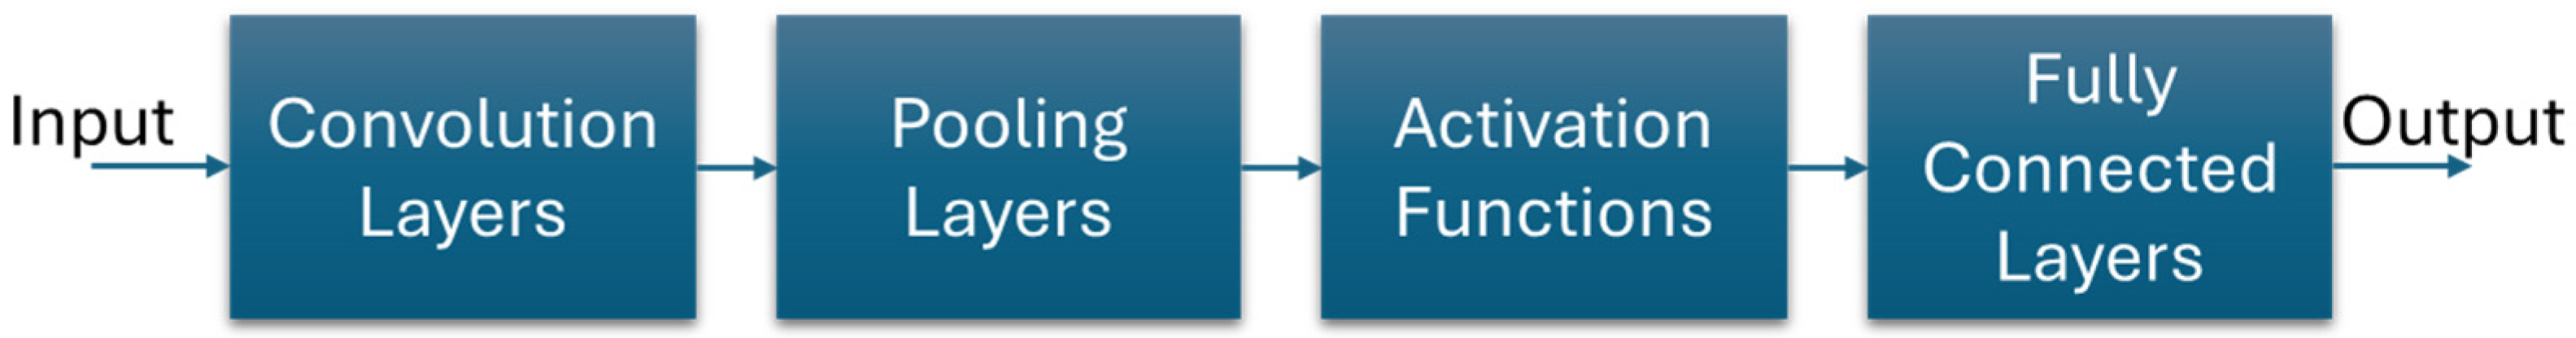
2.2. Introduction to Convolutional Neural Networks

Deep learning leads to complexity problems where there are large datasets available. It is an artificial intelligence subfield focused on models of large neural networks that make data-driven decisions [32]. Deep learning seeks to emulate human cognitive processes in machines, aiming to make machines intelligent [33]. The essential human capacity for learning forms the basis for Machine Learning (ML), a field dedicated to reducing human effort across various tasks by enabling machines to learn from past experiences [34]. The ML methods are improving the state-of-the-art in different applications, such as speech recognition and object detection [35]. ML encompasses three primary learning paradigms: supervised, unsupervised, and semi-supervised learning. Traditional ML techniques often require a process of feature extraction, demanding domain-specific knowledge and posing challenges in selecting appropriate features for given problems. Deep learning addresses these challenges by automating the extraction of significant features.
Convolutional Neural Network (CNN) is a type of deep learning algorithm that makes use of a feedforward architecture designed to adapt to environmental changes, maintaining a desired equilibrium state. The CNNs can be defined as hierarchical feature detectors inspired by biological systems, capable of learning highly abstract features and accurately detecting objects [36]. CNNs are favored over classical neural network models for several reasons: weight sharing reduces the number of parameters needing training, leading to better generalization; the integration of classification and feature extraction simplifies the process; and the implementation of large networks is more manageable with CNNs compared to general artificial neural networks [37,38,39].

Structural Overview of Convolutional Neural Networks

An artificial neural network model normally comprises a single input and output layer with multiple hidden layers [40]. Each neuron processes an input vector X and applies a function F with a W weight vector to produce an output vector Y. It is represented by Equation (1) [41].
F X , W = Y
It is worth highlighting that the W vector indicates the strength of interconnections between neurons in adjacent layers and, so, it is essential for image classification tasks. The general CNN model includes four primary components: convolution layers, pooling layers, activation functions, and fully connected layers, as presented in Figure 3.
In image classification, the CNN model receives an image as its input and outputs a class label based on extracted features. Neurons in subsequent layers connect to those in preceding layers through receptive fields, which are responsible for extracting local features of the input image [42]. Receptive fields form weight vectors that remain consistent across all points in a plane, ensuring the detection of similar features at different locations within the input, as illustrated in Figure 4 [43].
The weight vectors work as a kernel sliding over input vectors to generate feature maps in a process called convolution. This sliding, both horizontally and vertically, constitutes the convolution operation. It extracts multiple features from a single input image layer, creating distinct feature maps and significantly reducing the number of parameters to be trained due to the receptive fields mentioned [45].

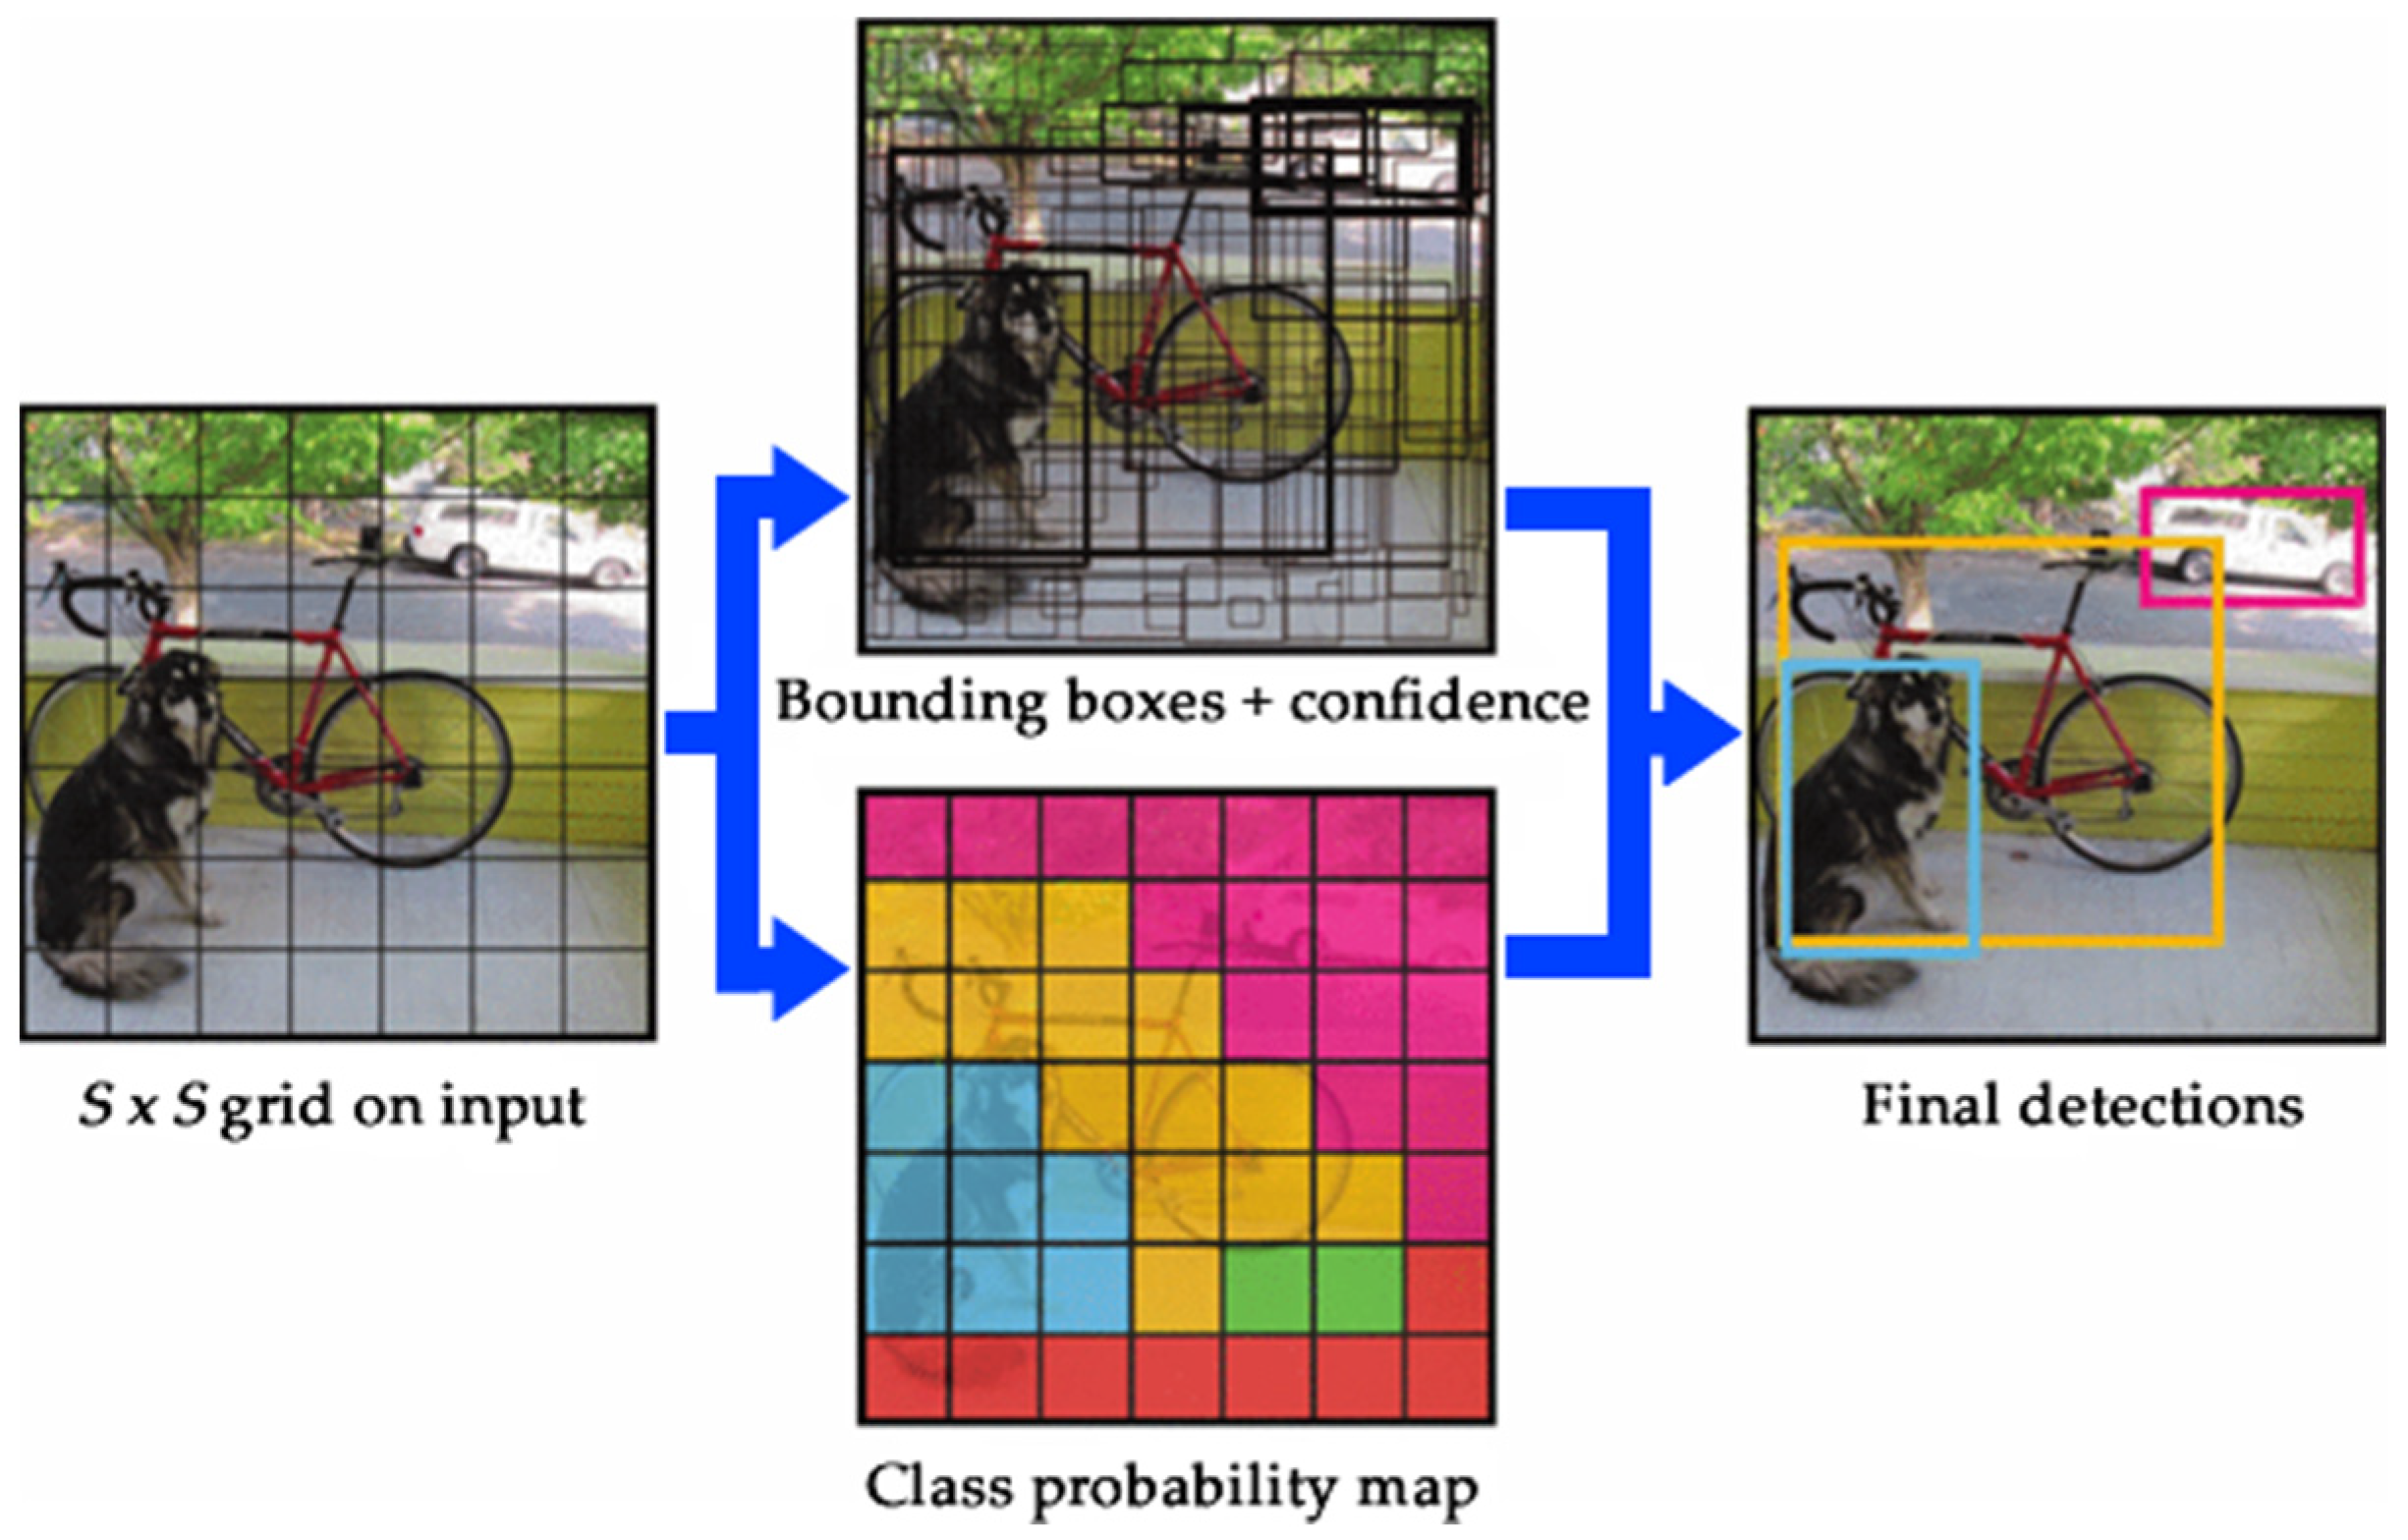
2.3. The YOLO (You Only Look Once) Algorithm

Object detection systems modify classifiers to identify objects by evaluating locations and scales within test images. Traditional systems, such as deformable parts models (DPM), utilize a sliding window for the classifier to traverse uniformly spaced locations across the image [46].
Modern approaches, such as Recursive Convolutional Neural Networks (R-CNNs), employ region analysis methods to generate potential bounding boxes, followed by classification and post-processing to refine the detected boxes, eliminating duplicates and re-labeling them based on detected objects. However, since it is a recursive process, the result of a previous step is used as input for the next step until the desired objective is achieved. In this way, this process can be slow and difficult to optimize [47].
The You Only Look Once (YOLO) algorithm redefines object detection as a single regression problem, obtaining the bounding box coordinates directly from the input image pixels without the need for recursive steps. YOLO uses a single CNN to predict multiple bounding boxes and class probabilities simultaneously, streamlining the detection process. Training on full images, YOLO optimizes detection performance directly [1,28,29].
YOLO integrates all object detection components into a unified neural network. It utilizes features from the entire image to predict each bounding box, operating globally across the entire image and all contained objects [28]. This fact enables YOLO to process end-to-end inputs at real-time speeds while maintaining high accuracy.
The algorithm splits the input image into an S × S grid, as presented in Figure 5. Each grid cell, if containing the center of an object, becomes responsible for representing that object. Each cell has information about its B B bounding boxes and its corresponding confidence scores, which indicates the model’s certainty that a box contains an object and the accuracy of the bounding box itself. Cells without objects should have zero confidence scores, whereas cells with objects should have confidence scores equivalent to the intersection over union (IOU) between predicted and ground truth boxes. IOU is calculated using the Jaccard index, as shown by Equation (2). Confidence score is formally defined by Equation (3) [28].
I O U = A B A B
Confidence = Pr O b j e c t I O U p r e d i c t e d g . t r u t h
Each bounding box has five parameters of prediction: x , y , w , h , and its confidence score. The x , y coordinates represent the box center, while w and h represent, respectively, width and height relative to the entire image. Additionally, each grid cell has associated a C conditional class probability, conditioned on the grid cell containing the object. The conditional class probability C is represented by Equation (4) [28]. Regardless of the number of bounding boxes B B , only one set of class probabilities is predicted per grid cell.
C = P r C l a s s i | O b j e c t

3. Materials and Methods

3.1. Materials

3.1.1. Forensic Equipment and Techniques for Creating Datasets
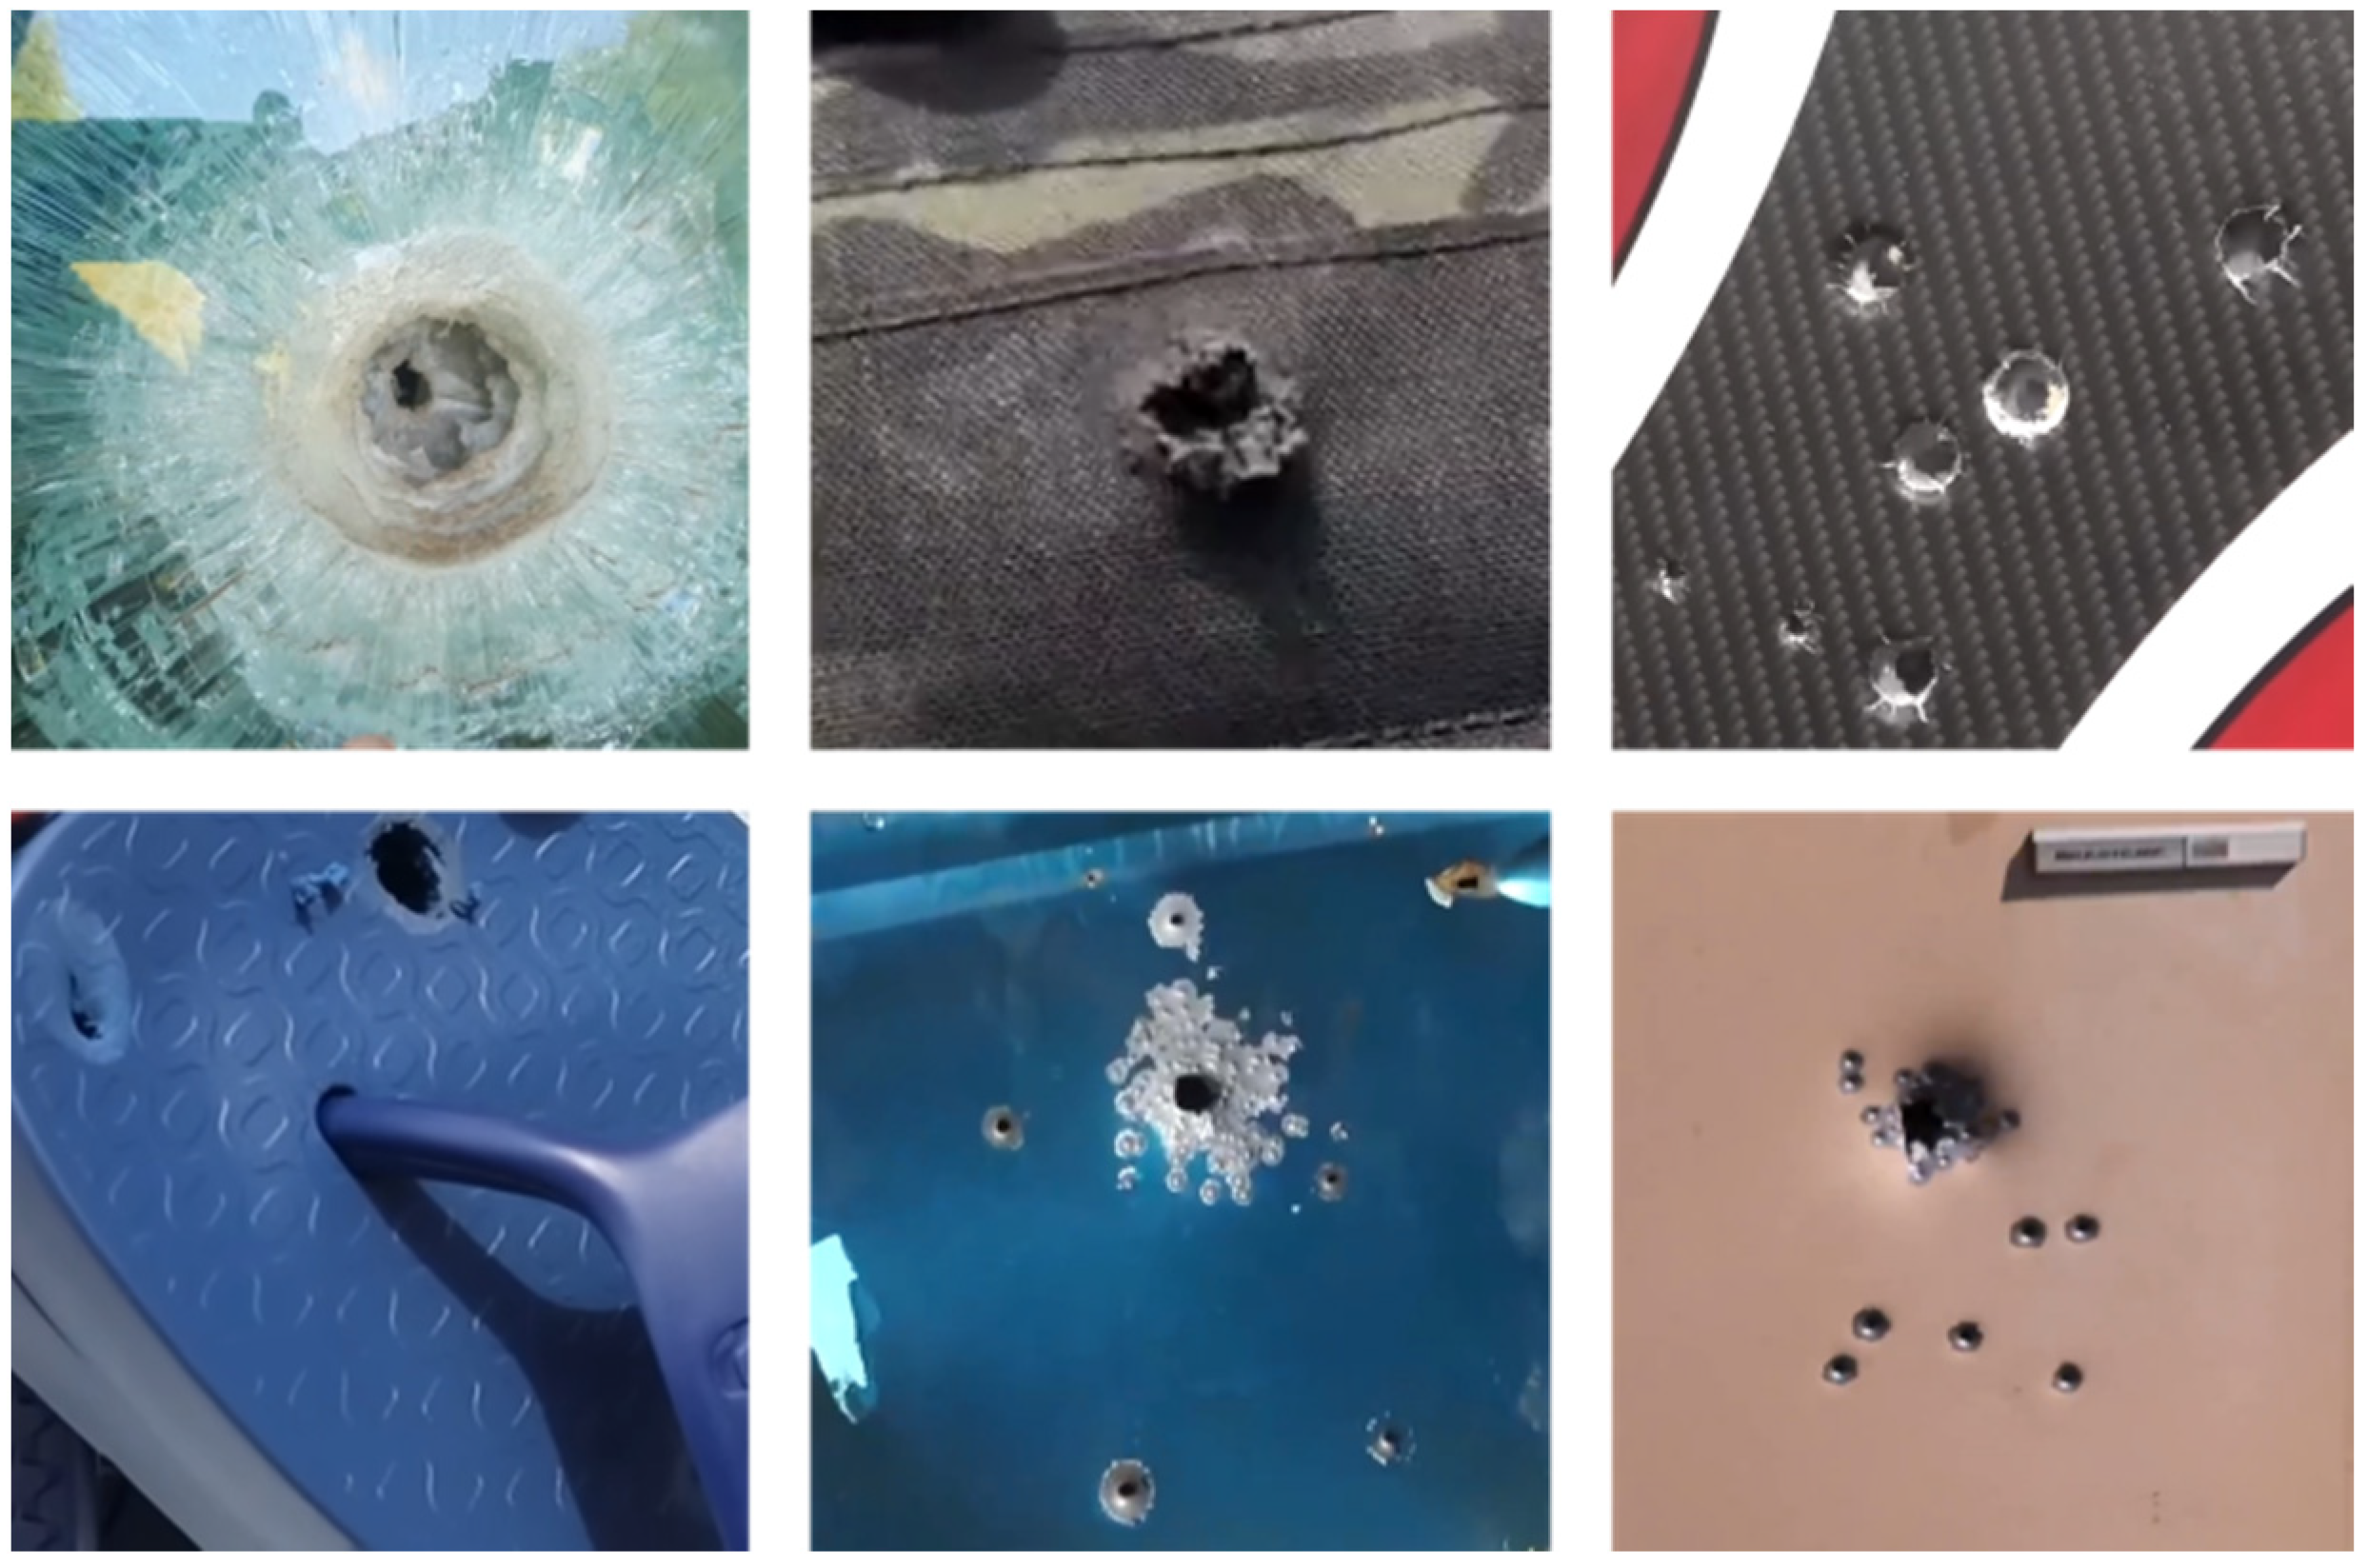
When a forensic analysis method is performed based on visual evidence, the way images are taken at the crime scene can make the method either non-destructive or destructive. The equipment used by the forensic expert is also relevant. Therefore, this subsection focuses on how visual evidence must be collected. Forensic equipment and techniques are described here.
Regarding the equipment, in addition to wearing gloves, shoe covers, masks, caps, coats, overalls, etc., it is necessary to use a camera with at least 35 mm film. It is also necessary to choose a fixed focal length lens that is twice your camera’s normal focal length. In order to control the depth of field, you must select either Manual Mode or Aperture Priority and set the ISO option to 400 ISO. To the end of capturing the image in its correct color, choose the proper White Balance. Select an f/stop setting of f/16 or f/22. To the end of avoiding the camera from vibrating, use a cable or electronic release and a tripod.
You should store the images in the RAW uncompressed file format (minimum of 24 bits for color images and 8 bits for grayscale images). The minimum resolution for an image is 1000 ppi when taking into consideration a calibration to the actual size (1:1). The highest resolution can be achieved by filling the viewfinder with the investigated object and scaling in landscape orientation. The maximum area of capture must be calculated by dividing the amount of horizontal and vertical pixels on the camera sensor by 1000.
Regarding techniques, for each crime scene, it is necessary to start collecting visual evidence by strictly following the guidelines for carrying out non-destructive testing, as described in Section 2.1.4. It is important because collecting visual evidence is only considered a non-destructive activity if the forensic expert is careful when taking photographs without disturbing or destroying any evidence at the crime scene. After that, also for each crime scene, four sets of images are normally taken, as described below.
The first set of images must show the locations of the bullet holes in the scene and how each bullet hole relates to its surroundings, which may include other bullet holes, items of evidence, or objects in its vicinity. In this study, there is a certain alignment between this first set of images and the dataset (1) due to some similarities between them. For example, in Dataset (1), each mid-view photograph shows bullet holes and their neighborhood.
The second set of images must show each bullet hole itself. In other words, this second set must only consist of close-up view photographs. A close-up view photograph must clearly show the close-up of the bullet hole to make its details more apparent. In this study, there is a certain alignment between Dataset (2) and the second set of images due to some similarities between them. For example, Dataset (2) is comprised of many close-up view photographs of single holes, marks, or stains caused by bullets or other sources. Furthermore, some images in Dataset (2) show some similarities with the first set of images. For example, Dataset (2) is also composed of other images placed between close-up view and mid-view photographs.
The images for composing these two datasets must be obtained at the beginning of the investigation at the crime scene. This must occur before other forensic experts begin collecting physical evidence. These two image datasets are very important because they are the only datasets that can ensure that testing is non-destructive. Regarding the third and fourth datasets, the images for composing these two datasets must only be taken after the other forensic experts have investigated all the evidence at the crime scene.
The third set of images should also show the positions of the bullet holes at the crime scene and how each bullet hole relates to its vicinity. It must also only consist of mid-range view photographs. The difference between the third set of images and the first one is the presence of numbering devices. It is important that the bullet holes are individually numbered. This numbering clearly differentiates one bullet hole from another and indicates the labeled position of each bullet hole in relation to other parts of the immediate area of the crime scene.
The fourth set of images must also show each bullet hole itself. It must also only consist of close-up view photographs. The difference between the fourth set of images and the second one is the presence of a numbering device and a scale. The numbering device identifies the bullet hole, and the scale shows its relative size in the photograph. The scale must be placed on the same plane as the surface containing the bullet hole. This makes the scale useful for measurements and prevents the forensic expert from introducing distortion into the photograph [9,48,49,50].

3.1.2. Datasets

It is expected to call more attention to information related to ensuring that tests must be performed in a truly non-destructive manner than to technical details of ballistics. It is very important that forensic experts have prior knowledge of the characteristics that must be present in the images they intend to take at the crime scene. This prevents forensic experts from returning to the crime scene unnecessarily.
To this end, it would also be very important for forensic experts to have visual references of the desired image characteristics for the datasets. There should be a dataset composed of examples of images that may favor forensic analysis and another dataset composed of examples of images that may disfavor forensic analysis. Therefore, this paper performs experiments based on two sets of images taken under different conditions, Datasets (1) and (2).
Dataset (1) is composed of images taken under ideal conditions, while Dataset (2) is composed of images taken under non-ideal conditions. The decision to perform experiments based on these two sets of images taken under different conditions was inspired by the scientific literature. There are several articles recently published that describe different uses of datasets under ideal and non-ideal conditions, such as [51,52,53,54]. For example, a discussion of AI-based object detection performed under ideal conditions (e.g., stable weather or adequate lighting) and non-ideal conditions (e.g., adverse weather or insufficient lighting) is described in [51].
Some advantages of using these two datasets are the possibility of (1) presenting a dataset composed of examples of images that favor forensic analysis and another dataset composed of examples of images unfavorable to forensic analysis; (2) carrying out experiments based on two different scenarios related to NDT: controlled and non-controlled; and (3) finding out results related to both scenarios. The controlled scenario represents the ideal conditions achieved by forensic experts as they strictly adhere to forensic guidelines when taking photographs at crime scenes. The non-controlled scenario represents the non-ideal conditions witnessed by forensic experts as they neglect forensic guidelines when taking photographs at crime scenes.
With the proposed experiments, it is expected to find out what results some CNNs would achieve when trying to detect bullet holes on these two datasets. It also helps the researchers to focus their attention on the desired image characteristics, such as uniformity, homogeneity, standardization, quality, resolution, coloration, stains, textures, dirt, lighting conditions, angle of penetration of the projectile into the surface, distance and angle of image acquisition, etc.
With this intention, Dataset (1) presents images obtained under controlled conditions, with little variation in the angle of penetration of the projectiles, and in the image capture distance. On the other hand, Dataset (2) presents images obtained under non-controlled conditions, that is, non-uniform, non-homogeneous, non-standardized images, of low quality and resolution, with varied colors, with different types of surfaces, with variations in the penetration angle of the projectiles, with varied lighting conditions, and images obtained by different sensors and configurations, as well as positioned at different distances from the depicted surfaces.
In this sense, the experiments performed in this study were based on Datasets (1) and (2) to find out if it is possible to detect bullet holes in different situations using images with different characteristics. Furthermore, it would be desirable to have at least one of the two datasets as a visual reference for forensic experts on what the set of images (dataset) should or should not look like to be obtained at a crime scene.
Datasets (1) and (2) are also used to contribute to the generation of results related to the detection of bullet holes that can serve as references in NDT. These reference results can guide forensic experts on how to obtain one-time images that will help testing achieve high accuracy and precision.
A bullet hole image dataset tends to be very small and limited since it is difficult to find a set of images taken under ideal conditions that meet the characteristics mentioned. In addition, each crime scene usually has a small number of bullet holes, normally caused by the firing of small firearms such as pistols and revolvers. Consequently, it is expected that this limited dataset tends to contribute to inflated results related to metrics such as accuracy and precision. Even so, such results would be very important for NDT because they would be a reference for other studies to analyze whether their results are close to the results obtained based on the use of this dataset, which is a reference.
On the other hand, a dataset tends to be large and diverse when used as a visual reference for what a set of images should not look like to be taken at a crime scene to favor forensic analysis. This dataset is usually large and diverse because it is easy to find a set of images taken under non-ideal conditions that meet the characteristics mentioned above. Consequently, it is expected that this large and diverse dataset will tend to contribute to results presenting low values in terms of accuracy and precision. Even so, such results would be very important for NDT because they would be a reference for other studies to analyze whether their results overcome the results obtained based on the use of this dataset, which is also a reference.
For NDT, the best terminal ballistics method or the best AI-based method is not important if it can be related to an activity that has a chance of being destructive. For NDT, the most important thing is that the method used ensures truly non-destructive and useful testing. Therefore, the focus of this manuscript is on showing how to ensure truly non-destructive testing (related to the context of Forensic Science) rather than on showing which is the best AI method to be applied to solve a terminal ballistics problem.

3.2. Methods

Figure 6 shows a flowchart that summarizes the non-destructive testing performed in this paper by artificial intelligence for Forensic Science. The content of Figure 6 corresponds to the first part of the same testing presented in Figure 1. In the flowchart, it is possible to identify the two main phases of the methodology: evidence collection and bullet hole detection.

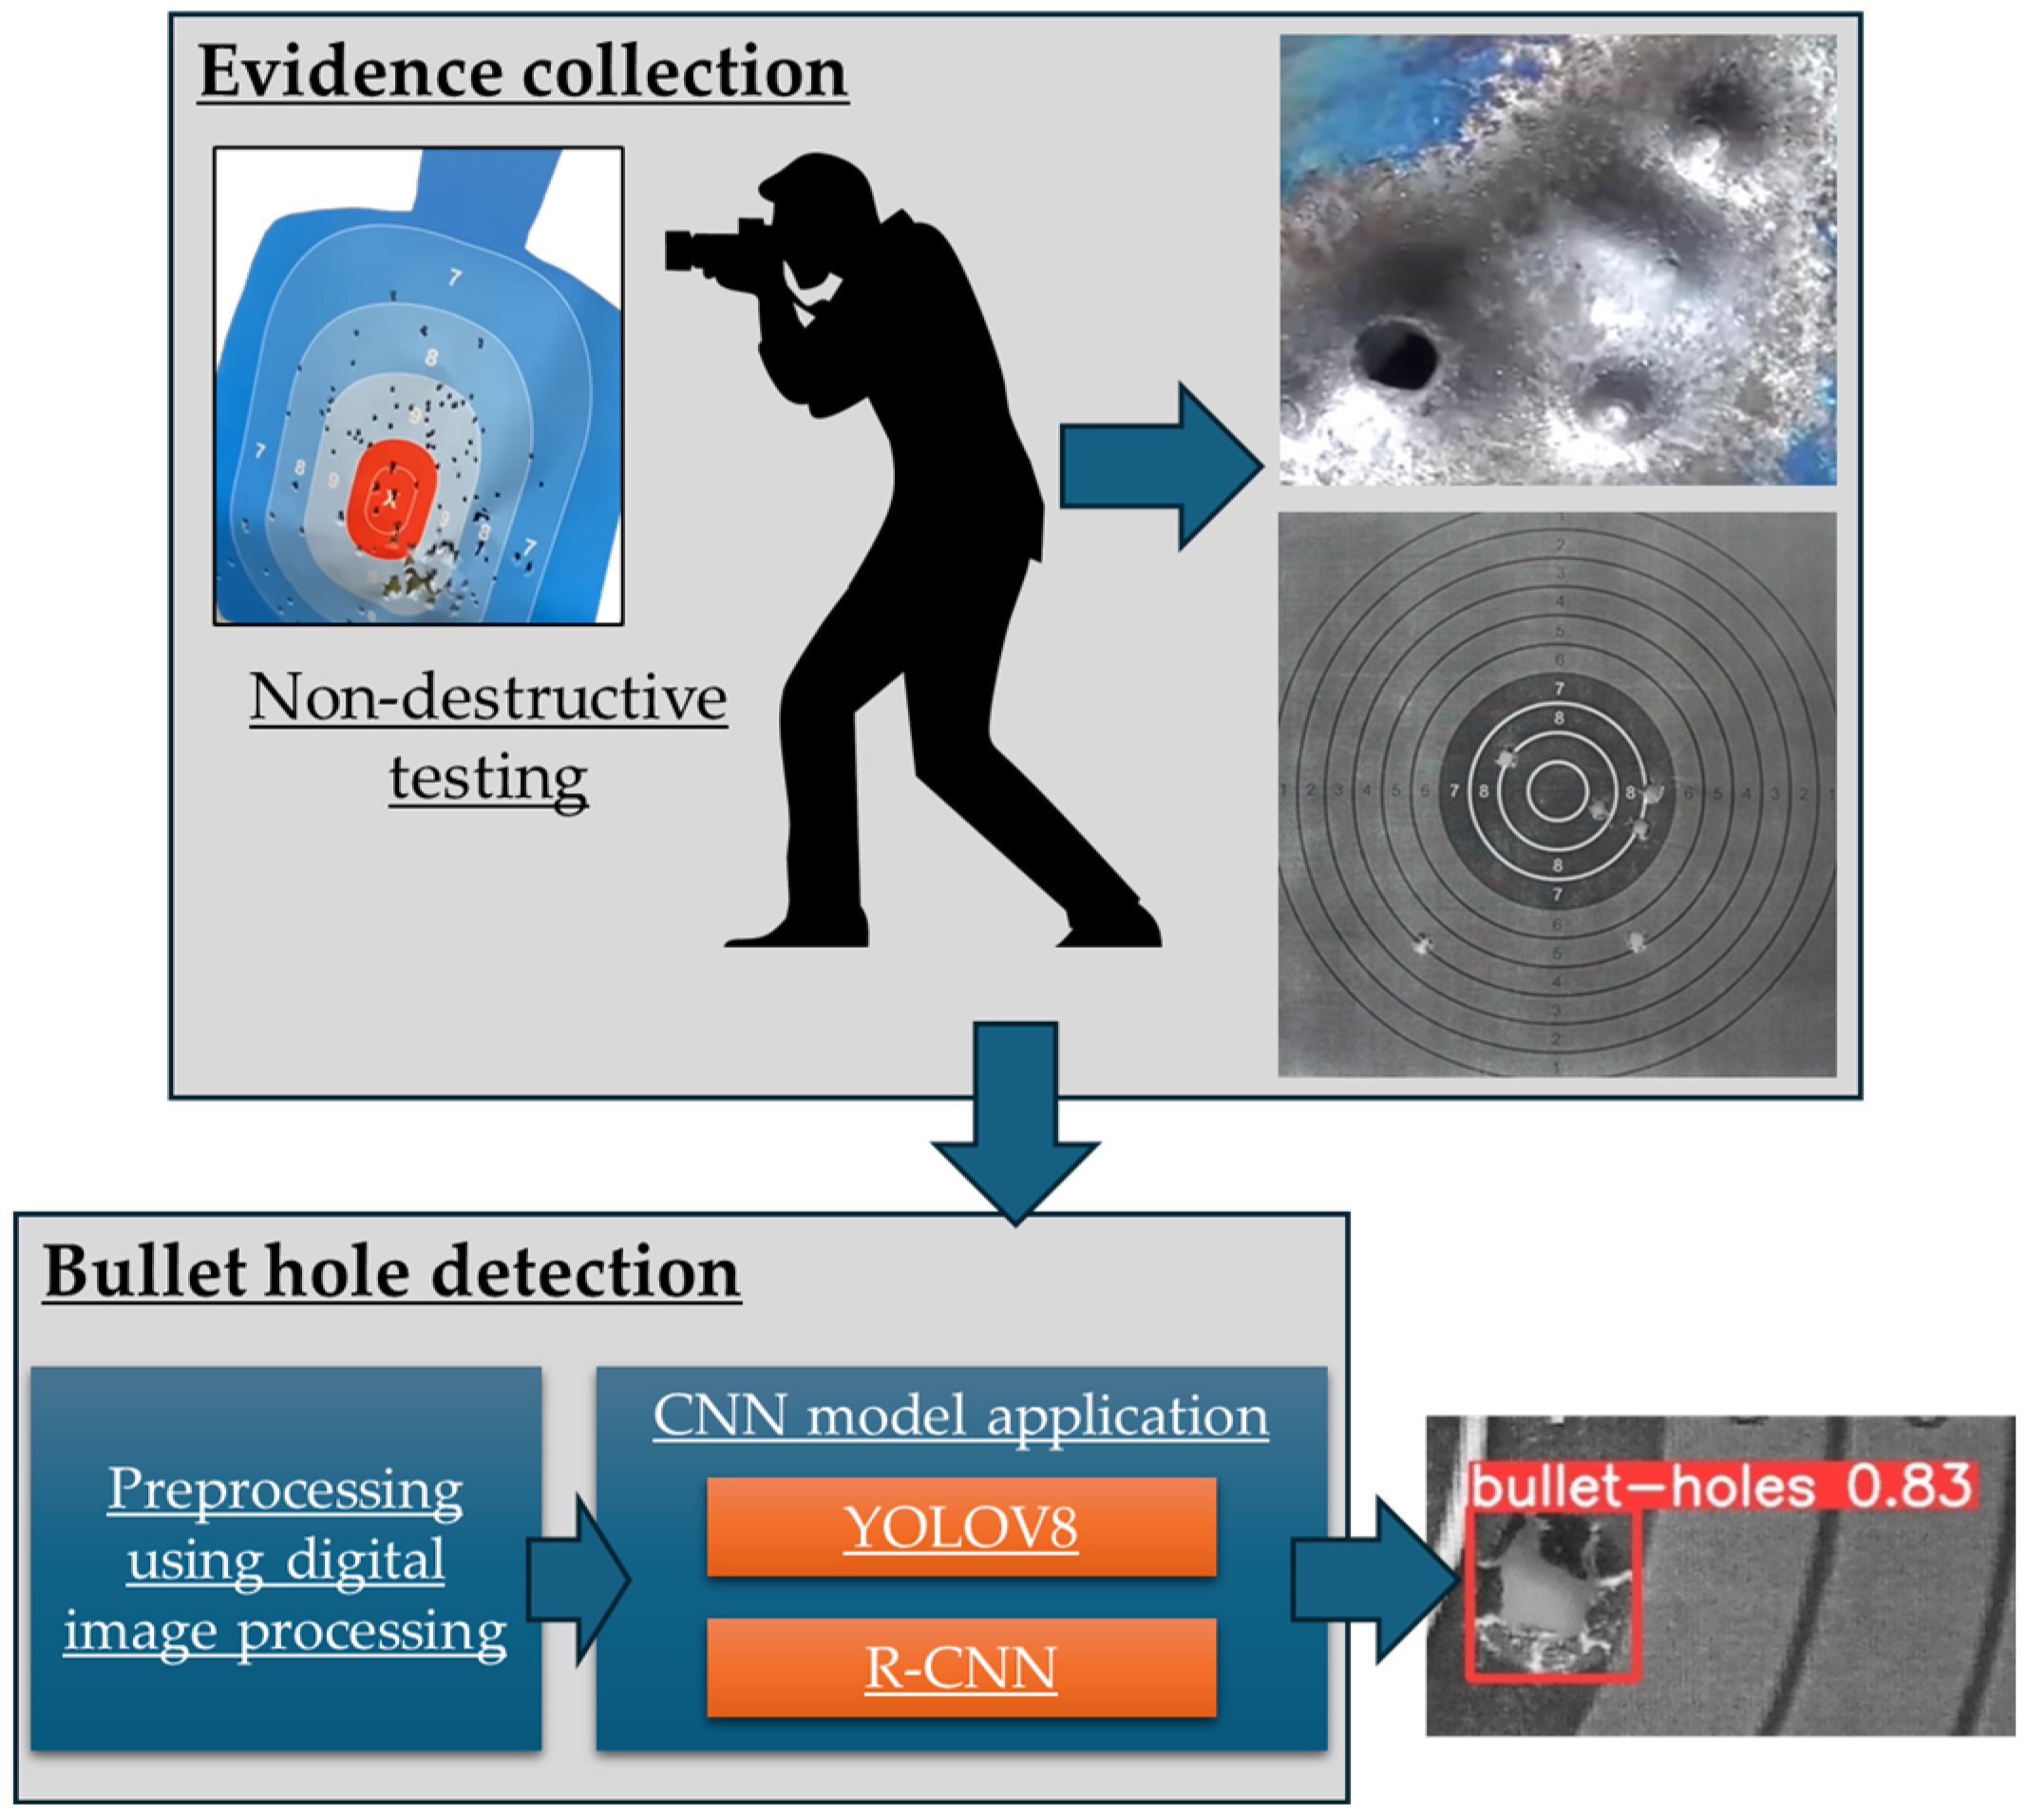
3.2.1. Evidence Collection

The first phase shown by the flowchart in Figure 6 represents how evidence must be collected to allow the scientific community to consider the testing truly non-destructive. In other words, this paper presents the ideal way to carry out the first phase of a forensic investigation (see Section 2.1.4). However, in this study, datasets that already consisted of images of bullet holes were used. Therefore, it was not necessary for us to collect evidence directly at crime scenes. Furthermore, for this study, performing the evidence-collection phase is of minor importance because the images in the datasets used are adequate to achieve this paper’s objectives.

3.2.2. Bullet Hole Detection

Bullet hole detection was performed on two different datasets in this study. In total 50 images of shooting targets taken under controlled conditions compose Dataset (1), as shown in Figure 7. In Dataset (1), there are patterns and regularities in the images. In total, 184 images taken under non-controlled conditions comprise Dataset (2); among them are 138 images showing bullet holes, as shown in Figure 8. In Dataset (2), images show a wide range of surfaces, environments, and lighting conditions.
Image Fetch and Preprocessing Using Digital Image Processing
At the beginning of this phase, images were fetched from each dataset (Dataset (1) and Dataset (2)). Then, all images from both datasets were automatically or manually cropped using the web tool Bulk Image Crop with an aspect ratio of 1:1 achieving a consistent size of 640 × 640 pixels. In this study, the images were resized to 640 × 640 pixels in order to achieve a viable cost–benefit balance involving processing time and demand for computational resources. This was necessary for this study because it had certain constraints on funding and computational resources to perform the current research. When the main focus of the research is terminal ballistic tests, the ideal is not to change the original dimensions of the images so as not to influence the results. However, this study focuses on the important aspects to ensure testing is non-destructive. This study does not aim to present the best or most innovative method to solve a terminal ballistic problem. Therefore, although resizing images to 640 × 640 pixels is a limitation in this research, this is of minor importance for the presented study, as this limitation does not directly impact the aspects that are truly important for NDT.
After that, the sampling was carried out using the Roboflow2 tool, which provides image labeling tools for various machine learning models, such as YOLOV8 and R-CNN. Image labeling consists of defining samples and assigning them a label. Samples are the regions within an image that contain the desired object, e.g., a bullet hole. Figure 9 shows an example of how to define the bounding boxes for the bullet hole label, representing the bullet holes left by the shooter.
The entire labeling process was performed manually for both datasets. All images in Dataset (1) and 75% in Dataset (2) contain bullet holes, most of which were therefore labeled as bullet holes. The sampling is an important step before model training because a neural network can learn based on labeled samples during the process of training.
CNN Model Application
The next step was to train the models capable of detecting the labels defined in the previous step. For each dataset (Dataset (1) and Dataset (2)), two different models were trained: YOLOV8 and R-CNN, resulting in four scenarios. To train YOLOV8 or R-CNN models on the input data and to have a better analysis of the model’s accuracy, the method of separating data into training, validation, and test sets was used [33]. To this end, both datasets were divided as follows: 70% of their images were used for the training process, 20% of their images were used for the validation process, and 10% of their images were used for the test process. In other words, 70% of the data is used for parameter learning, while 20% is used for validation, where the error committed is used to define how the learnable parameters will have their values modified at each learning epoch. Additionally, 10% of the data is only used to estimate the generalization power of the model after training.
For R-CNN models, the following were used: (1) The R-101-FPN and X-101-32x8d-FPN backbones. (2) The max iterations hyperparameters (epochs) between 256, 512, 1024, and 2048. (3) The number of images per batch between 2 and 8. For YOLOV8 models, the following were used: (1) The nano, small, and medium backbones. (2) The hyperparameters of epochs between 256, 512, and 1024. (3) The “batch size” between 16 and 32. Each training process produces a file of weights as output. The file of weights is used by the neural network to detect the trained labels. Thus, the file corresponding to the weights used to detect the bullet holes was obtained. Other information about the training step, such as performance and accuracy metrics, will be presented and discussed in Section 4.
Having the CNN models trained, the next task was performed by invoking the YOLOV8 and R-CNN models with the weights to detect the bullet holes and storing the result containing the coordinates of the bounding boxes of detected objects and their respective confidence levels. As can be seen in Figure 10, there is a possibility of occurrence of the undesirable effect of multiple detections on the same object. To solve this problem, non-maximum suppression was performed, as explained in the next paragraph.
The non-maximum suppression algorithm [55] is often used in computer vision to resolve duplicates like the one found in Figure 10. Taking B B and S as sets of bounding box coordinates and their respective confidence scores and Nt as the overlap limit, the algorithm returns B B and S containing the filtered bounding boxes and their respective confidence scores. Summarizing, the algorithm traverses in bi in B B , descending order of their respective confidence scores, and tests whether its intersection over the union with the remaining bi+1 in B B is greater than the limit Nt, eliminating bi+1 and its confidence score if applicable. The intersection in or of the union applied to two-dimensional objects is given by the Jaccard index [56], which is the ratio between the union of their areas and their intersection (see Equation (2)). This index indicates how much the two objects overlap and was set at Nt = 0.5.
The bullet holes detected are represented by the x 1 , y 1 , x 2 , and y 2 coordinates of their northwest and southeast anchors. The equation of the center of the line between these two points was used to determine the center of the bullet holes, with their radii being set at a constant value of 25 pixels. In other words, the position of the center of the bullet hole is calculated by Equation (5), taking into consideration the center of a straight line in the plane and applied to the straight line that connects the northwest x 1 and y 1 and southeast x 2 and y 2 anchors of the object’s bounding box identified.
f x 1 , y 1 , x 2 , y 2 = x 1 + x 2 2 , y 1 + y 2 2

3.2.3. Border Between the Parts of This Study

The first part of this study focuses on guidelines for preserving evidence at the crime scene to ensure that the testing is truly non-destructive. Furthermore, the first part of this study conducts bullet hole detection experiments. These experiments are carried out based on two scenarios related to NDT. Both the datasets used in the experiments and their results are intended to serve as references in NDT. The datasets are composed of close-up or mid-range view photographs without any addition of external elements such as scales or numbering devices in order to maintain consistency with NDT practices. Paying close attention to the first part of this study and adhering to its guidelines is critical in NDT.
The second part of this study focuses on comparing bullet hole sizes. The comparison occurs between two images at a time, namely (1) one that comprises the fourth set of images and (2) a reference image that shows the surface of a specific material (e.g., metal, glass, wood, etc.) containing a hole caused by a bullet of previously known caliber. The comparison must take into account the material the target surface is made of and the type of ammunition, as these factors can cause small variations in the size of the holes for the same caliber. The images compared must be close-up view photographs, each showing a bullet hole accompanied by a scale. The scale is used to measure, for example, the diameter of the bullet hole. Bullet holes with similar measurements in the compared photographs are more likely to belong to the same caliber. Validation of the comparisons can be performed based on the metrics Mann–Whitney U test [17,57,58,59] or Kruskal–Wallis H test [21,60,61,62,63].
Mann–Whitney U Test
Mann–Whitney U test is a non-parametric statistical test of the null hypothesis. It evaluates if the probability of X i being greater than Y i is different from the probability of Y i being greater than X i , i.e., P X i > Y i P Y i > X i . The values X i and Y i are randomly selected from two populations. Equation (6) expresses Mann–Whitney U test [17,57,58,59]. Equation (6) considers two sample groups ( X and Y ) and their respective samples i ( X i e Y i ), being 1 i n 1 and 1 i n 2 , respectively. In other words, the first sample group is composed of the samples X 1 , , X n 1 . The second sample group is composed of the samples Y 1 , , Y n 2 .
U 1 = n 1 n 2 + n 1 n 1 + 1 2 R 1 , U 2 = n 1 n 2 + n 2 n 2 + 1 2 R 2
For Equation (6), the sums of the ranks in the first and second sample groups are represented by R 1 and R 2 , respectively. All samples from both groups must be ranked. Rank 1 represents the lowest value. Rank n 1 + n 2 represents the highest value.
The Mann–Whitney U test can be extended to work with more than two groups. In this case, the test is known as the Kruskal–Wallis H test [21,60,61,62,63].
Kruskal–Wallis H Test
The Kruskal–Wallis H test is a non-parametric statistical test that assesses whether samples originate from the same distribution. It compares two or more independent samples. Samples can be the same or different sizes. All data from all groups are ranked together, and the sum of the ranks is obtained for each sample. In other words, the H test ignores group membership when ranking data from 1 to N . Equation (7) expresses the Kruskal–Wallis H test [21,60,61,62,63].
H = 12 N N + 1 i = 1 C R i 2 n i 3 N + 1
For Equation (7), C is the number of samples; n i is the number of observations in the ith sample; N = n i is the number of observations in all samples combined; and R i is the sum of the ranks in the ith sample.
The Kruskal–Wallis H test is also known as one-way ANOVA on ranks.

4. Results and Discussion

One of the ways to measure the performance of a detection model is by using a confusion matrix of their labels [64]. A confusion matrix consists of the following components: true positive (TP), when the detected value is equal to its true positive value; true negative (TN) when the projected value is equal to the actual value, but it is negative; false positive (FP), when the anticipated value was incorrectly predicted as positive, which is actually negative; and false negative (FN), when the anticipated value is incorrectly predicted as negative when in reality its value is positive.
Figure 11 and Figure 12 present the confusion matrices for the labeled bullet holes, taking into consideration the training datasets. The confusion matrices were generated by the training processes of YOLOV8 and R-CNN, respectively. The columns represent the true values, thereby making the label the true positive and the background the true negative. The rows represent the predicted values, thereby making the label the true predicted and the background the false predicted.
The Cartesian product of the predicted true with the true value results in the true positive. According to Figure 11a and Figure 12a, the trained models showed a true positive closer to 100% success rate for Dataset (1). Consequently, this implies lower values of true negative, false positive, and false negative. These results are achieved by the models’ self-assessment, which is based on the confidence scores implemented internally. On the other hand, according to Figure 11b and Figure 12b, it is observed that the true positives are higher values than the errors obtained. However, the number of false positives obtained using the R-CNN model suggests difficulty in some cases in differentiating background from bullet holes.
Given the confusion matrix, accuracy, precision, recall, and F1 score can be calculated [64]. Accuracy, represented by Equation (8), indicates the result’s efficiency. It can be useful in establishing the eligibility of the evaluated model. Equation (9) establishes the precision, which measures the relevancy of results. Recall quantifies truly relevant results and is defined by Equation (10). The F1 score enables evaluating the quality of a classification model, especially when the classes are imbalanced. The F1 score is defined by Equation (11).
A c c u r a c y = T P + T N T P + F P + F N + T N
P r e c i s i o n = T P T P + F P
R e c a l l = T P T P + F N
F 1   s c o r e = T P T P + 1 2 F P + F N
Table 1 presents results achieved based on the use of the metrics accuracy, precision, recall, and F1 score. The results were obtained for both datasets using the YOLOV8 and R-CNN network models. Table 1 presents the results calculated for training, validation, and test sets, as well as a general result considering all sets. The YOLOV8 model achieved 0.993 and 0.759 accuracy values, respectively, for Dataset (1) and (2). The R-CNN model achieved 1.0 and 0.651 accuracy values, respectively, for Dataset (1) and (2). It can be seen that the YOLOV8 model achieved better results for Dataset (2) when compared to the R-CNN model, which achieved better results for the data from Dataset (1).
Table 2 presents the accuracy and precision values of each model tested, representing the correct predictions on the used datasets, compared to values obtained by other studies.

5. Conclusions

This paper addresses the use of artificial intelligence to detect bullet holes in surfaces targeted by gunfire as non-destructive testing. For this purpose, the YOLOV8 and R-CNN convolutional neural networks were applied to train image recognition models capable of detecting bullet holes.
This study performed bullet hole detection based on two datasets created under two different scenarios: controlled and non-controlled, Datasets (1) and (2), respectively. When images taken under ideal conditions are used, the detection process tends to achieve significant results. When images taken under non-ideal conditions are used, the detection process tends to achieve moderate results due to the high complexity of the images. This fact reinforces the need to take images under controlled conditions.
It was noticed that the experiments performed achieved accuracy values of 99.3% and 75.9%, respectively, for Dataset (1) and (2) when using the YOLOV8 model; 100% and 65.1%, respectively, for Dataset (1) and (2) when using the R-CNN model. Therefore, the achieved results related to Dataset (1) align well with the results presented by other AI-based tools and the scientific community, such as [65,66,67,68].
It is noteworthy that the high accuracy achieved by bullet hole detections on Dataset (1) suggests that bullet hole evidence was well preserved, and its photographs were taken adequately in most cases.
It is important to note that comparative testing of bullet holes can only be considered non-destructive if the bullet hole and all other evidence have been adequately preserved at the crime scene. In this way, if the forensic expert destroys other evidence while collecting the bullet hole evidence, then the comparative testing of bullet holes is destructive. Therefore, a high level of accuracy in detecting bullet holes does not necessarily mean that it has non-destructive testing, even if the collection of bullet hole evidence itself was properly performed.
Furthermore, the more destructive the testing, the greater the possibility that the crime will not be solved. Therefore, the application of non-destructive testing in Forensic Science (including the field of Forensic Engineering) implies that crimes can be solved correctly and, consequently, justice can be served more often.
In the future, studies should investigate other image preprocessing strategies and check whether they are capable of improving the learning conditions of the models used to detect bullet holes. A future study will describe the second part of the comparative testing of ballistics presented in Figure 1.
This study provides important guidelines that can be applied to a wide range of applications in Forensic Science. Therefore, it is expected that the guidelines described in this study will act as a reference for performing investigations that apply artificial intelligence to improve tests in Forensic Science. It is also expected that this study will contribute to helping (1) the police indict people for their respective crimes committed and (2) the justice system to apply fair sentences to criminals and identify innocent people. In other words, it is expected that artificial intelligence-based, non-destructive testing applied to Forensic Science will provide guidelines to help solve crimes and bring justice around the world.

Author Contributions

Conceptualization, G.P.C. and M.A.D.; methodology, G.P.C., T.d.S.D. and M.A.D.; software, T.d.S.D.; validation, W.C., R.G.N. and E.A.d.S.; formal analysis, F.C.C. and R.J.d.S.; investigation, G.P.C., H.P.C. and M.A.D.; resources, E.A.d.S. and R.J.d.S.; data curation, W.C., R.G.N. and F.C.C.; writing—original draft preparation, G.P.C., H.P.C. and M.A.D.; writing—review and editing, G.P.C., H.P.C. and M.A.D.; visualization, G.P.C. and M.A.D.; supervision, G.P.C. and M.A.D.; project administration, G.P.C. and M.A.D. All authors have read and agreed to the published version of the manuscript.

Funding

This research received no external funding.

Data Availability Statement

The raw data supporting the conclusions of this article will be made available by the authors on request.

Acknowledgments

We would like to thank the student Osman A. Issa, who studied the topic of this paper in his undergraduate thesis (Issa, O. A. Automação de Contagem de Pontos de Tiro Esportivo em Ambientes Fechados: uma abordagem utilizando redes neurais convolucionais. Universidade Estadual de Londrina, 2023).

Conflicts of Interest

The authors declare no conflicts of interest.

References

  1. Liu, C.; An, C.; Yang, Y. Wind Turbine Surface Defect Detection Method Based on YOLOv5s-L. NDT 2023, 1, 46–57. [Google Scholar] [CrossRef]
  2. Armeni, A.; Loizos, A. Reporting the Bearing Capacity of Airfield Pavements Using PCR Index. NDT 2024, 2, 16–31. [Google Scholar] [CrossRef]
  3. Boldrin, P.; Fornasari, G.; Rizzo, E. Review of Ground Penetrating Radar Applications for Bridge Infrastructures. NDT 2024, 2, 53–75. [Google Scholar] [CrossRef]
  4. Siegel, J.A.; Mirakovits, K. Forensic Science: The Basics, 4th ed.; CRC Press: Boca Raton, FL, USA, 2022; ISBN 9780367251499. [Google Scholar]
  5. Morgan, R.M. Conceptualising Forensic Science and Forensic Reconstruction. Part I: A Conceptual Model. Sci. Justice 2017, 57, 455–459. [Google Scholar] [CrossRef] [PubMed]
  6. United Nations Office on Drugs. Crime Scene and Physical Evidence Awareness for Non-Forensic Personnel; United Nations Publications: New York, NY, USA, 2009. [Google Scholar]
  7. Pfefferli, P. Forensic Evidence Field Guide: A Collection of Best Practices; Academic Press: Cambridge, MA, USA, 2015; ISBN 978-0124201989. [Google Scholar]
  8. Kaur, A.; Jamal, F.; Shikha; Ramesh, A.; Sojan, A.; Dileep, D. Collection, Preservation, and Packaging: Forensic Evidence Management. In Crime Scene Management Within Forensic Science; Springer: Singapore, 2021; pp. 51–105. [Google Scholar]
  9. F.B.I. Laboratory Division. Handbook of Forensic Services; US Department of Justice, Federal Bureau of Investigation: Washington, DC, USA, 2019. [Google Scholar]
  10. Federal Bureau of Investigation; Fish, J. FBI Handbook of Crime Scene Forensics: The Authoritative Guide to Navigating Crime Scenes; Fish, J., Ed.; Simon and Schuster: Washington, DC, USA, 2015; ISBN 9781632203229. [Google Scholar]
  11. Saferstein, R. Forensic Science: From the Crime Scene to the Crime Lab; Pearson Education Inc.: Hoboken, NJ, USA, 2016; ISBN 9780131391871. [Google Scholar]
  12. Silva-Rivera, U.S.; Zúñiga-Avilés, L.A.; Vilchis-González, A.H.; Tamayo-Meza, P.A.; Wong-Angel, W.D. Internal Ballistics of Polygonal and Grooved Barrels: A Comparative Study. Sci. Prog. 2021, 104, 003685042110169. [Google Scholar] [CrossRef]
  13. Kaur, G.; Mukherjee, D.; Moza, B. A Comprehensive Review of Wound Ballistics: Mechanisms, Effects, and Advancements. Int. J. Med. Toxicol. Leg. Med. 2023, 26, 189–196. [Google Scholar] [CrossRef]
  14. Berryman, H.E.; Smith, O.C.; Symes, S.A. Diameter of Cranial Gunshot Wounds as a Function of Bullet Caliber. J. Forensic Sci. 1995, 40, 751–754. [Google Scholar] [CrossRef]
  15. Ross, A.H. Caliber Estimation from Cranial Entrance Defect Measurements. J. Forensic Sci. 1996, 41, 629–633. [Google Scholar] [CrossRef]
  16. Matoso, R.I.; Freire, A.R.; Santos, L.S.D.M.; Daruge Junior, E.; Rossi, A.C.; Prado, F.B. Comparison of Gunshot Entrance Morphologies Caused by .40-Caliber Smith & Wesson, .380-Caliber, and 9-Mm Luger Bullets: A Finite Element Analysis Study. PLoS ONE 2014, 9, e111192. [Google Scholar] [CrossRef]
  17. Pircher, R.; Preiß, D.; Pollak, S.; Thierauf-Emberger, A.; Perdekamp, M.G.; Geisenberger, D. The Influence of the Bullet Shape on the Width of Abrasion Collars and the Size of Gunshot Entrance Holes. Int. J. Leg. Med. 2017, 131, 441–445. [Google Scholar] [CrossRef]
  18. Wang, J.Z. Determining Entrance-Exit Gunshot Holes on Skulls: A Real Time and In Situ Measurement Method. J. Forensic Pathol. 2018, 3, 113. [Google Scholar]
  19. Henwood, B.J.; Oost, T.S.; Fairgrieve, S.I. Bullet Caliber and Type Categorization from Gunshot Wounds in Sus Scrofa (Linnaeus) Long Bone. J. Forensic Sci. 2019, 64, 1139–1144. [Google Scholar] [CrossRef] [PubMed]
  20. Sharma, B.K.; Walia, M.; Kaur Purba, M.; Sharma, Y.; Ahmad Beig, M.T. Understanding the Influence of 0.22 Caliber Bullets on Different Types of Clothing Materials for The Estimation of Possible Caliber of Projectile. Int. J. Eng. Trends Technol. 2021, 69, 9–14. [Google Scholar] [CrossRef]
  21. Abd Malik, S.A.; Nordin, F.A.; Mohd Ali, S.F.; Lim Abdullah, A.F.; Chang, K.H. Distinctive Bullet Impact Holes by 9-Mm Caliber Projectile on Sheet Metal Surfaces. J. Forensic Sci. Med. 2022, 8, 97–103. [Google Scholar] [CrossRef]
  22. Geisenberger, D.; Große Perdekamp, M.; Pollak, S.; Thierauf-Emberger, A.; Thoma, V. Differing Sizes of Bullet Entrance Holes in Skin of the Anterior and Posterior Trunk. Int. J. Leg. Med. 2022, 136, 1597–1603. [Google Scholar] [CrossRef]
  23. De Luca, S.; Pérez de los Ríos, M. Assessment of Bullet Holes through the Analysis of Mushroom-Shaped Morphology in Synthetic Fibres: Analysis of Six Cases. Int. J. Leg. Med. 2021, 135, 885–892. [Google Scholar] [CrossRef]
  24. Nishshanka, B.; Shepherd, C.; Ariyarathna, R. AK Bullet (7.62 × 39 Mm) Holes on 1-mm Sheet Metal: A Forensic-related Study in Aid of Bullet Trajectory Reconstruction. J. Forensic Sci. 2021, 66, 1276–1284. [Google Scholar] [CrossRef]
  25. Butt, A.; Ali, A.; Ahmad, A.; Shehzad, M.; Malik, A. Forensic Investigation of Bullet Holes for Determining Distance from Glass Fracture Analysis. Austin J. Forensic Sci. Criminol. 2021, 8, 1085. [Google Scholar] [CrossRef]
  26. Eksinitkun, G.; Phungyimnoi, N.; Poogun, S. The Analysis of the Perforation of the Bullet 11 Mm. on the Metal Sheet. In Proceedings of the Journal of Physics: Conference Series, Songkhla, Thailand, 6–7 June 2019; Volume 1380, p. 012085. [Google Scholar] [CrossRef]
  27. Tiwari, N.; Harshey, A.; Das, T.; Abhyankar, S.; Yadav, V.K.; Nigam, K.; Anand, V.R.; Srivastava, A. Evidential Significance of Multiple Fracture Patterns on the Glass in Forensic Ballistics. Egypt. J. Forensic Sci. 2019, 9, 22. [Google Scholar] [CrossRef]
  28. Redmon, J.; Divvala, S.; Girshick, R.; Farhadi, A. You Only Look Once: Unified, Real-Time Object Detection. In Proceedings of the 2016 IEEE Conference on Computer Vision and Pattern Recognition (CVPR), Las Vegas, NE, USA, 26 June–1 July 2016; pp. 779–788. [Google Scholar]
  29. Naddaf-Sh, A.-M.; Baburao, V.S.; Zargarzadeh, H. Automated Weld Defect Detection in Industrial Ultrasonic B-Scan Images Using Deep Learning. NDT 2024, 2, 108–127. [Google Scholar] [CrossRef]
  30. Moreno, E.; Giacchetta, R.; Gonzalez, R.; Sanchez, D.; Sanchez-Sobrado, O.; Torre-Poza, A.; Cosarinsky, G.; Coelho, W. Ultrasonic Non-Contact Air-Coupled Technique for the Assessment of Composite Sandwich Plates Using Antisymmetric Lamb Waves. NDT 2023, 1, 58–73. [Google Scholar] [CrossRef]
  31. Cardim, G.P.; Dias, M.A.; Noguti, R.H.; De Best, R.; da Silva, E.A. Mathematical Morphology Applied to Automation of Indoor Shooting Ranges. Int. J. Appl. Math. (Sofia) 2014, 27, 549–566. [Google Scholar] [CrossRef]
  32. Kelleher, J.D. Deep Learning; The MIT Press Essential Knowledge Series; MIT Press: Cambridge, MA, USA, 2019; ISBN 9780262537551. [Google Scholar]
  33. Shinde, P.P.; Shah, S. A Review of Machine Learning and Deep Learning Applications. In Proceedings of the 2018 Fourth International Conference on Computing Communication Control and Automation (ICCUBEA), Pune, India, 16–18 August 2018; pp. 1–6. [Google Scholar]
  34. Russell, S.J.; Norvig, P. Artificial Intelligence: A Modern Approach, 3rd ed.; Pearson: Hoboken, NJ, USA, 2016. [Google Scholar]
  35. LeCun, Y.; Bengio, Y.; Hinton, G. Deep Learning. Nature 2015, 521, 436–444. [Google Scholar] [CrossRef]
  36. Fieres, J.; Schemmel, J.; Meier, K. Training Convolutional Networks of Threshold Neurons Suited for Low-Power Hardware Implementation. In Proceedings of the 2006 IEEE International Joint Conference on Neural Network Proceedings, Vancouver, BC, Canada, 16–21 July 2006; pp. 21–28. [Google Scholar]
  37. Arel, I.; Rose, D.C.; Karnowski, T.P. Deep Machine Learning—A New Frontier in Artificial Intelligence Research [Research Frontier]. IEEE Comput. Intell. Mag. 2010, 5, 13–18. [Google Scholar] [CrossRef]
  38. Tivive, F.H.C.; Bouzerdoum, A. Efficient Training Algorithms for a Class of Shunting Inhibitory Convolutional Neural Networks. IEEE Trans. Neural Netw. 2005, 16, 541–556. [Google Scholar] [CrossRef]
  39. Shahsavarani, S.; Ibarra-Castanedo, C.; Lopez, F.; Maldague, X.P.V. Deep Learning-Based Superpixel Texture Analysis for Crack Detection in Multi-Modal Infrastructure Images. NDT 2024, 2, 128–142. [Google Scholar] [CrossRef]
  40. Lee, K.B.; Cheon, S.; Kim, C.O. A Convolutional Neural Network for Fault Classification and Diagnosis in Semiconductor Manufacturing Processes. IEEE Trans. Semicond. Manuf. 2017, 30, 135–142. [Google Scholar] [CrossRef]
  41. Lecun, Y.; Bottou, L.; Bengio, Y.; Haffner, P. Gradient-Based Learning Applied to Document Recognition. Proc. IEEE 1998, 86, 2278–2324. [Google Scholar] [CrossRef]
  42. Lawrence, S.; Giles, C.L.; Tsoi, A.C.; Back, A.D. Face Recognition: A Convolutional Neural-Network Approach. IEEE Trans. Neural Netw. 1997, 8, 98–113. [Google Scholar] [CrossRef]
  43. Nebauer, C. Evaluation of Convolutional Neural Networks for Visual Recognition. IEEE Trans. Neural Netw. 1998, 9, 685–696. [Google Scholar] [CrossRef]
  44. Lin, H.; Shi, Z.; Zou, Z. Maritime Semantic Labeling of Optical Remote Sensing Images with Multi-Scale Fully Convolutional Network. Remote Sens. 2017, 9, 480. [Google Scholar] [CrossRef]
  45. Zhou, Y.; Wang, H.; Xu, F.; Jin, Y.-Q. Polarimetric SAR Image Classification Using Deep Convolutional Neural Networks. IEEE Geosci. Remote Sens. Lett. 2016, 13, 1935–1939. [Google Scholar] [CrossRef]
  46. Felzenszwalb, P.F.; Girshick, R.B.; McAllester, D.; Ramanan, D. Object Detection with Discriminatively Trained Part-Based Models. IEEE Trans. Pattern Anal. Mach. Intell. 2010, 32, 1627–1645. [Google Scholar] [CrossRef] [PubMed]
  47. Girshick, R.; Donahue, J.; Darrell, T.; Malik, J. Rich Feature Hierarchies for Accurate Object Detection and Semantic Segmentation. In Proceedings of the 2014 IEEE Conference on Computer Vision and Pattern Recognition, Columbus, OH, USA, 24–27 June 2014; pp. 580–587. [Google Scholar]
  48. Staggs, S. Crime Scene and Evidence Photography, 2nd ed.; Staggs Publishing: Wildomar, CA, USA, 2014; ISBN 978-1933373072. [Google Scholar]
  49. Weiss, S. Handbook of Forensic Photography; CRC Press: Boca Raton, FL, USA, 2022; ISBN 9781003047964. [Google Scholar]
  50. Barbaro, A.; Mishra, A. Manual of Crime Scene Investigation; CRC Press: Boca Raton, FL, USA, 2022; ISBN 9781003129554. [Google Scholar]
  51. Wei, C.; Wu, G.; Barth, M.J. Feature Corrective Transfer Learning: End-to-End Solutions to Object Detection in Non-Ideal Visual Conditions. In Proceedings of the 2024 IEEE/CVF Conference on Computer Vision and Pattern Recognition Workshops (CVPRW), Seattle, WA, USA, 17–21 June 2024; pp. 23–32. [Google Scholar]
  52. Etezadifar, M.; Karimi, H.; Aghdam, A.G.; Mahseredjian, J. Resilient Event Detection Algorithm for Non-Intrusive Load Monitoring Under Non-Ideal Conditions Using Reinforcement Learning. IEEE Trans. Ind. Appl. 2024, 60, 2085–2094. [Google Scholar] [CrossRef]
  53. Wang, H.; Zhu, M.; Fan, R.; Li, Y. Parametric Model-based Deinterleaving of Radar Signals with Non-ideal Observations via Maximum Likelihood Solution. IET Radar Sonar Navig. 2022, 16, 1253–1268. [Google Scholar] [CrossRef]
  54. Goncalves, L.; Busso, C. AuxFormer: Robust Approach to Audiovisual Emotion Recognition. In Proceedings of the ICASSP 2022—2022 IEEE International Conference on Acoustics, Speech and Signal Processing (ICASSP), Singapore, 23–27 May 2022; pp. 7357–7361. [Google Scholar]
  55. Bodla, N.; Singh, B.; Chellappa, R.; Davis, L.S. Soft-NMS—Improving Object Detection with One Line of Code. In Proceedings of the 2017 IEEE International Conference on Computer Vision (ICCV), Venice, Italy, 22–29 October 2017; pp. 5561–5569. [Google Scholar]
  56. Jaccard, P. The Distribution of the Flora in the Alpine Zone. New Phytol. 1912, 11, 37–50. [Google Scholar] [CrossRef]
  57. Nagarajan, N.; Keich, U. Reliability and Efficiency of Algorithms for Computing the Significance of the Mann–Whitney Test. Comput. Stat. 2009, 24, 605–622. [Google Scholar] [CrossRef]
  58. Divine, G.W.; Norton, H.J.; Barón, A.E.; Juarez-Colunga, E. The Wilcoxon–Mann–Whitney Procedure Fails as a Test of Medians. Am. Stat. 2018, 72, 278–286. [Google Scholar] [CrossRef]
  59. Mann, H.B.; Whitney, D.R. On a Test of Whether One of Two Random Variables Is Stochastically Larger than the Other. Ann. Math. Stat. 1947, 18, 50–60. [Google Scholar] [CrossRef]
  60. Vargha, A.; Delaney, H.D. The Kruskal-Wallis Test and Stochastic Homogeneity. J. Educ. Behav. Stat. 1998, 23, 170. [Google Scholar] [CrossRef]
  61. Spurrier, J.D. On the Null Distribution of the Kruskal–Wallis Statistic. J. Nonparametr. Stat. 2003, 15, 685–691. [Google Scholar] [CrossRef]
  62. Choi, W.; Lee, J.W.; Huh, M.-H.; Kang, S.-H. An Algorithm for Computing the Exact Distribution of the Kruskal–Wallis Test. Commun. Stat. Simul. Comput. 2003, 32, 1029–1040. [Google Scholar] [CrossRef]
  63. Kruskal, W.H.; Wallis, W.A. Use of Ranks in One-Criterion Variance Analysis. J. Am. Stat. Assoc. 1952, 47, 583–621. [Google Scholar] [CrossRef]
  64. Rafi, M.M.; Chakma, S.; Mahmud, A.; Rozario, R.X.; Munna, R.U.; Wohra, M.A.A.; Joy, R.H.; Mahmud, K.R.; Paul, B. Performance Analysis of Deep Learning YOLO Models for South Asian Regional Vehicle Recognition. Int. J. Adv. Comput. Sci. Appl. 2022, 13, 864–873. [Google Scholar] [CrossRef]
  65. Butt, M.; Glas, N.; Monsuur, J.; Stoop, R.; de Keijzer, A. Application of YOLOv8 and Detectron2 for Bullet Hole Detection and Score Calculation from Shooting Cards. AI 2023, 5, 72–90. [Google Scholar] [CrossRef]
  66. Du, F.; Zhou, Y.; Chen, W.; Yang, L. Bullet Hole Detection Using Series Faster-RCNN and Video Analysis. In Proceedings of the Eleventh International Conference on Machine Vision (ICMV 2018), Munich, Germany, 1–3 November 2018; pp. 190–197. [Google Scholar]
  67. Vilchez, R.F.; Mauricio, D. Bullet Impact Detection in Silhouettes Using Mask R-CNN. IEEE Access 2020, 8, 129542–129552. [Google Scholar] [CrossRef]
  68. Widayaka, P.D.; Kusuma, H.; Attamimi, M. Automatic Shooting Scoring System Based on Image Processing. In Proceedings of the Journal of Physics: Conference Series, Yogyakarta, Indonesia, 29–30 January 2019; Volume 1201, p. 012047. [Google Scholar] [CrossRef]
Figure 1. The main steps of the terminal ballistics test.
Ndt 03 00016 g001
Figure 2. AI applied in the context of terminal ballistics for Forensic Science as an NDT method.
Ndt 03 00016 g002
Figure 3. Typical CNN model. Adapted from [42].
Ndt 03 00016 g003
Figure 4. Receptive field of a particular neuron in the next layer. Adapted from [44].
Ndt 03 00016 g004
Figure 5. YOLO mechanism. Adapted from [28].
Ndt 03 00016 g005
Figure 6. Flowchart of the first part of the non-destructive testing performed by artificial intelligence for Forensic Science.
Ndt 03 00016 g006
Figure 7. Examples from Dataset (1).
Ndt 03 00016 g007
Figure 8. Examples from Dataset (2).
Ndt 03 00016 g008
Figure 9. Sampling of bullet holes performed using Roboflow.
Ndt 03 00016 g009
Figure 10. Example of duplicates detection by the YOLOV8 model with weights.
Ndt 03 00016 g010
Figure 11. Confusion matrix for the YOLOV8 model applied to (a) Dataset 1; and (b) Dataset 2.
Ndt 03 00016 g011
Figure 12. Confusion matrix for the R-CNN model applied to (a) Dataset 1; and (b) Dataset 2.
Ndt 03 00016 g012
Table 1. Results achieved based on the use of the metrics accuracy, precision, recall, and F1 score.
MetricDataset (1)Dataset (2)
TrainVal.TestGen.TrainVal.TestGen.
YOLOV8Accuracy0.9950.9831.0000.9931.0000.4590.4630.759
Precision1.0000.9831.0000.9971.0000.8730.9260.966
Recall0.9951.0001.0000.9971.0000.4920.4810.780
F1 score0.9970.9921.0000.9971.0000.6290.6330.863
R-CNNAccuracy1.0001.0001.0001.0000.8480.3850.5000.651
Precision1.0001.0001.0001.0000.8480.6400.6600.778
Recall1.0001.0001.0001.0001.0000.4920.6730.799
F1 score1.0001.0001.0001.0000.9180.5560.6670.788
Table 2. Accuracy and precision values of the tested models compared to values obtained by other studies.
AuthorsModelAccuracyPrecision
The experiments performed on Dataset (1)YOLOV80.9930.997
R-CNN1.0001.000
The experiments performed on Dataset (2)YOLOV80.7590.966
R-CNN0.6510.778
Butt et al. [65]YOLOV8n-0.921
YOLOV8s-0.947
YOLOV8m-0.937
Du et al. [66]Faster R-CNN-0.632
Series Network-0.835
Vilchez and Mauricio [67]R-CNN0.9760.995
Widayaka et al. [68]Image Processing0.910-
Disclaimer/Publisher’s Note: The statements, opinions and data contained in all publications are solely those of the individual author(s) and contributor(s) and not of MDPI and/or the editor(s). MDPI and/or the editor(s) disclaim responsibility for any injury to people or property resulting from any ideas, methods, instructions or products referred to in the content.

