Article

Integrated Non-Destructive Testing for Assessing Manufacturing Defects in Melt-Fusion Bonded Thermoplastic Composite Pipes

1
School of Computing, Engineering and Technology, Robert Gordon University, Garthdee Road, Aberdeen AB10 7GJ, UK
2
Subsea 7, East Campus, Arnhall Business Park, Prospect Road, Westhill, Aberdeenshire AB32 6FE, UK
3
SP Advance Engineering Materials Pvt Ltd., SP Centre, 41/44, Minoo Desai Marg, Colaba, Mumbai 400 005, India
4
National Subsea Centre, 3 International Avenue, Dyce, Aberdeen AB21 0BH, UK
*
Author to whom correspondence should be addressed.
Submission received: 5 November 2024 / Revised: 24 February 2025 / Accepted: 26 February 2025 / Published: 19 March 2025

Abstract

:
The thermoplastic composite pipe (TCP) manufacturing process introduces defects that impact performance, such as voids, misalignment, and delamination. Consequently, there is an increasing demand for effective non-destructive testing (NDT) techniques to assess the influence of these manufacturing defects on TCP. The objective is to identify and quantify internal defects at a microscale, thereby improving quality control. A combination of methods, including NDT, has been employed to achieve this goal. The density method is used to determine the void volume fraction. Microscopy and void analysis are performed on pristine samples using optical micrography and scanning electron microscopy (SEM), while advanced techniques like X-ray computer tomography (XCT) and ultrasonic inspections are also applied. The interlayer between the reinforced and inner layers showed good consolidation, though a discontinuity was noted. Microscopy results confirmed solid wall construction, with SEM aligning with the XY axis slice, showing predominant fibre orientation around ±45° and ±90°, and deducing the placement orientation to be ±60°. Comparing immersion, 2D microscopy, and XCT methods provided a comparative approach, even though they could not yield precise void content values. The analysis revealed a void content range of 0–2.2%, with good agreement between microscopy and Archimedes’ methods. Based on XCT and microscopy results, an increase in void diameter at constant volume increases elongation and reduces sphericity. Both methods also indicated that most voids constitute a minority of the total void fraction. To mitigate manufacturing defects, understanding the material’s processing window is essential, which can be achieved through comprehensive material characterization of TCP materials.

1. Introduction

In recent years, reinforced polymeric composites have been used extensively in many engineering applications. Industries, such as chemical, oil, and electricity, use pipes that are made of polymers reinforced with fibres for repairs, maintenance and, most recently, for long-term use. Industrially, thermoplastic composite pipes (TCPs) are increasingly being used as an alternative to conventional steel-based pipes. This development is in response to significant corrosion problems with the metallic pipes. Other reasons are due to their superb mechanical properties and designability [1,2,3].
TCPs are manufactured through melt fusion bonding in a layer-by-layer process, which has been confirmed to provide great integrity as well as compressive, flexural and inter-laminar/layer shear (bond) strength [4]. However, defects are induced into TCP during manufacturing, affecting their in-service application. Defects in composites obviously alter the microstructure of the material. Hence, fibre breakages, pull out, and matrix microcracks can develop. Defects such as voids, misalignment and delamination are common during manufacturing. These defects cause thermal shrinkage, poor matrix-to-fibre adhesion, high-stress concentration, layer separation or debonding, ballooning, thermal conductivity reduction (anisotropic), impediment of heat transfer from thermal barriers (delamination), cracking of brittle fibres or failure to achieve adequate processing conditions [5,6]. Manufacturing events such as fibre deviations can cause fibre misalignment during post-manufacturing processes. While these defects on the surface of the structure can be spotted by the naked eye, the extent to which these defects affect the mechanical performance of TCP that results in failure formation has not been entirely understood. Therefore, this poses a challenge [7]. This is because the non-complex detecting technique of observation is relatively useless in assessing internal defects and to avert the potential dangers associated with manufacturing defects, various non-destructive methods are employed [8,9].
Croft et al. [10] deduced that researchers have established that to mitigate the impact of these defects on composite structures, techniques such as the staggering technique and the placement of ±45° layers on the top and bottom layers can be used. Mandell et al. [11] also highlighted that the use of the prepreg laminate technique exhibits the least defect amounts (fibre misalignment) under controlled conditions. However, despite these efforts, defects remain, and their influence on structural performance is not fully understood. Croft et al. [10] suggest that the focus should be on considering multiple defects simultaneously, as defect distribution will likely become a critical variable. Therefore, quantifying these defects provides valuable insights into defining the effect of the defect process. This enables the understanding of the impact of individual defects and the development of methods to predict the performance of composite structures in the presence of manufacturing defects. Recently, the ability to observe and characterize manufacturing-induced defects has advanced significantly. This progress, combined with the need to understand the impact of these defects for potential cost reduction, has driven increased research into damage and failure analysis that takes these defects into account [12].
Yurgartis [13] utilized micrography and statistical analysis to estimate the fibre alignment, orientation and distribution. The findings reveal that while the distribution in the prepreg is axially symmetric, it changes after lamination, with the extent of change depending on the stacking sequence. In this specific material, most fibres were found to deviate slightly from the mean fibre direction, with distribution standard deviations ranging from 0.693 to 1.936°. Although the misalignments observed are small, they are substantial enough to influence the structure–property relationships. However, there is uncertainty on whether these distributions are typical for all composites. Nonetheless, they provide an indication of the degree of misalignment that may be expected.
For glass fibre-reinforced polymer parts, the increase in glass fibre content enables the rise in void formation due to the fibre-to-matrix interaction. However, the thickness of the part has more influence on void formation due to the irregularities during stacking of the laminate plies [14,15]. For research purposes, varying methodologies have been utilized to estimate the void content of the samples, such as immersion (Archimedes) and 2D microscopy. Both the immersion and 2D microscopy techniques have no destructive effect on the inspected samples; therefore, all the samples subjected to void content analysis by the described methodologies are initiated with the density and then the microscopy to generate a comparison between the outlined methods [16]. The reliability and precision of these techniques are further discussed here. It is difficult to obtain precise results for each method as the actual void content remains unknown. Instead, a comparative approach is utilized with the void volume fraction from the test of five samples for the emphasized methods. To handle the section bias errors, the cross section for each sample is analysed with the microscopy, which increases the total number of samples to 20.
There is a growing need for a fundamental shift in non-destructive inspection (NDI) (such as X-ray computer tomography (XCT) and ultrasound) from merely detecting defects to accurately measuring their location and size to better assess their effects. TCP manufacturing requires knowledge of the feeding direction at designed angles. As a result, defects such as fibre kinks, fibre waviness, gaps and overlaps are formed from the geometrical layups, and their effects are not entirely understood. For the laminate layers of the TCP to be manufactured, the stacking sequence, size and possible defect formation have to be considered [17]. Mechin et al. [18] stated that for any relative misalignment in fibre orientation, there is an estimated 50% strength loss. Therefore, deriving the precise fibre orientation and detecting any misalignment is needed. However, measuring the fibre misalignment is challenging to achieve as it requires the measurement at microscopic size width against length in millimetres, making the aspect ratio significantly large [19]. Hence, understanding the internal structure is necessary for predicting the mechanical performance. It is then beneficial to estimate the fibre orientation distribution that influences the fibre strength, which is maximum at alignment with the acting stress on the structure, which is the rationale for the anisotropic material behaviour.
To deduce the global and local (anisotropy) properties, the fibre orientation within the composite should be known [20]. Usually, it is the manufacturing process that determines the fibre orientation distribution as well as the final properties. The fibre is distributed by the molten polymer dynamics as it solidifies. In terms of measuring methods for the fibre orientation, TCP, which is an advanced part, possesses a circular geometry with a thick wall intersecting layers in a tubular profile. At the layer intersection, regional stress concentrations will be developed, and the melt polymer flow, as well as the fibre orientation distribution, will be altered. Several varying experimental methods exist for measuring and validating the orientation distribution, including over large volumes. Optical methods such as the SEM enable the scanning of complex regions but are fully destructive methods that do not allow the measurement of fibre orientation tensor parts.
Nikishkov et al. [21] developed a method for accurate void measurement based on XCT. This method is based on the average grey values of air and material obtained from XCT scans. This method relies on the demonstrated proportionality between the XCT grey values and material density in the fibre-to-matrix of the composites. The method showed excellent correlation with microscopic measurements of voids in the cut section. The total porosity volume measurements in a carbon fibre-reinforced polymer composite fabric specimen were also confirmed through physical sectioning. This method confirmed the three-dimensional nature of manufacturing defects and their distribution, which cannot be reliably quantified using standard 2D methods, such as microscopy. Increasing evidence suggests that not only the total void content but also the location and size of individual defects at critical points are crucial for understanding their impact on the structural performance of composites, including their strength and fatigue behaviour.
Also, Little et al. [14] and Chai et al. [22] evaluated various void characterization techniques for composite materials, focusing on their accuracy and reliability. The studies demonstrated that each method has specific strengths and limitations, with Archimedes and microscopy showing significant inherent drawbacks. Considering factors such as preparation and testing procedures, the level of characterization detail, cost, and overall accuracy and reliability, the studies conclude that XCT analysis is the most accurate and reliable technique for characterizing voids in composite materials.
Furthermore, Saenz-Castillo et al. [16] deduced that each composite manufacturing process requires its own set of quality control criteria for the critical void threshold. NDT was used to propose a methodology for establishing acceptable criteria for engineering applications of thermoplastic composites. The research was able to correlate ultrasonic absorption coefficient and void content, which created a direct observation linear fit whereby a sharp increase in attenuation within all the scans beyond a certain void content indicates the threshold. Notably, there would be a significant difference in void values for laminates produced from varying techniques. This is because manufacturing methods such as in situ consolidation can change the fibre area weight and matrix density of the material because of the roller compaction and applied heat source irradiation, which can create erroneous evaluation of the voids due to the use of crude calculations using the theoretical density and fibre area weight [16]. Saenz-Castillo et al. [16] emphasized these differences in void assessment methodologies as the use of density, a fast assessment method that needs previous knowledge of the theoretical properties of the material and can generate a somewhat inaccurate porosity value. Although 2D microscopy offers details of the location, size and morphology of defects, which includes voids, it is restrained to a cross section of each sample which involves an implicit bias inaccuracy. To improve these findings, the XCT technique is integrated into this research to ascertain the presence of voids by reconstructing the XCT dataset of the scanned samples. For the XCT scanning reconstruction, constant factors are retained for all the samples although these factors are optimized for improved precision. This method is limited to the scan of small samples.
Any slight increase in scanning resolution and sample size significantly elevates the power needed for the data acquisition system, dataset file size, and scanning time. XCT analysis proffers the advantage of visualizing a three-dimensional-rendered version of the internal laminate structure of the sample. The 3D visual analysis of the internal structure provides the fundamental knowledge of the laminate part. This fundamental knowledge of the presenting voids within the sample aids in enabling a thorough analysis of the defects within the sample. The use of the Avizo software version 2023.2 enables the 3D analysis of the XCT scans. This procedure can also be visualized as similar to the micrograph as it incorporates the through-thickness slices in the form of pixels and showcases the void interconnectivity between the images of the cross-section.
This research proposes a comprehensive quantification of these manufacturing defects of the TCP, to establish their presence. This is further buttressed by facilitating the understanding of the relationship between NDT and manufacturing defect quantification techniques through the surface and sub-surface of the TCP constituent layers. The SEM, ultrasound, and XCT methods are utilized to accurately detect and quantify manufacturing defects in terms of dimensions and location. The interaction of these defects and their implications are also investigated. The goal of the quantification procedure is to provide insight and establish a quantitative benchmark for enabling a consistent or improved manufacturing process, an area lacking in current research.

2. Materials and Methods

2.1. Materials

A melt-fused TCP was donated for the research purpose. The pipe has 50 mm ID and 102 mm OD with a length of 1500 mm and is stored at room temperature. Also, from the database, this is a glass fibre-reinforced high-density polyethene (HDPE) TCP with a burst pressure of 5 ksi and an operating temperature of 65 °C. It is made of 3 fully bonded layers: the inner, reinforced, and outer. The thickness of the liner layer is 4 mm while that of the reinforced and coated layers is 17 mm and 4 mm, respectively, with a total thickness of 25 mm, as displayed in Figure 1a. For ease of understanding, the layers in this report will be represented by A for the liner layer, B for the laminate layer, and C for the coated layer.
The test samples were machined from the TCP using a diamond blade saw cut and fair-faced for a smooth surface finish to ISO1183-1 testing standard. A set of 3 to 5 samples is prepared and stored at room temperature with no pre- or post-treatment needed.
A flow chart that provides the methodology and techniques to be used in assessing the manufacturing defects present in the TCP is provided in Figure 1b.

2.2. Characterization

Optical micrography: micrography of the pristine sample was also performed using an Infinity1 microscope equipped with a Nikon Japan digital camera attached to it, which is dependent on light rays that reflect from a spot on the sample. A flat sample with all layers was used in the magnifications of 5, 10, 20, and 40 at each layer and the interface. The Delta optical camera was used for the analysis because it provides a broader concentration region and magnification. Both the pristine and tested samples were studied using the Zeiss EVO LS10 microscope from Jena Germany at 25.00 kV accelerating potential and magnifications of 200×, 500×, and 1000× for all the samples. This procedure provides a defined contrast and digital imaging plausibility in contrast to the optical microscope. This is a destructive technique that utilizes only a cross-section of the sample. The prepared samples are made with very few scratches, as they will appear as voids in the image analysis software. A cryogenic sampling procedure was used to prepare the samples to determine the surface morphology for thermoplastic composite pipe layers and the glass fibre and HDPE polymer matrix characteristics. Samples from the separated layers were gold-coated using the sputter deposition technique for roughly 2 min before experimenting.
Scanning Electron Microscopy (SEM): The prepared samples were also studied using the Zeiss EVO LS10 Scanning Electron Microscopy (SEM) at working distances of 9 mm, 8 mm, and 7 mm for liner, reinforced and coating layers, respectively. This was performed at 25.00 kV accelerating potential and magnifications of 200×, 500×, and 1000× for all the samples. Image J software (version 2.9.0) was used to process the 2D microscopy images, and this analysis was carried out for each image cross-section. The procedure demands the conversion of the cross-section micrograph to binary form. Here, the voids, fibres and any other matter are highlighted. The image is segmented to remove the noise and outliers that are not needed. The total number of voids in a defined space, void shape, size, area fraction, and location in 2D can be derived using the built-in statistical tools.
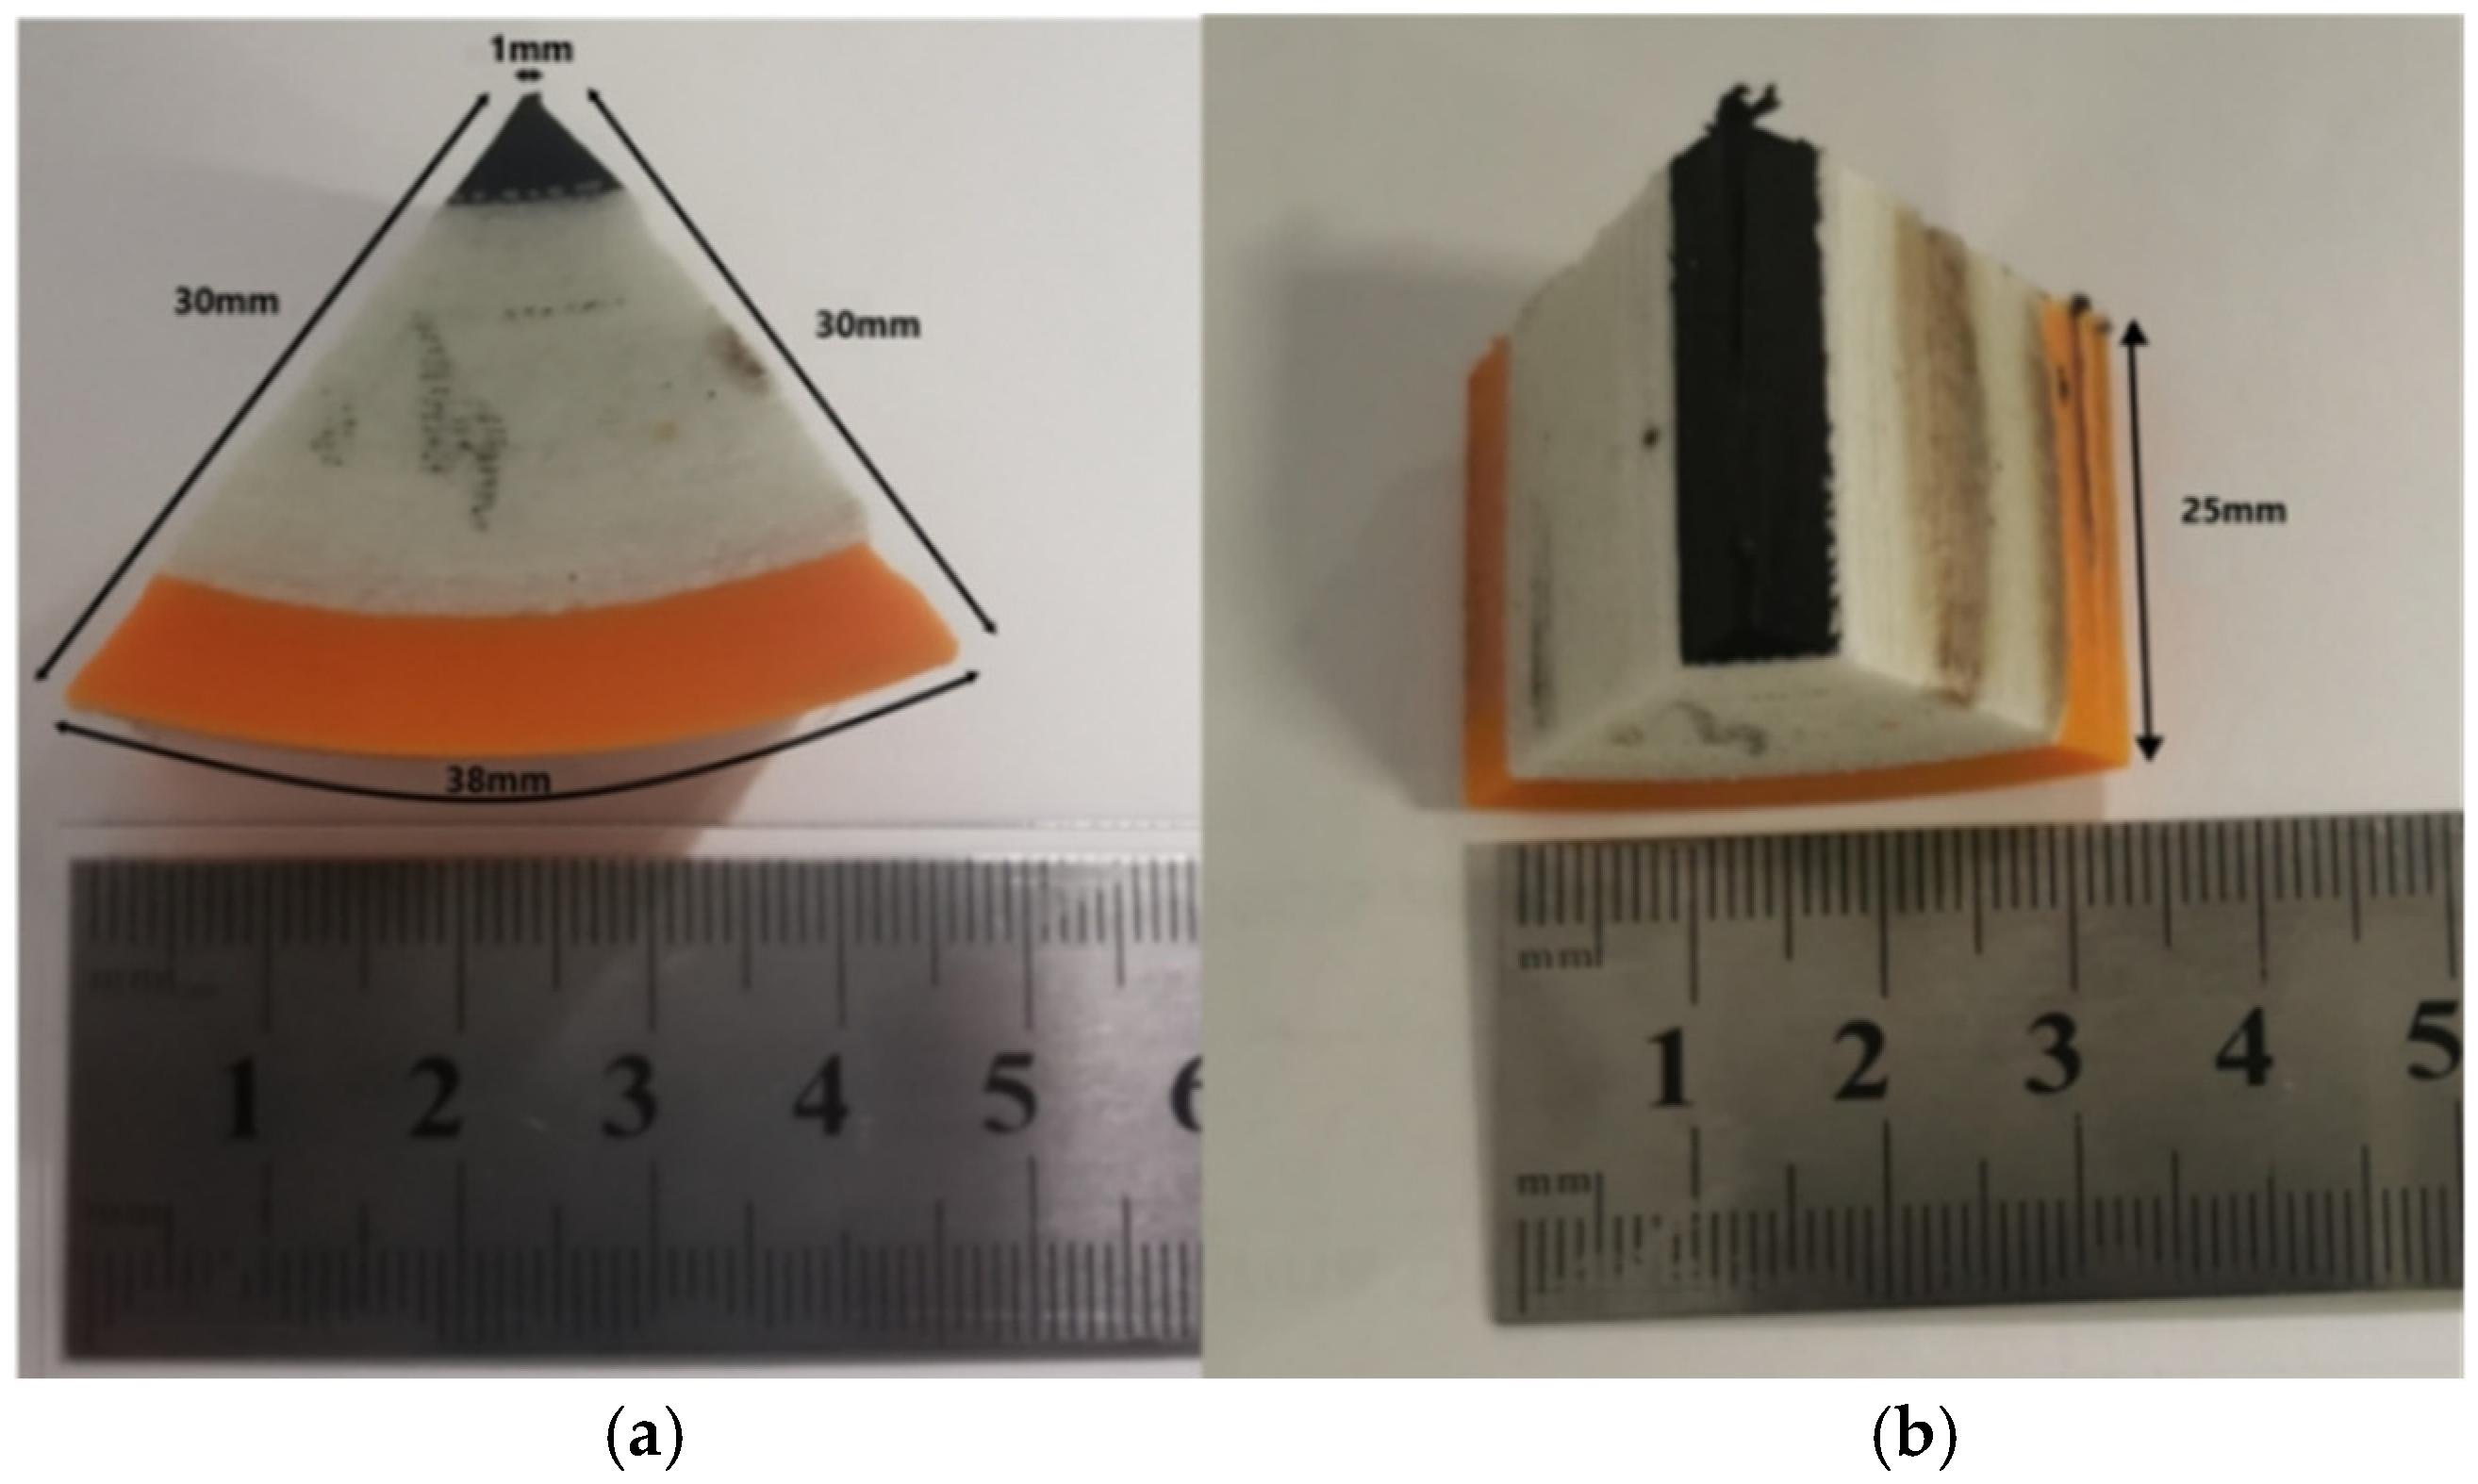
X-ray Computer Tomography (XCT): For the XCT scanning and reconstruction, minimal sample preparation is required because this method is non-destructive, which applies to both the pristine and tested samples. An untested sample seen in Figure 2a,b was used to study the TCP before being in service. The process relies mostly on the sample size, XCT scan settings, and scanning resolution. The amount of defect and damage patterns in the sample was analyzed at the microscale by using Nikon XTEK XTH 225 kV at the University of Manchester, UK, and the scans captured the entire cross-section of the x-y-z plane.
The 3D data were reconstructed from 2D radiographs using a filtered back-projection algorithm. The reconstructed data were analyzed and segmented using Avizo software version 2023.2 with a voxel size of 0.02 × 0.2 × 0.2 µm. The analysis was carried out to characterize the porosity in the form of the volume, the equivalent diameter (diameter of the pore of the same volume), and sphericity (closeness of the pore to a sphere).
For the use of XCT through 3D reconstruction of the sample dataset, the fibre orientation distribution analysis techniques for XCT can be sub-categorized into three parts. The first method utilizes the isolation of fibres to estimate the orientation based on segmentation. This segmentation enables the total and complete estimation of the fibre orientation distribution but needs high spatial resolution. Currently, the limitation on the scan volume dimensions is due to the high resolution needed in comparison to the other methods. The second method deploys 2D slices obtained from the volume, but the out-of-plane angles cannot be determined. The third method involves the analysis of the entire 3D reconstructed volume either totally or in subdivisions, which is termed indirect, as the segmentation for each single fibre is dependable. Although this method can derive the fibre orientation where the spatial resolution is low, all the methods are micro-destructive. The maximum volumetric dimensions that can be measured currently are limited by memory, imaging and availability of computational devices.
The orientation analysis, histograms and computation of the XCT data and distribution parameters from image analysis were conducted using the Fiji (Image J) software analyzer with the selection of the slice planes for a fibre-reinforced cross-section. Here, the geometry, shape and area of the fibre are the factors of interest. Through identifying the local fibre orientation, the orientation distribution function such as any degree of fibre misalignment can be computed. Through the combined use of the Avizo and Image J software, the local orientation analysis enables the creation of 3D models from 2D slices that exhibit the inner structure that reflects the anisotropy of the fibre. Virtual cross-sections of the reconstructed 3D models post-CT scanning are utilized for the measurements. The cross sections are analysed based on measurements of the geometric properties of the internal structures of the elements and they include the fibre coordinates and thickness.
The orientation J plugin comprises the plugin series that is added to the Image J software package. To ascertain the directionality, the interface displayed 2 computation methods: either the local gradient orientation or Fourier components. To specify the number of bins with the starting and ending angles for generating a histogram, the histogram end is set at 180° from the start. For the Fourier component technique, the orientation map reveals the pixel direction with the strongest intensities. The result table provides the histogram data outlining the amount of fibre orientated in a specific directionality analysis table and gives the Gaussian peak centre for the histogram. To gauge the Gaussian fit, 1 is assigned as good, while 0 represents bad. Interpreting the histogram, the fibres can be randomly orientated, but with a peak at ±60°, establishing the orientation for this specific direction. For the orientation J plugin, the dominant direction is determined by computing the dominant orientation. The weighted histogram of the orientation determines the dominant direction and weight in percentage is the coherency. The gradient to be used here is the cubic spline and the type of visual representation can be expressed in radians or degrees. The hue, saturation and brightness (HSB) mode is applied for the colour map where the hue is orientation, saturation is coherency and brightness is the source image. Coherency will determine the percentage of structural orientation closer to 90°. The use of the orientation J (OJ) vector field to visualize the orientation vector. Ensure the checking of the show table and overlay to view the vector field orientation. Usually, the vector module is proportional to the scale factor and coherency that is provided [23].
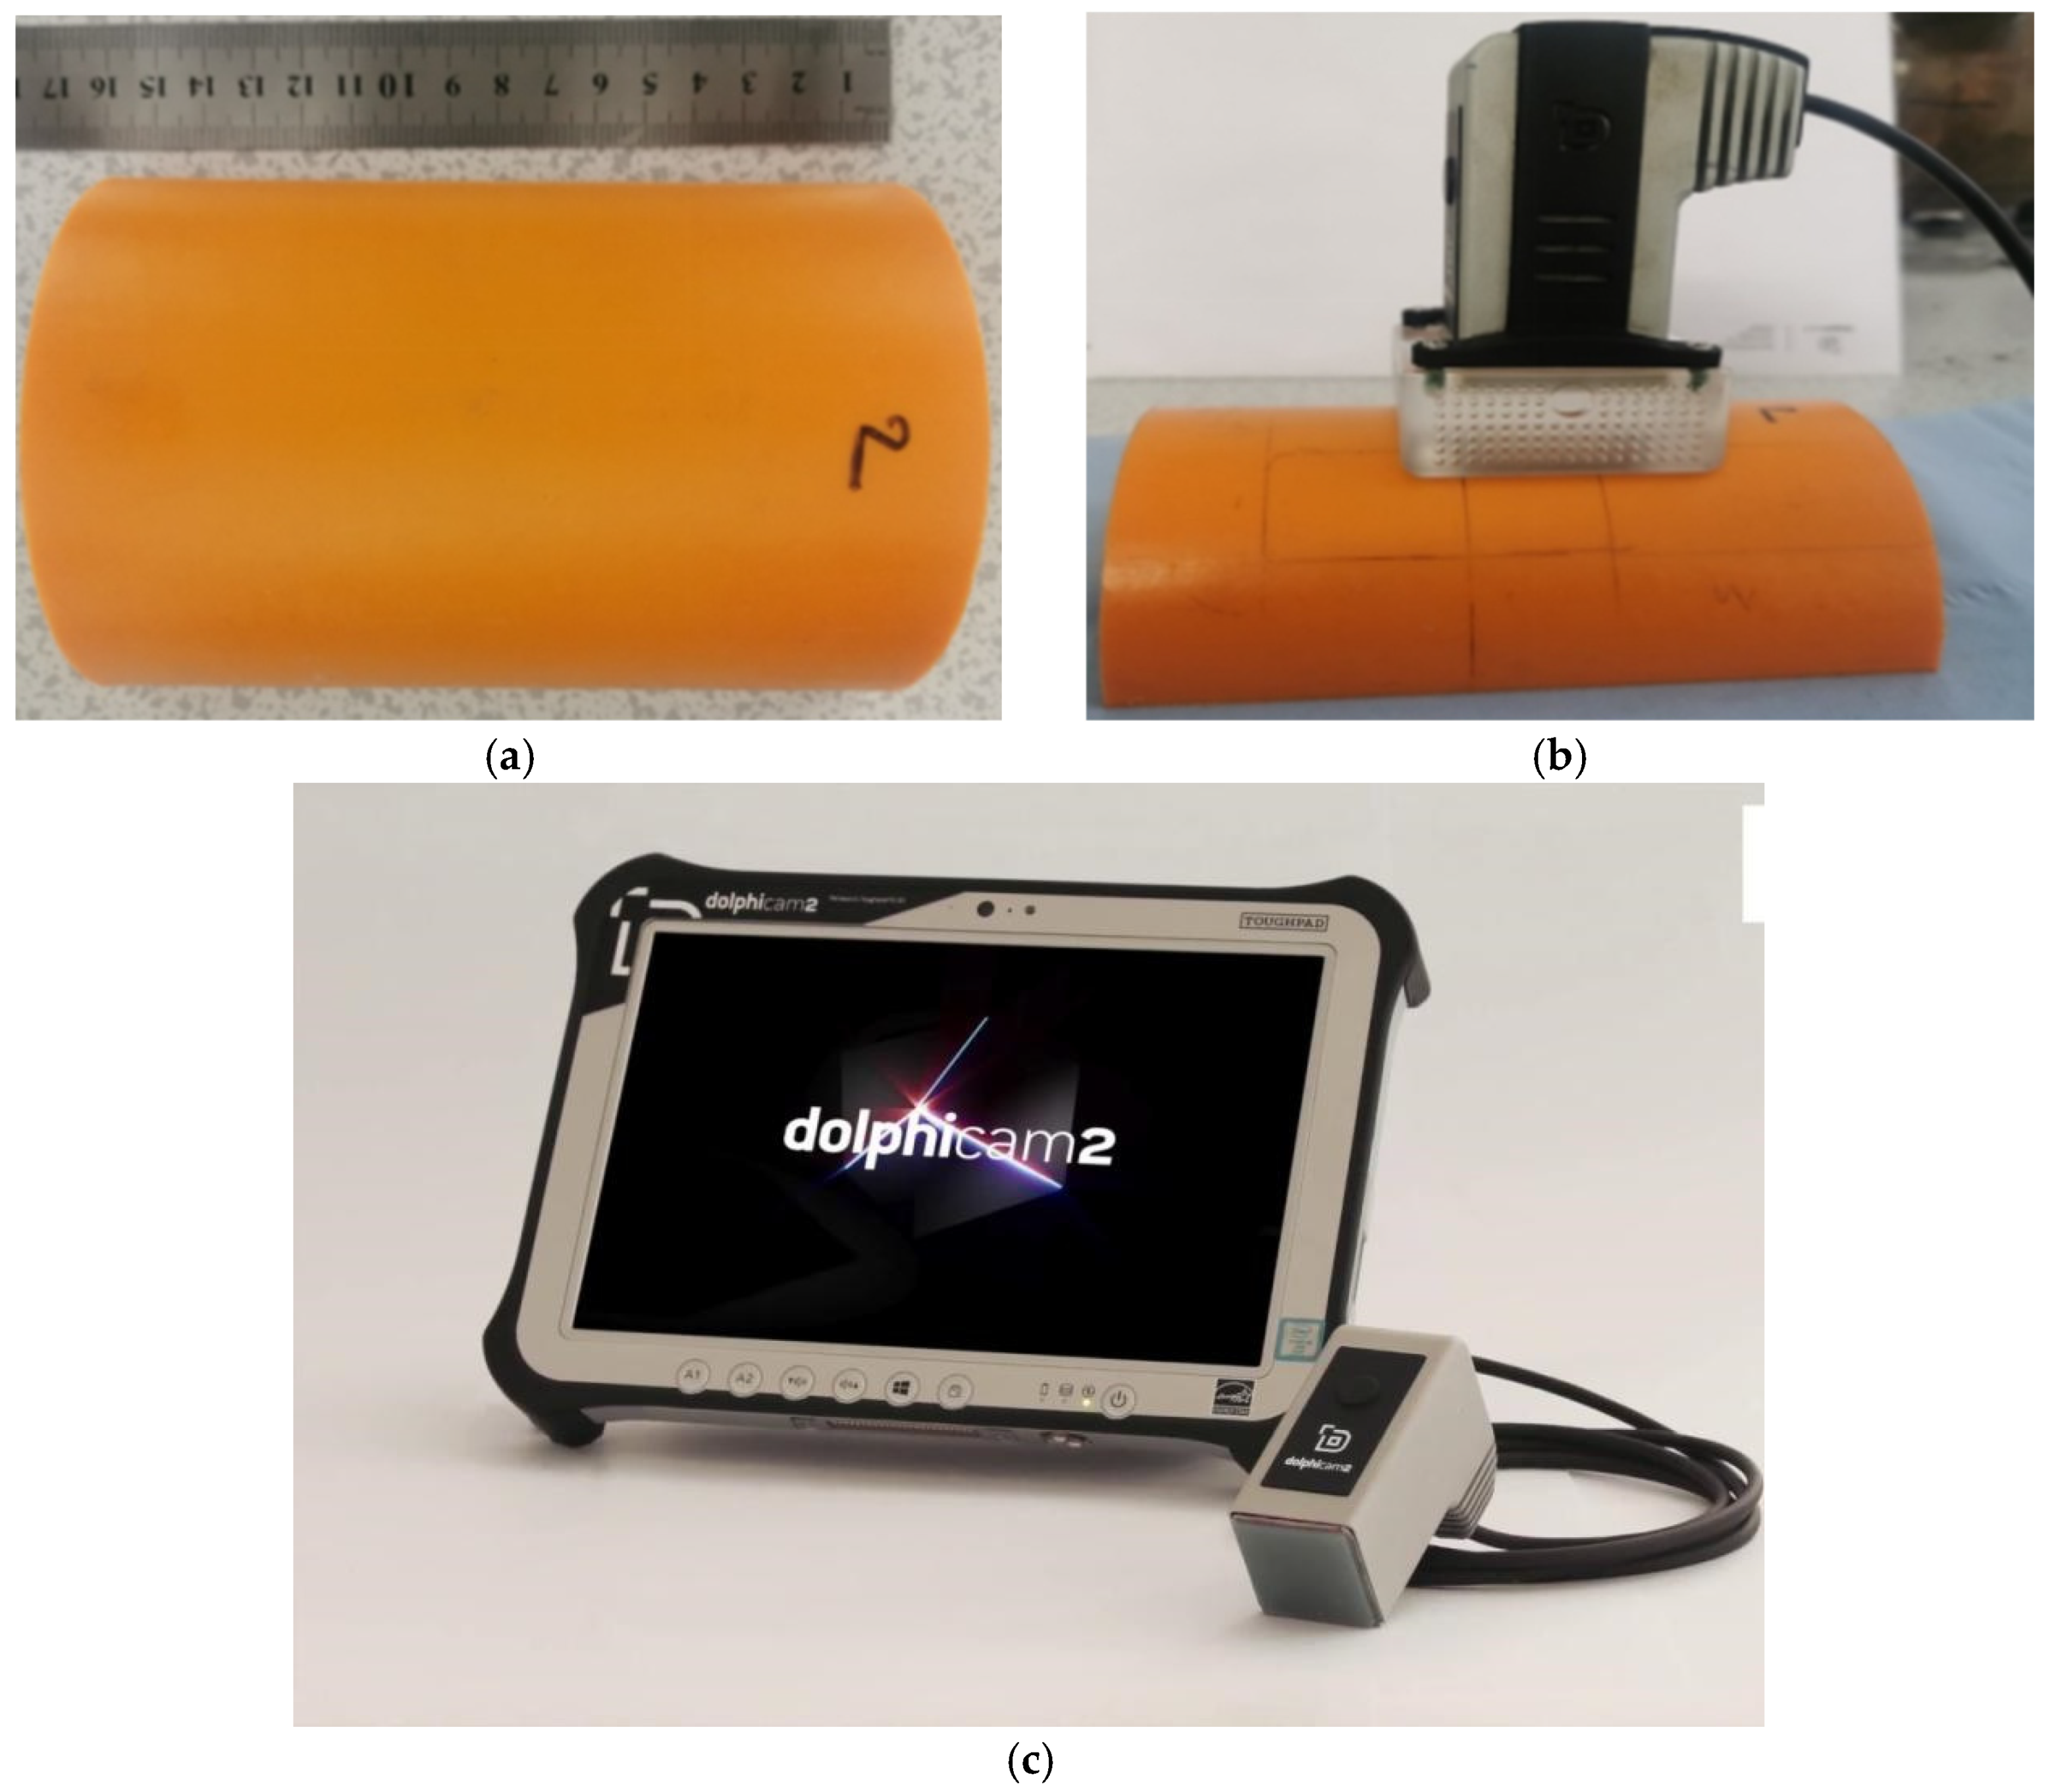
Ultrasound test: The Dolphicam2 ultrasonic equipment made available by Dolphitech for 2 weeks was used for ultrasonic inspection. The sample inspected at pristine condition is a truncated glass fibre-HDPE pipe section displayed in Figure 3a,b.
This module operates at a central frequency of 2.5 MHz and features an Aqualene delay line, making it suitable for inspecting composite materials with higher porosity levels. Here, a Dolphicam2 Low-Frequency Transducer module (TRM) is used which is a multi-purpose 2D matrix array ultrasonic test (UT) system connected to a standard computer (Figure 3c). This system is beneficial as it offers an architecture with an improved (128 × 128) crossing electrode where a transducer (a standard ultrasonic gel was used as the couplant at the acting surface as the material is not shiny or painted) with an active aperture of large elements 128 × 128 (16,384). The software displays A, B, and C-scans with C-scans being the Time of Flight (TOF) and generates new data from the camera at a rate of 4 times per second. With the unique resolution due to the TOF data, this system can generate detailed 3D images of the defects that can be panned, zoomed, or tilted for a detailed assessment of the damage. Hence, it is suitable for several forms of straight-beam ultrasonic monitoring, including fibre-reinforced materials and monitoring bonded regions. The device produces a volumetric non-destructive means of resolving composite structures with transducer frequencies lying in the range of 1.5 MHz to 10 MHz. Two transducers are suitable for either flat or curved surfaces depending on the sample geometry. Furthermore, this low-frequency technique ensures the penetrating ability through the pipe section thickness. There is no delay time in TRM rather a variety of curved pipe shoes (transducers) that are replaceable can be attached to TRM. This study adopted 100 mm diameter pipe shoes which are appropriate for the pipe section sample of interest. This enables ample coupling to be attained through inspection and subsequently facilitates the proper sound transmission into the sample. At each scan, there is a covered region of 10 mm in the longitudinal direction and 2.5 mm thickness for surface planes.

2.3. Defect Quantification

A set of 5 samples is prepared by fine face cutting with careful cleaning and mounting on a weighing balance. The samples are stored at room temperature, and no pre- or post-treatment is needed. As a means of obtaining the void volume fraction, the Archimedes theoretical versus actual density method was conducted in accordance with Method A of ISO1183-1 [14]. The samples for this procedure geometrically vary with other methods, but it is assumed that the impact is negligible on the precision of the obtained result. The void volume fraction (Vv) of the sample can be expressed through Equation (1) based on the density ( ρ ) and mass fraction (%) of the critical components.
V v = 100 ρ s a m p l e   ( % M m a t r i x ρ m a t r i x + % M f i b r e ρ f i b r e )
However, it is pertinent that the material properties be precisely determined due to minor differences substantially influencing the derived void volume fraction. Through the Archimedes principle, the actual density of the sample ( ρ   sample) can be obtained as the weight of the sample, initially measured in air and subsequently measured after submerging in water. These phases are accurately conducted with zero bubbles present on the sample surface during submergence.

3. Results and Analysis

3.1. Effect of Fibre Volume Fraction on Surface Morphology

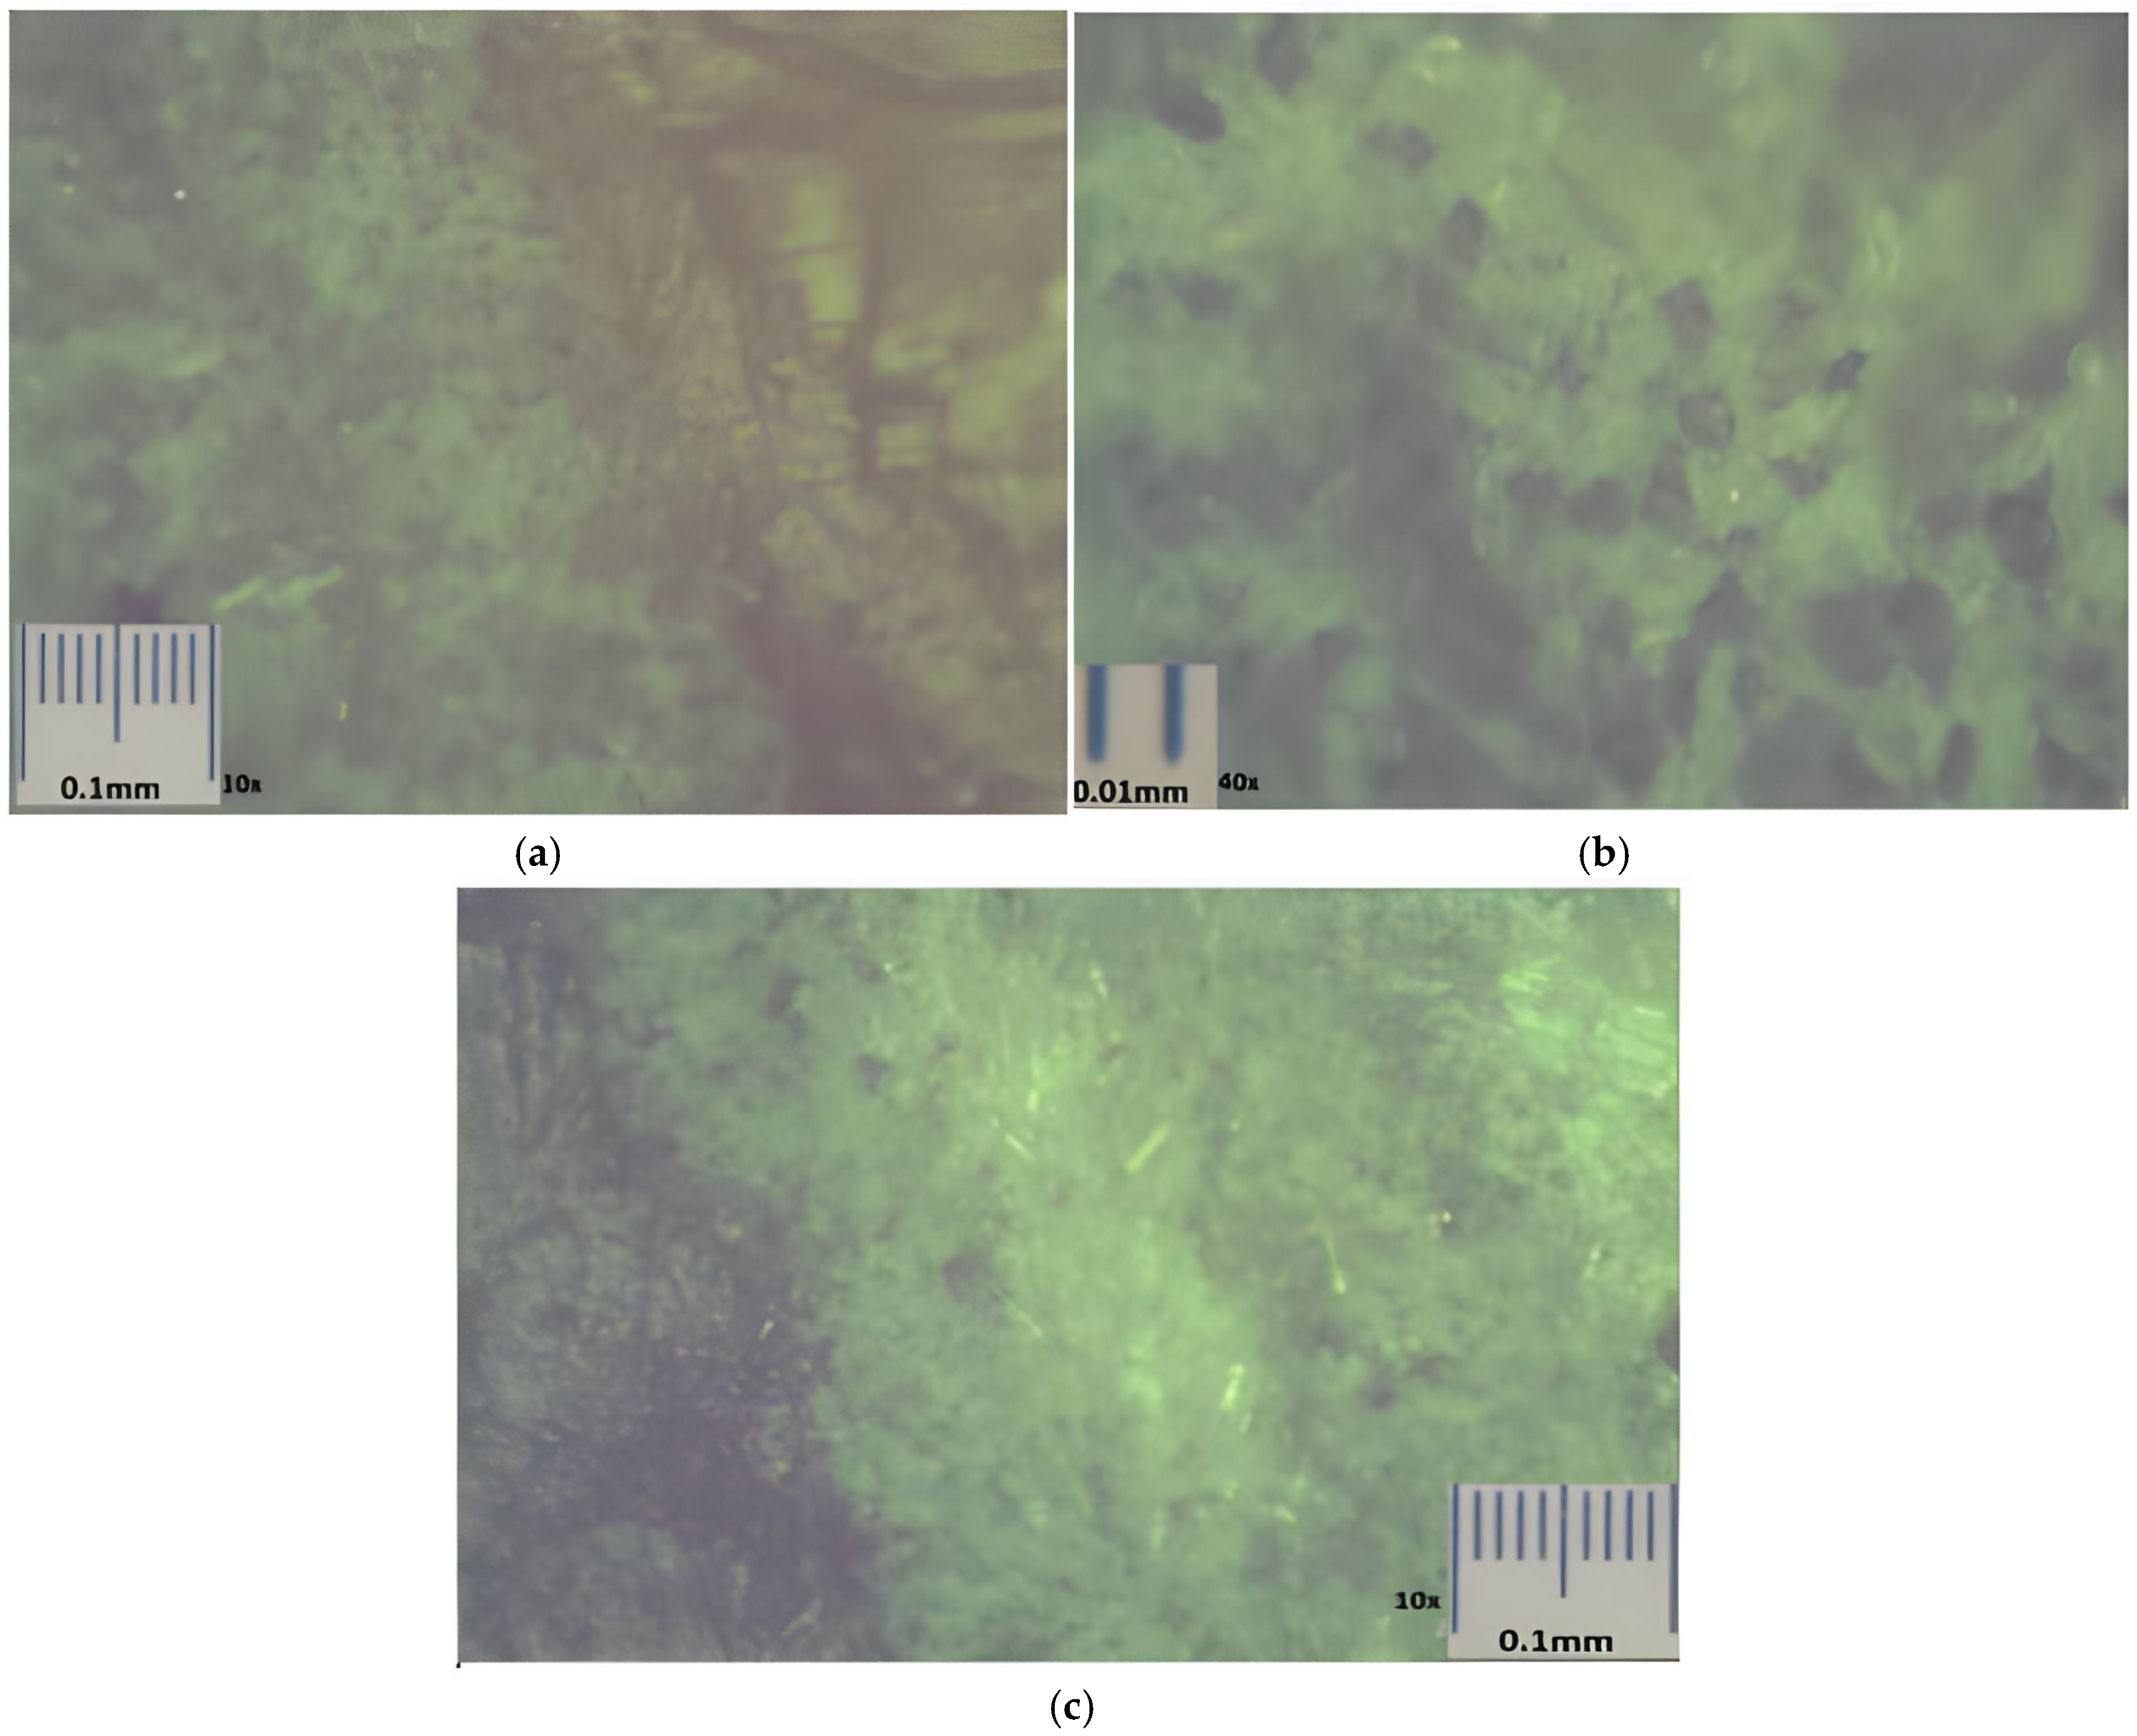
To fundamentally understand the surface morphology, optical microscopy was carried out. During the pipe stiffness test, no sort of failure (delamination) occurred. The interlayer bonding between the layers was compared using the images obtained at varying magnifications. Fine-facing the samples was sufficient for this test as the brittleness of the samples makes it challenging for other pre-treatment forms (etching and polishing). In Figure 4a, the interlayer between the outer and reinforced layer at 10× magnification is presented. A near-perfect consolidation between the layers is observed at the wall-looking layer, and some spots that seem to be from all parts of the layer are distributed across the surface. There is also a change in layer direction as the outer layer is at ±90° while the reinforced layer is tilted to roughly ±180°. Furthermore, short glass fibres can be observed between them, but they seem like strands.
Figure 4b shows the region of the reinforced layer. Although some cuts from sample preparation can be observed, a massive fibre bundle is present in this layer that is very visible. Figure 4c depicts the area of an interlayer between the reinforced and inner layers, which has a perfect consolidation similar to that of the other interlayer. There also seems to be a discontinuity in the top right corner of Figure 4c. This micrograph confirms that the TCP is a solid wall construction.
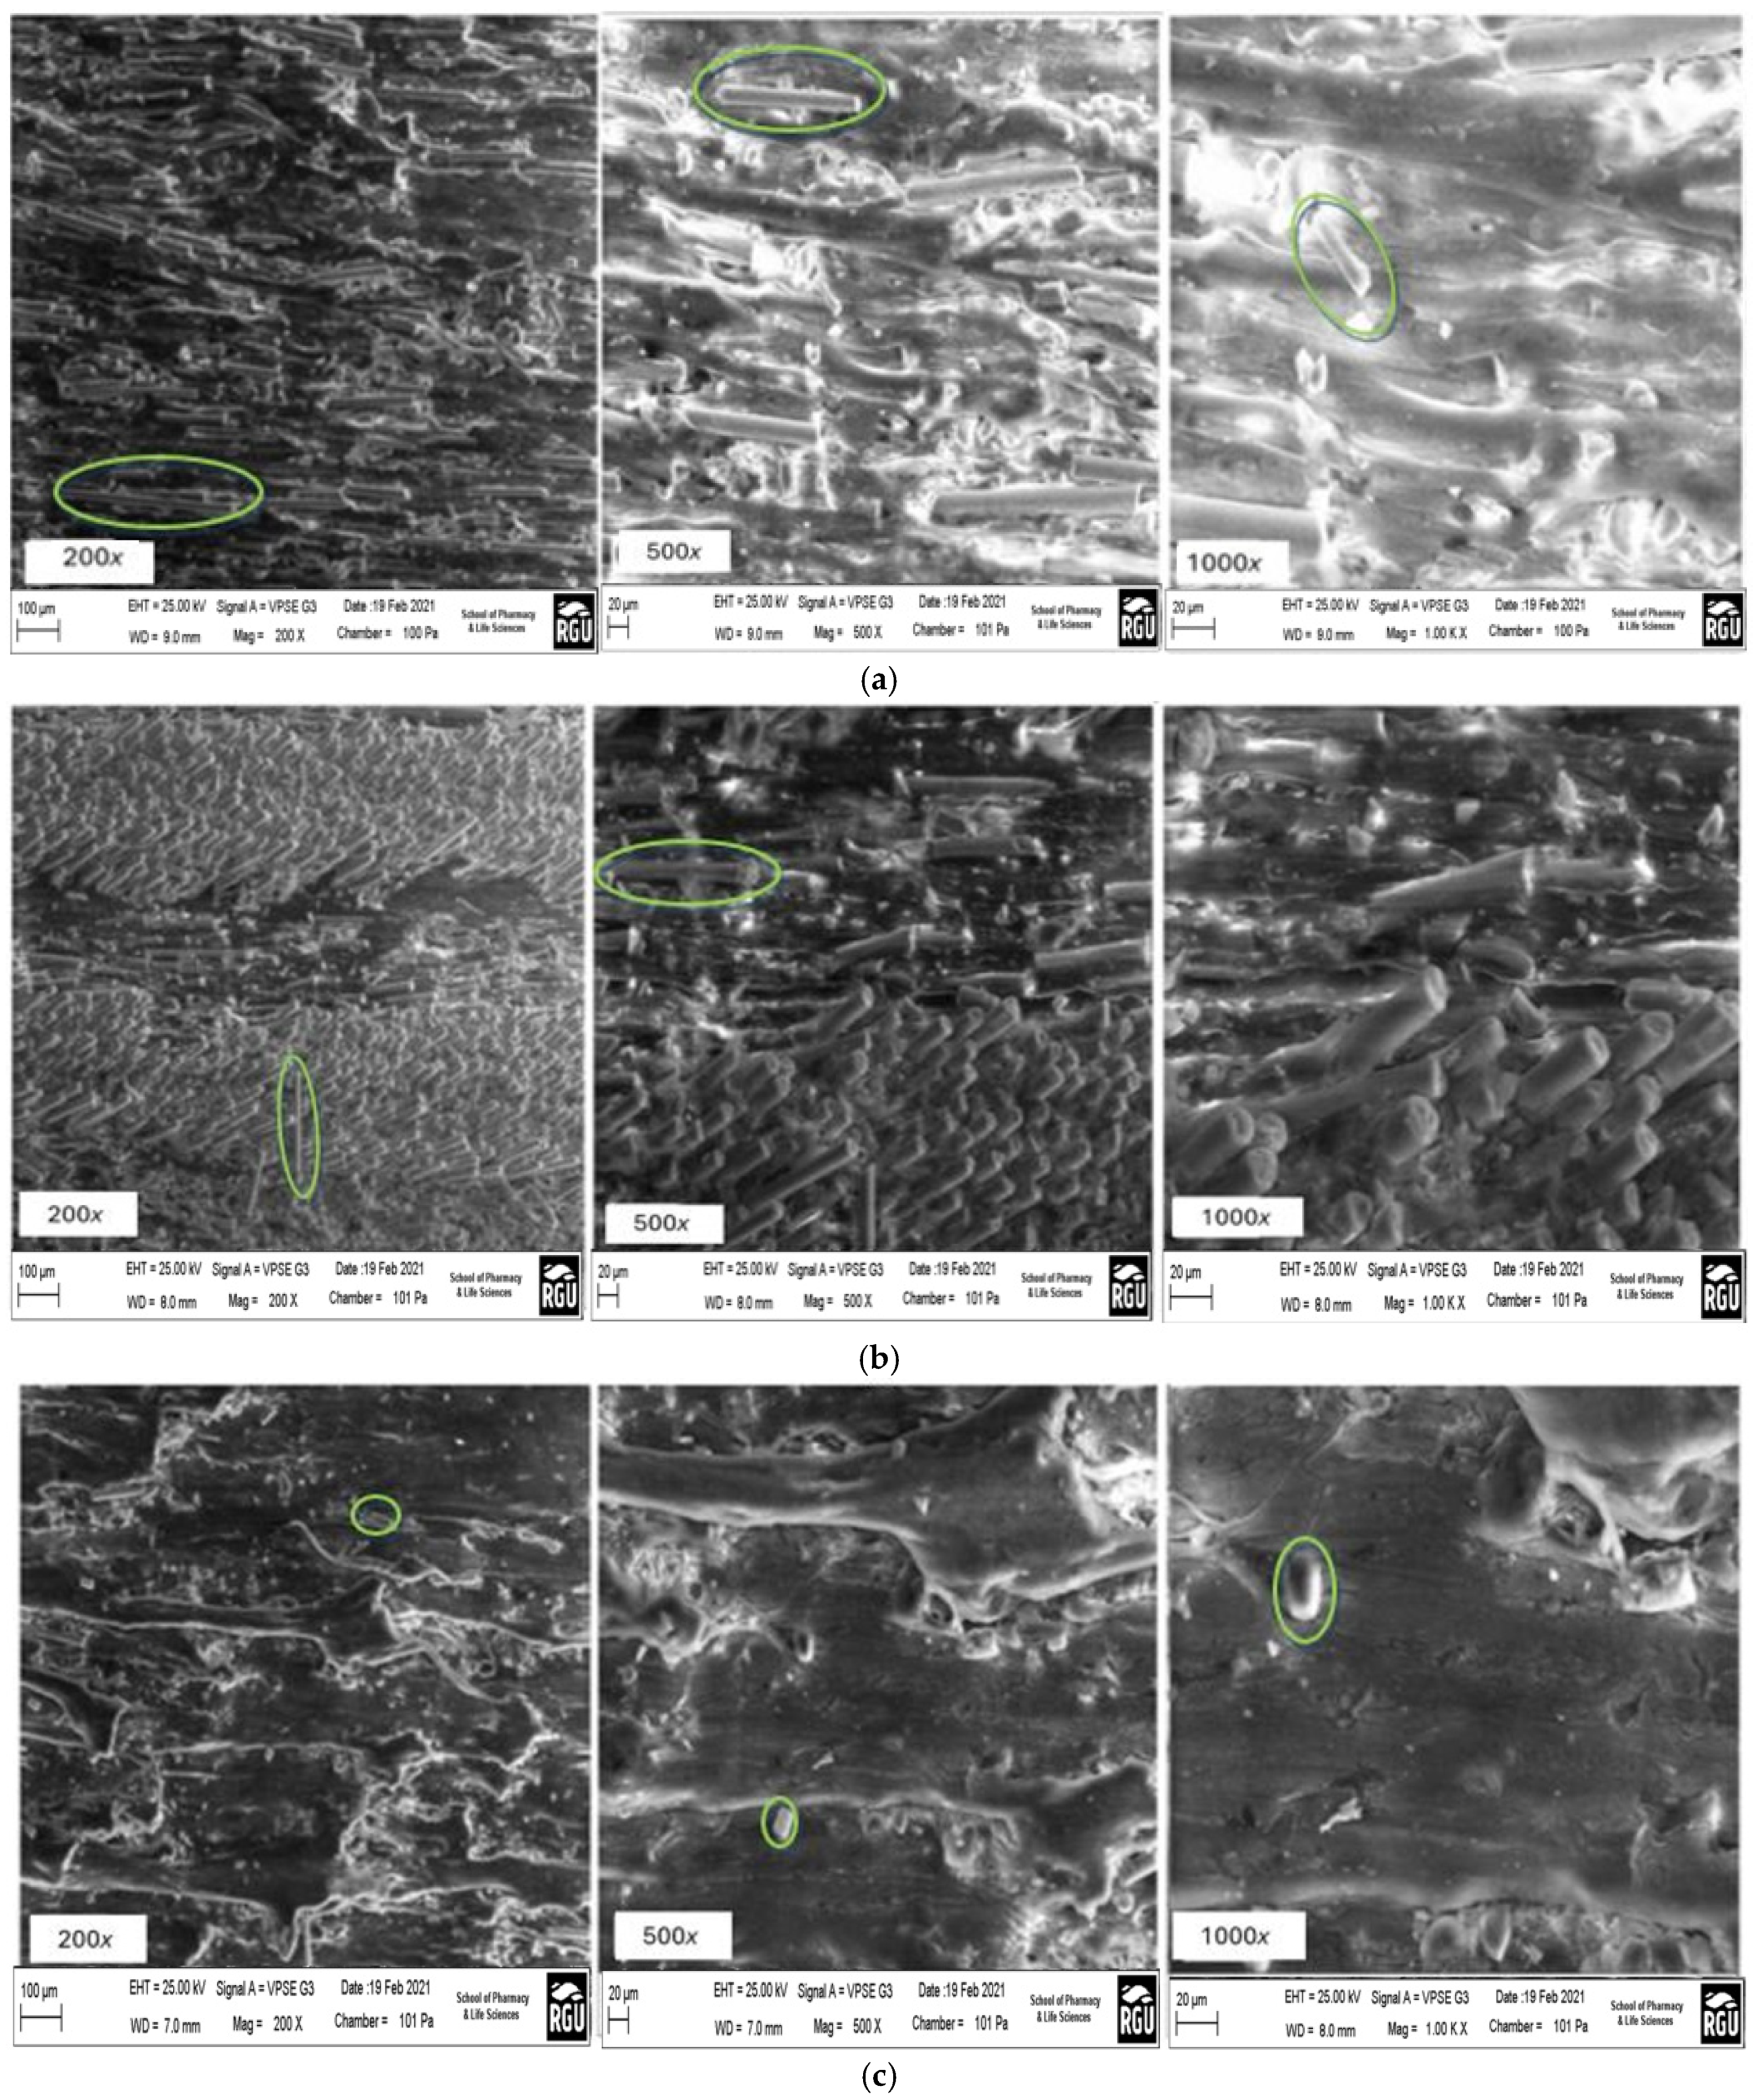
The SEM micrographs were used to analyze the unique similarities and differences in morphological structures of the layers where layers (A), (B), and (C) represent the liner, reinforced, and coated layer, respectively, at magnifications of 200×, 500×, and 1000×. Figure 4a shows the micrograph of layer (A), where the presence of fibre is evenly distributed in varying sizes. The presence of an uneven surface for the matrix suggests that this layer is steam sterilized to reduce micro-organism growth and degradation, as this layer is designed to handle fluids of varying compositions [24].
As earlier suggested, smaller foreign bodies can also be spotted, which may be linked to nano additives. Also, the short fibre in Figure 5a is sparsely distributed within a rich matrix, indicating good fibre and matrix adhesion and improving its mechanical properties. The SEM micrograph of layer (B) is depicted in Figure 5b, where a closely stacked fibre sequence and longer-sized fibre are observed. They seem to have an orientation of ±45°, and some loose fibre is spotted as well. The matrix may also be compatible with the fibre. However, Figure 4a shows reduced adhesion between the fibre and the matrix, likely caused by the low matrix content. Also, this fibre is longer, which increases its brittle property and makes the material susceptible to fibre breakage when applied to external conditions. Figure 5c displays the SEM micrograph of layer C, and in contrast with the other layers, this layer has the smallest-sized fibre, which is sparsely distributed. Foreign bodies can also be spotted, which can either be from paint pigments or elements identified in the EDXA. In terms of the polymer matrix, it also seems steam sterilized to reduce micro-organism growth, especially as it is designed to protect the pipe externally from external factors, including biological ones [24]. Also, it can be observed that there is poor gelation during manufacturing or post-processing in the form of agglomerates, which can be spotted in Figure 5c.

3.2. Defect Quantification

3.2.1. Effect of Fibre Orientation and Distribution on Fibre Misalignment

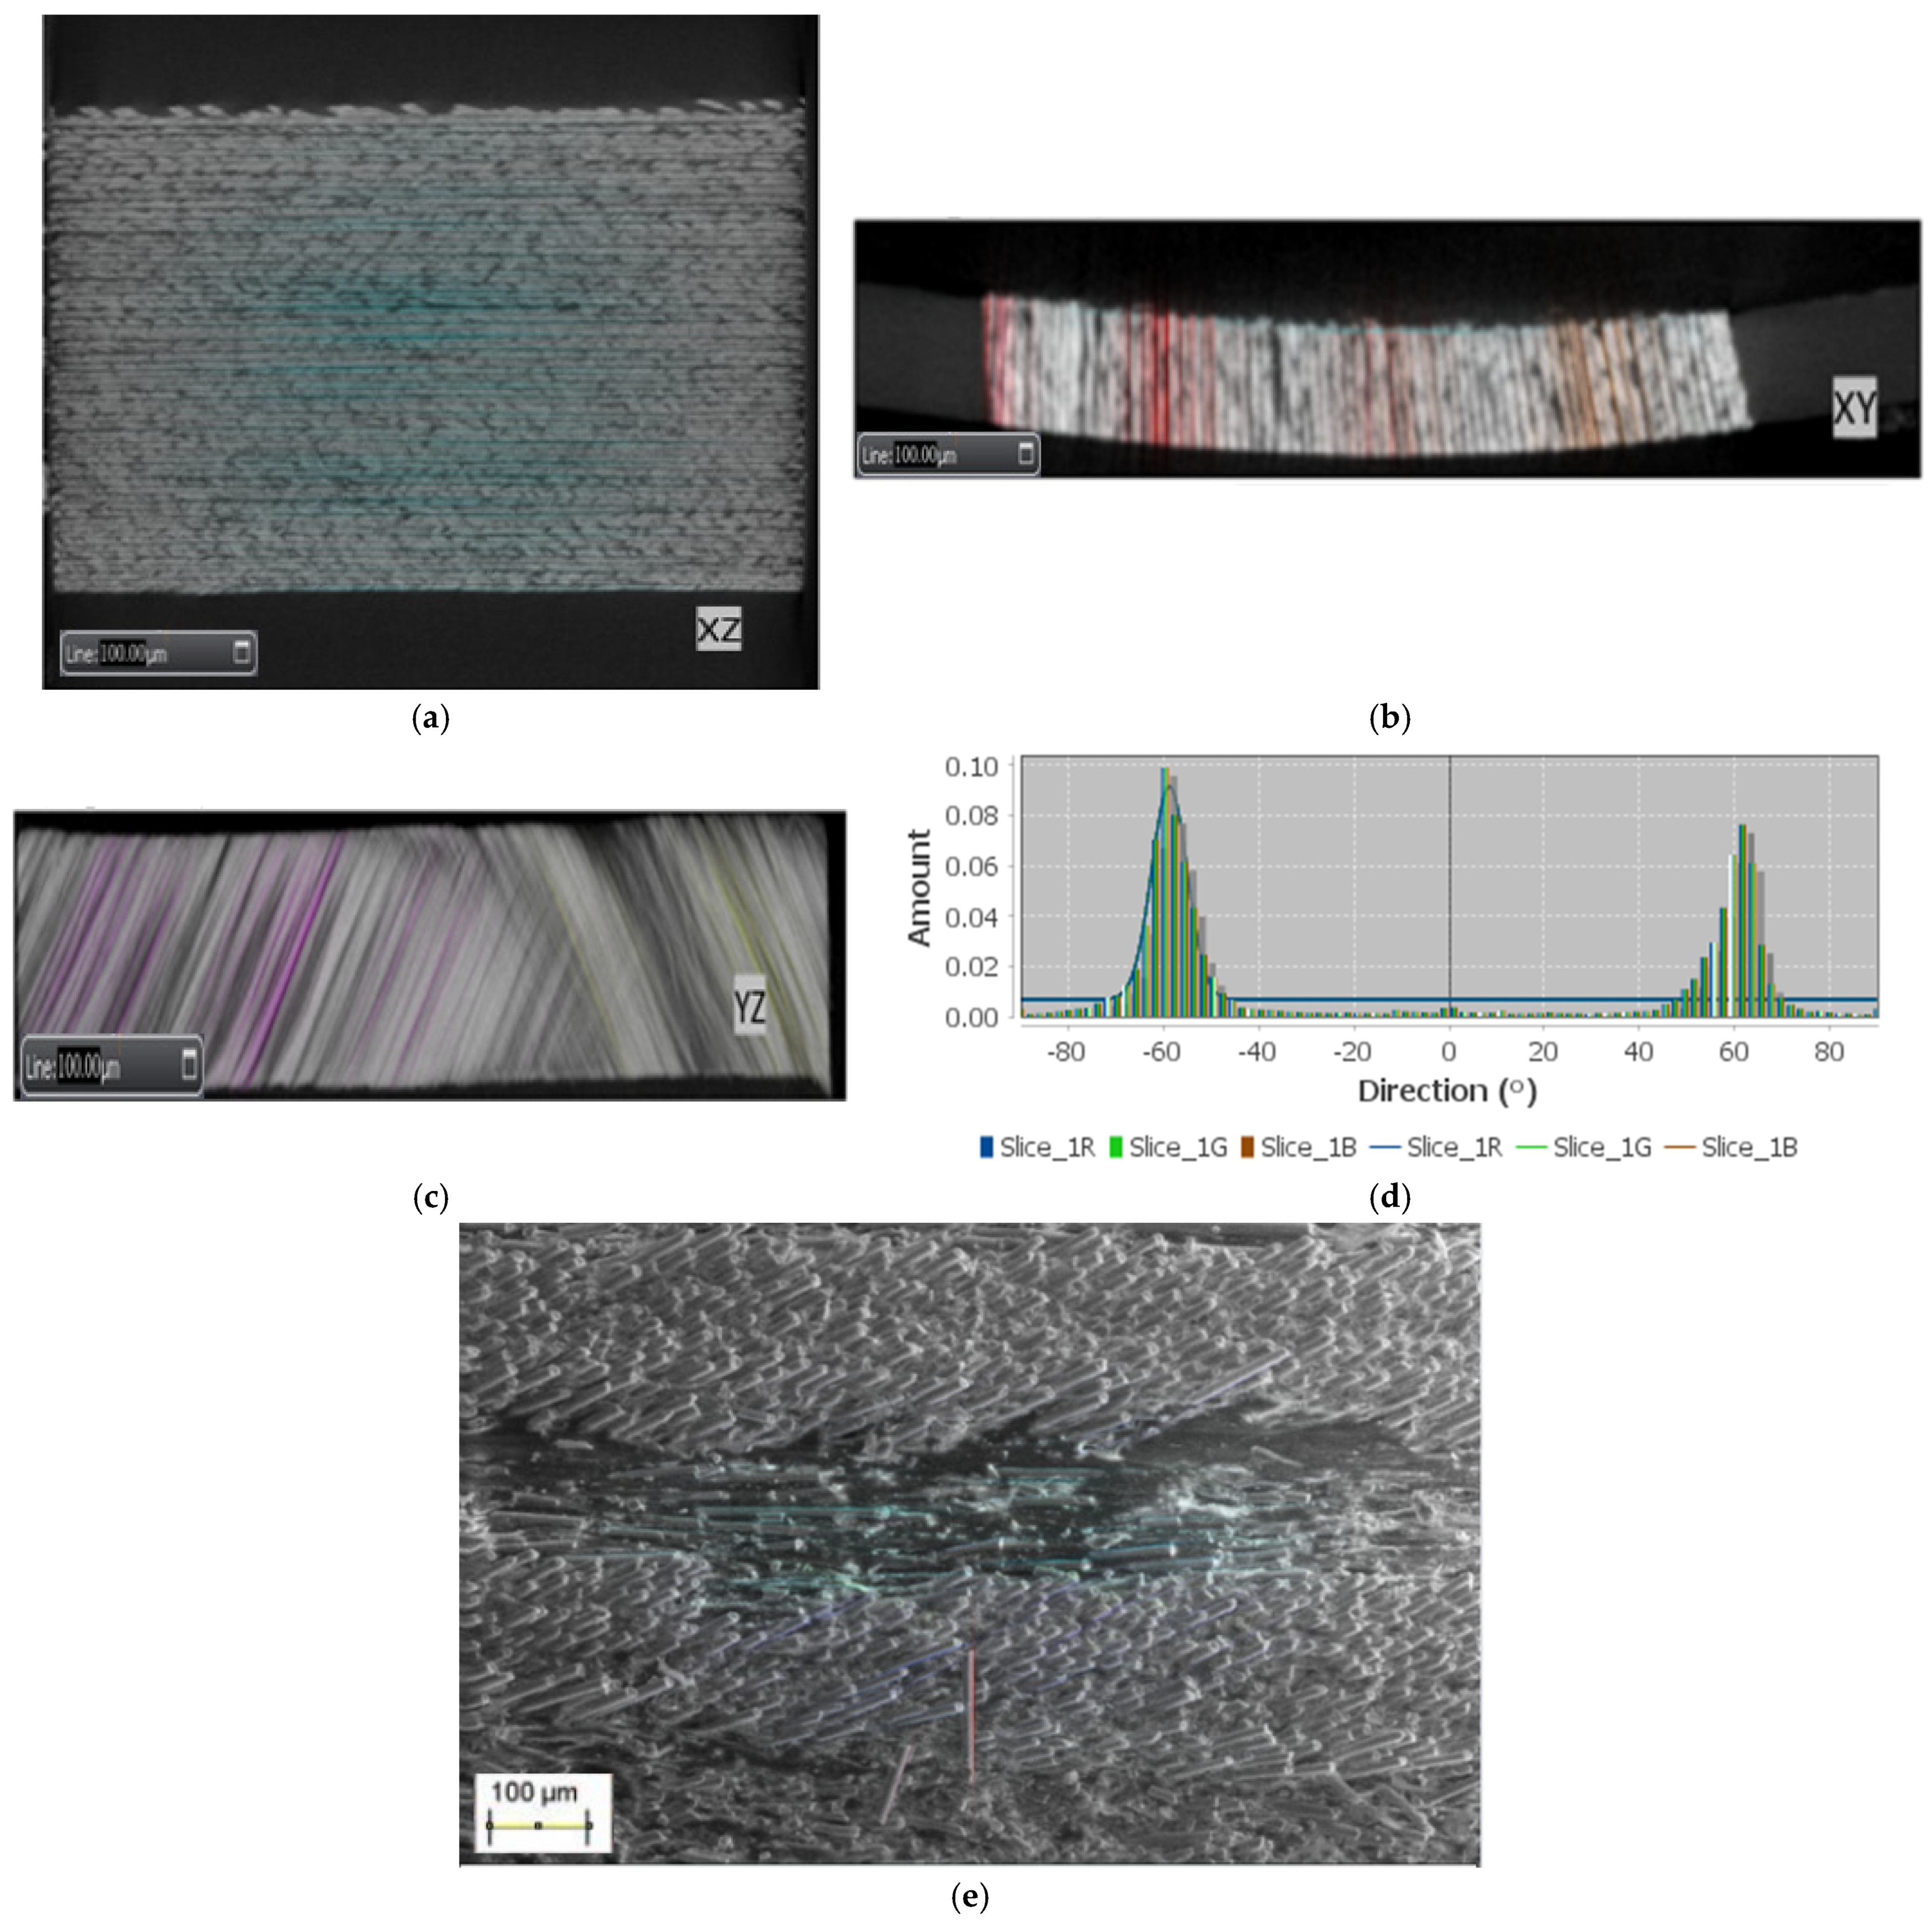
From Figure 6a–e, the analysis of the directionality confirms the orientation of the reinforced layer fibres. The samples were examined through SEM and XCT slices (in the XY, XZ and YZ axis). The micrographs from SEM and XCT slices in the XZ and XY axes provided a distinct peak within the range of 0–5° and ±45 and ±90°, respectively, with a seemingly Gaussian distribution, while the XCT slice for YZ (top view) axes is predominantly in the ±60° direction (58%). The directionality derived from the dataset and deviation confirms that the SEM matches the XY axis slice.
The directionality histogram displays the fibre distribution in varying directions from both the SEM and XCT characterization techniques. The angle of 0° infers that the fibre is aligned with the axis of the image while the angle of 90° for both negative and positive infers that the fibre is perpendicular to the image axis. The positive and negative orientation provides the layup details of the reinforced layer and consequently, any angle between 0 to ±90° is relative to the image direction.

3.2.2. Effect of Characterization Methods on Analyzing Void Distribution

Following the coupon density determination, the void volume fraction is then estimated through knowledge of the theoretical data for the sample. The micro-structural analysis of the samples was conducted to estimate the void content as well as to characterise the void size, location and shape. To estimate the void content, the micro graphs are processed by the Image J software to derive the filtered images. A colour threshold was used for image filtration to spotlight the porosity areas to assist in void content estimation. Figure 7a displays the 2D microscopy of the basic void content estimation and image processing.
From Figure 7a, large, elongated voids can be spotted as well as the smaller but greater sphericity of voids with scattered distribution throughout the volume of interest. This fundamental knowledge of the present voids within the sample aids in enabling a thorough analysis of the defects within the sample. The outcome of the void content analysis is collated in Figure 7b,c with their mean values and standard deviation for each sample tested by the two varying methodologies. The void ranged from 0 to 2.2%. Based on the traditional engineering application threshold, the void content threshold was set at the range of 0 to 2%. The results of the calculated voids from the two methodologies indicated that there is good concurrence. However, there are some contrasts for both methodologies in terms of the values.
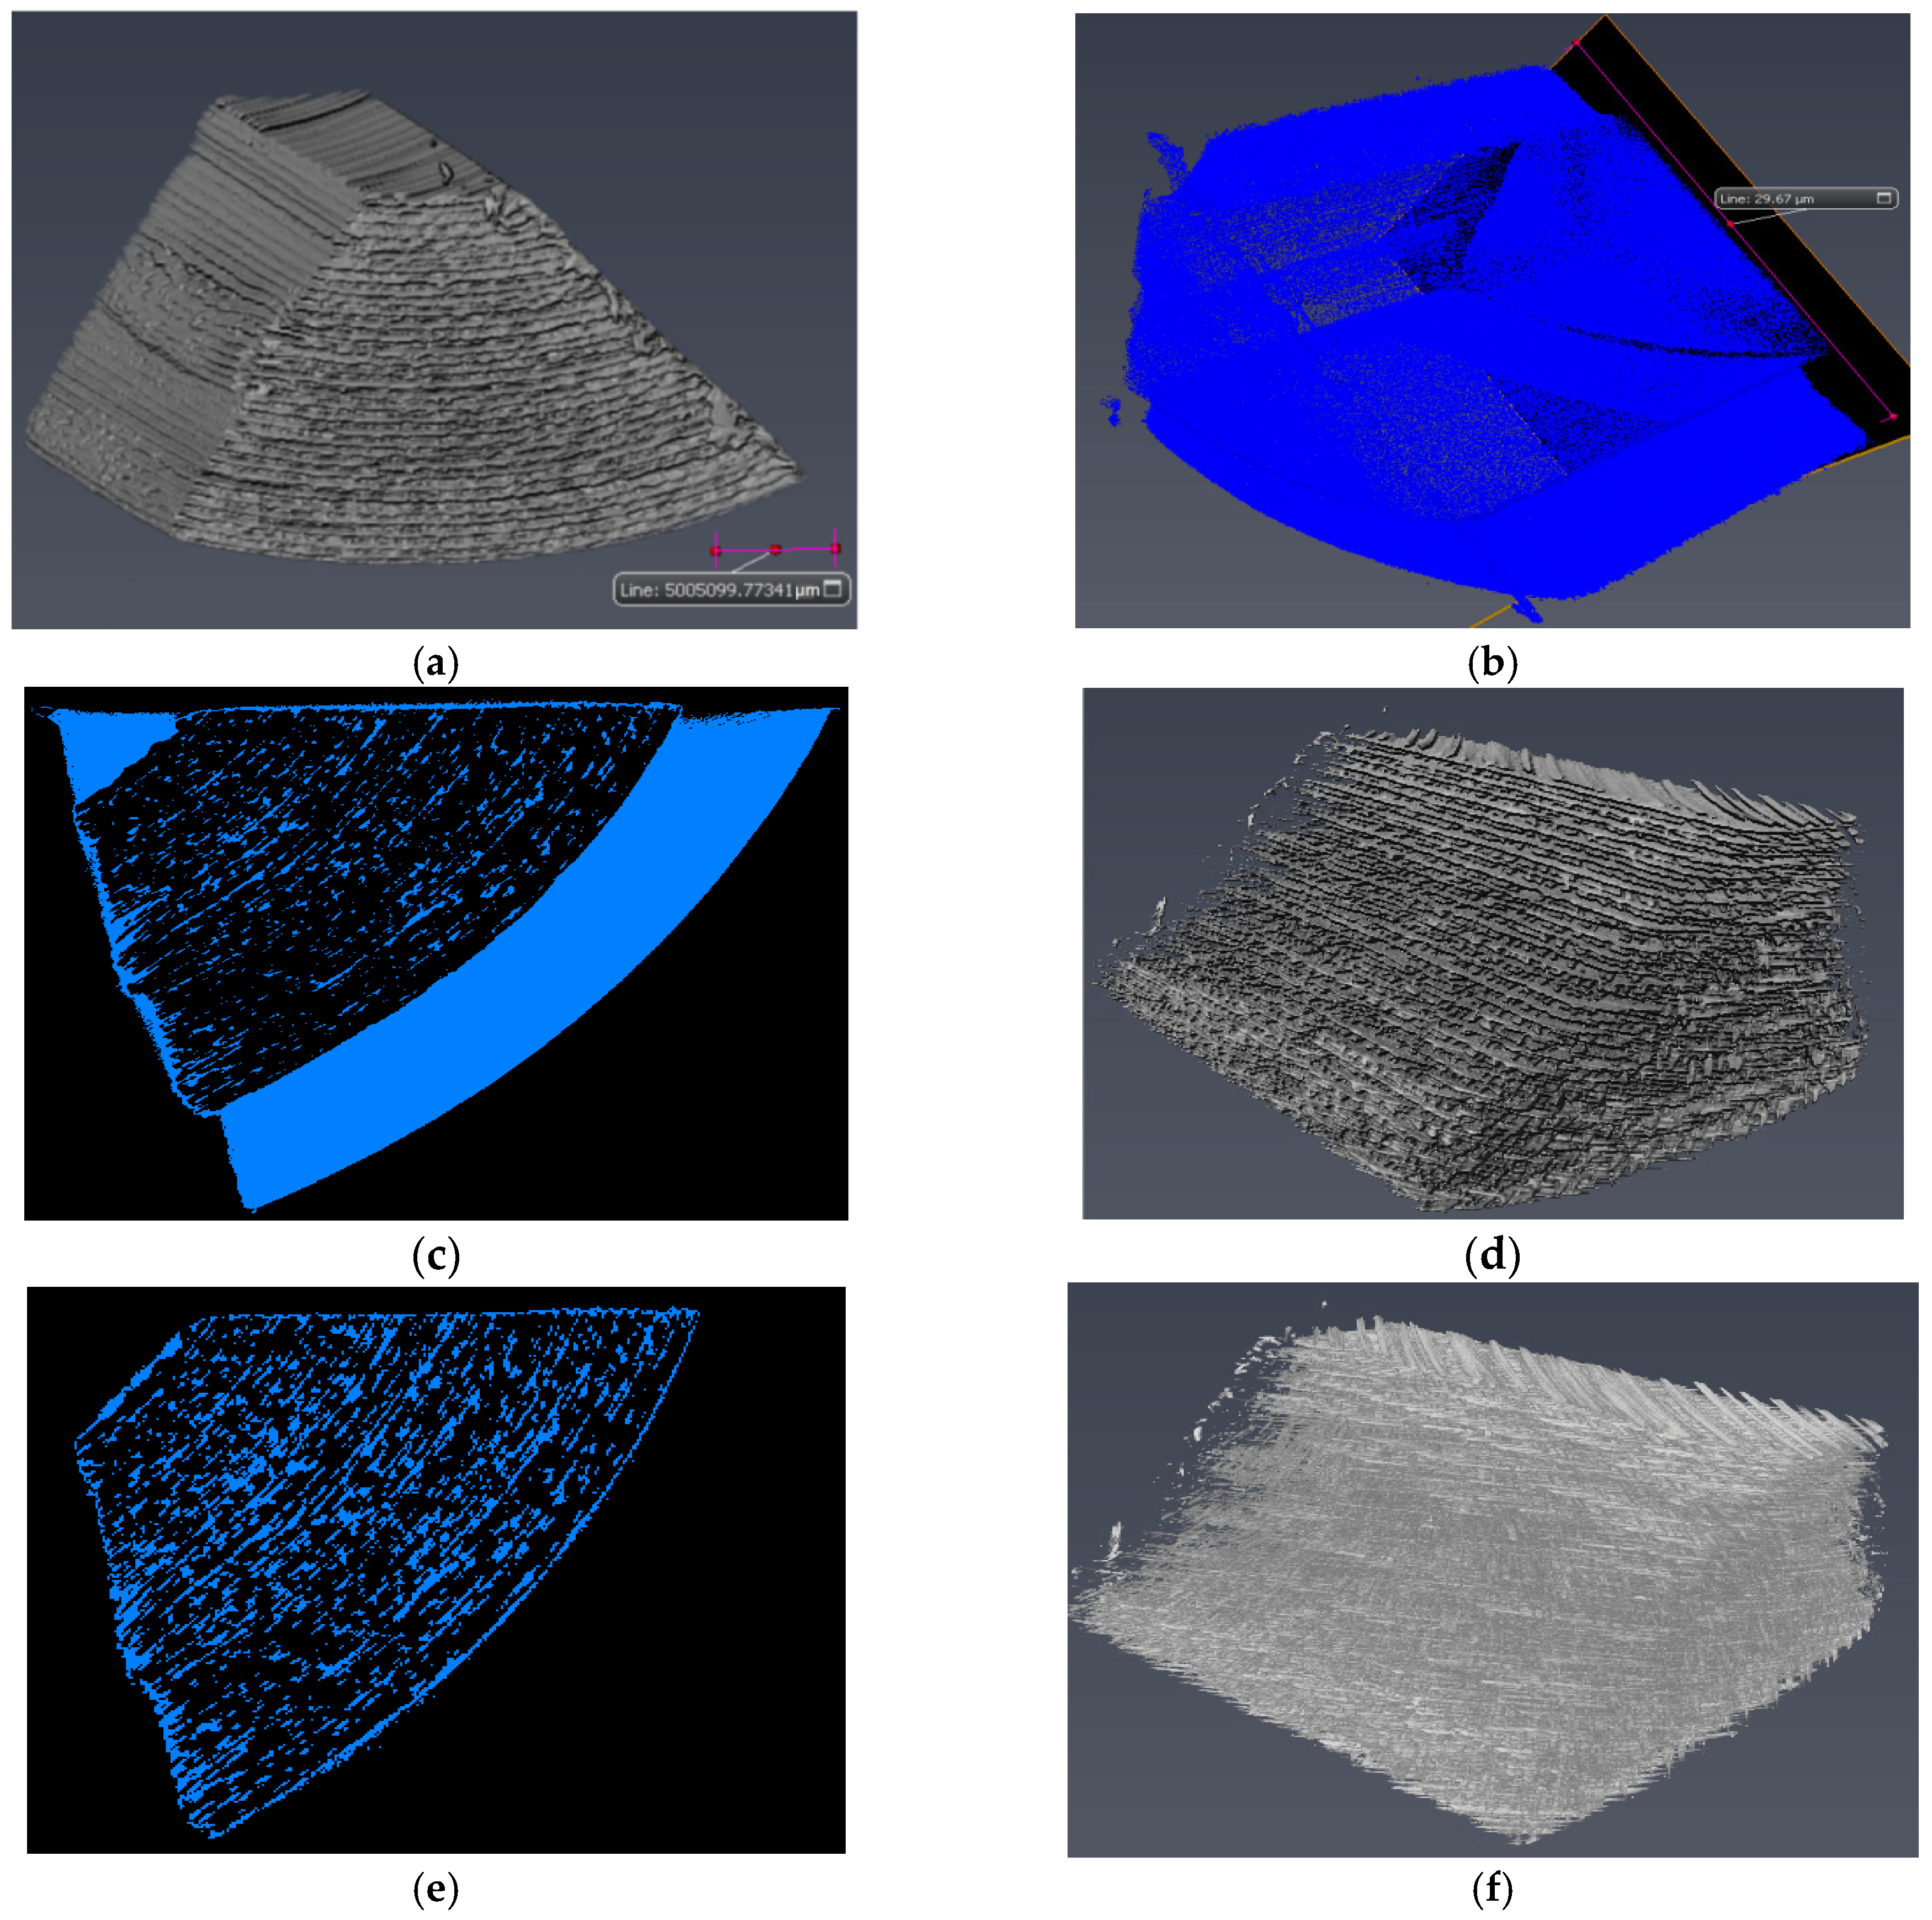
As previously stated, the reconstructed data taken from the CT scan were analyzed using the Avizo 2019 software (see Figure 8a). Initially, the median filter was used for noise reduction. A provided image data processing algorithm through the 3D kernel (key region) was used for the desired interpretation based on the dimensions of reconstructed data. Binarization of the images refers to transforming a greyscale image (original image) into a binary image where the label imaging will provide an interior and exterior material threshold. The dataset was also improved by converting the greyscale slices into ortho slices of data after thresholding and the integration of post-pore subtraction for the 3D set. Hence, binarization can be achieved here by the use of an interactive threshold, which is a more advanced automatic segmentation tool that enables the visualization of feedback (see Figure 8b–e).
Similar to the other techniques, the laminate layer is the most distinct layer across the samples, and this is attributed to the huge presence of glass fibre that had high X-ray attenuation intensity during detection. To separate bounding pores, reduce noise, and convert for data acquisition, the separate object module is added to separate the parts from each other at a marker extent of 1 to distinctly separate the parts and reduce the margin for thicker marking. The analysis module was used to ascertain the mean value for the number of voxels for the volume and area of each separate part. The label analysis module was then applied to extract statistical and numerical information, which includes the measurement of the parts in a histogram form which is displayed in Figure 8e,f. In Figure 8e, the pores detected by the software (areas bounded with blue) using the threshold grey value are obtained by the automatic software value, derived after surface determination with the selected area.
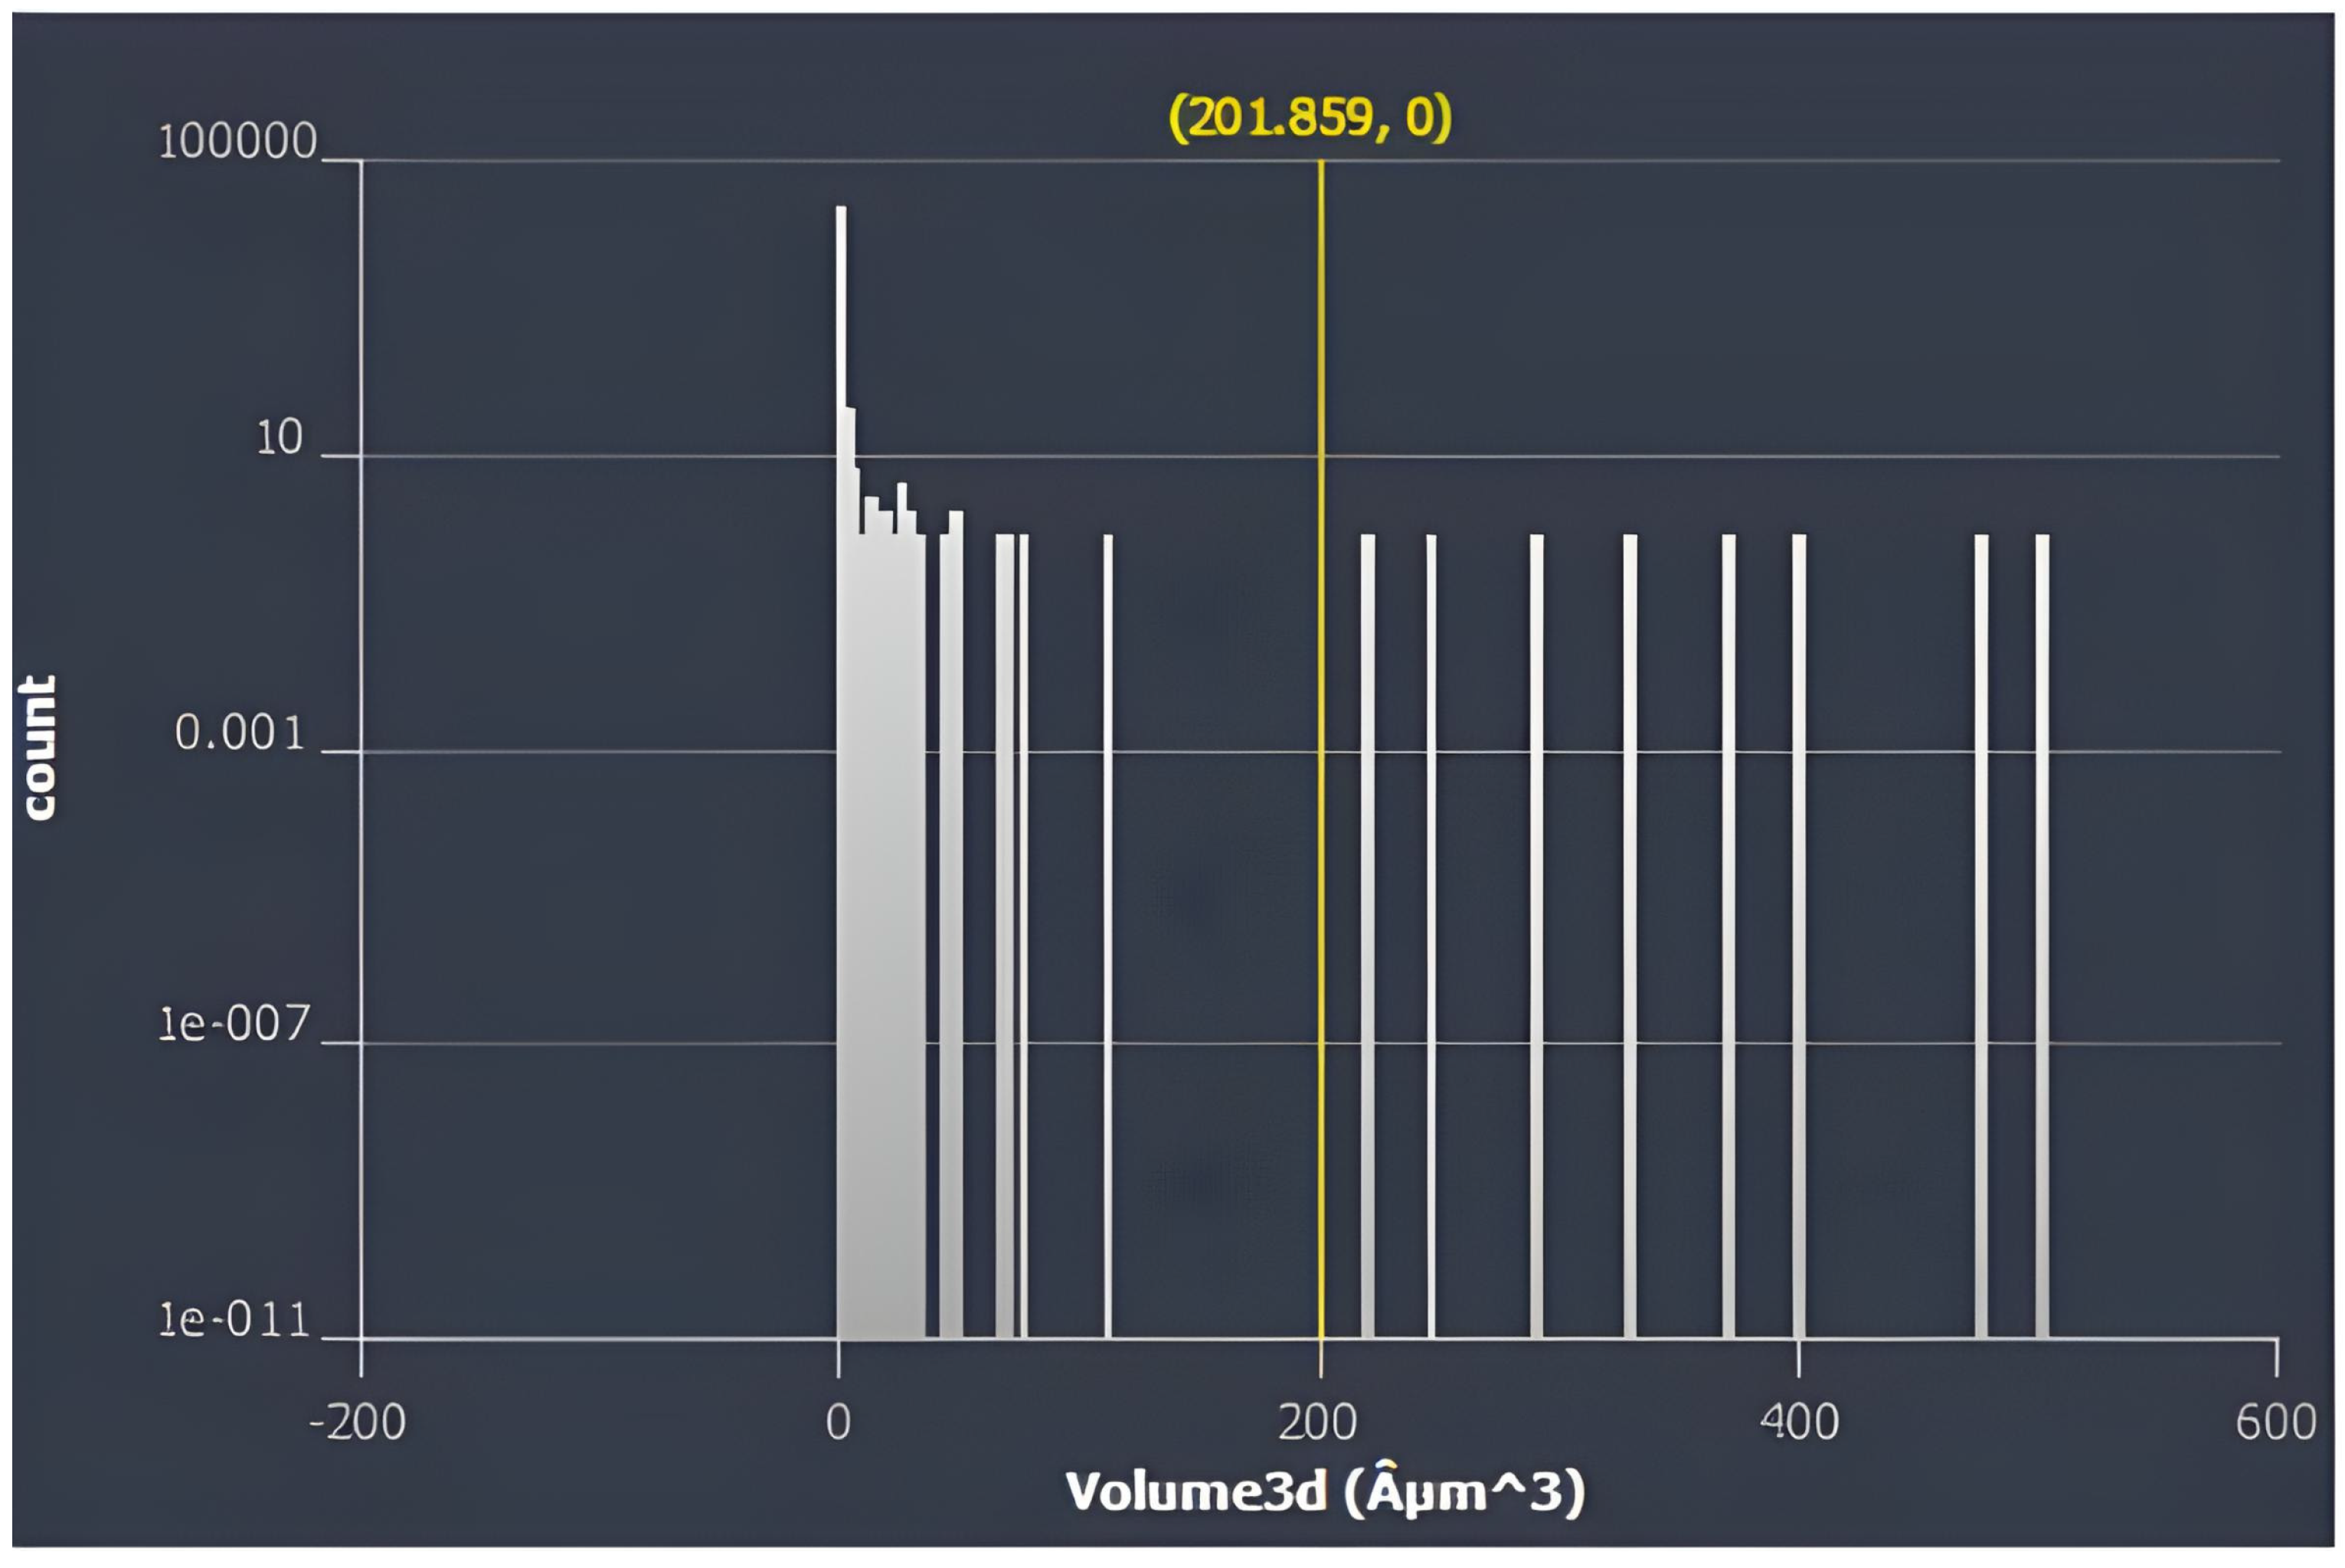
The software was solely relied on for segmentation here, as the study by Stamopoulos et al. [25] discovered that other segmentation techniques which include the Otsu method tend to underestimate porosity because they fail to detect some significantly smaller pores. To capture as many varying scales of pores, a threshold intensity range of 43 to 97 is applied. The mean of the detected porosity volume distribution (as displayed in Figure 9) and surface area is listed in Table 1.
Consequently, in this work, the automatic software’s threshold grey value was adopted. Regarding the lowest detectable size, the default value of 0.02 × 0.2 × 0.2 (µm) voxel size was used in order to avoid an overestimation of porosity due to the treatment of artefacts as pores. The porosity volume fractions for the sample are calculated to be 4.41 × 10⁻⁸ %. The value reveals that even the sample contains a nanoscopic number of pores. In this case, the porosity content comprises small pores of spherical and ellipsoidal shape and they can be quantified by identifying the equivalent diameter and the sphericity which is statistically presented in Table 1. The equivalent diameter measures the specific diameter of the spherical part of a similar volume. Therefore, sphericity is the ratio of the surface area of a sphere to the volume of the same particle. To achieve this using the software, the interactive threshold at an intensity range of 43–97 was set.
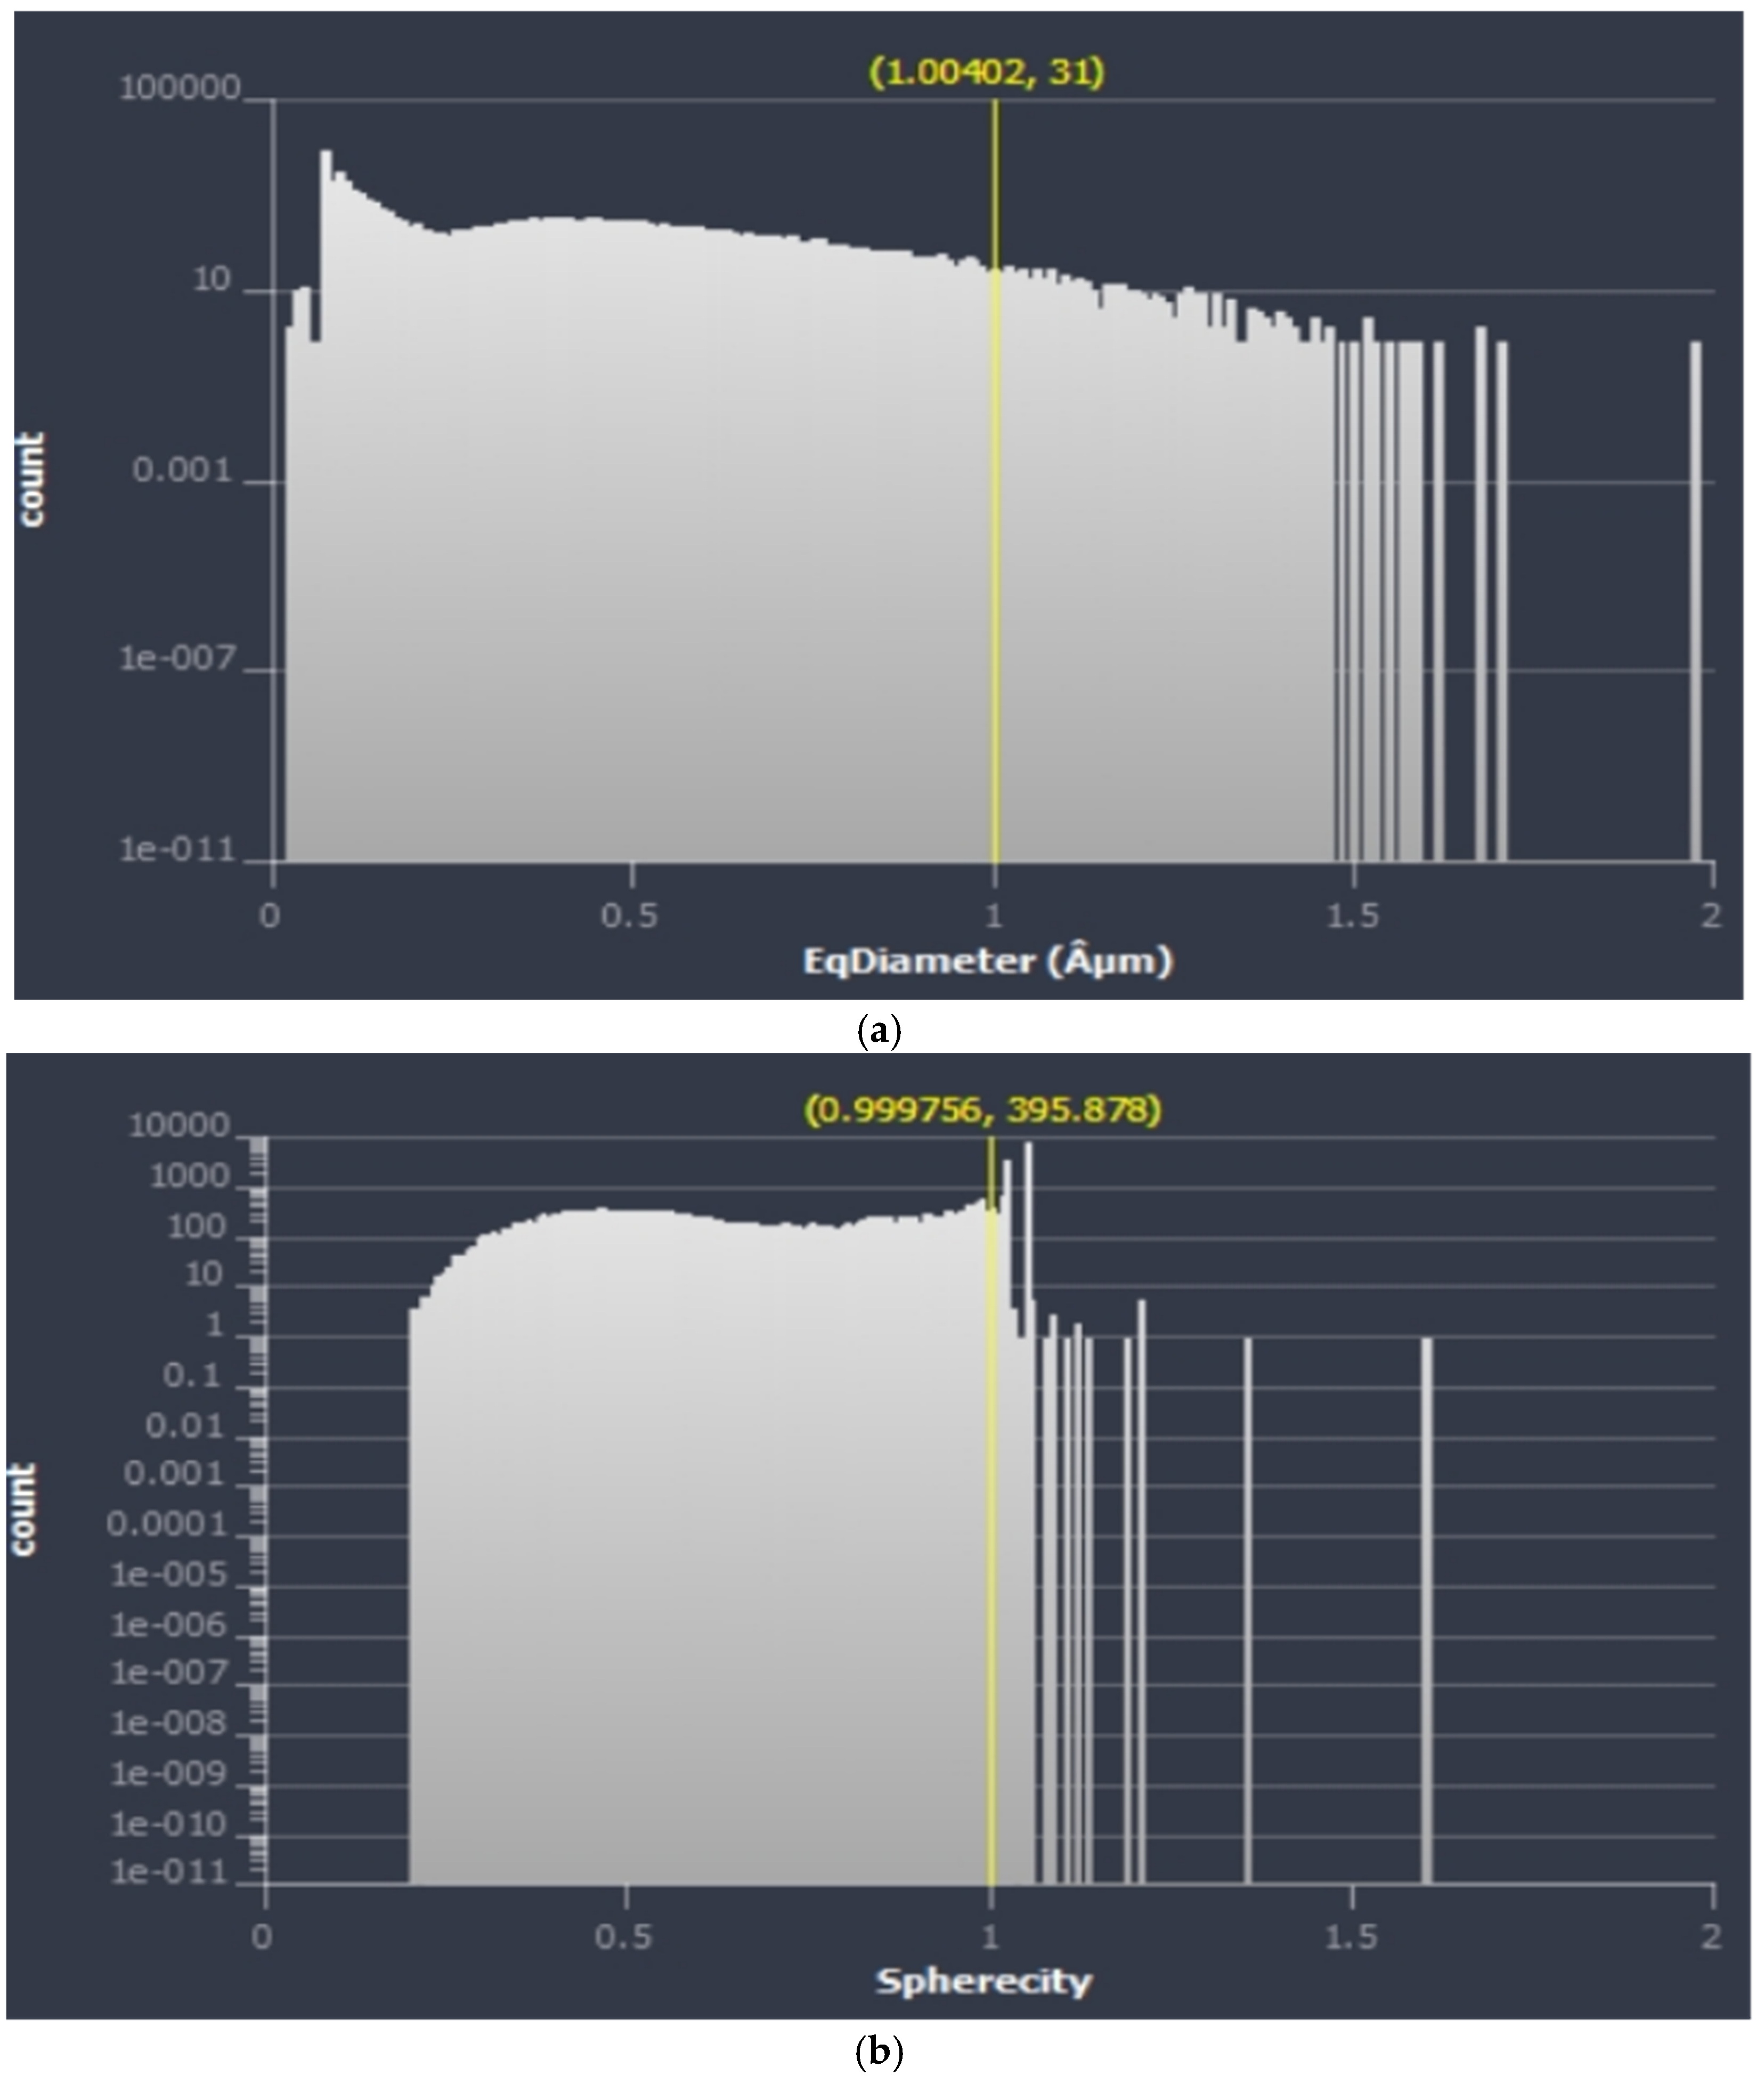
For the binary image, the intensity level is set as 1 for the pore and 0 for the material. For image post-processing, smaller objects are removed from boundaries for a smooth and fine object distribution where the pixel size is 1. Then, the filtration of images is carried out to reduce the appearance of artifacts. The separate object module is used to detect the surface with agglomerated parts which are subtracted from the original image and the marker extent is set to 1 to achieve similar as previously explained. The label analysis module assists in computing sets of measurements of each part of the 3D image. This generates a histogram (see Figure 10a,b) for a given measure which is plotted to create an exact representation of the measured distribution which is bound by Equations (2) and (3).
E q u i v a l e n t   d i a m e t e r = 6 × v o l u m e π 3
S p h e r i c i t y = π 1 / 3 ×   ( 6 × v o l u m e ) 2 / 3   A r e a
Figure 10b reveals the mean sphericity of each intra-ply void based on the equivalent area diameter for the laminate sample from conducting the XCT analysis. Using a threshold of 1 for both equivalent diameter and sphericity, with an increase in equivalent area diameter at the same volume, there is a linear reduction in sphericity. This implies that the voids elongate more with increasing diameter and this trend aligns with basic visual observations developed from the 3D rendered images as seen in Figure 8a. This alignment outlines the fundamental analytical visual analysis effectiveness. However, the analytical XCT analysis has the ability to generate the total volumetric void fraction and the overall number of voids while also providing the 3D locations and size of each void.
At isoparametric and equal conditions, any particle that is not a sphere will have a sphericity less than 1. Few small pores have a sphericity greater than 1 and this is because the area is computed at quota approximations, while volume does not use this approximation. The total sample is 14,625 mm3, and a total of 24,990 pores were identified, which is a large number of pores for the sample size. The mean of the detected porosity volume distribution (as displayed in Figure 9) and surface area is listed in Table 2.
The 3D XCT data directly provide size distributions in terms of the frequency of the equivalent spherical diameter per unit volume, and this yields a frequency of pores with all sizes being below 2 μm (Table 2). At larger sizes (~ 1.6–2 μm), a lesser number of pores were detected, where only four pores were detected with an equivalent diameter greater than ~1.6 μm. For pore sizes smaller than ~1.6 μm, there was also an increase in the frequency of the scans. Thus, below the resolution limit of the XCT, there is a large number of small pores that would be missed by this technique.
However, while these XCT data seem not to detect small pores lower than 0.1 μm diameter, by scanning the whole sample, they identify the fewer largest pores that will be most important in terms of fatigue life of the fibre-reinforced polymer composite pipe. Basically, the mean volume size of 0.258 µm3 (based on the frequency per volume) was recorded using XCT, and the bulk of the pores are <0.5 µm3 and few pores occur at 50 µm3 with the maximum size being 505.387 µm3.
Noteworthy, nanoscale void detection through these methods is limited due to the general limitations already highlighted. Further influential limitations are that the preparation of the samples might have compressed the voids or deformed the surrounding matrix, which causes under-detection. Also, the technique heavily relies on surface observation which impeded the evaluation of voids through the thickness of the material. For XCT, the resolution constrained by the voxel size (0.02 × 0.2 × 0.2 µm) limited the capability to reliably resolve nanoscale voids. This is due to the contrast between the voids, fibre and matrix, which significantly obscured the smaller voids during reconstruction. The use of bulk and theoretical density makes it impossible to distinguish between micro and nanoscale voids as well as their spatial distribution. The best to be obtained from this method is based on the average void content, which renders nanoscale voids undetected.
For composites with complex internal structures, voids in the nanoscale may be undetected and create an overestimation of the TCP performance. Furthermore, there is a huge reliance on the computational capabilities of imaging datasets. Also, we must consider that high resolution is required for enhanced defect detection, which significantly increases data acquisition times and computational features. This significantly affects the defect quantification analysis of complex structures. Through-thickness defects will also be challenging to quantify due to the slice-by-slice (voxel) analysis and cause the obscurity of void propagation and interconnectivity within the structure. Some possible means of resolving these limitations, apart from integrating other complementary void analysis techniques, are to optimize the scan resolutions and segmentation procedures. The most critical zones should also be the focus, which was attempted in this research by focusing on the reinforced layer.
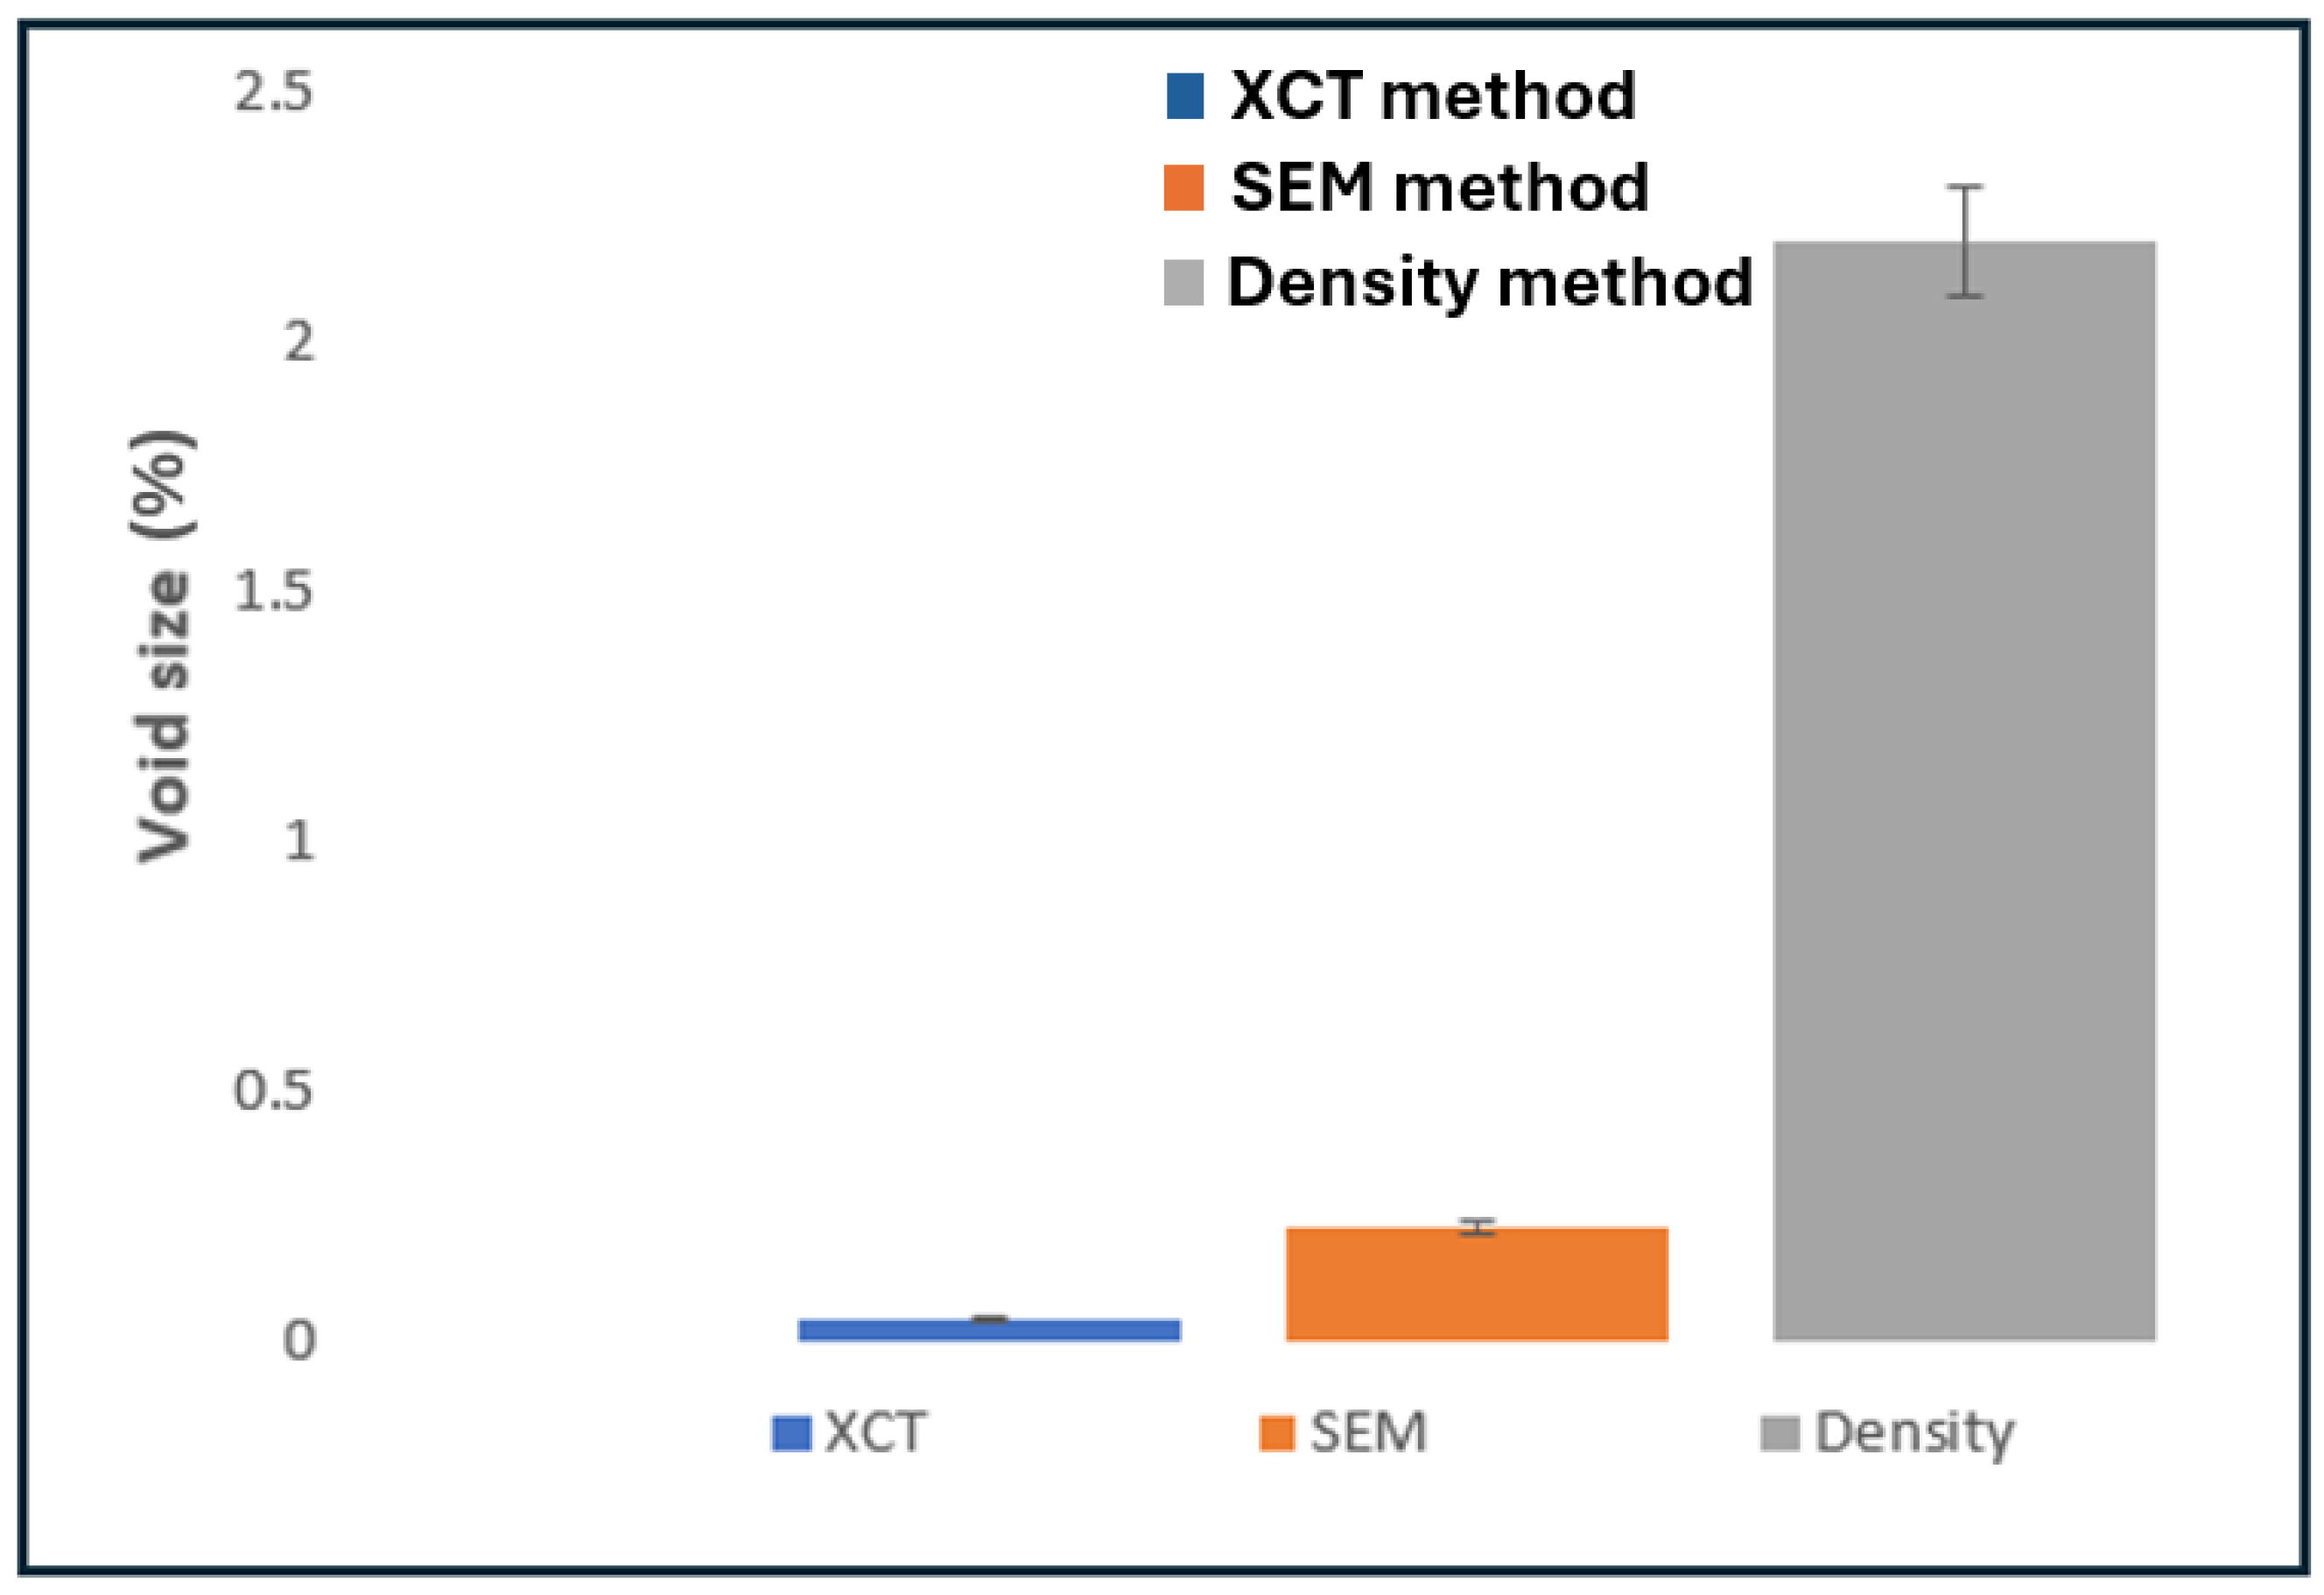
Figure 11 displays the mean estimated void volume fraction and standard deviation of the laminate samples from each technique. The mean void size deduced from the techniques ranged between 4.41 × 10⁻⁸% for XCT to 2.2% (from SEM 0.23% and from density method is 2.2%.), and this can be regarded as negligible for the sample volume and innate errors for each method. The slight variation between the void characterization method is vital in handling high-quality and high-performance applications. The obvious difference between the characterization methods is the great standard deviation of the Archimedes void fraction. The standard deviation of the microscopy (0.548) is less than that of the XCT (0.119), and the XCT is roughly similar to that of the Archimedes technique (0.115). This is attributed to the innate cross-section bias and exposed the differences in the possible precision with the use of the microscopy method.
The trend deduced from the microscopy and XCT indicates that as the void volume grows, they become more elongated, but both methods revealed that most of the voids constitute a minority of the total void fraction. This aligns with the findings of Little et al. [14]. However, for this study, the volume is constant, particularly based on the XCT result. The analysed characterization methods used in this work present the precision and limitation constraints. For example, microscopy is a destructive method, the Archimedes density method needs prior knowledge of the material properties as well as the material composition and, for the XCT, only a small sample size is required. Due to the standard availability of the Archimedes method, the relationship between void content with other factors such as the mechanical properties or processing conditions can be established. However, based on the innate error of the Archimedes method, this experiment proves that it has a relatively broad standard deviation and lacks the ability to derive significant data for individual voids. Although the use of microscopy can measure the vital details of the individual voids, the precision and reliability of this method are confined to the section-bias errors. XCT showed better reliability, a lower standard deviation, improved reliability and a satisfactory void characterization method. However, the XCT is limited to the smaller sample size, technology limitations and technique complexities. Additionally, the precise anisotropic influence of the fibres in the reconstructed dataset based on their orientation or misalignment can be quantified with further studies, especially for composite structures that have been influenced by mechanical, thermal, and other environmental factors.
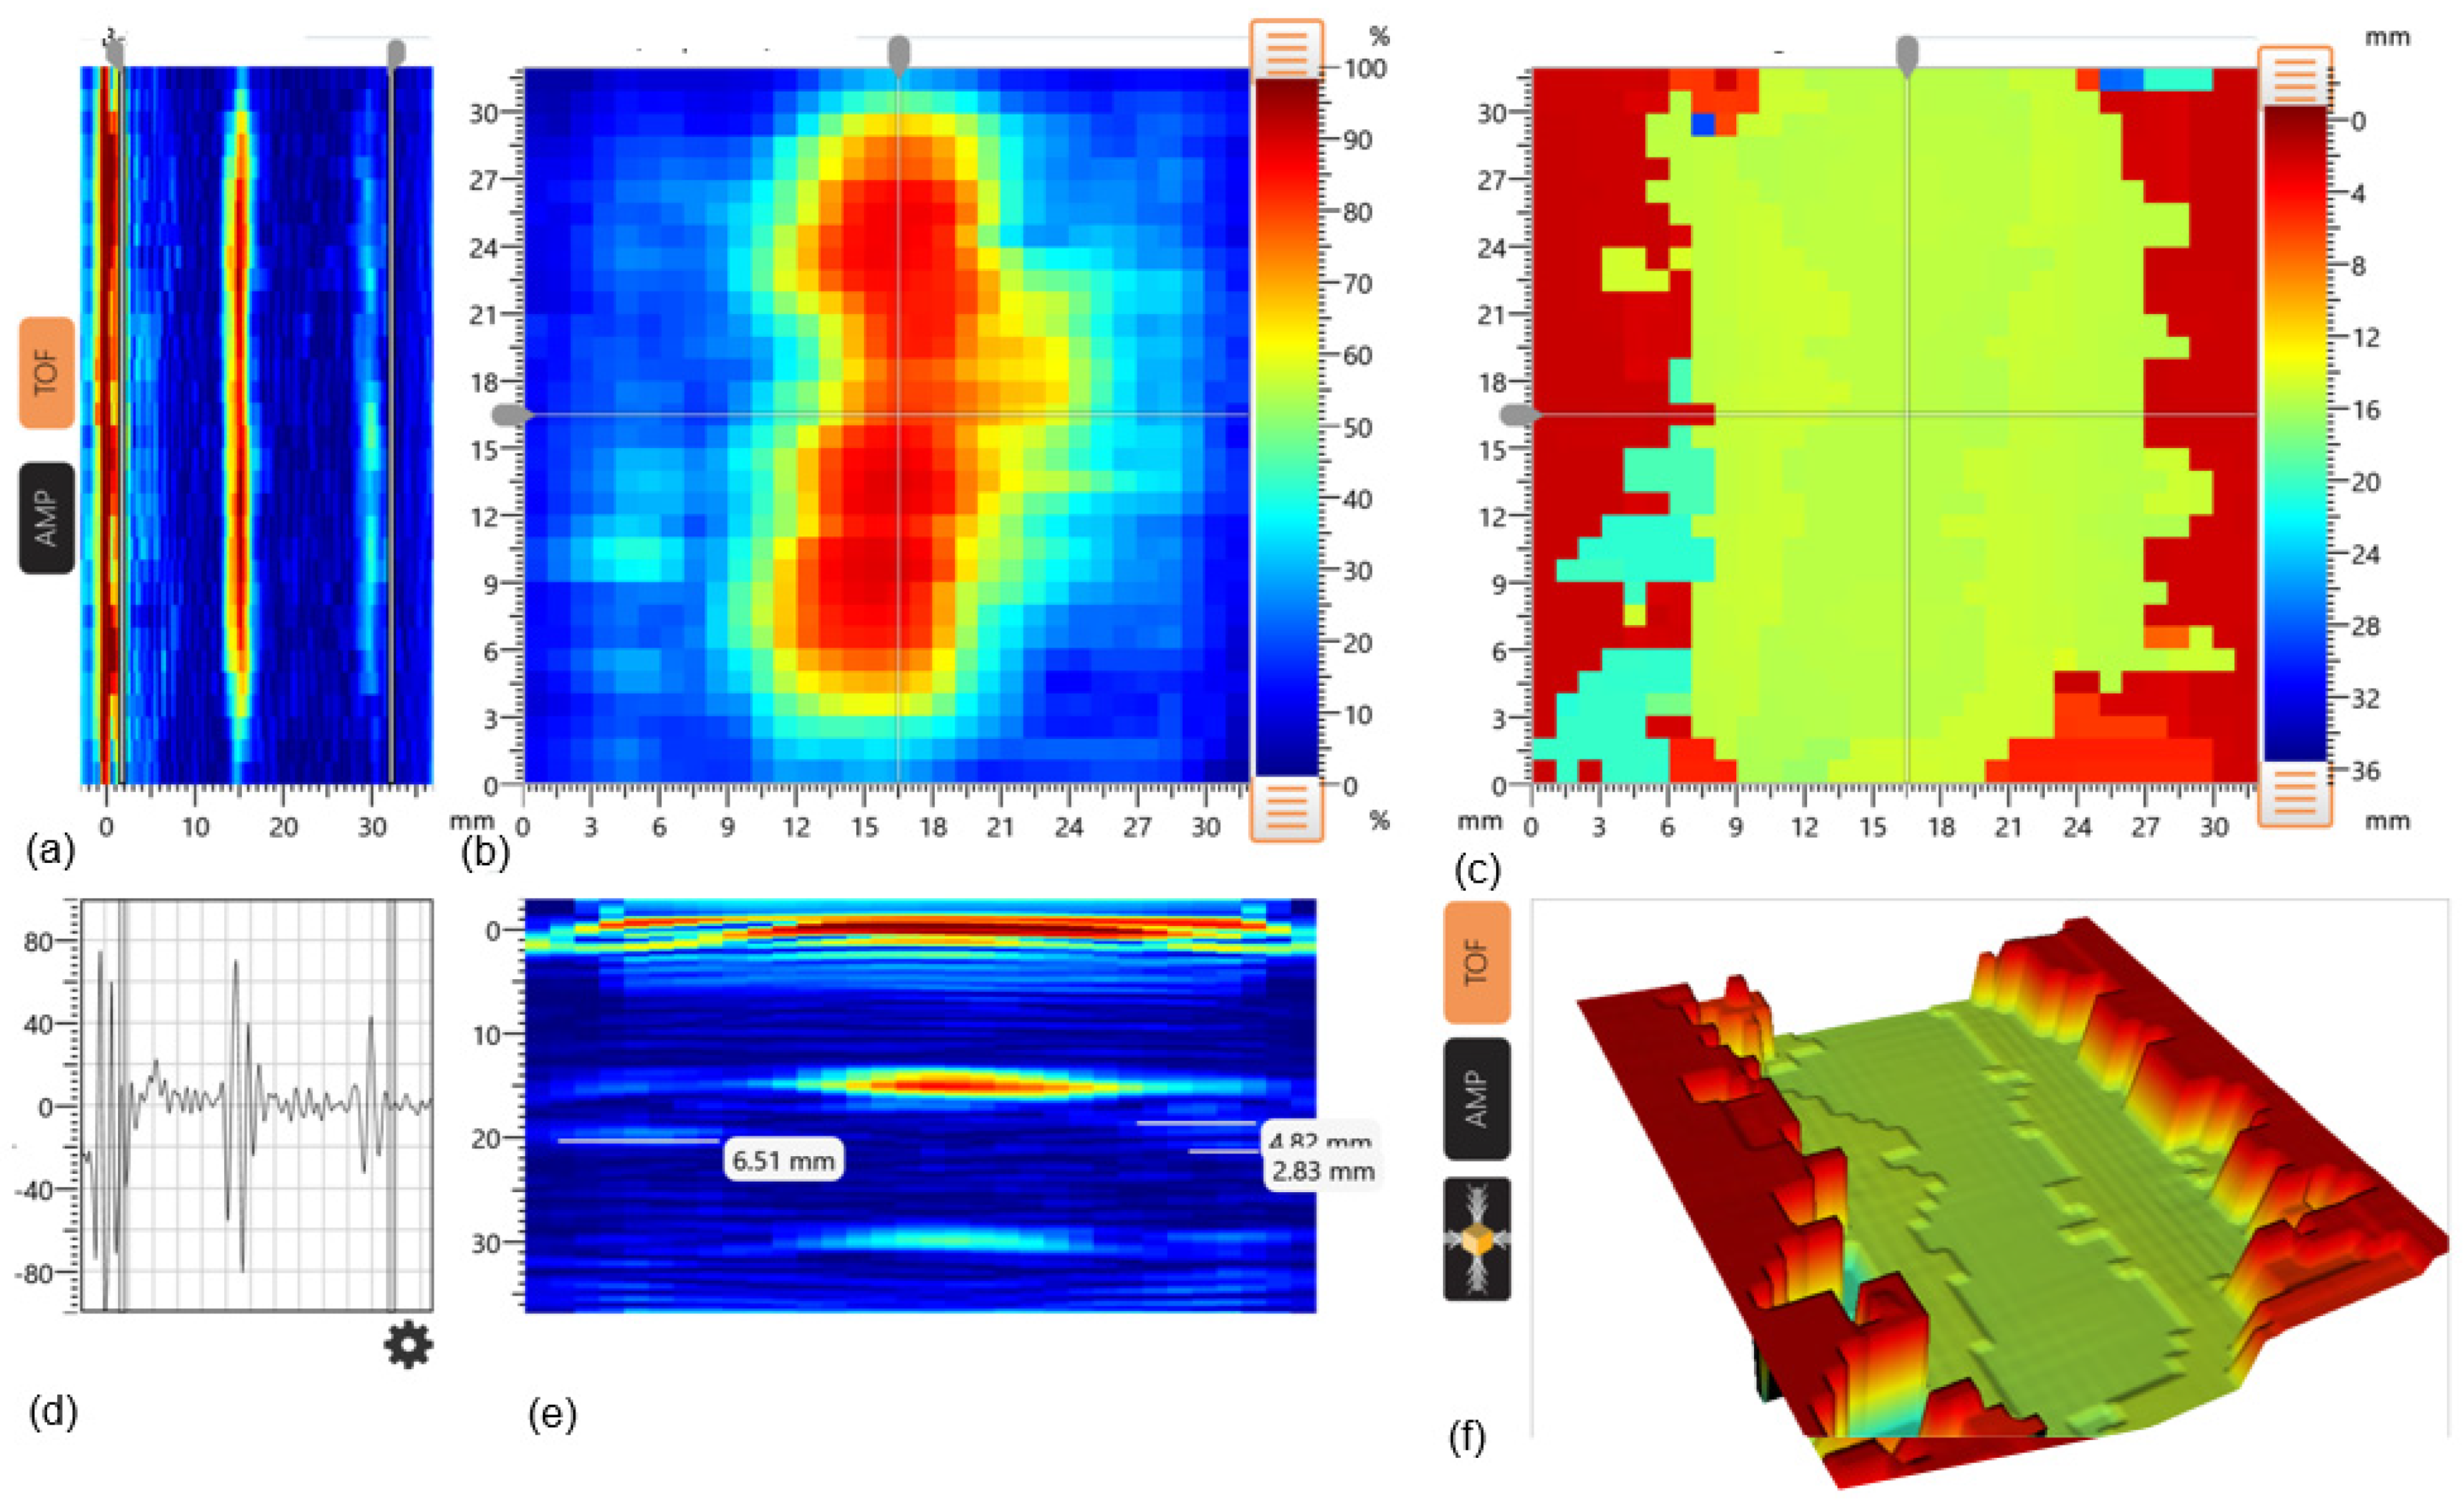
For pristine TCP ultrasonic inspection in the initial case, the glass fibre HDPE pipe section described earlier for pristine conditions was considered. The curved sample was inspected directly on the surface, which implies that more emphasis is on the bent region due to transducer placement as displayed in the C-scan amplitude and TOF in Figure 12. Every transducer element generates an electronic signal that can be digitized and displayed in the A-scan. The B-scan image is produced from numerous A-scans placed close to each other, which is symbolized through a 1D array of transducer elements and portrays the cross-section of the inspected material. In addition, from the B-scans, the profile of the sample is visible as it varies across the pipe perimeter. From Figure 12, the B-scan from varying circumferential positions of the sample where there is a change in the material thickness is obvious. This does not directly influence the result from the inspected samples, which signifies that this technique is capable of handling differences in the thickness of the material. Also, a colour scale is utilized in creating the B-scan, as the high amplitude is assigned an end of the colour scale.
From Figure 12a–f, the B-scan can be observed to have high amplitude values with a red colour, while the minimum amplitude value is blue. The B-scan can also reveal the reflections, thereby estimating the depth of damages or voids. The image of the amplitude C-scan is developed from the maximum of all the B-scan amplitudes from the transducer and provides a direct display of the material from an inspection perspective. Using this device, this scan is based on the maximum amplitude value of 128 × 128 A-scans (16,384). These amplitude values are assigned colours from the colour scale. The C-scan TOF image is produced based on the time-of-flight values derived from the maximum amplitude of the A-scans from the transducer and provides a direct display of the inspected region of the material. The colours depict the void or depth reflection. Similar to the C-scan, the image is developed due to the TOF value of maximum amplitude for the A-scans for all elements (128 × 128). The minimum depth of 0 mm is allocated red, while the maximum depth is blue. Every TOF value is assigned a colour on the colour scale, which, in terms of damage or void quantification, is the reverse of the amplitude values. The 3D images are dependent on the TOF values, which can be presented as either a 3D TOF image as displayed in Figure 12f or a 3D amplitude image. Through the 3D images, detailed visualization of defects or damage is provided.
The pipe layers are distinctly detected by the change in amplitudes and light spots within the thickness of the back wall for the A and B-scans. Although some regions of interest can be seen from the B-scan in mm, a slight adjustment of TOF signal contrast with increased weight on the transducer around the depth of interest increases the ability to flag inherent flaws that fall within the limits of the camera inspection depth range. The signal from this sample has relatively low amplitude through the material thickness (green and blue colours) and the back wall of the pipe is observed at the scan line with the red colour section of the C-scan indicating the hollow region beneath the pipe sample. It is expected that a reduction in sample thickness will decrease the details. However, the detection ability can be steadily kept at an elevated level by adding time correction gains to the amplitude signals for the camera. Through the ultrasonic C-scan, the horizontal brief lines can be termed noisy pixels. The scanned images reveal the presence and estimated location of voids. However, these results mainly exhibit the superimposed influence of the void in the cross-sections and are unable to provide adequate details to characterize the void location across the through-thickness axis. Moreover, there is a strong possibility that the sample absorbed the couplant, which influenced the scans by serving as an ultrasound absorber at the interlayer regions, causing a decrease in reflected signal amplitude.
The elongated and narrow voids were not provided by the scanned image and the borders of the void regions were difficult to distinguish. However, the XCT result is more comprehensive. Also, only void areas that are large and have sufficient continuity were observed with scanned images. This is partly attributed to the relatively small size of the void region and the ultrasonic attenuation not being observable. Chai [22] stated that not only do the experimental settings affect void analysis, but other factors such as the geometry, size and distribution of the voids are influential. Therefore, the ultrasonic C-scan can provide the superimposed distribution of voids, but in comparison to other defects such as delamination, using this method to assess small voids is inefficient. This report recommends the combination of both techniques in characterizing the manufacturing defects as the XCT can provide qualitative and quantitative analysis of these defects, while the ultrasonic C-scan can be used to confirm the XCT results to an extent.

4. Conclusions

The manufacturing process of TCP introduces defects that can affect their performance. These defects include voids, misalignment, and delamination, leading to issues like thermal shrinkage, poor adhesion, stress concentration, and layer separation. Therefore, there is a growing need for effective NDT techniques to evaluate the impact of manufacturing defects on the mechanical performance of TCP. The aim here is to establish a connection between identified defects through NDT and quantify internal defects at a microscale, understand damage mechanisms, and enhance quality control. Overall, this study seeked to enhance the understanding of the relationship between NDT and defect monitoring techniques in TCP, contributing to improved design, manufacturing, and performance prediction in the field.
In terms of defect quantification, the density method was also incorporated in determining the void volume fraction. Microscopy analysis was conducted on both pristine and tested samples using optical micrography and advanced techniques like XCT to establish the fibre orientation. XCT scanning and reconstruction provided 3D data for characterizing porosity and identifying initial failure locations. Ultrasonic inspections were performed using Dolphicam, focusing on both pristine and tested conditions, with an interest in damage analysis in various sample sections. In order to understand the surface morphology of the material, optical microscopy was used. The material’s resistance to delamination was confirmed during pipe stiffness testing. Optical microscopy was chosen for sample preparation, as the brittleness of the material made other pre-treatment methods, like etching and polishing, challenging.
  • The interlayer between the reinforced and inner layers exhibited good consolidation, although a discontinuity was observed. These microscopy results confirmed that the material had a solid wall construction.
  • The XCT dataset revealed the fibre orientation distribution in different axes, with SEM and XCT showing similar orientation patterns. The analysis confirmed that the SEM aligned with the XY axis slice, with predominant fibre orientation around ±45° and ±90° but the placement orientation was deduced to be ±60°.
  • Three non-destructive methods, immersion (Archimedes), 2D microscopy, and XCT, were used to estimate void content. All methods were compared, and while they could not provide precise void content values, they offered a comparative approach.
  • Archimedes’ density method was applied as an alternative for estimating the void volume fraction. Microscopy involves image processing to estimate void content and size.
  • The XCT technique was introduced to detect voids by reconstructing XCT dataset scans. XCT provided 3D visualization of internal structures and allowed for void quantification.
  • The analysis revealed that the void content ranged from 0–2.2%, with good agreement between microscopy and Archimedes’ methods.
  • However, differences could arise due to manufacturing methods. XCT had the advantage of providing detailed information on void size and location.
  • The key finding based on the XCT and microscopy result is that there is an alignment that, at constant volume, increases in void diameter, increases the elongation and directly reduces sphericity.
  • Both methods also revealed that most of the voids constitute a minority of the total void fraction. The study also included ultrasonic inspection of the TCP in pristine condition.
To mitigate the formation of the manufacturing defects, it will be beneficial to have an idea of the processing window of the material, and this can only be achieved by conducting a thorough material characterization of the TCP materials.

Author Contributions

All authors listed have significantly contributed to this article’s development and writing. All authors have read and agreed to the published version of the manuscript.

Funding

This research received no external funding.

Institutional Review Board Statement

No human subject was used for this study.

Informed Consent Statement

Not applicable.

Data Availability Statement

Data sharing is not applicable to this article.

Acknowledgments

This report was made possible with the support of Subsea 7, SP-Advanced Engineering Materials Pvt. Ltd., and the Scottish Research Partnership Engineering (SRPE, project title ‘Characterization of Manufacturing Defects in Thermoplastic Composite Pipes’). We also wish to acknowledge the support of the Henry Royce Institute for O.O through the Royce Ph.D. Equipment Access Scheme enabling access to Henry Moseley X-ray Imaging Facility at Royce@Manchester; EPSRC Grant Number EP/R00661X/1.The data used, observations made, and views expressed are solely the responsibility of the authors.

Conflicts of Interest

The authors declare no conflicts of interest.

References

  1. Sulu, I.Y.; Temiz, S. Mechanical characterization of composite pipe systems joined using different radii pipes subject to internal pressure. Mech. Based Des. Struct. Mach. 2020, 51, 566–582. [Google Scholar] [CrossRef]
  2. Yang, B.; Xuan, F.Z.; Wang, Z.; Chen, L.; Lei, H.; Liang, W.; Xiang, Y.; Yang, K. Multi-functional interface sensor with targeted IFSS enhancing, interface monitoring and self-healing of GF or EVA thermoplastic composites. Compos. Sci. Technol. 2018, 167, 86–95. [Google Scholar] [CrossRef]
  3. Toh, W.; Tan, L.B.; Tse, K.M.; Giam, A.; Raju, K.; Lee, H.P.; Tan, V.B.C. Material characterization of filament-wound composite pipes. Compos. Struct. 2018, 206, 474–483. [Google Scholar] [CrossRef]
  4. Okolie, O.; Latto, J.; Faisal, N.; Jamieson, H.; Mukherji, A.; Njuguna, J. Manufacturing Defects in Thermoplastic Composite Pipes and Their Effect on the in-situ Performance of Thermoplastic Composite Pipes in Oil and Gas Applications. Appl. Compos. Mater. 2022, 30, 231–306. [Google Scholar] [CrossRef]
  5. Fu, Y.; Yao, X. A review on manufacturing defects and their detection of fiber reinforced resin matrix composites. Compos. Part C Open Access 2022, 8, 100276. [Google Scholar] [CrossRef]
  6. Talreja, R. Failure Analysis of Composite Materials with Manufacturing Defects; CRC Press: Boca Raton, FL, USA, 2024. [Google Scholar]
  7. Ashebir, D.A.; Hendlmeier, A.; Dunn, M.; Arablouei, R.; Lomov, S.V.; Di Pietro, A.; Nikzad, M. Detecting Multi-Scale Defects in Material Extrusion Additive Manufacturing of Fiber-Reinforced Thermoplastic Composites: A Review of Challenges and Advanced Non-Destructive Testing Techniques. Polymers 2024, 16, 2986. [Google Scholar] [CrossRef]
  8. Mohd Tahir, M.F.; Echtermeyer, A.T. Phased Array Ultrasonic Testing on Thick Glass Fiber Reinforced Thermoplastic Composite Pipe Implementing the Classical Time-Corrected Gain Method. J. Nondestruct. Eval. 2024, 43, 74. [Google Scholar] [CrossRef]
  9. Ochana, I.; Ducobu, F.; Homrani, M.K.; Notebaert, A.; Demarbaix, A. A Comparative Study of Non-Destructive Testing Techniques: Active Thermography versus Shearography for 3D-Printed Thermoplastic Composites Reinforced with Continuous Carbon Fiber. J. Manuf. Mater. Process. 2024, 8, 227. [Google Scholar] [CrossRef]
  10. Croft, K.; Lessard, L.; Pasini, D.; Hojjati, M.; Chen, J.; Yousefpour, A. Experimental study of the effect of automated fiber placement induced defects on performance of composite laminates. Compos. Part A Appl. Sci. Manuf. 2011, 42, 484–491. [Google Scholar] [CrossRef]
  11. Mandell, J.F.; Samborsky, D.D.; Wang, L. Effects of fiber waviness on composites for wind turbine blades. In International SAMPE Symposium and Exhibition; SAMPE: Manhattan, MT, USA, 2003; pp. 2653–2666. [Google Scholar]
  12. Talreja, R. Incorporating manufacturing defects in damage and failure analysis. In Modeling Damage, Fatigue and Failure of Composite Materials; Woodhead Publishing: Sawston, UK, 2016; pp. 377–390. [Google Scholar]
  13. Yurgartis, S.W. Measurement of small angle fiber misalignments in continuous fiber composites. Compos. Sci. Technol. 1987, 30, 279–293. [Google Scholar] [CrossRef]
  14. Little, J.E.; Yuan, X.; Jones, M.I. Characterisation of voids in fibre reinforced composite materials. Ndt E Int. 2012, 46, 122–127. [Google Scholar] [CrossRef]
  15. Han, Z.; Jeong, S.; Jang, J.W.; Woo, J.H.; Oh, D. Ultrasonic attenuation characteristics of glass-fibre-reinforced polymer hull structure. Appl. Sci. 2021, 11, 6614. [Google Scholar] [CrossRef]
  16. Saenz-Castillo, D.; Martín, M.I.; Calvo, S.; Rodriguez-Lence, F.; Güemes, A. Effect of processing parameters and void content on mechanical properties and NDI of thermoplastic composites. Compos. Part A Appl. Sci. Manuf. 2019, 121, 308–320. [Google Scholar] [CrossRef]
  17. Zenker, T.; Bruckner, F.; Drechsler, K. Effects of defects on laminate quality and mechanical performance in thermoplastic Automated Fibre Placement-based process chains. Adv. Manuf. Polym. Compos. Sci. 2019, 5, 184–205. [Google Scholar]
  18. Mechin, P.Y.; Keryvin, V.; Grandidier, J.C.; Glehen, D. An experimental protocol to measure the parameters affecting the compressive strength of CFRP with a fibre micro-buckling failure criterion. Compos. Struct. 2019, 211, 154–162. [Google Scholar] [CrossRef]
  19. Bernasconi, A.; Carboni, M.; Ribani, R. On the combined use of Digital Image Correlation and Micro Computed Tomography to measure fibre orientation in short fibre reinforced polymers. Compos. Sci. Technol. 2020, 195, 108182. [Google Scholar] [CrossRef]
  20. Straumit, I.; Lomov, S.V.; Wevers, M. Quantification of the internal structure and automatic generation of voxel models of textile composites from X-ray computed tomography data. Compos. Part A Appl. Sci. Manuf. 2015, 69, 150–158. [Google Scholar] [CrossRef]
  21. Nikishkov, Y.; Airoldi, L.; Makeev, A. Measurement of voids in composites by X-ray Computed Tomography. Compos. Sci. Technol. 2013, 89, 89–97. [Google Scholar] [CrossRef]
  22. Chai, Y. Engineering Design and Void Characterisation of Thick Composites. Master’s thesis, The University of Manchester, Manchester, UK, 2016. [Google Scholar]
  23. Sensini, A.; Gualandi, C.; Focarete, M.L.; Belcari, J.; Zucchelli, A.; Boyle, L.; Reilly, G.C.; Kao, A.P.; Tozzi, G.; Cristofolini, L. Multiscale hierarchical bioresorbable scaffolds for the regeneration of tendons and ligaments. Biofabrication 2019, 11, 035026. [Google Scholar] [CrossRef]
  24. Sowmya, H.V.; Ramalingappa Krishnappa, M.; Thippeswamy, B. Degradation of polyethylene by Trichoderma harzianum—SEM, FTIR, and NMR analyses. Environ. Monit. Assess. 2014, 186, 6577–6586. [Google Scholar] [CrossRef]
  25. Stamopoulos, A.G.; Tserpes, K.I.; Prucha, P.; Vavrik, D. Evaluation of porosity effects on the mechanical properties of carbon fibre-reinforced plastic unidirectional laminates by X-ray computed tomography and mechanical testing. J. Compos. Mater. 2016, 50, 2087–2098. [Google Scholar] [CrossRef]
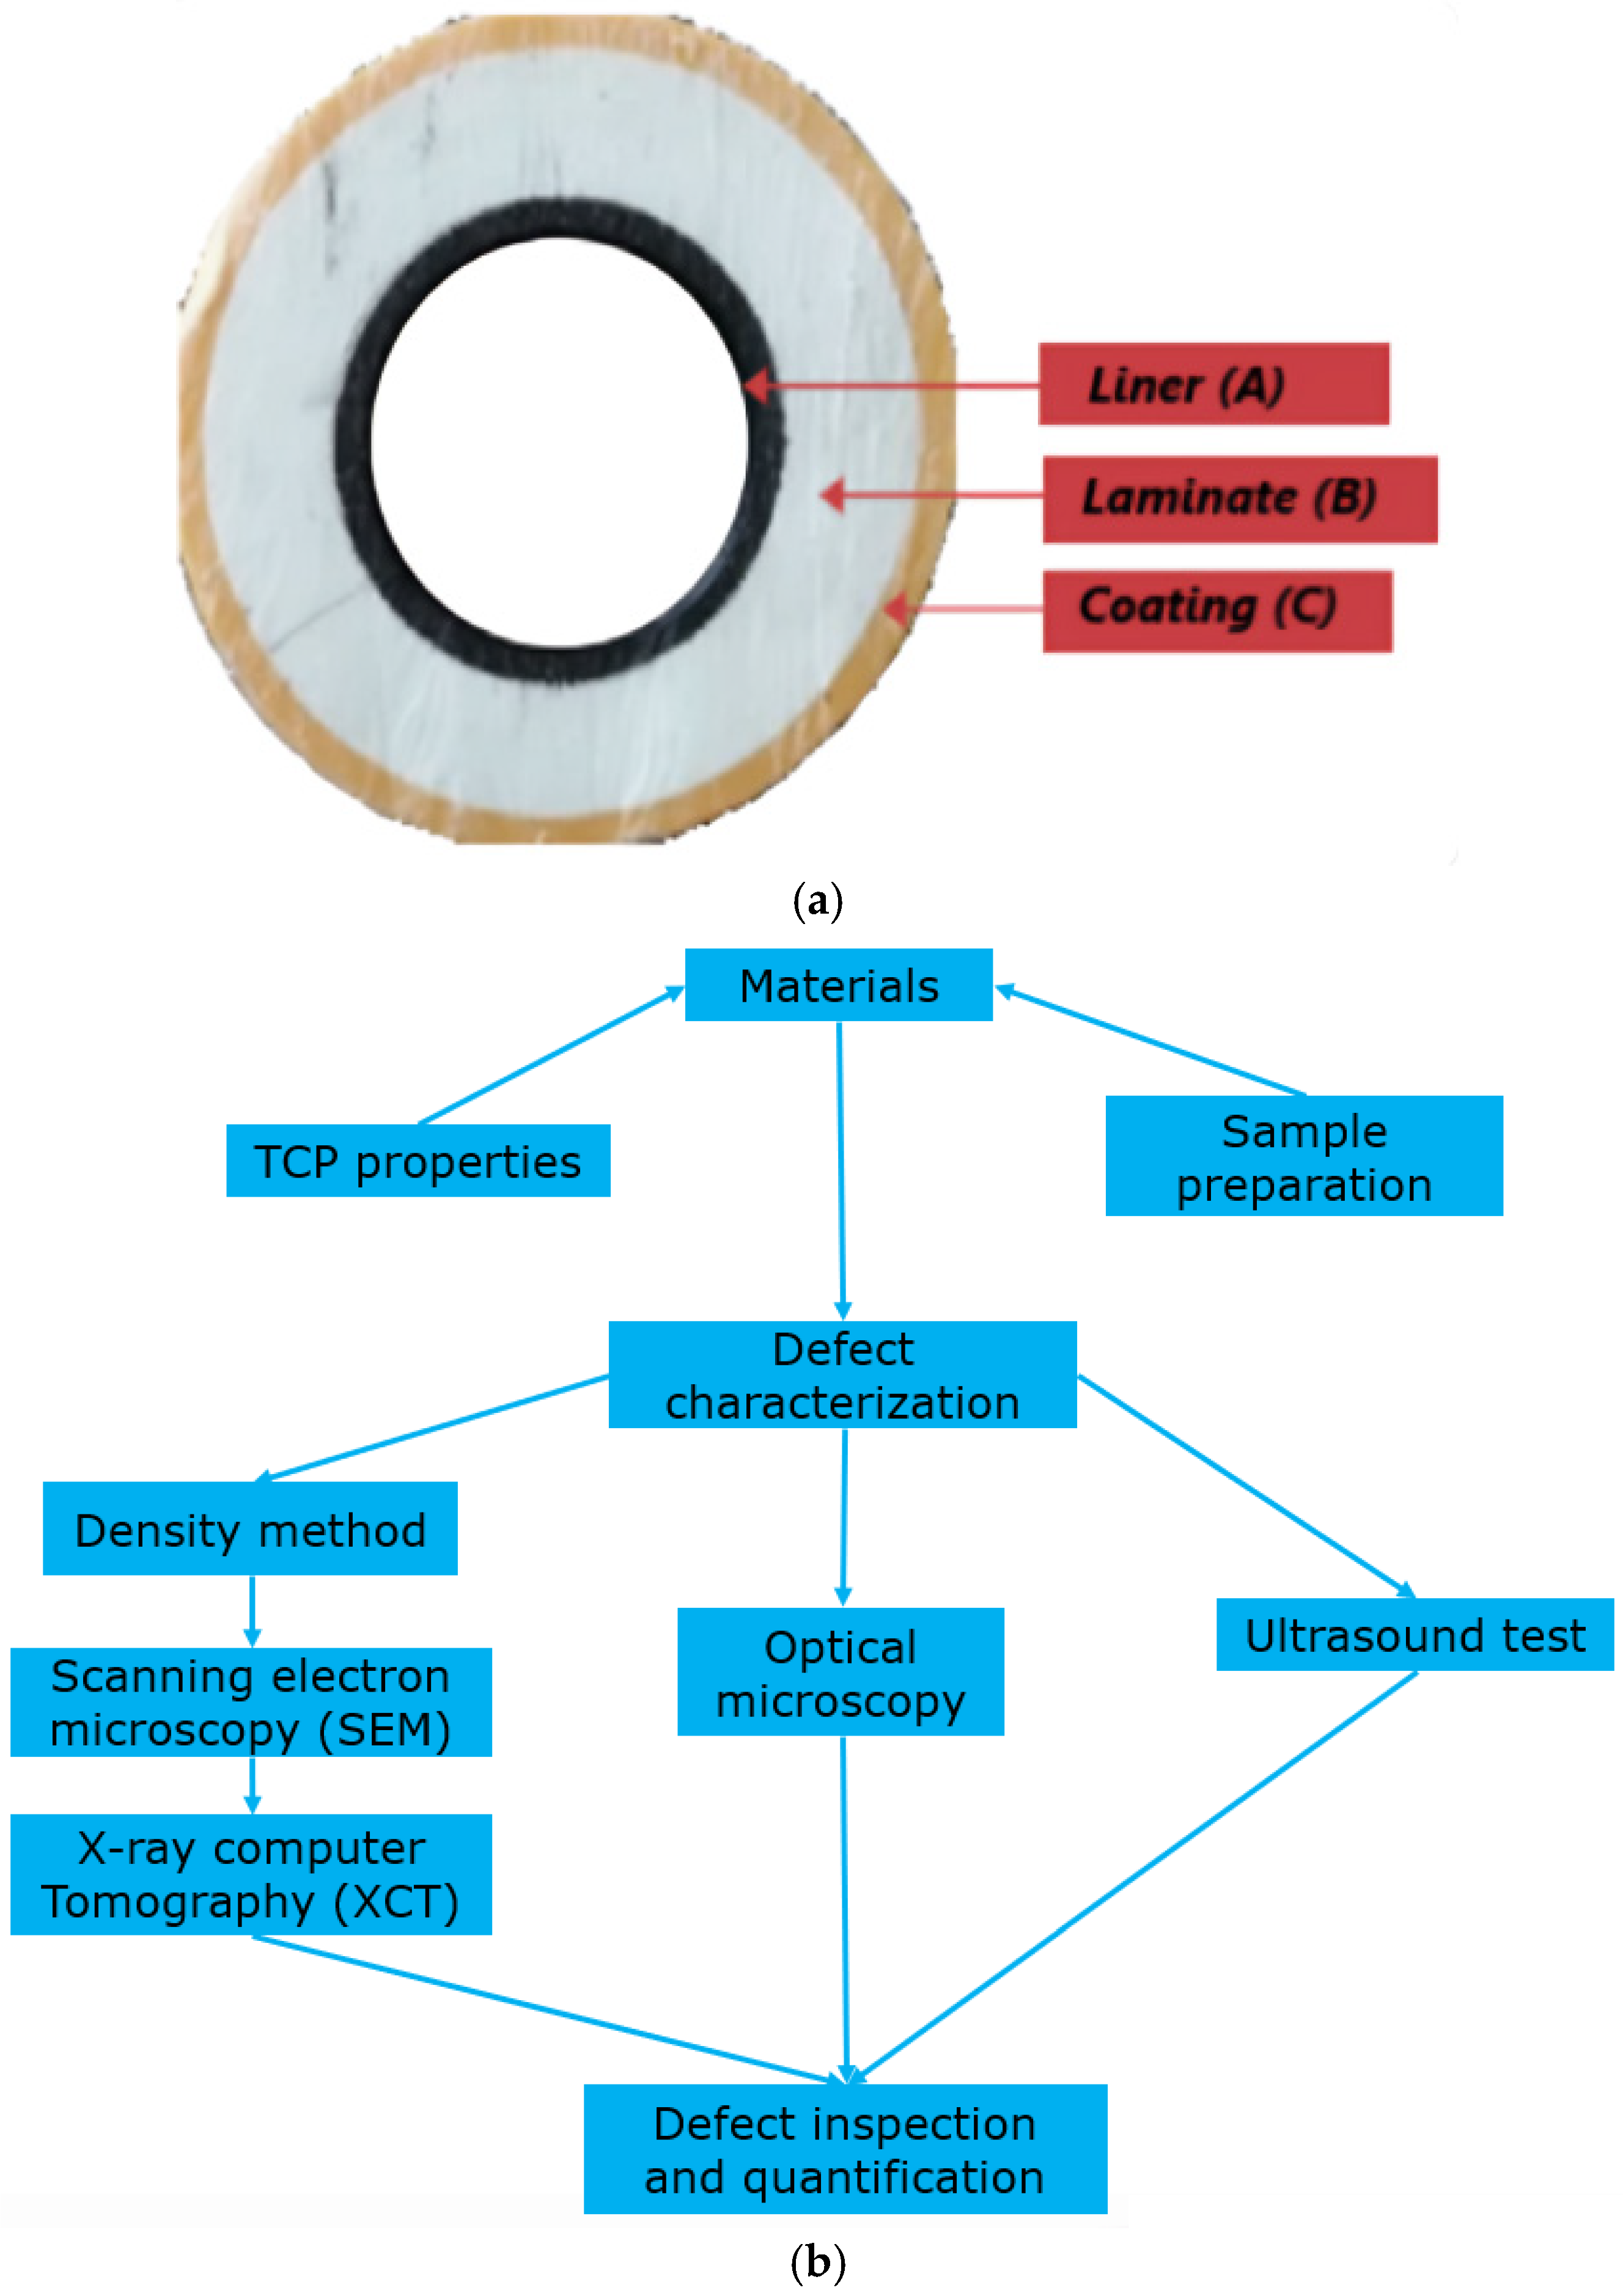
Figure 1. (a) TCP pipe section with the lateral view displaying all the pipe layers and (b) the methodology flow chart.
Ndt 03 00006 g001
Figure 2. The pristine sample used for XCT analysis has a top length of 1 mm, bottom length of 38 mm, height of 30 mm, and width of 25 mm, (a) the side view and (b) the top view of the sample.
Ndt 03 00006 g002
Figure 3. The sample in (a) pristine condition, (b) pristine sample undergoing ultrasound test through the transducer with curved contact, and (c) the dolphicam2 Low-Frequency TRM from Dolphitech Ltd Cambridge, UK, used for inspection.
Ndt 03 00006 g003
Figure 4. Surface morphology of (a) the interlayer between the outer and reinforced layers (10×) (b) the reinforced layer (40×) (c) the interlayer between the reinforced and inner layers (10×).
Ndt 03 00006 g004
Figure 5. SEM images of the (a) liner, (b) reinforced and (c) coated layers at magnifications of 200× 500×, and 1000×. The marker indicates the fibre size for all the magnifications of each layer.
Ndt 03 00006 g005
Figure 6. The fibre directionality of the XCT dataset in the (a) XZ, (b) XY, (c) YZ axis (d) orientation histogram in the YZ axis proving the fibre orientation as ± 60° and (e) SEM micrograph of the reinforced layer.
Ndt 03 00006 g006
Figure 7. SEM analysis by (a) basic micrograph threshold of the reinforced layer samples without testing (b) the sample after filtering and set analysis with the Image J software with the void regions (highlighted in red) to ascertain the void content (c) void size distribution.
Ndt 03 00006 g007
Figure 8. Binarization transformation of the dataset from (a) Reconstructed XCT dataset of untested sample using Avizo at 0.02 × 0.2 × 0.2 (µm) voxel size, (b) untested sample after segmentation and threshold in volume rendition, (c) ortho slice of data after thresholding, (d) post pore subtraction, (e) applying interactive threshold to determine region of interest and (f) point of interest in 3D view.
Ndt 03 00006 g008
Figure 9. Volume distribution of pores in the sample.
Ndt 03 00006 g009
Figure 10. Histogram of (a) equivalent diameter distribution and (b) sphericity distribution of the pores.
Ndt 03 00006 g010
Figure 11. The void fraction comparison calculated from Archimedes, microscopy and XCT.
Ndt 03 00006 g011
Figure 12. The A, B and C scans ((a) the B-scan in vertical direction, (b) C-scan amplitude (2D), (c) C-scan time of flight (2D), (d) A-scan (vertical), (e) B-scan in horizontal direction and (f) the C-scan in 3D as time of flight) obtained from inspecting the sample at pristine conditions with a signal velocity of 2740 m per second; this sample is a three-layer pipe of a total thickness of 25 mm where the thickness of the first, second, and third layers are 4 mm, 17 mm and 4 mm, respectively.
Ndt 03 00006 g012
Table 1. Summary of the average pore statistics obtained from XCT from full sample scans.
Sample LocationVoxel Size (μm)Volume (mm3)Area Analyzed (mm2)Volume/Area Analyzed (mm3/mm2)Pore Volume Fraction (%)Number of Pores Identified
Whole sample0.02 × 0.2 × 0.214,62520707.0654.41 × 10−824,990
Table 2. Summary of the equi-diameter and sphericity statistics derived from XCT.
Mean Equi-Diameter (μm)Maximum Equi-Diameter (μm)Minimum Equi-Diameter (μm)Mean Sphericity (-)Maximum Sphericity (-)Minimum Sphericity (-)
0.2751.9810.0250.7801.6090.205
Disclaimer/Publisher’s Note: The statements, opinions and data contained in all publications are solely those of the individual author(s) and contributor(s) and not of MDPI and/or the editor(s). MDPI and/or the editor(s) disclaim responsibility for any injury to people or property resulting from any ideas, methods, instructions or products referred to in the content.