Enhancing Pest Detection in Deep Learning Through a Systematic Image Quality Assessment and Preprocessing Framework
Abstract
1. Introduction
2. Related Work
2.1. Pest and Plant Disease Identification
2.2. Image Processing Techniques
2.2.1. Image Pre-Processing
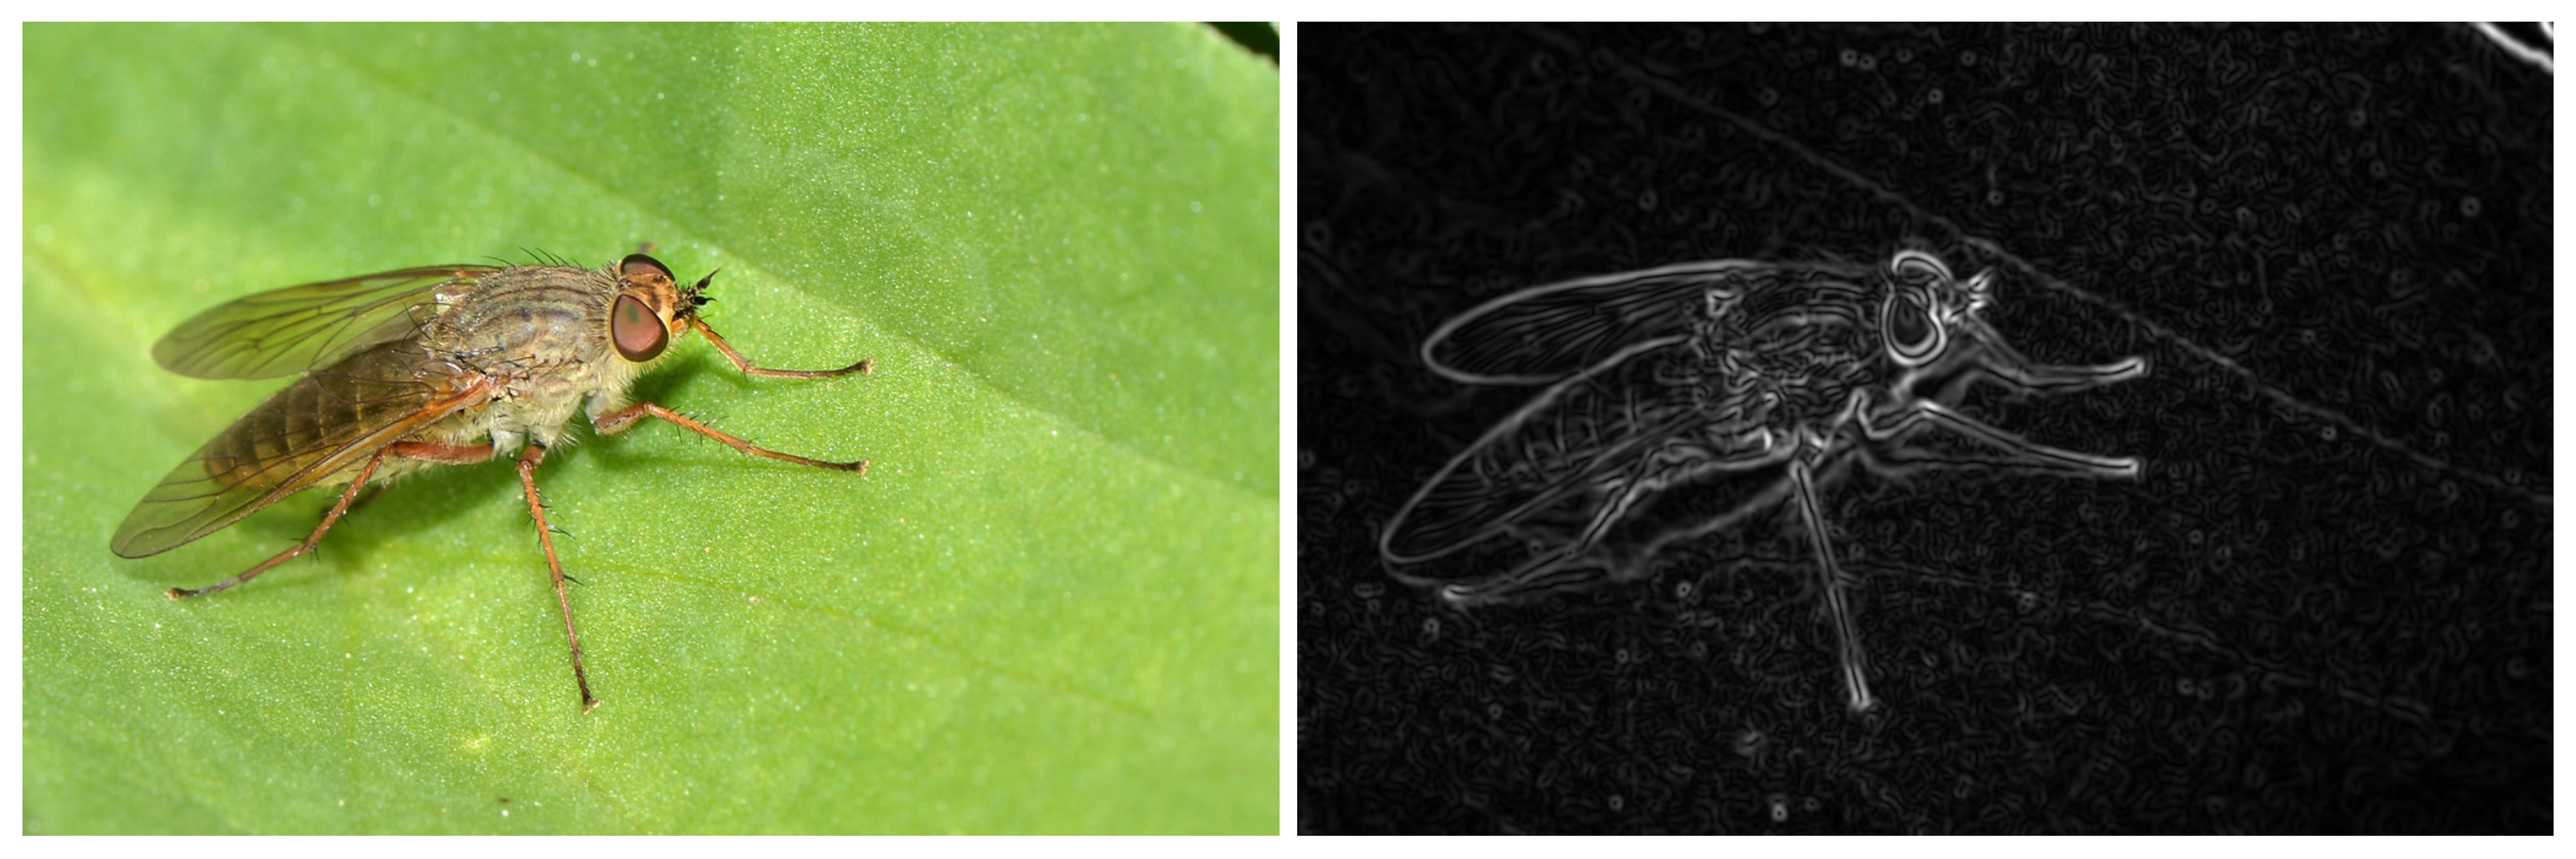
2.2.2. Edge Detection
2.2.3. Feature Recognition
2.2.4. Image Segmentation Techniques
2.3. Image Quality Assessment
2.3.1. Full-Reference IQA
2.3.2. Reduced-Reference IQA
2.3.3. No-Reference IQA
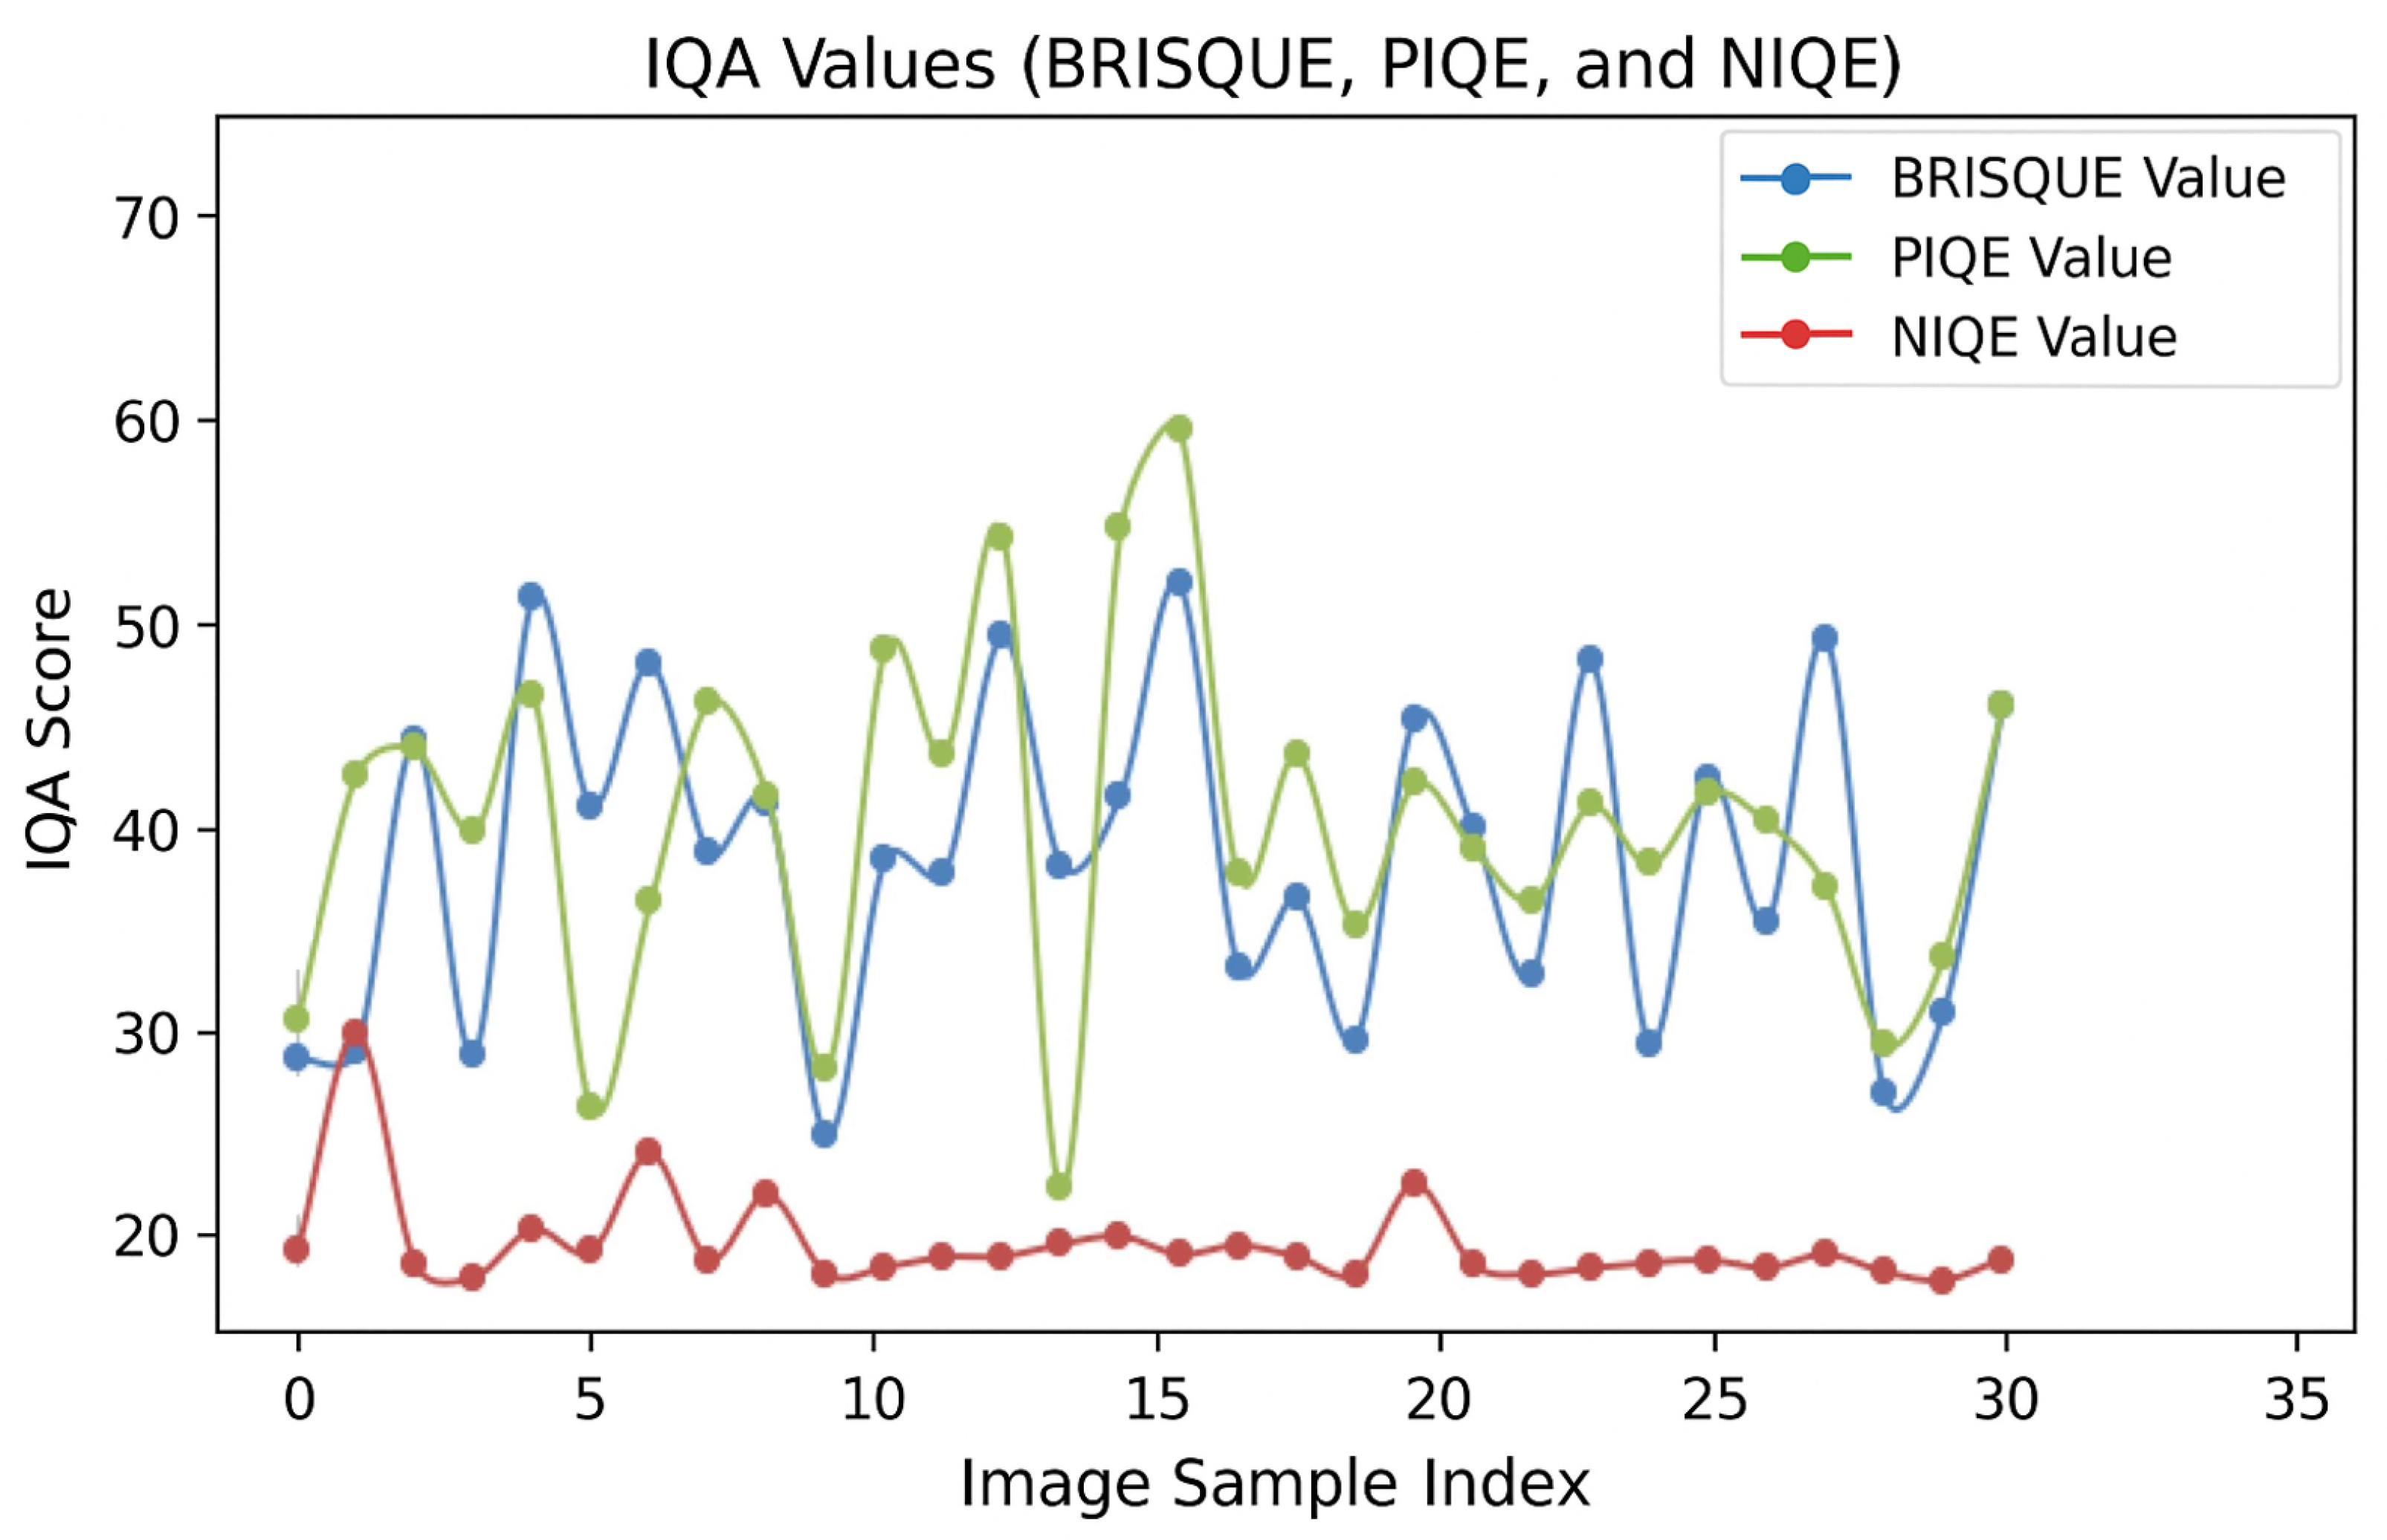
- BRISQUE (Blind/Referenceless Image Spatial Quality Evaluator): BRISQUE assesses image quality without a reference image, deriving a quality score based on statistical features like brightness, contrast, and texture, relative to a training dataset. It’s employed for evaluating image compression and processing algorithms, gauging their impact on quality.
- PIQE (Perceptual Image Quality Evaluator): PIQE gauges perceptual image quality, comparing quality to human perception. It derives a quality score through analysis of structure, contrast, and colour. PIQE finds use in image processing and transmission to assess algorithm and system effects on quality.
- NIQE (Naturalness Image Quality Evaluator): NIQE gauges image naturalness and realism, deriving a quality score by analysing statistical features like texture, contrast, and edges. NIQE is prevalent in evaluating image enhancement and restoration algorithms, discerning their effects on realism.
3. Methodology
3.1. Image Classification and Acquisition
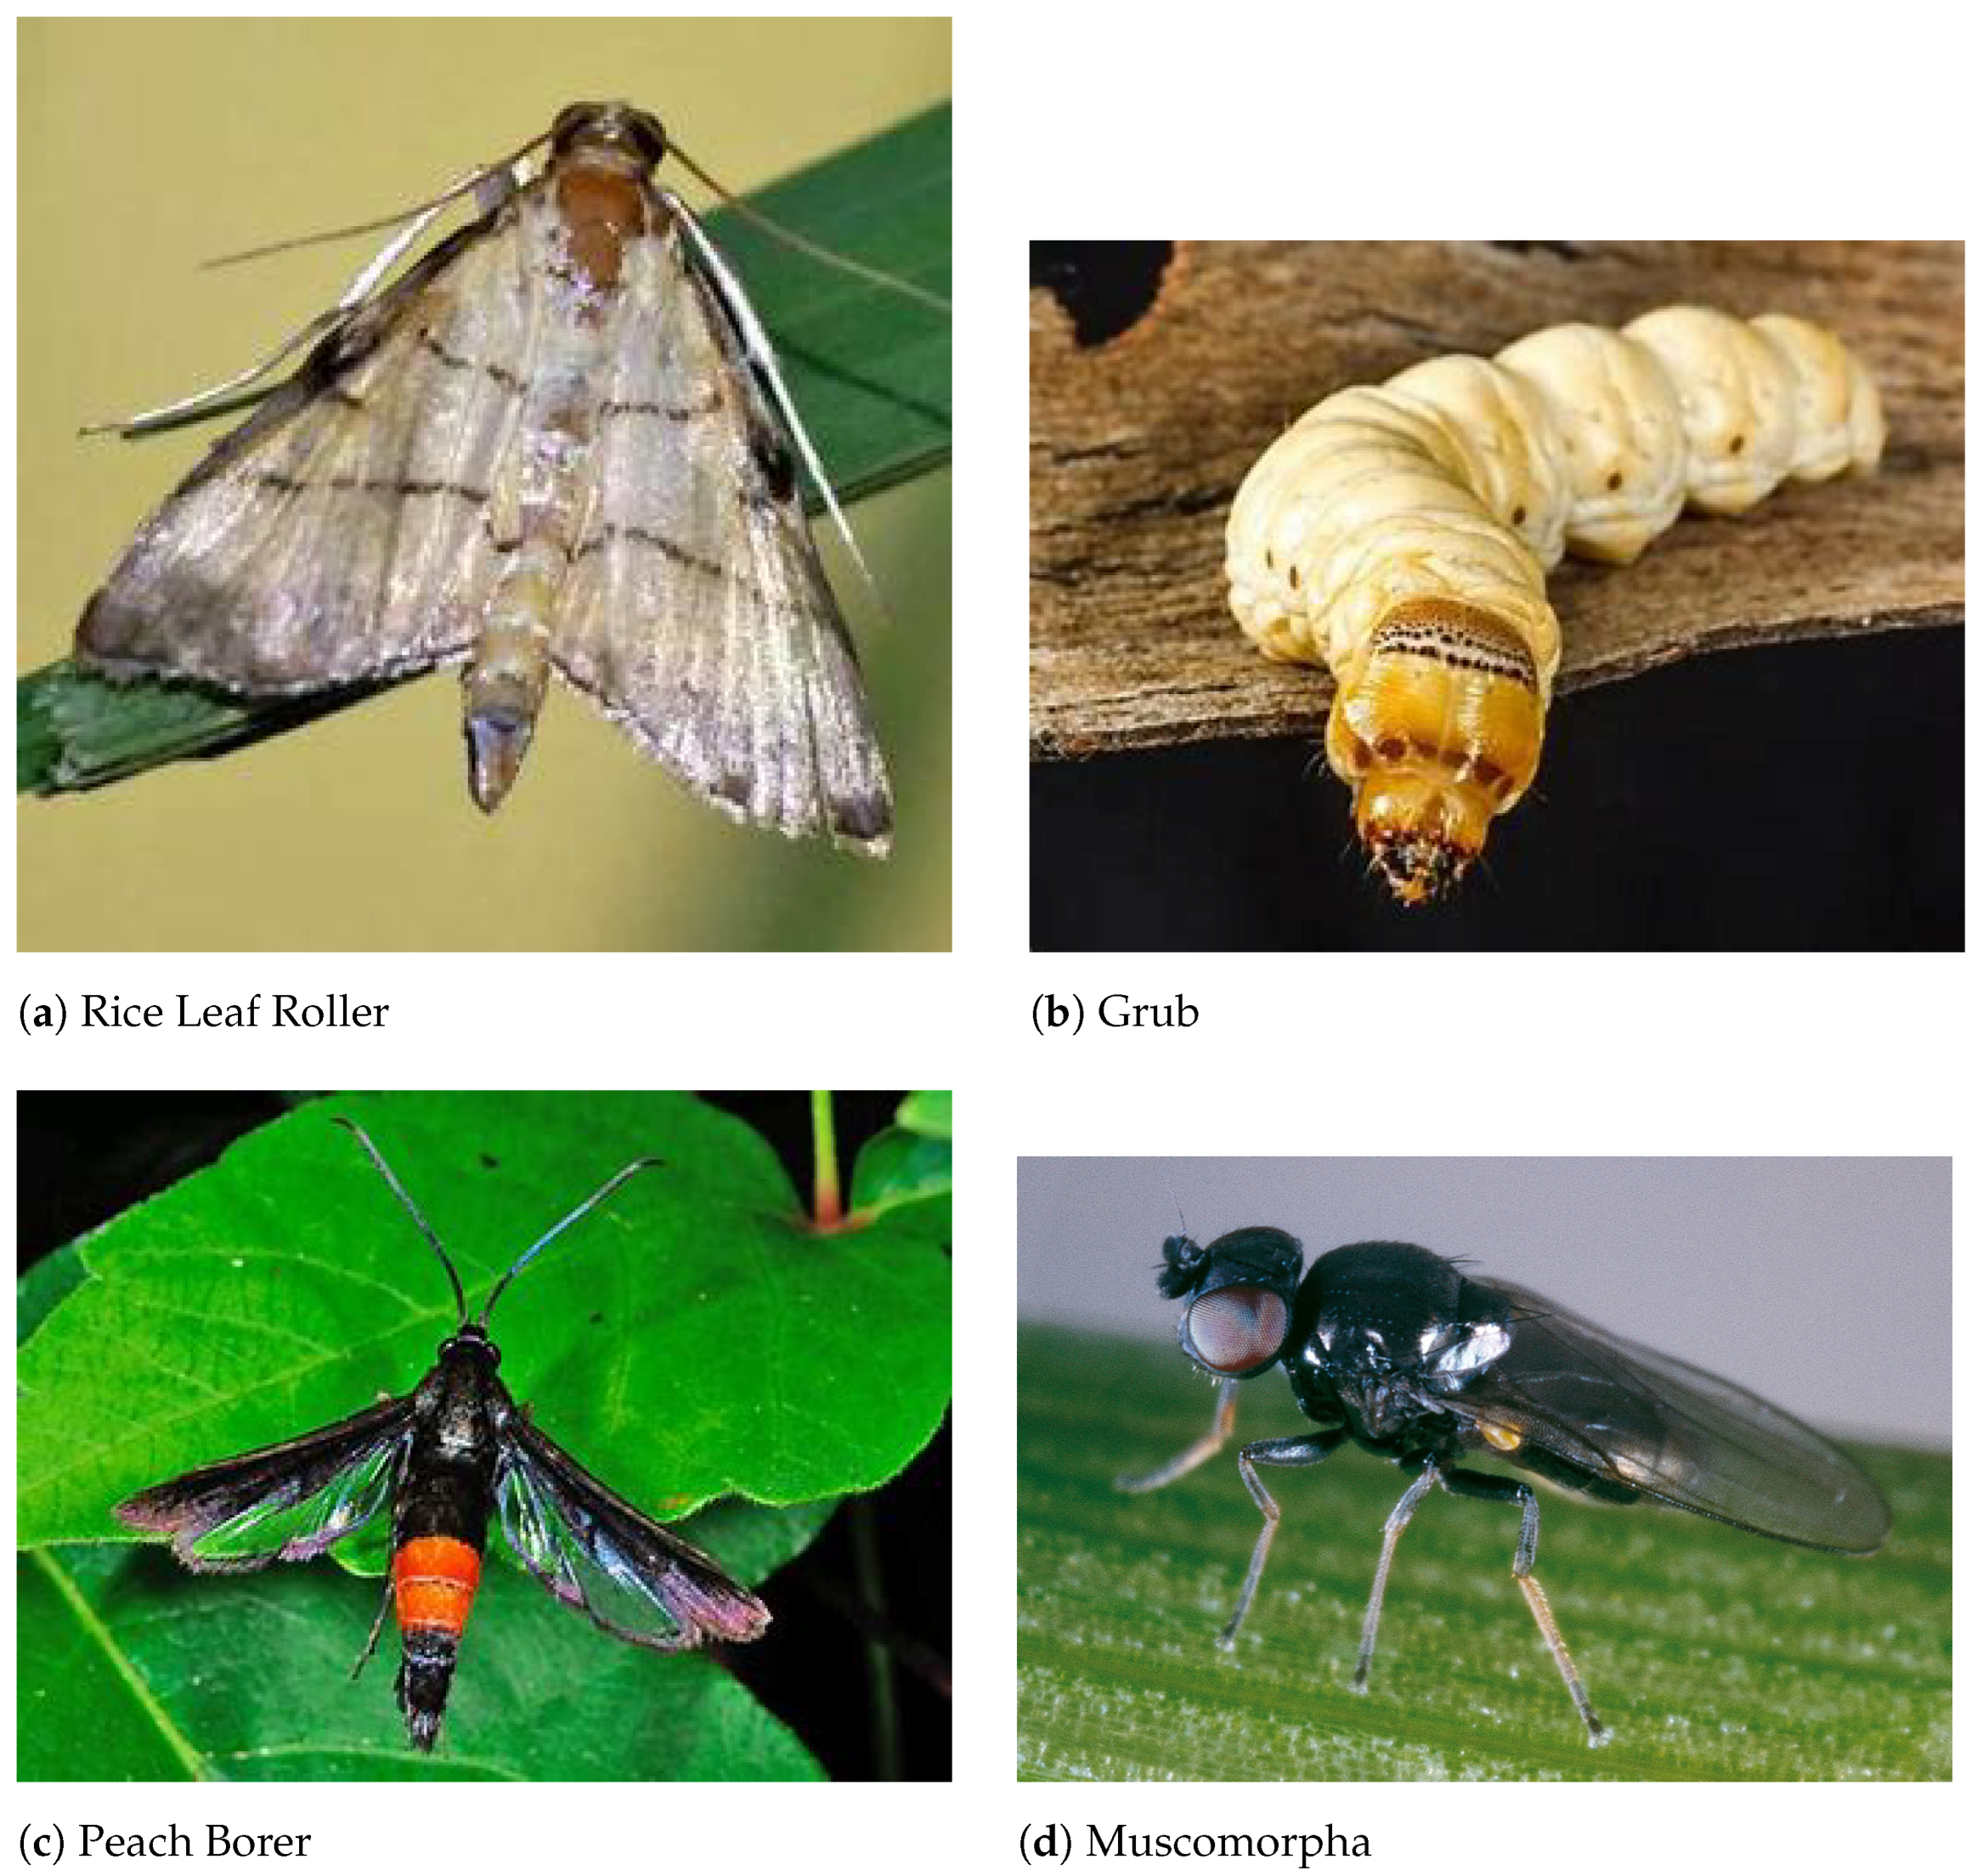
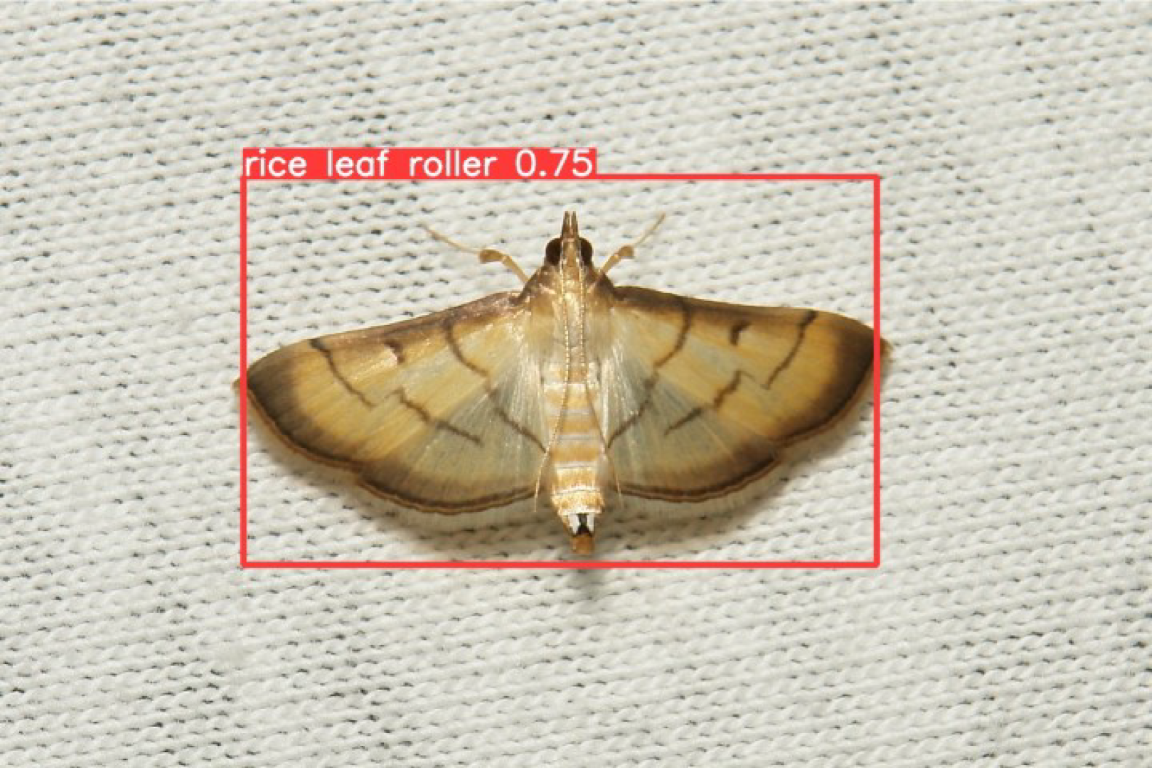
- Rice Leaf Roller (Cnaphalocrocis medinalis)
- Grub (Larvae of beetles in the family Scarabaeidae, e.g., Holotrichia parallela)
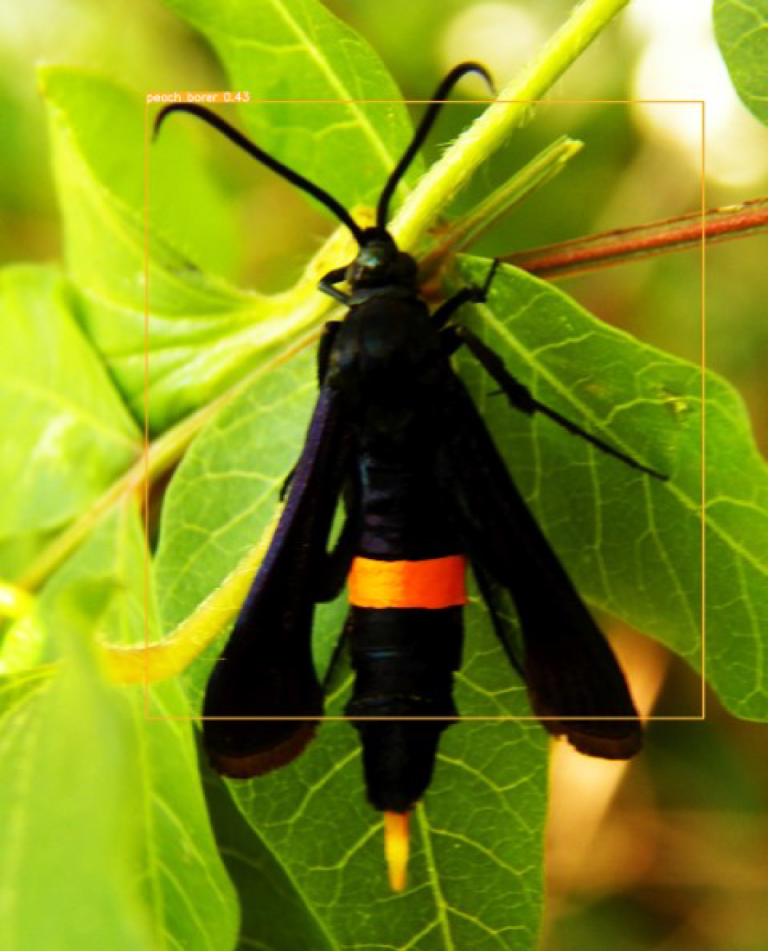
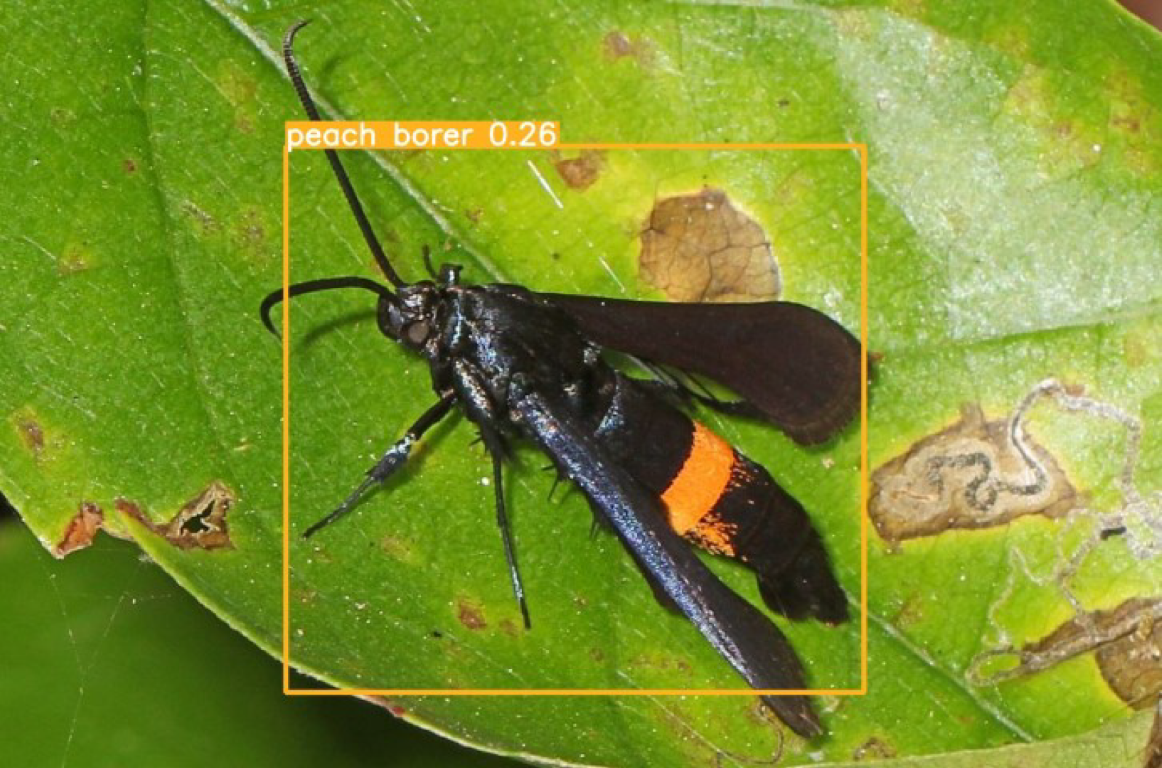
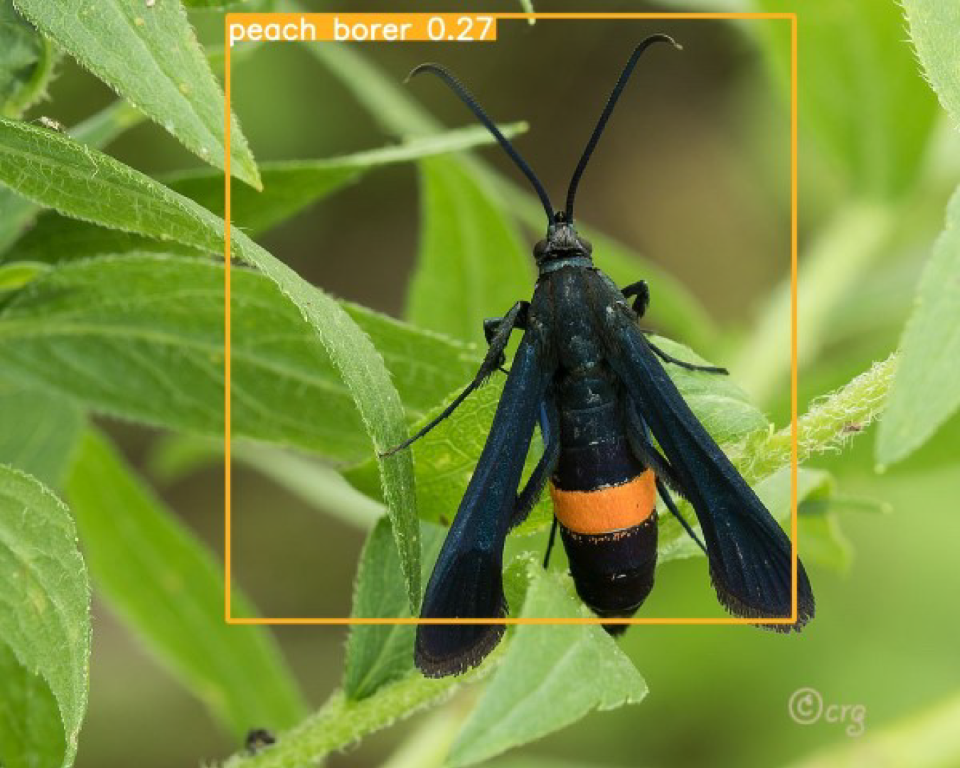
- Peach Borer (Conogethes punctiferalis)
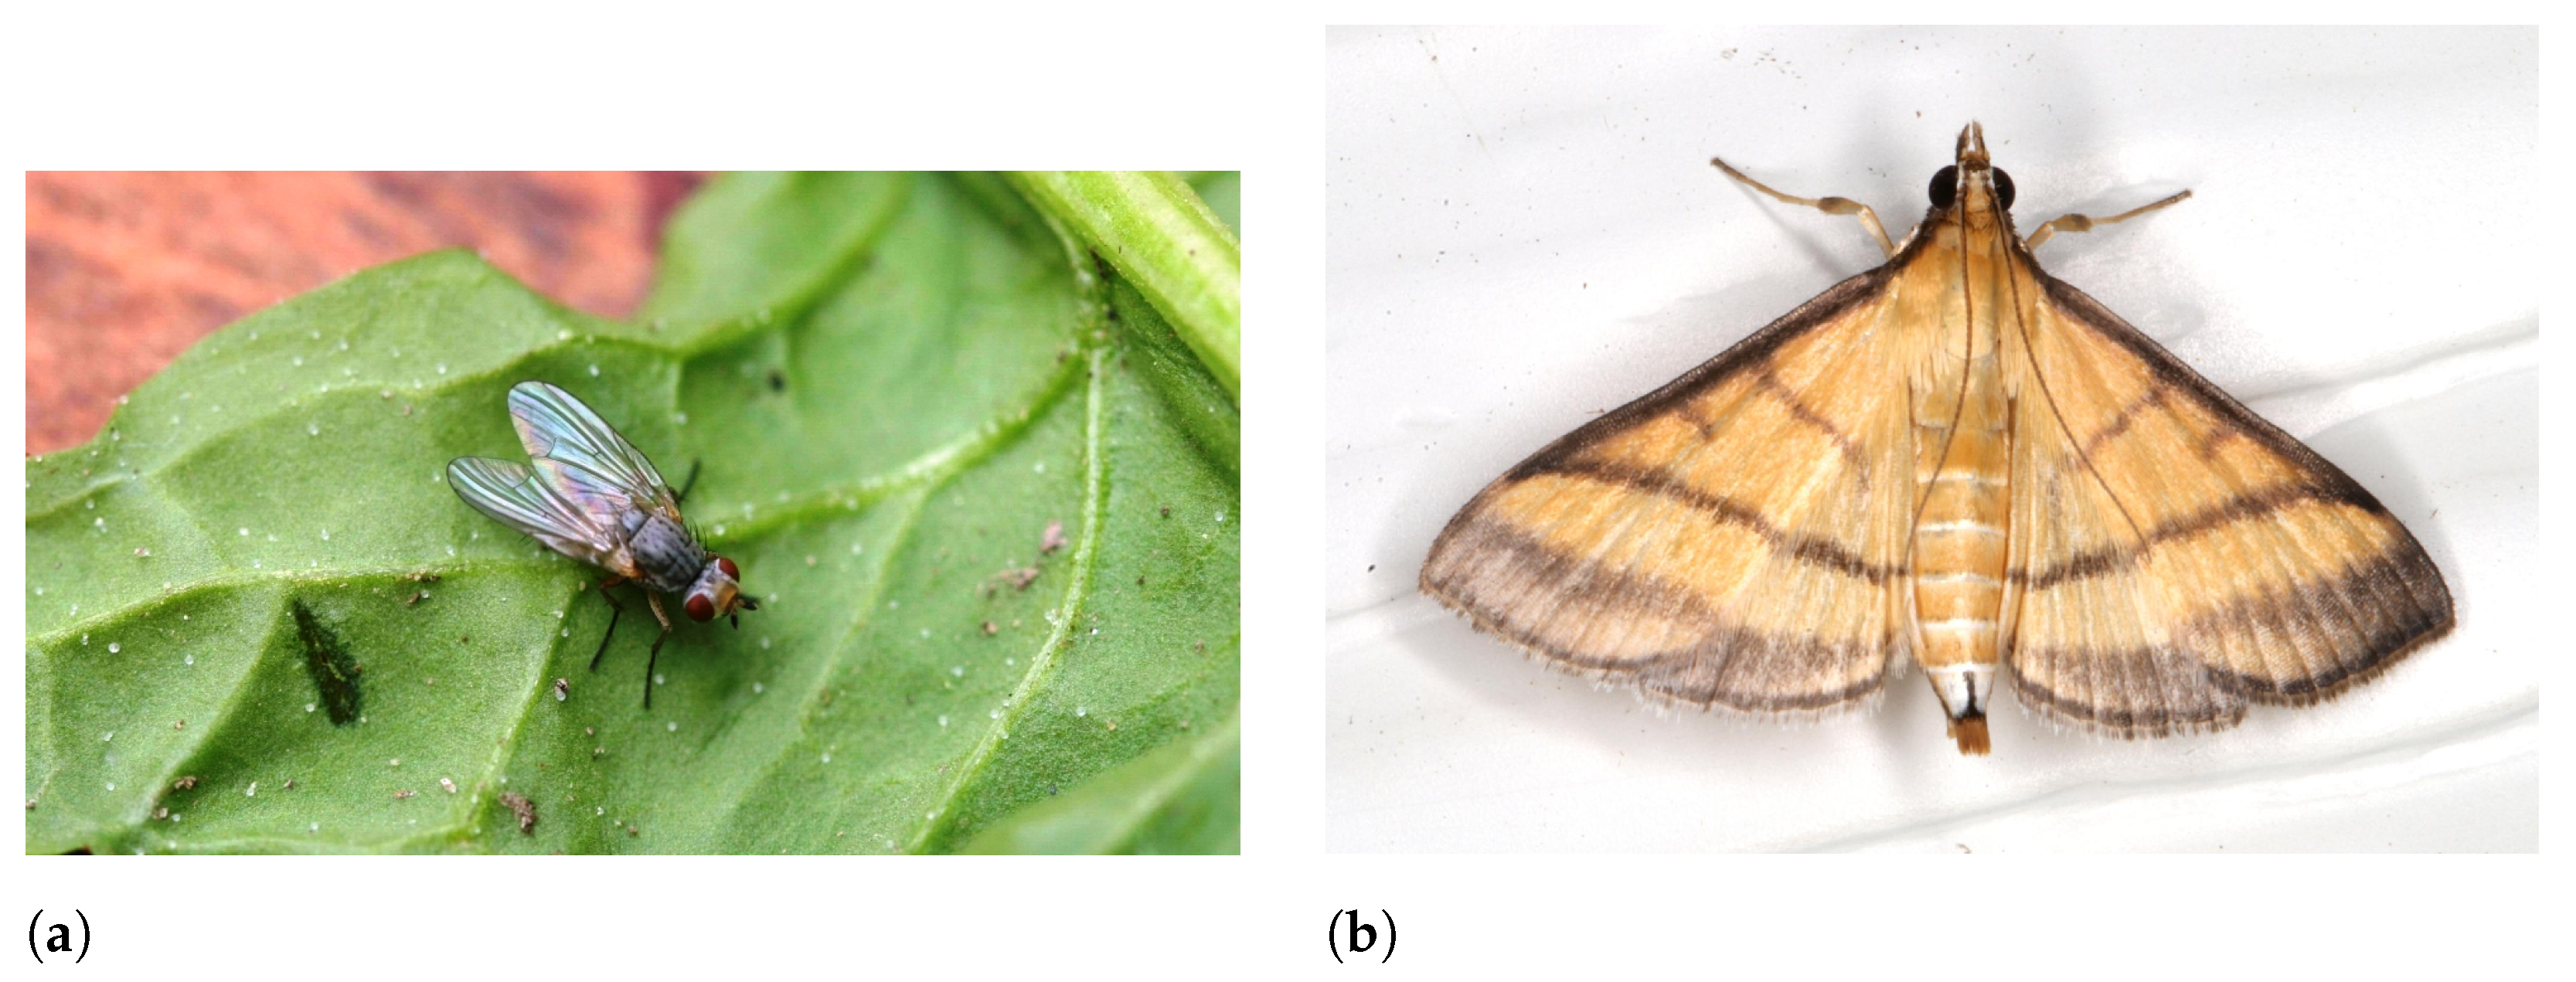
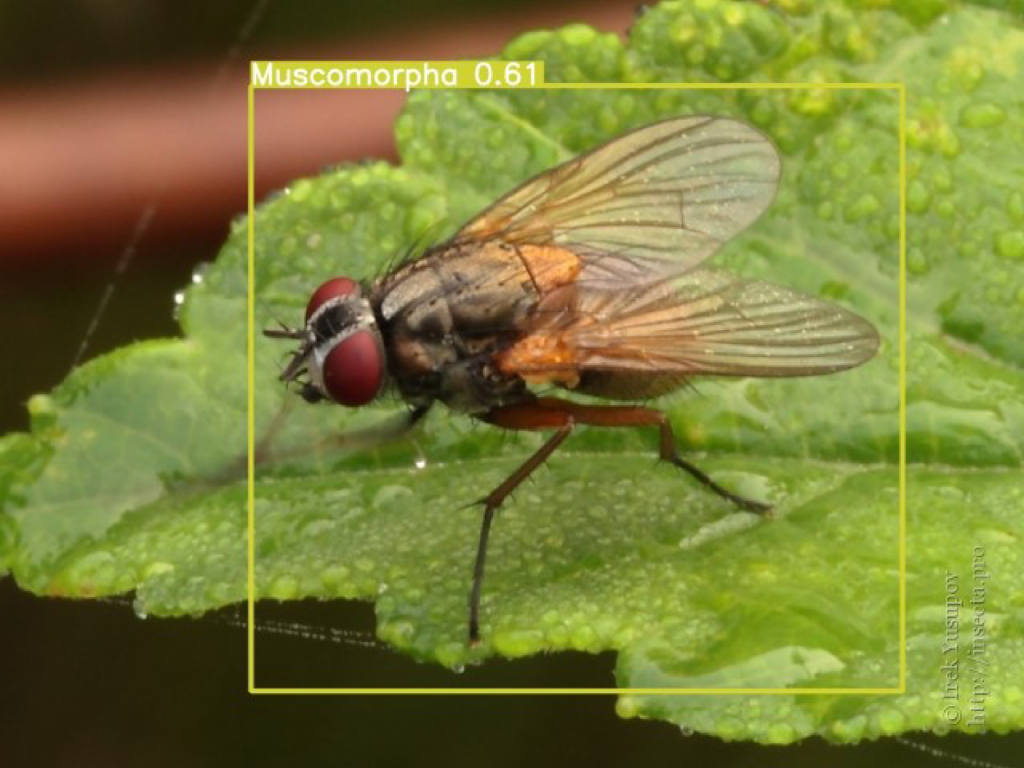
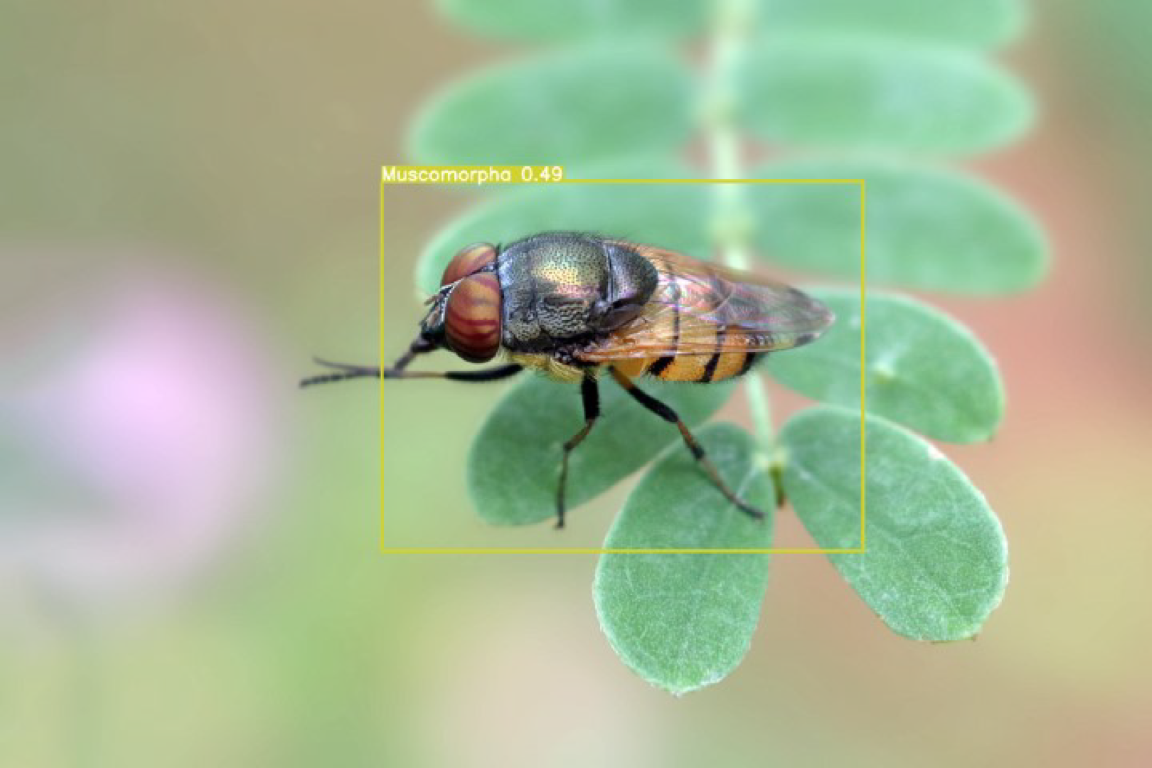
- Muscomorpha (A subsection of the order Diptera; for this study, we focused on representative fruit fly species, e.g., Bactrocera dorsalis)
- Examples of these four categories are shown in Figure 7.
3.2. IQA Analysis
3.3. Pest Image Pre-Processing
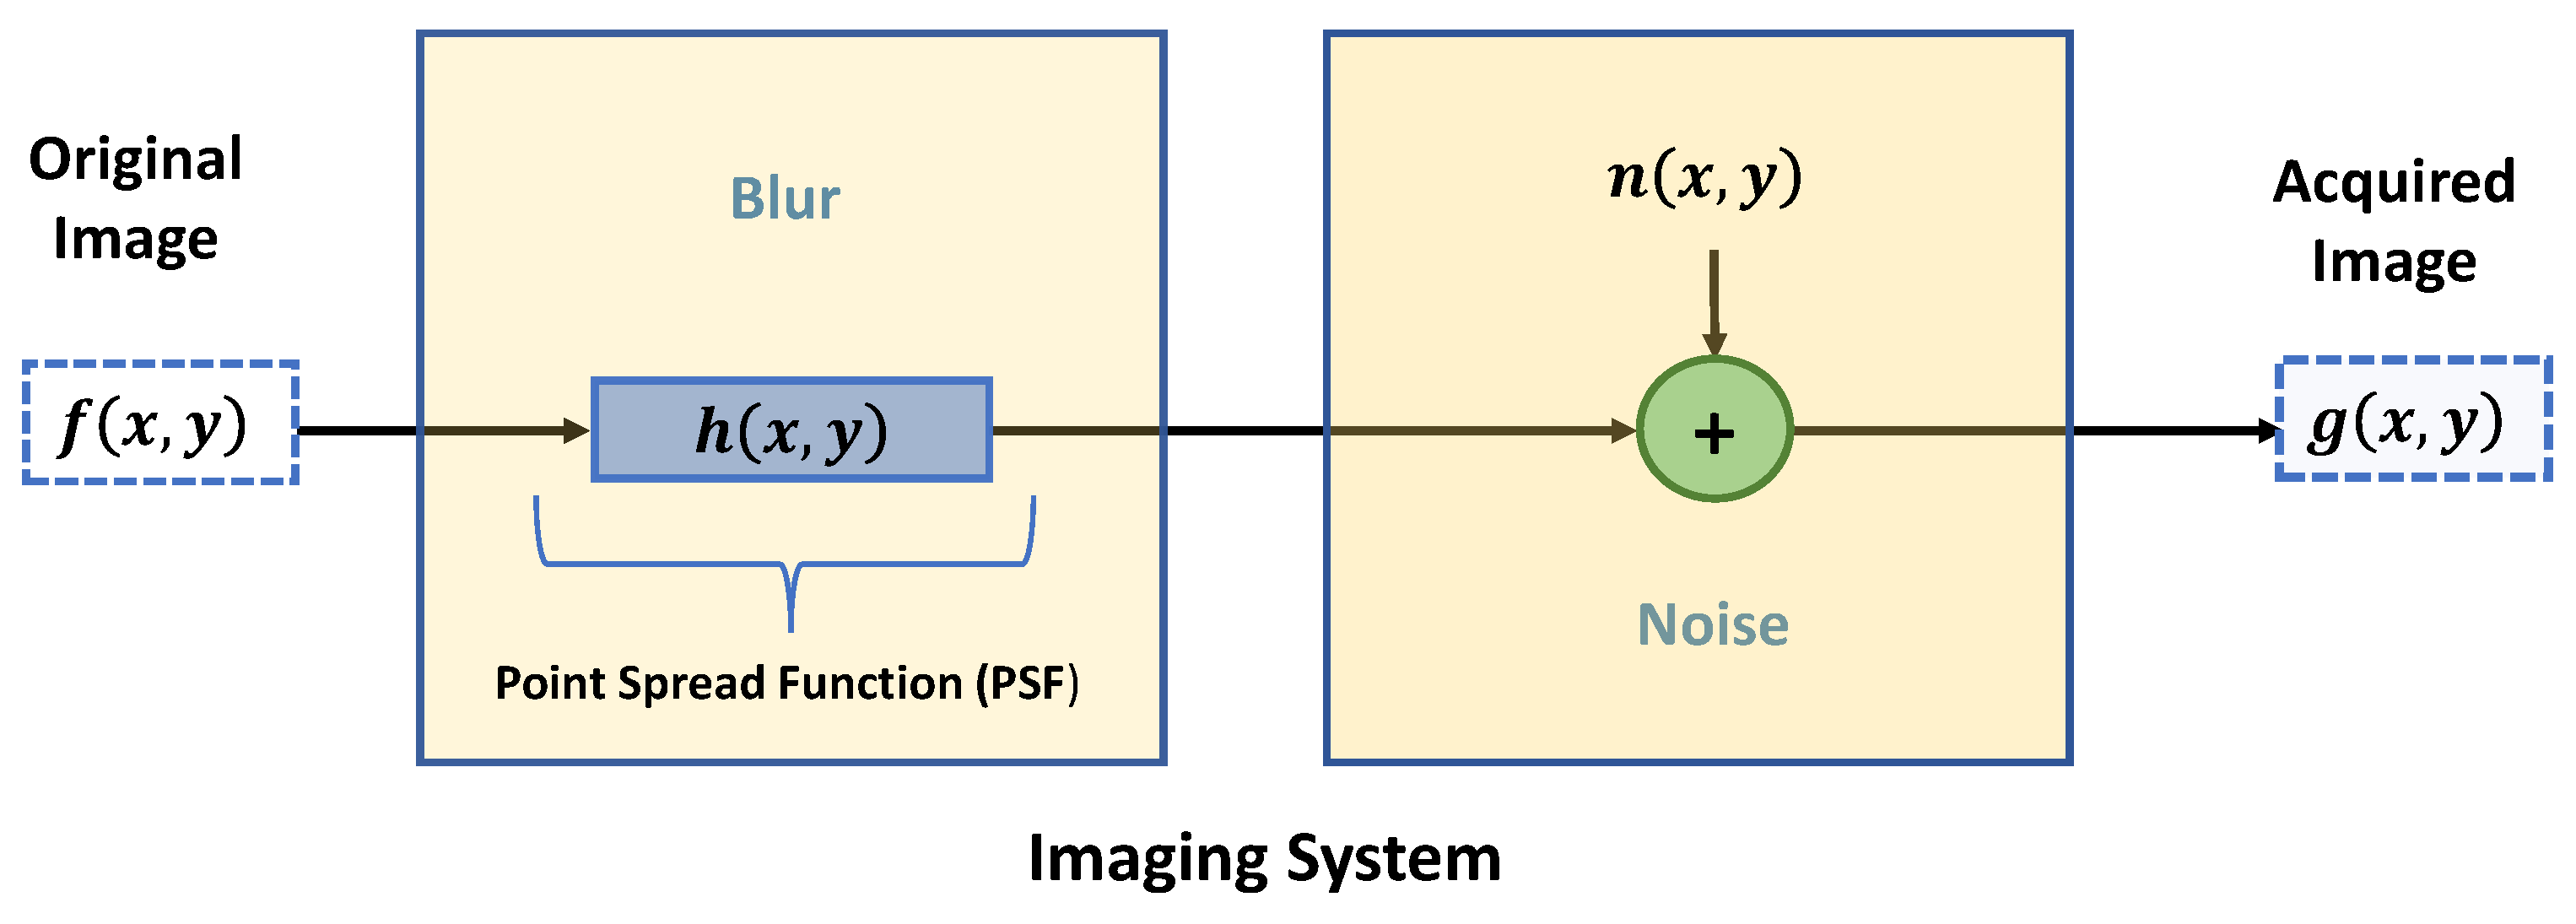
3.4. Image Pre-Processing Fundamentals
3.5. Image Pre-Processing Filter
- I.
- Wiener Filter
- Transform the original image and the degenerate model into the frequency domain.
- Calculate the frequency response of the degenerate function.
- Estimate the noise power spectrum .
- Estimate the power spectrum of the original image .
- Filter the frequency domain representation of the image using the Wiener filter formula to obtain the frequency domain representation of the recovered image.
- Transform the frequency domain representation of the recovered image back to the spatial domain to obtain the final recovered image.
- II.
- Lucy–Richardson Filter
- Initialisation: First, the degraded image is used as the recovered image for the initial estimation.
- Iterative update: The recovery image is updated iteratively by alternating the steps of forward and inverse models until a predetermined number of iterations or convergence conditions are reached.
- (a)
- Forward model (predicted image): The current recovery image is convolved with the point spread function to obtain the predicted image.
- (b)
- Reverse model (updated estimation): The ratio of the degraded image to the predicted image is multiplied by the inverse convolution of the point spread function to obtain the updated estimated image.
- III.
- Sharpening Filter
- IV.
- DampedLS Filter
- V.
- Tikhonov Filter
- VI.
- Total Variation Filter
3.6. Pest Image Processing
3.6.1. Traditional Extraction Algorithm for Pest Species Classification Features
3.6.2. Pest Location Identification Algorithm Based on YOLOv5
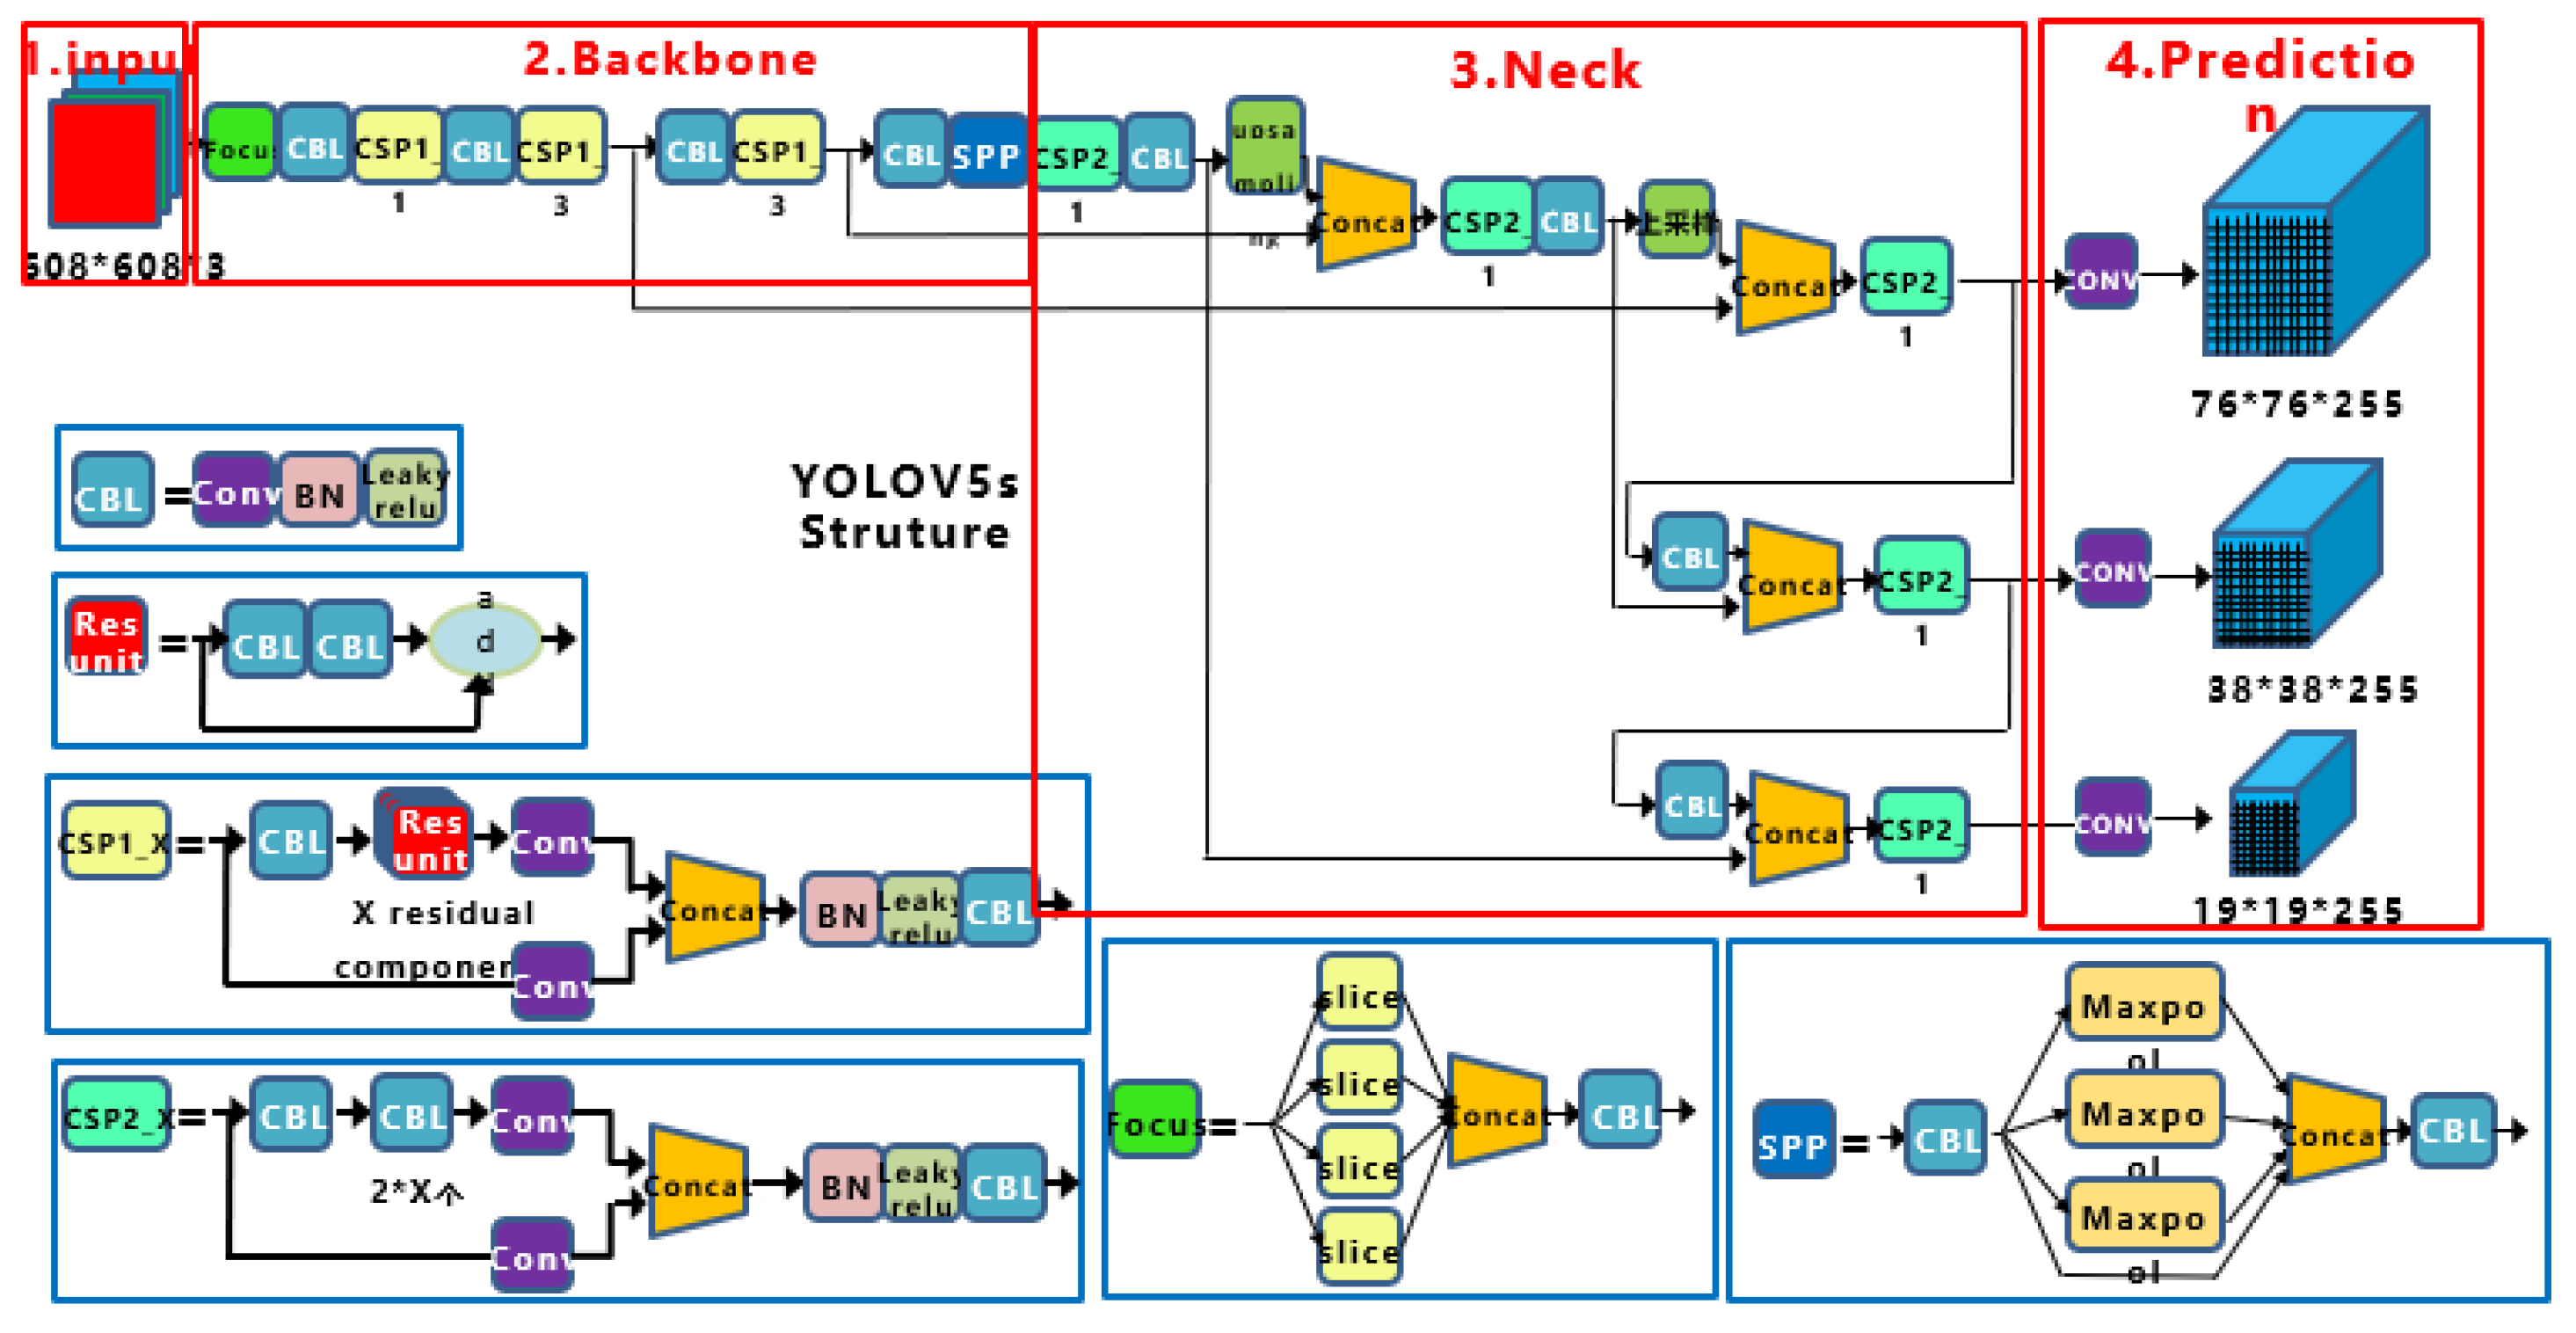
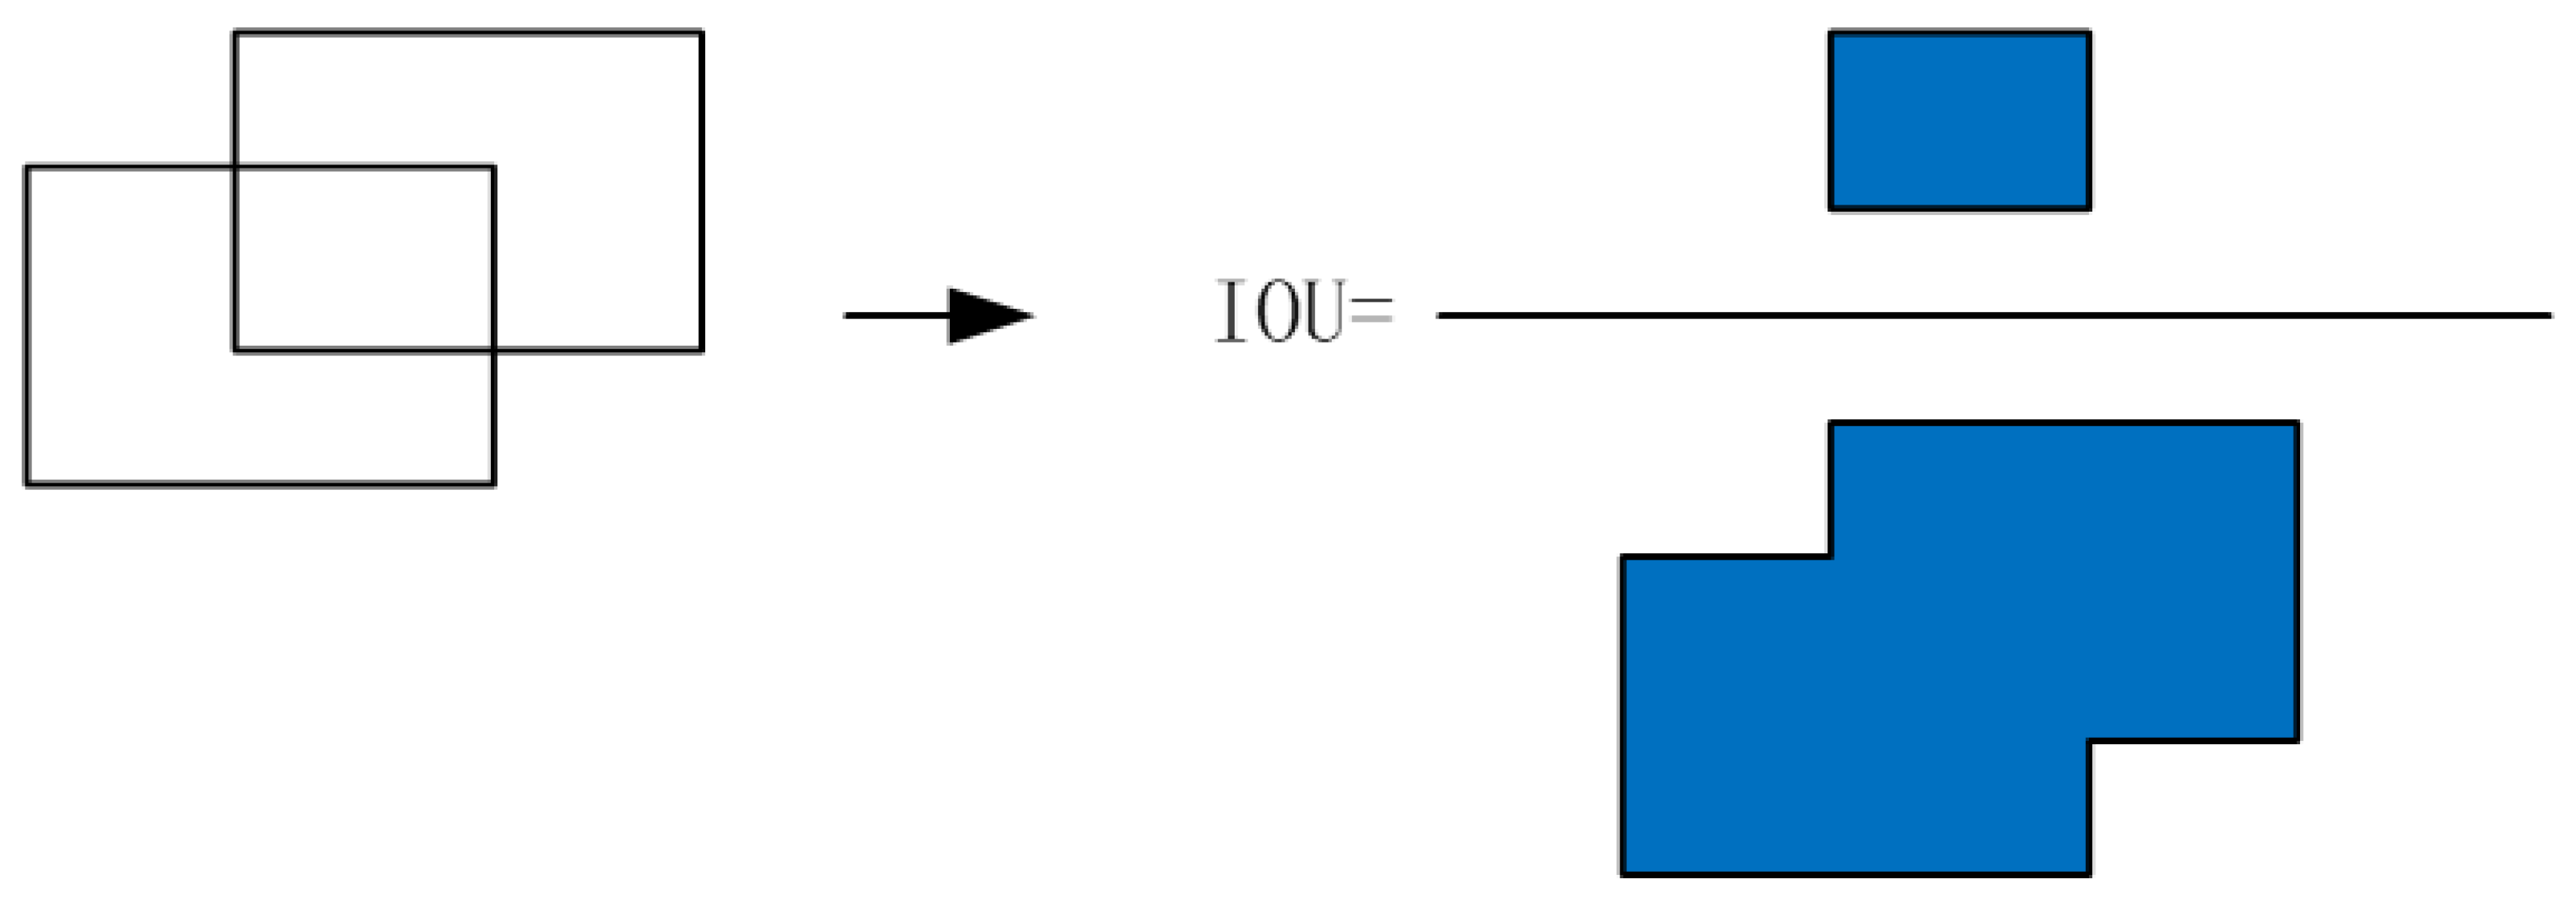
- YOLOv5 NET:YOLOv5, short for “You Only Look Once version 5,” is an advanced single-stage object detection model introduced by Ultralytics in 2020. It represents a culmination of state-of-the-art techniques for accurate and efficient object detection in images. The architecture is built upon the classic CSPDarknet53 backbone, incorporating specialised modules like the focus module and spatial pyramid pooling (SPP) module. Additionally, the model employs PANet as a neck network and the traditional YOLO detection head for predictions.What sets YOLOv5 apart is its adaptability through varying model sizes: YOLOv5s, YOLOv5m, YOLOv5l, and YOLOv5x, each increasing in depth and width. This enables tailored solutions to different computational and accuracy requirements. Notably, the YOLOv5s model is particularly suitable for real-time applications due to its reduced parameters and fast inference speed.The YOLOv5 architecture leverages deep learning techniques to directly predict object classes and bounding box coordinates in a single forward pass. This streamlined approach ensures rapid processing and accurate detection, making it a preferred choice for numerous computer vision applications, including robotics, surveillance, and food monitoring. The YOLOv5 model is shown in Figure 11.In the above diagram, BackBone is the backbone network, mainly responsible for abstracting the input images into features. The Neck layer is used between the BackBone and the final output layer to fully extract the network features and prepare the network for the output. The YOLOv5 Neck network uses the CSP2 structure, which is based on the Cross Stage Partial Network (CSPnet) design, to enhance the fusion of features. Prediction layer: This layer takes the data features extracted from the network and finally transforms them into the data format we need. SPP: a multi-scale fusion using , , and maximum pooling. The YOLOv5 algorithm uses a K-Means-based clustering operation to cluster the feature frame data from the pest feature dataset into anchor frames of a specific size.
- 2.
- Statistical anchor based on K-means algorithm:The K-Means algorithm is an unsupervised clustering algorithm, and this paper uses K-Means to cluster the anchor frames of pest species. Firstly, the number k of anchor frames to be generated is defined, then k sample pest frames are randomly selected as the initial anchor frames, the similarity between each sample frame and the anchor frame is calculated, the magnitude of similarity classifies all defective frames, and the class mean is used as the new anchor frame. In the K-Means algorithm, it is assumed that there are m samples in the training data set ,,…,, where each sample is an n-dimensional vector. At this point, the samples can be represented as an matrix:Assume that there are k classes of . In the K-Means algorithm, the Euclidean distance is used to calculate the similarity between each defective frame and the anchor frame and to classify that defective frame sample into the most similar class. The number of new clustering centres k is obtained by recalculating the divided data set. The process is repeated until the centre of mass no longer changes. The goal of the K-Means algorithm is to divide each sample into the most similar categories, and to recalculate the cluster centres using the samples in each category:where molecule represents the sum of the eigenvectors of all samples in category and the denominator represents the number of samples in category . The K-Means algorithm is calculated when the samples are classified by similarity, when the category is no longer changed, and the anchor frames are no longer updated, indicating that all defect frames of the compound skin part surface defect dataset have been clustered into representative anchor frames. In contrast, YOLOv5 updates the width and height data of the anchor frames in real-time during the training process, performing a reverse operation to update the network parameters and anchor frame data based on the difference between each predicted defect frame and the anchor frame. In this way, the anchor box data is adaptively adjusted according to the results of each training session, and its accuracy is higher.
- 3.
- Data set creation:
- (a)
- Data Enhancement:Data augmentation was applied exclusively to the training set to prevent data leakage and ensure a fair evaluation on the original test set. In general, for deep learning models to be applied to practical agricultural pest detection, many images of pest samples need to be obtained. And since the amount of data currently acquired is limited. Therefore, the pest dataset needs to be augmented with data augmentation. The enhancement of our pest dataset can do two tasks: (1) increase the number of pest samples to improve the accuracy of the model detection, and (2) ensure the stability of the model detection will not be reduced when there is noise interference at the detection site. The following data augmentation techniques were used to improve model robustness and simulate real-world conditions:
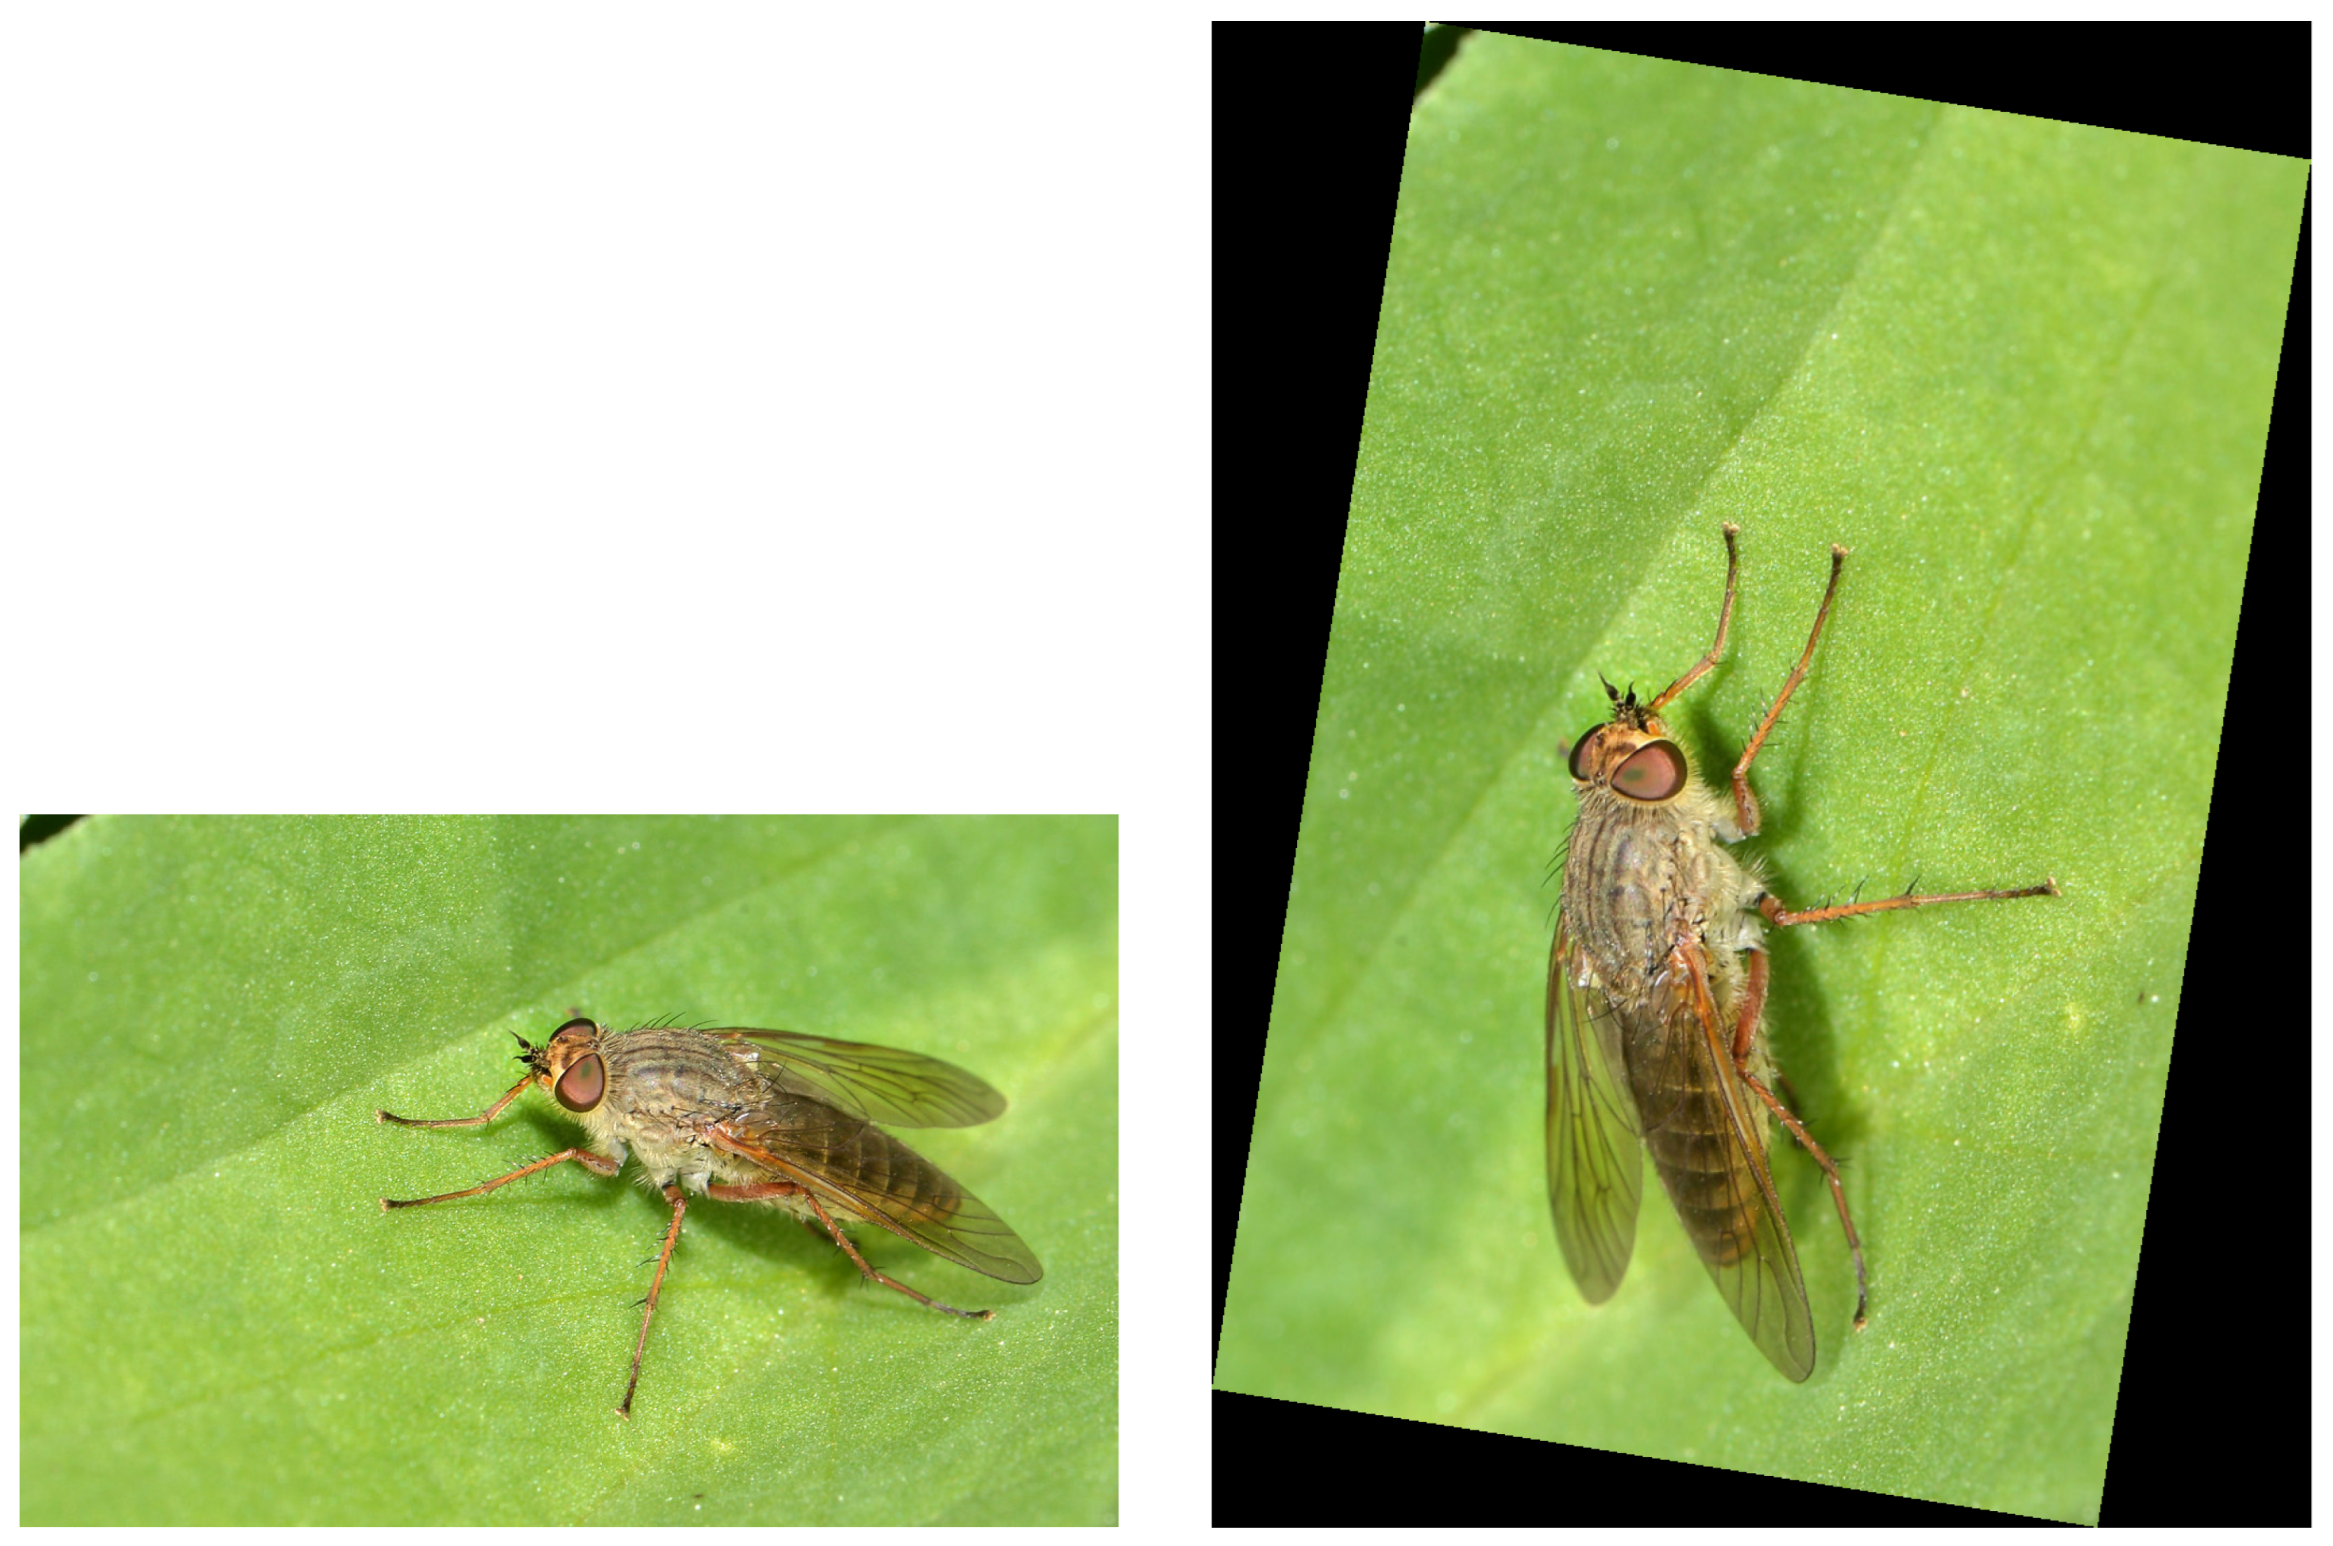
- Geometric Transformations: Mirroring, rotation (±30°), and panning (up to 20% of image width/height) were used to add viewpoint invariance. The effect of mirroring and rotating 30 degrees counter-clockwise is shown in Figure 12.To improve the neural network’s ability to locate defects anywhere in the image, we employ a translation-based data augmentation. The target defect is shifted along the X and/or Y axes over a black background, as shown in Figure 13. This technique, proven effective in prior work, trains the network to recognise targets in all image regions.
- Photometric Transformations: Brightness and contrast adjustments were applied to simulate varying lighting conditions.
- Occlusion and Scaling: Random occlusion (cutout of up to 10% of the image area) was used to simulate obstructions by leaves or debris. Scale variation (zooming between 0.8× and 1.2×) was incorporated to account for different camera-to-subject distances.
- Noise Addition: Salt-and-pepper and Gaussian noise were added to improve model resilience to sensor noise and poor acquisition conditions. One noise pattern is pretzel noise, where there are a random number of black and white noise points of random size in the image, and another is Gaussian noise, which is usually sensor noise caused by poor lighting conditions or high temperatures. The effect of adding noise is shown in Figure 14.
- (b)
- Data labelling:The defective dataset was annotated using the deep learning dataset annotation tool LabelImg, as shown in Figure 15.There are two forms of target annotation for the dataset: the first is to use a rectangular box to completely encompass the target to be identified; the accuracy of the rectangular box determines how well the deep learning model learns. The second is to depict the outline details of the detected target, generating a mask image that represents the shape of the pest. As shown above, this topic uses rectangular boxes to frame the defect and annotate the defect type, the pest class, rectangular box coordinates, rectangular box length and width data, and the corresponding image to save to a file. Finally, the annotated dataset is disrupted and fed into the model in a random order for learning, and the dataset is divided into a training set and a test set in a ratio of 5:1.
3.7. Model Training Configuration
4. Experimental Results and Discussion
4.1. Image Enhancement
4.2. Image Segmentation
4.3. Pest Location and Detection
5. Discussion
5.1. Comparative Analysis with Existing Studies
5.2. Analysis of Filter Selection and Model Reliability
5.3. Practical Benefits
- Labour Cost Reduction: The automated pipeline significantly reduces the need for time-consuming and expert-driven manual pest scouting.
- Enhanced Precision and Robustness: The objective, quantitative nature of the IQA and the subsequent tailored preprocessing mitigate the subjective errors inherent in human judgment and make the deep learning model less sensitive to common image degradations.
- Scalability: The framework is designed to be scalable, suitable for deployment from small farms to large agricultural enterprises for continuous monitoring. The modular nature of the pipeline allows for the integration of different detectors or preprocessing algorithms as needed.
5.4. Limitations and Future Work
6. Conclusions and Future Outlook
Author Contributions
Funding
Institutional Review Board Statement
Informed Consent Statement
Data Availability Statement
Conflicts of Interest
References
- Kamilaris, A.; Prenafeta-Boldú, F.X. Deep Learning in Agriculture: A Survey. Comput. Electron. Agric. 2018, 147, 70–90. [Google Scholar] [CrossRef]
- Mittal, A.; Moorthy, A.K.; Bovik, A.C. No-Reference Image Quality Assessment in the Spatial Domain. IEEE Trans. Image Process. 2012, 21, 4695–4708. [Google Scholar] [CrossRef]
- Bosse, S.; Maniry, D.; Müller, K.R.; Wiegand, T.; Samek, W. Deep Neural Networks for No-Reference and Full-Reference Image Quality Assessment. IEEE Trans. Image Process. 2018, 27, 206–219. [Google Scholar] [CrossRef]
- Misra, N.N.; Dixit, Y.; Al-Mallahi, A.; Bhullar, M.S.; Upadhyay, R.; Martynenko, A. IoT, Big Data, and Artificial Intelligence in Agriculture and Food Industry. IEEE Internet Things J. 2022, 9, 6305–6324. [Google Scholar] [CrossRef]
- Liakos, K.G.; Busato, P.; Moshou, D.; Pearson, S.; Bochtis, D. Machine Learning in Agriculture: A Review. Sensors 2018, 18, 2674. [Google Scholar] [CrossRef]
- Huddar, S.R.; Gowri, S.; Keerthana, K.; Vasanthi, S.; Rupanagudi, S.R. Novel algorithm for segmentation and automatic identification of pests on plants using image processing. In Proceedings of the 2012 Third International Conference on Computing, Communication and Networking Technologies (ICCCNT’12), Coimbatore, India, 6–28 July 2012; IEEE: New York, NY, USA, 2012; pp. 1–5. [Google Scholar]
- Martin, A.; Sathish, D.; Balachander, C.; Hariprasath, T.; Krishnamoorthi, G. Identification and counting of pests using extended region grow algorithm. In Proceedings of the 2015 2nd International Conference on Electronics and Communication Systems (ICECS), Coimbatore, India, 26–27 February 2015; pp. 1229–1234. [Google Scholar] [CrossRef]
- Espinoza, K.; Valera, D.L.; Torres, J.A.; López, A.; Molina-Aiz, F.D. Combination of image processing and artificial neural networks as a novel approach for the identification of Bemisia tabaci and Frankliniella occidentalis on sticky traps in greenhouse agriculture. Comput. Electron. Agric. 2016, 127, 495–505. [Google Scholar] [CrossRef]
- Nesarajan, D.; Kunalan, L.; Logeswaran, M.; Kasthuriarachchi, S.; Lungalage, D. Coconut Disease Prediction System Using Image Processing and Deep Learning Techniques. In Proceedings of the 2020 IEEE 4th International Conference on Image Processing, Applications and Systems (IPAS), Genova, Italy, 9–11 December 2020; pp. 212–217. [Google Scholar] [CrossRef]
- Eddeen, L.N.; Khoury, A.; Harfoushi, O. Developing a Computer Application for the Identification of Similar Butterfly Species Using MATLAB Image Processing. J. Soc. Sci. COES&RJ-JSS 2020, 9, 1288–1294. [Google Scholar]
- Chen, J.; Liu, Q.; Gao, L. Deep convolutional neural networks for tea tree pest recognition and diagnosis. Symmetry 2021, 13, 2140. [Google Scholar] [CrossRef]
- Yao, Y.; Zhang, Y.; Nie, W. Pest Detection in Crop Images Based on OTSU Algorithm and Deep Convolutional Neural Network. In Proceedings of the 2020 International Conference on Virtual Reality and Intelligent Systems (ICVRIS), Zhangjiajie, China, 18–19 July 2020; pp. 442–445. [Google Scholar] [CrossRef]
- Revathi, P.; Hemalatha, M. Classification of cotton leaf spot diseases using image processing edge detection techniques. In Proceedings of the 2012 International Conference on Emerging Trends in Science, Engineering and Technology (INCOSET), Tiruchirappalli, India, 13–14 December 2012; pp. 169–173. [Google Scholar] [CrossRef]
- Li, H.; Shi, H.; Du, A.; Mao, Y.; Fan, K.; Wang, Y.; Shen, Y.; Wang, S.; Xu, X.; Tian, L.; et al. Symptom recognition of disease and insect damage based on Mask R-CNN, wavelet transform, and F-RNet. Front. Plant Sci. 2022, 13, 922797. [Google Scholar] [CrossRef]
- Abdu, A.M.; Mokji, M.M.; Sheikh, U.U. Deep learning for plant disease identification from disease region images. In Proceedings of the Intelligent Robotics and Applications: 13th International Conference, ICIRA 2020, Kuala Lumpur, Malaysia, 5–7 November 2020; Springer: Berlin/Heidelberg, Germany, 2020. Proceedings 13. pp. 65–75. [Google Scholar]
- Jiang, Z.; Dong, Z.; Jiang, W.; Yang, Y. Recognition of rice leaf diseases and wheat leaf diseases based on multi-task deep transfer learning. Comput. Electron. Agric. 2021, 186, 106184. [Google Scholar] [CrossRef]
- Lu, Y.; Yi, S.; Zeng, N.; Liu, Y.; Zhang, Y. Identification of rice diseases using deep convolutional neural networks. Neurocomputing 2017, 267, 378–384. [Google Scholar] [CrossRef]
- Fuentes, A.; Yoon, S.; Kim, S.C.; Park, D.S. A robust deep-learning-based detector for real-time tomato plant diseases and pests recognition. Sensors 2017, 17, 2022. [Google Scholar] [CrossRef]
- Zhu, J.; Wu, A.; Wang, X.; Zhang, H. Identification of grape diseases using image analysis and BP neural networks. Multimed. Tools Appl. 2020, 79, 14539–14551. [Google Scholar] [CrossRef]
- Zhao, Y.; He, Y.; Xu, X. A novel algorithm for damage recognition on pest-infested oilseed rape leaves. Comput. Electron. Agric. 2012, 89, 41–50. [Google Scholar] [CrossRef]
- Gonzalez, R.C.; Woods, R.E. Digital Image Processing, 4th ed.; Pearson: New York, NY, USA, 2018. [Google Scholar]
- Zhang, W.; Xu, X.; Wang, J.; Wang, C.; Yan, Y.; Wu, A.; Ren, Y. A Comprehensive Review of Image Enhancement Techniques for Microfluidic Devices. Micromachines 2021, 12, 391. [Google Scholar] [CrossRef]
- Wu, X.; Zhan, C.; Lai, Y.K.; Cheng, M.M.; Yang, J. Ip102: A large-scale benchmark dataset for insect pest recognition. In Proceedings of the IEEE/CVF Conference on Computer Vision and Pattern Recognition, Long Beach, CA, USA, 16–17 June 2019; pp. 8787–8796. [Google Scholar]
- Institutes of Physical Science, Chinese Academy of Sciences. Progress in Bioinspired Controllable Droplet Manipulation. 30 December 2022. Available online: http://www.icgroupcas.cn/website_bchtk/index.html (accessed on 1 September 2025).
- Yuwono, B. Image smoothing menggunakan mean filtering, median filtering, modus filtering dan gaussian filtering. Telemat. J. Inform. Dan Teknol. Inf. 2015, 7, 65–75. [Google Scholar] [CrossRef]
- Jing-Yi, L.; Hong, L.; Dong, Y.; Yan-Sheng, Z. A new wavelet threshold function and denoising application. Math. Probl. Eng. 2016, 2016, 3195492. [Google Scholar] [CrossRef]
- Liu, Z.; Yan, W.Q.; Yang, M.L. Image denoising based on a CNN model. In Proceedings of the 2018 4th International Conference on Control, Automation and Robotics (ICCAR), Auckland, New Zealand, 20–23 April 2018; IEEE: New Rok, NY, USA, 2018; pp. 389–393. [Google Scholar]
- Tran, L.D.; Nguyen, S.M.; Arai, M. GAN-based noise model for denoising real images. In Proceedings of the Asian Conference on Computer Vision, Kyoto, Japan, 30 November–4 December 2020. [Google Scholar]
- Sekehravani, E.A.; Babulak, E.; Masoodi, M. Implementing canny edge detection algorithm for noisy image. Bull. Electr. Eng. Inform. 2020, 9, 1404–1410. [Google Scholar] [CrossRef]
- Ravivarma, G.; Gavaskar, K.; Malathi, D.; Asha, K.; Ashok, B.; Aarthi, S. Implementation of Sobel operator based image edge detection on FPGA. Mater. Today Proc. 2021, 45, 2401–2407. [Google Scholar] [CrossRef]
- Yue, Y.; Cheng, X.; Zhang, D.; Wu, Y.; Zhao, Y.; Chen, Y.; Fan, G.; Zhang, Y. Deep recursive super resolution network with Laplacian Pyramid for better agricultural pest surveillance and detection. Comput. Electron. Agric. 2018, 150, 26–32. [Google Scholar] [CrossRef]
- Wang, T.; Zhang, T.; Liu, L.; Wiliem, A.; Lovell, B. Cannygan: Edge-preserving image translation with disentangled features. In Proceedings of the 2019 IEEE International Conference on Image Processing (ICIP), Taipei, Taiwan, 22–29 September 2019; IEEE: New York, NY, USA, 2019; pp. 514–518. [Google Scholar]
- Li, Y.; Wang, H.; Dang, L.M.; Sadeghi-Niaraki, A.; Moon, H. Crop pest recognition in natural scenes using convolutional neural networks. Comput. Electron. Agric. 2020, 169, 105174. [Google Scholar] [CrossRef]
- Bhargavi, K.; Jyothi, S. A survey on threshold based segmentation technique in image processing. Int. J. Innov. Res. Dev. 2014, 3, 234–239. [Google Scholar]
- Gupta, D.; Anand, R.S. A hybrid edge-based segmentation approach for ultrasound medical images. Biomed. Signal Process. Control 2017, 31, 116–126. [Google Scholar] [CrossRef]
- Lu, Y.; Chen, Y.; Zhao, D.; Chen, J. Graph-FCN for image semantic segmentation. In Proceedings of the Advances in Neural Networks–ISNN 2019: 16th International Symposium on Neural Networks, ISNN 2019, Moscow, Russia, 10–12 July 2019; Springer: Berlin/Heidelberg, Germany, 2019. Proceedings, Part I 16. pp. 97–105. [Google Scholar]
- Siddique, N.; Paheding, S.; Elkin, C.P.; Devabhaktuni, V. U-net and its variants for medical image segmentation: A review of theory and applications. IEEE Access 2021, 9, 82031–82057. [Google Scholar] [CrossRef]
- Lin, T.L.; Chang, H.Y.; Chen, K.H. The pest and disease identification in the growth of sweet peppers using faster R-CNN and mask R-CNN. J. Internet Technol. 2020, 21, 605–614. [Google Scholar]
- Gu, K.; Zhai, G.; Yang, X.; Zhang, W. Self-adaptive scale transform for IQA metric. In Proceedings of the 2013 IEEE International Symposium on Circuits and Systems (ISCAS), Beijing, China, 19–23 May 2013; IEEE: New York, NY, USA, 2013; pp. 2365–2368. [Google Scholar]
- Bhateja, V.; Srivastava, A.; Kalsi, A. Fast SSIM index for color images employing reduced-reference evaluation. In Proceedings of the International Conference on Frontiers of Intelligent Computing: Theory and Applications (FICTA) 2013, Odisa, India, 14–16 November 2013; Springer: Berlin/Heidelberg, Germany, 2014; pp. 451–458. [Google Scholar]
- Richardson, W.H. Bayesian-based iterative method of image restoration. J. Opt. Soc. Am. 1972, 62, 55–59. [Google Scholar] [CrossRef]
- Lucy, L.B. An iterative technique for the rectification of observed distributions. Astron. J. 1974, 79, 745. [Google Scholar] [CrossRef]





| Image | Original Image | Total Variation | Wiener |
|---|---|---|---|
| 0-11 | 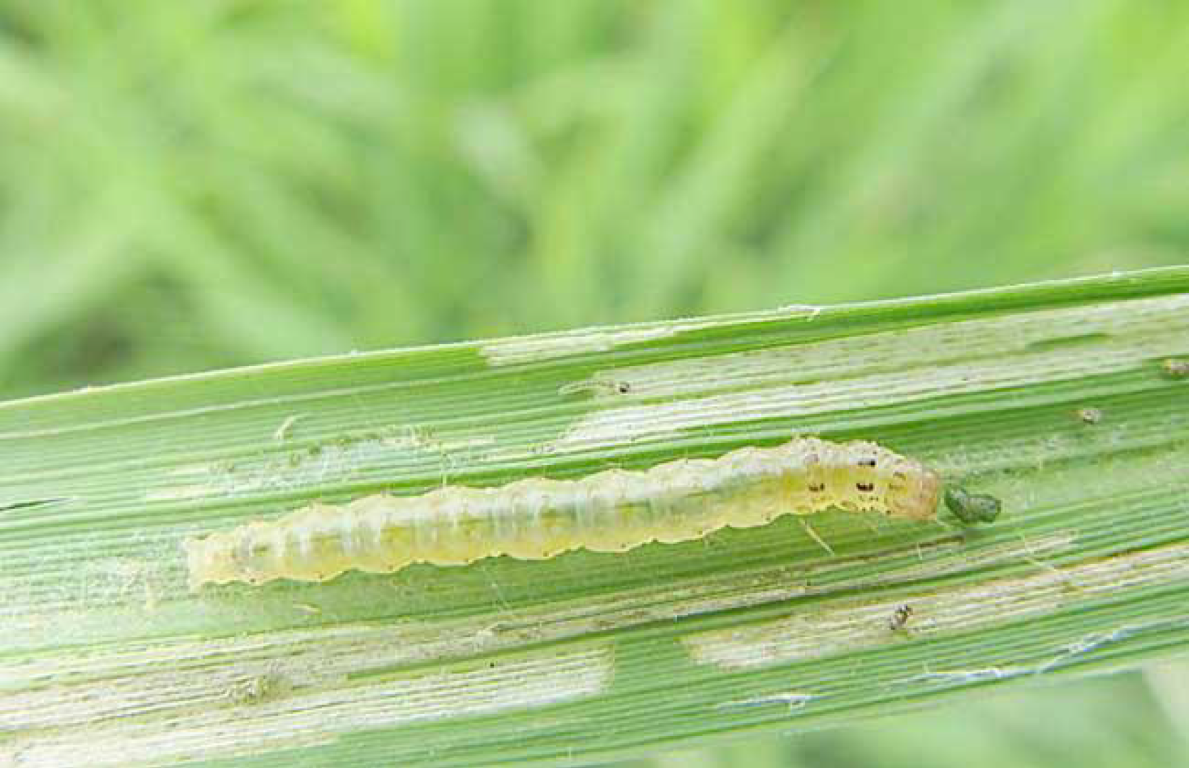 BRISQUE: 38.26 | 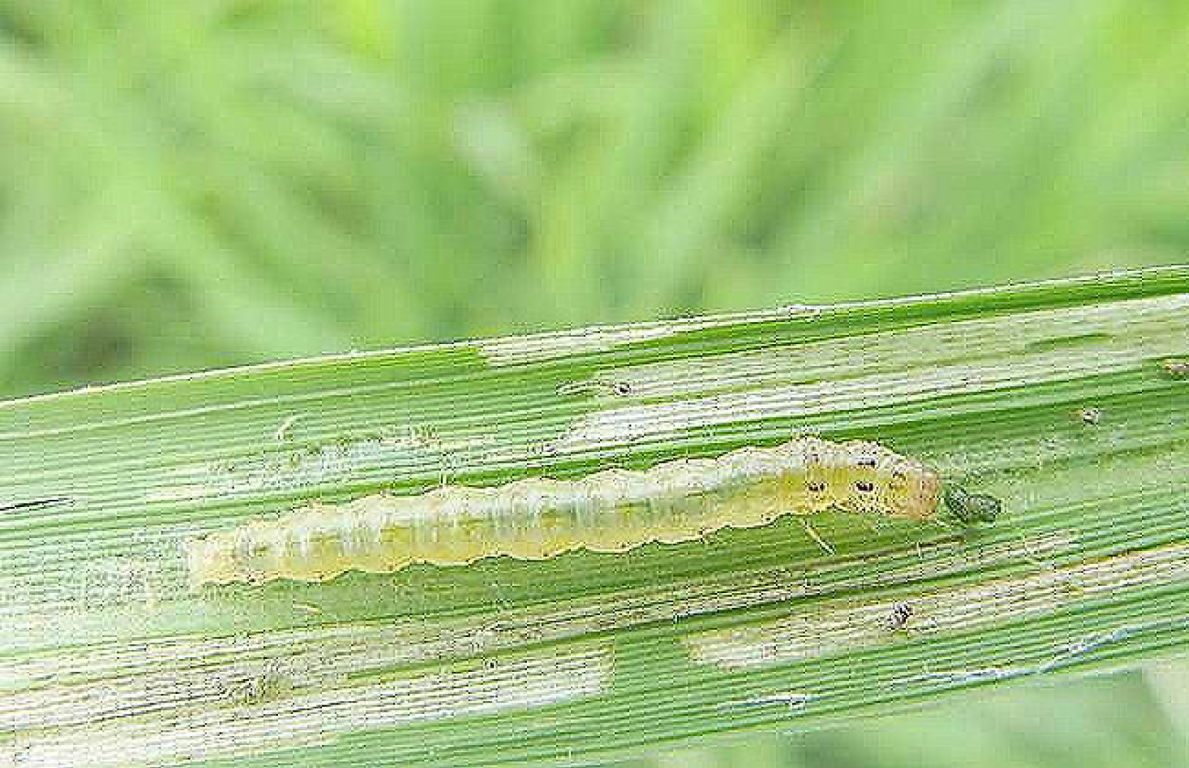 BRISQUE: 30.21 |  BRISQUE: 19.58 |
| 0-13 | 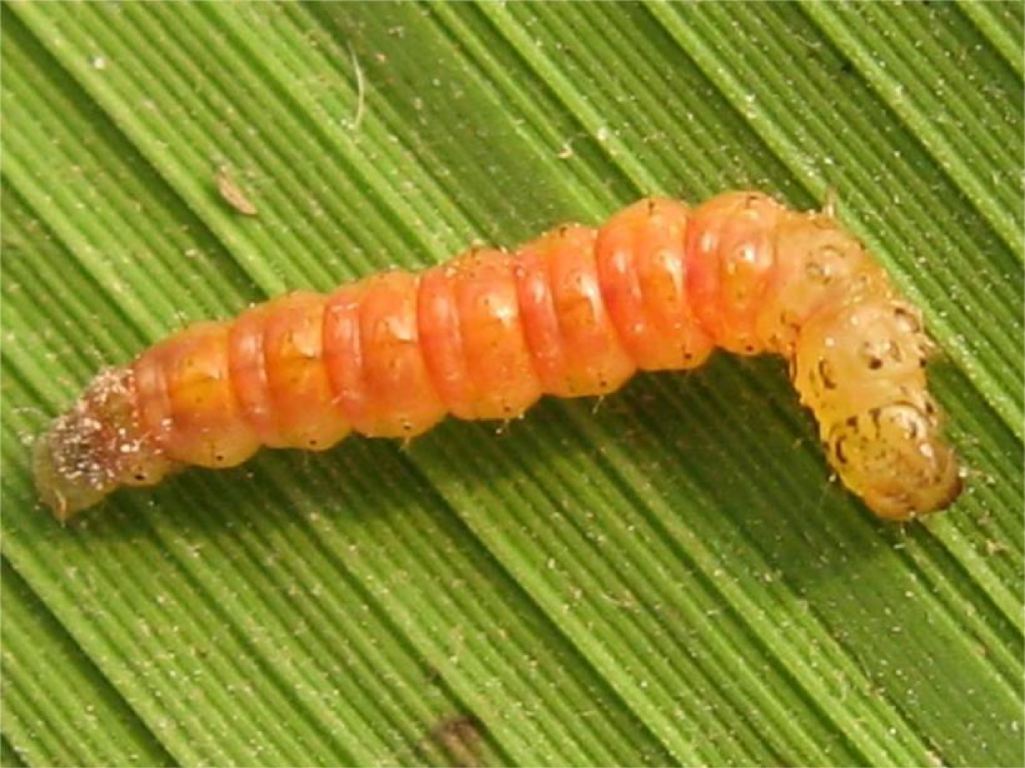 BRISQUE: 51.14 |  BRISQUE: 22.24 | 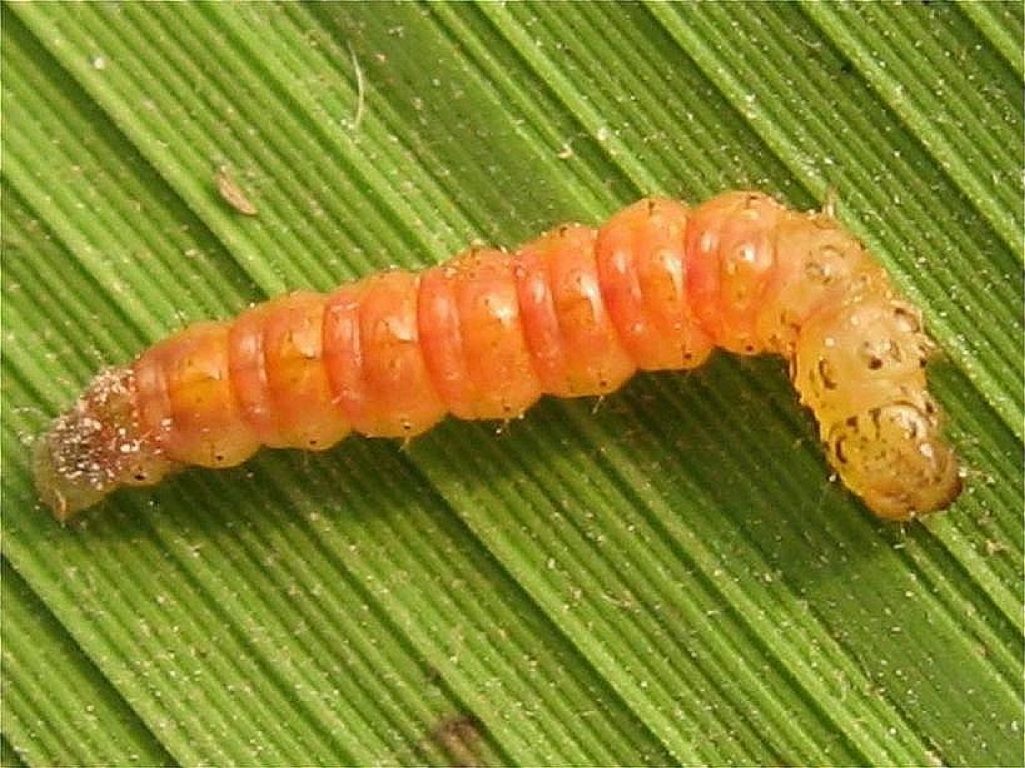 BRISQUE: 25.42 |
| 0-14 | 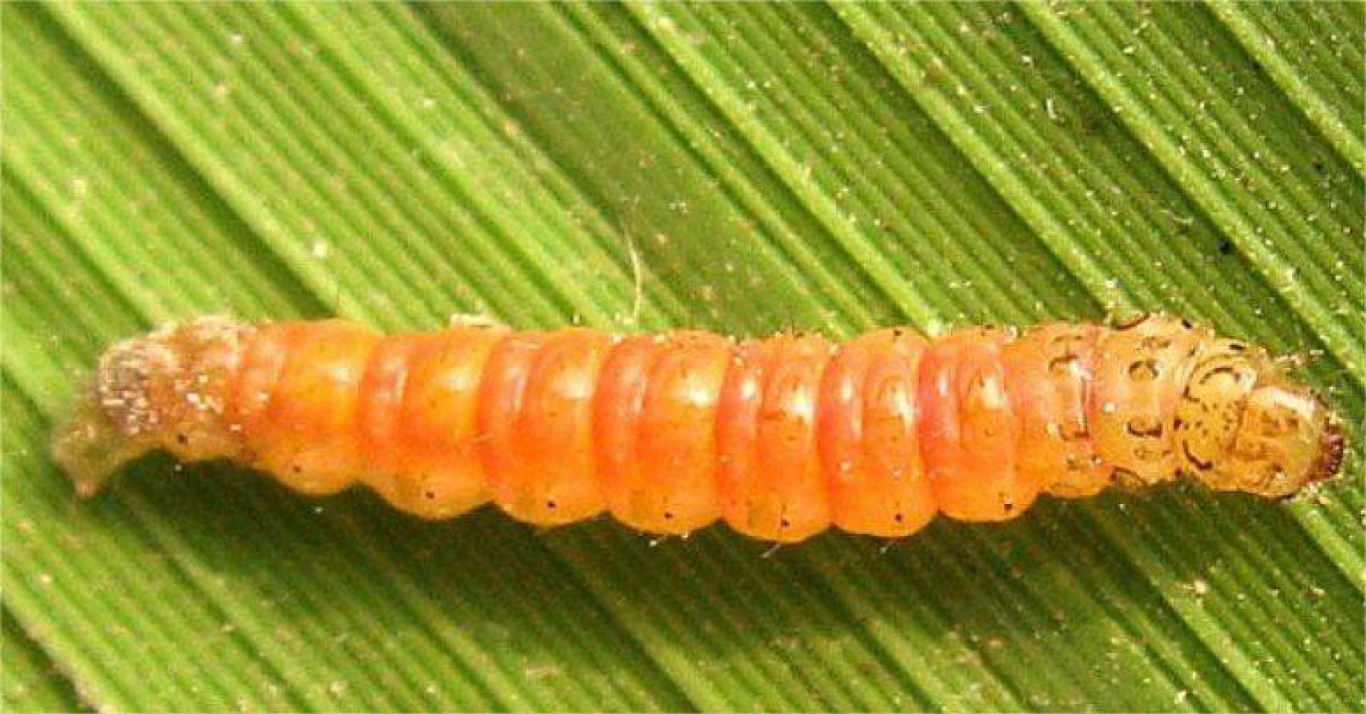 BRISQUE: 36.84 |  BRISQUE: 23.9 | 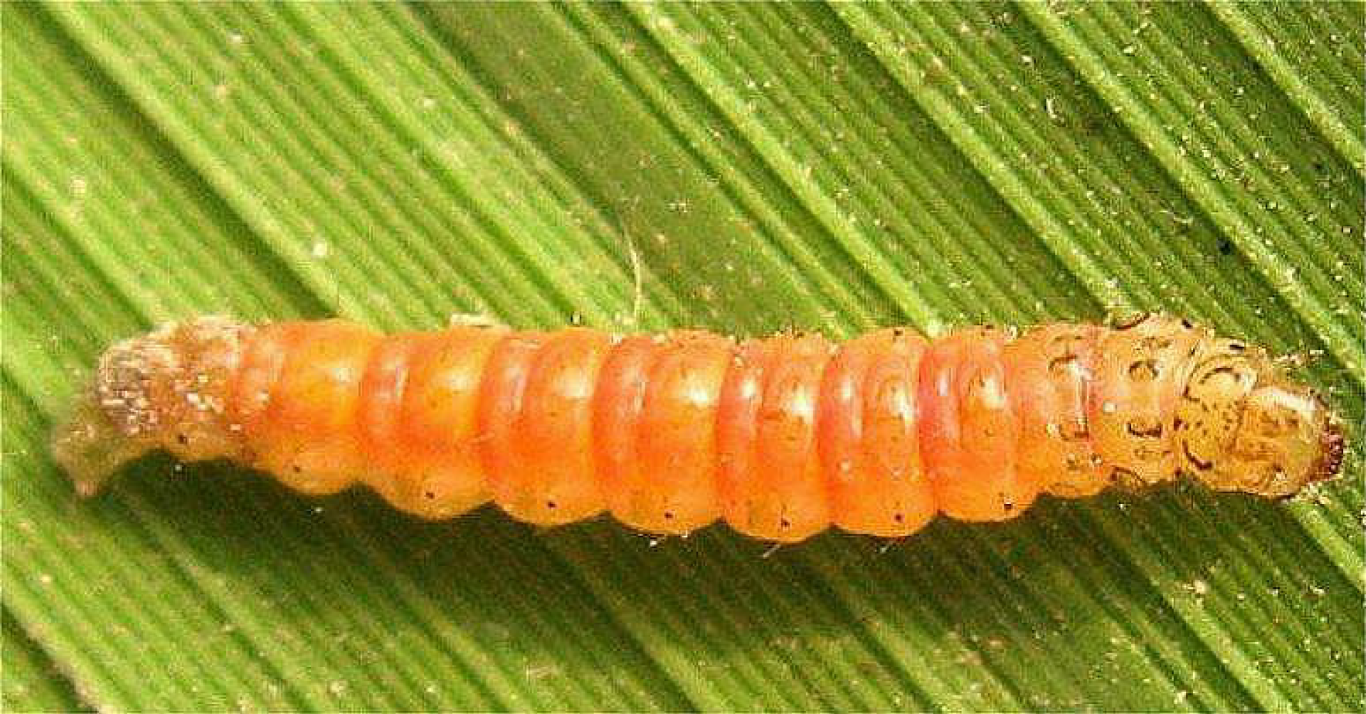 BRISQUE: 11.18 |
| 0-15 |  BRISQUE:43.46 | 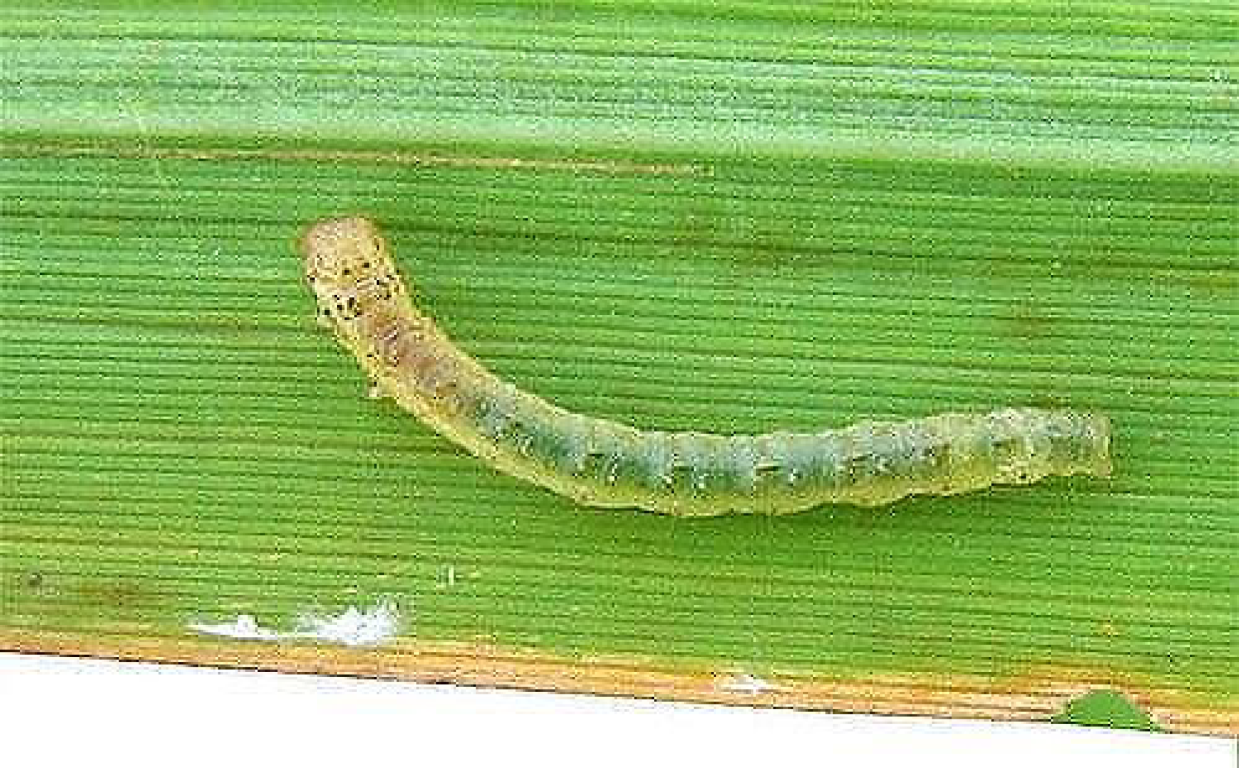 BRISQUE:43.45 | 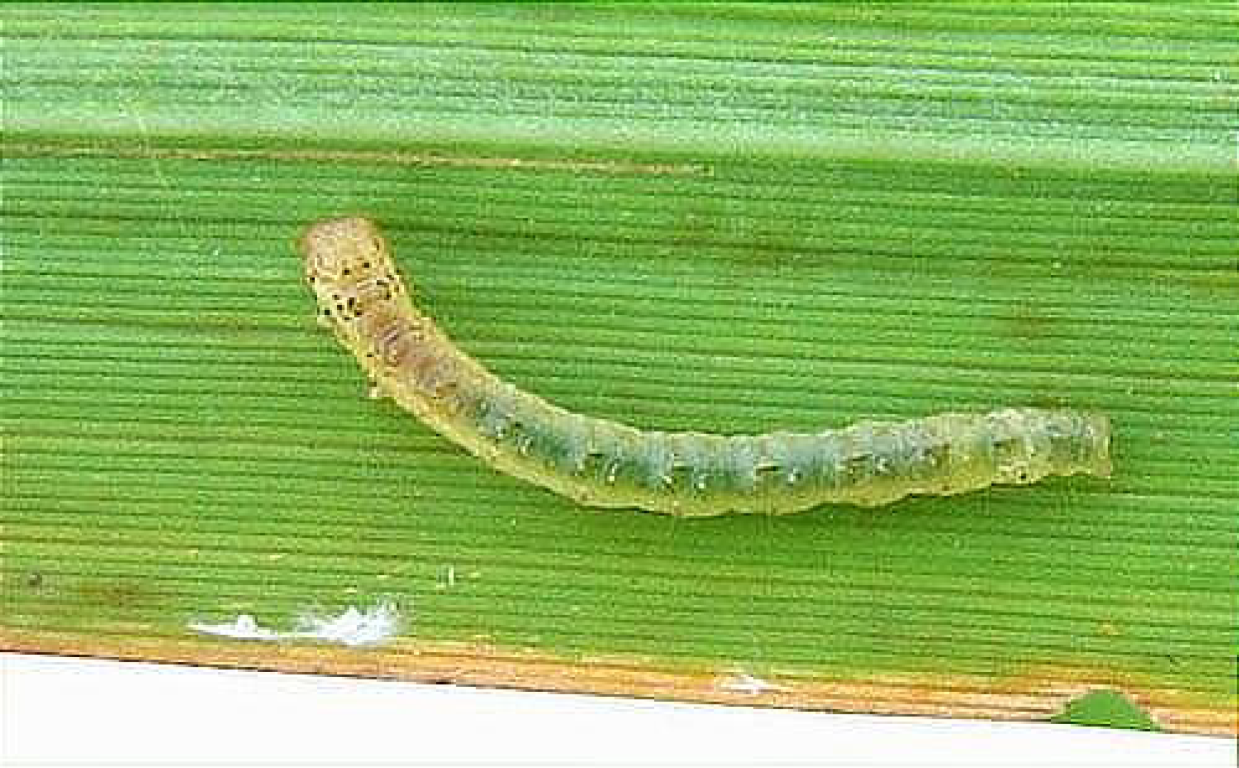 BRISQUE:43.42 |
| Image | Original Image | Richardson-Lucy | DampedLS |
|---|---|---|---|
| 0-3 | 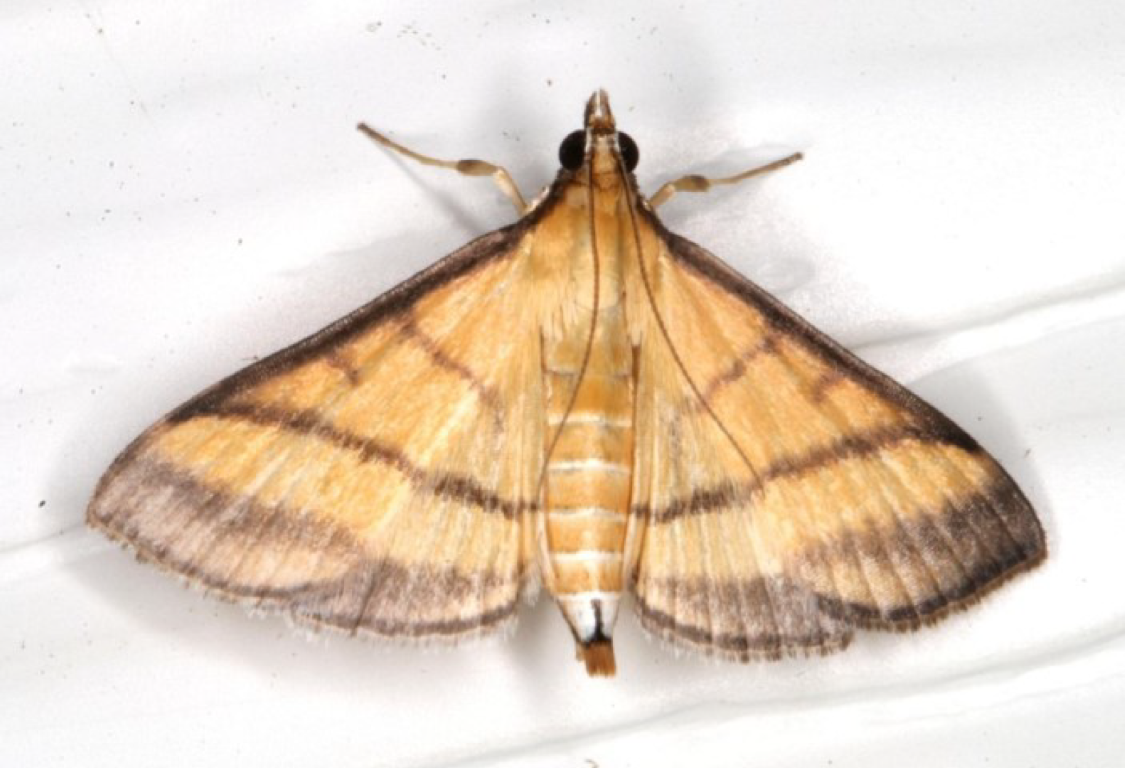 BRISQUE: 45.24 | 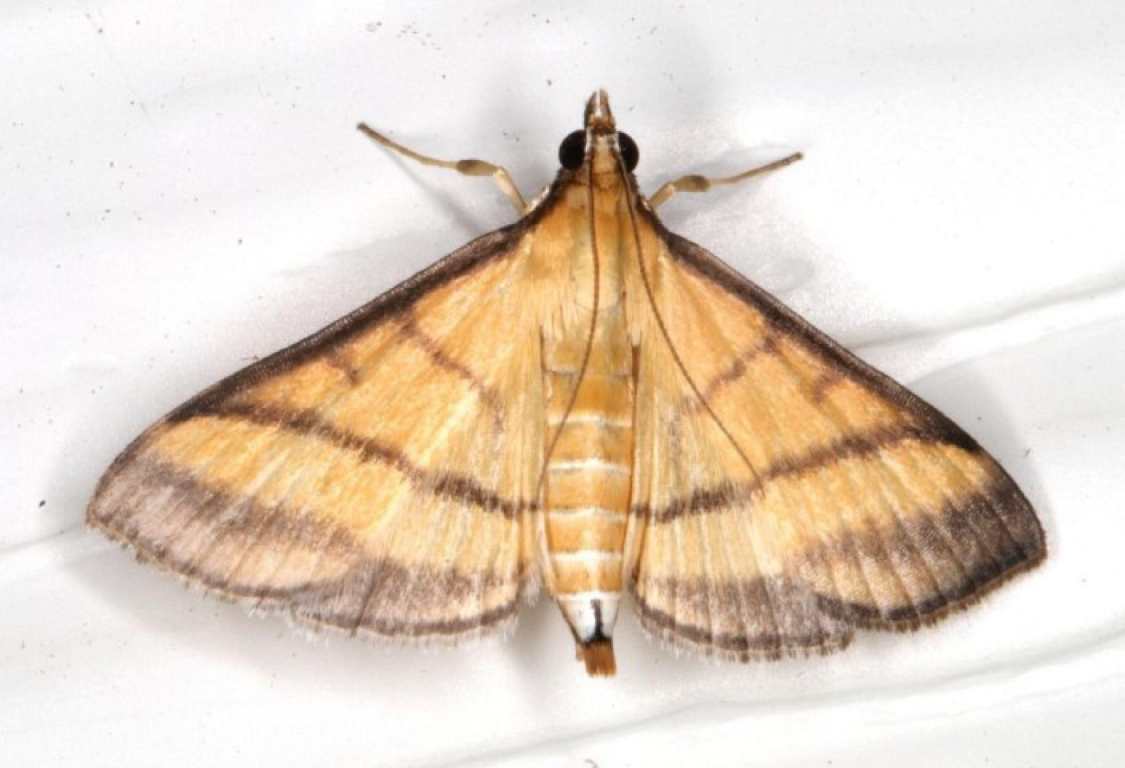 BRISQUE: 11.39 | 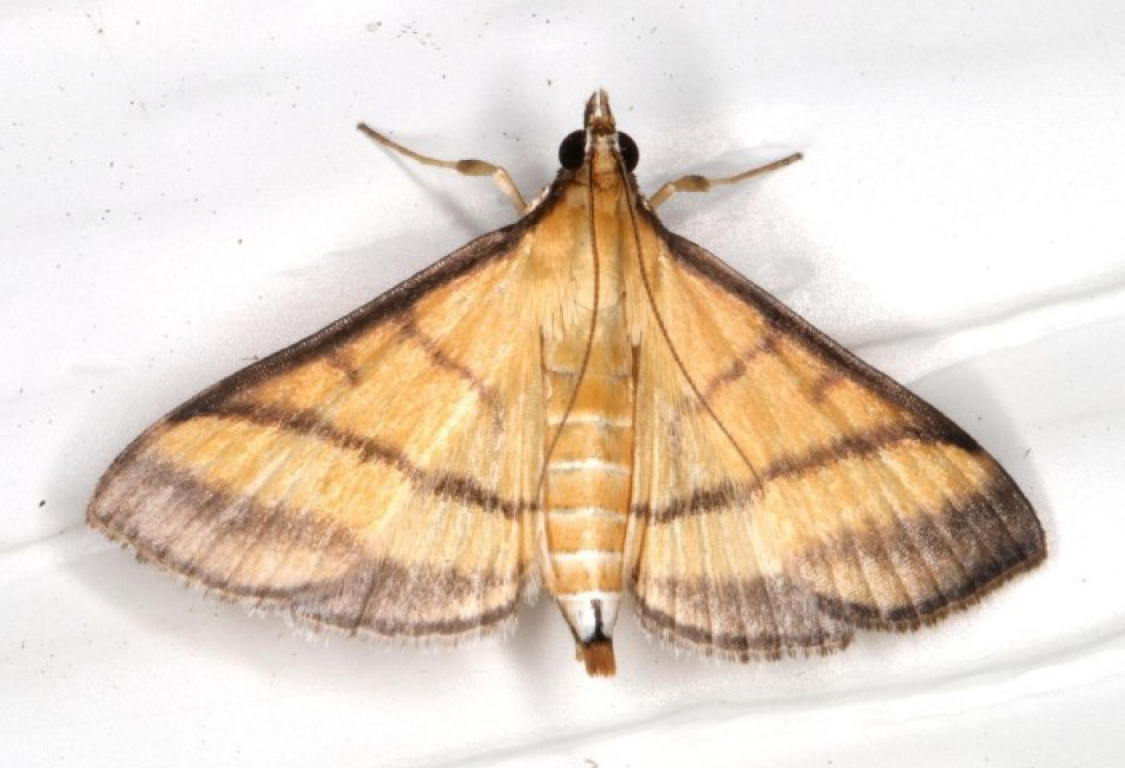 BRISQUE: 33.78 |
| 1-1 |  BRISQUE: 32.45 |  BRISQUE: 15.29 | 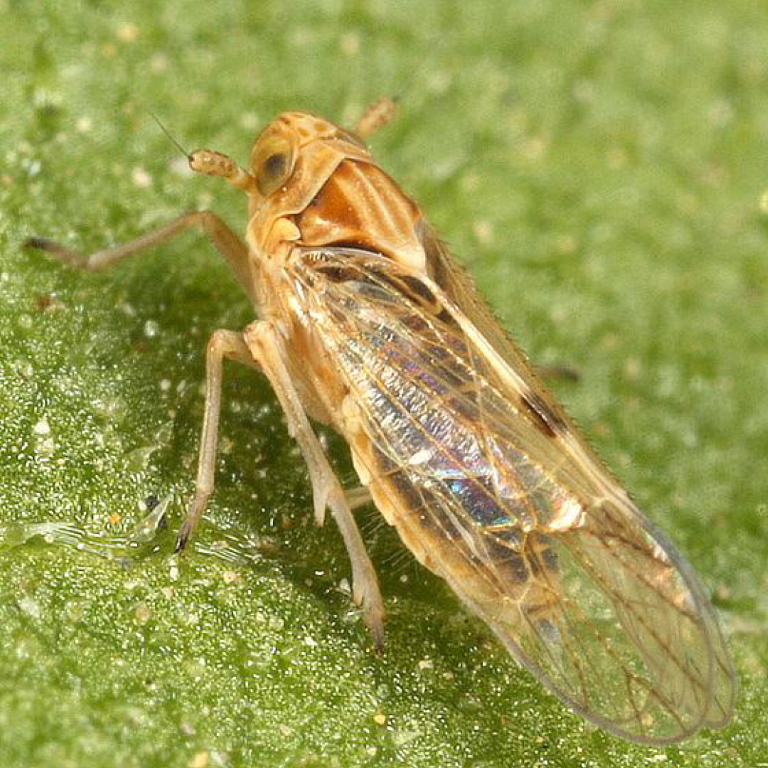 BRISQUE: 11.45 |
| 1-9 | 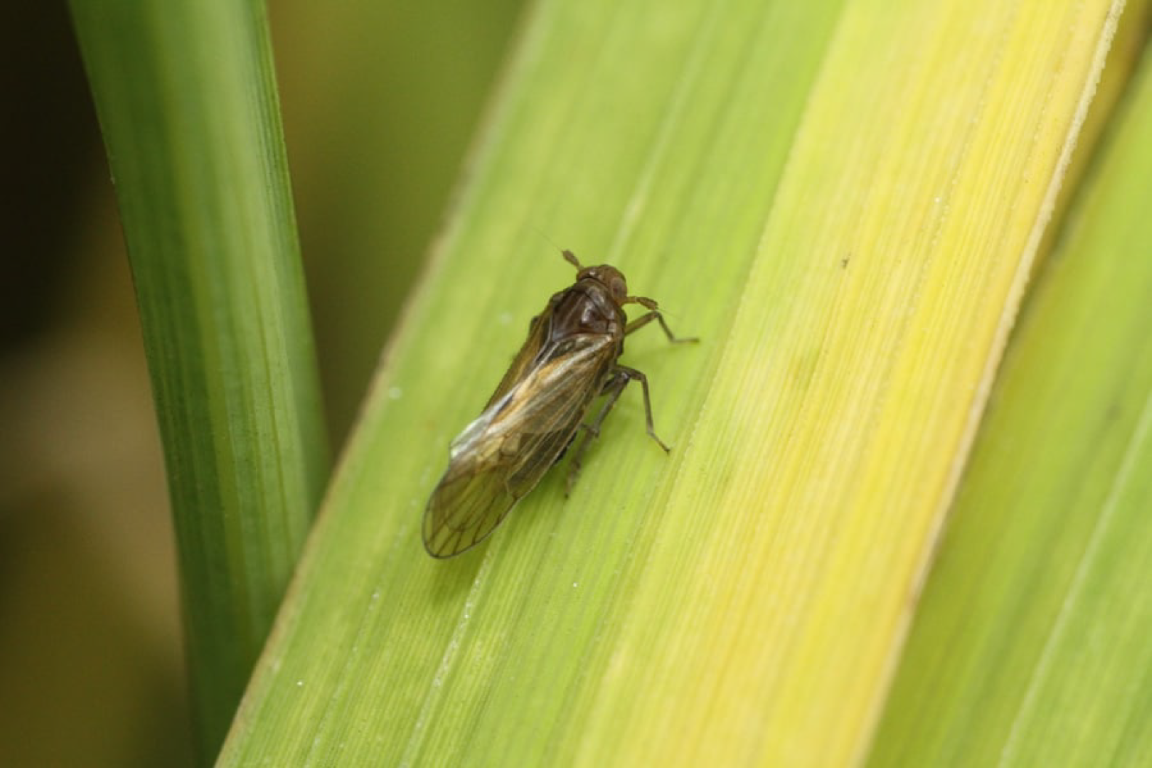 BRISQUE: 35.81 |  BRISQUE: 18.93 | 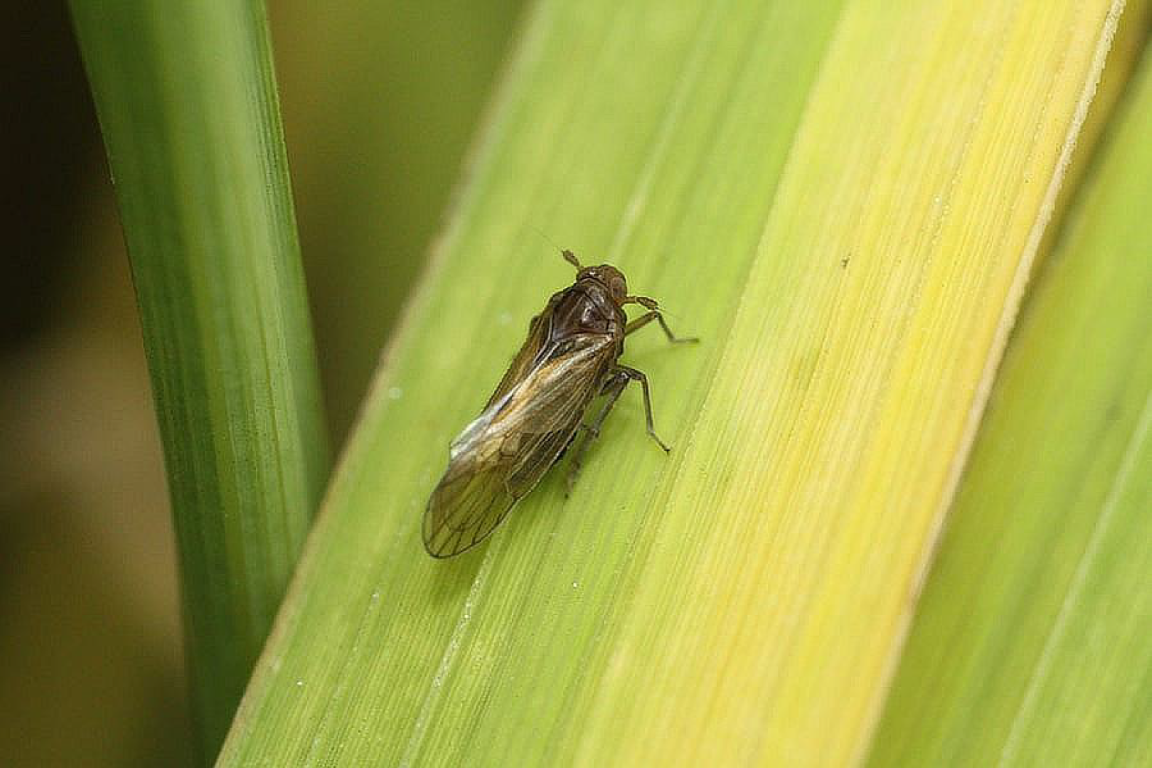 BRISQUE: 17.79 |
| 4-10 | 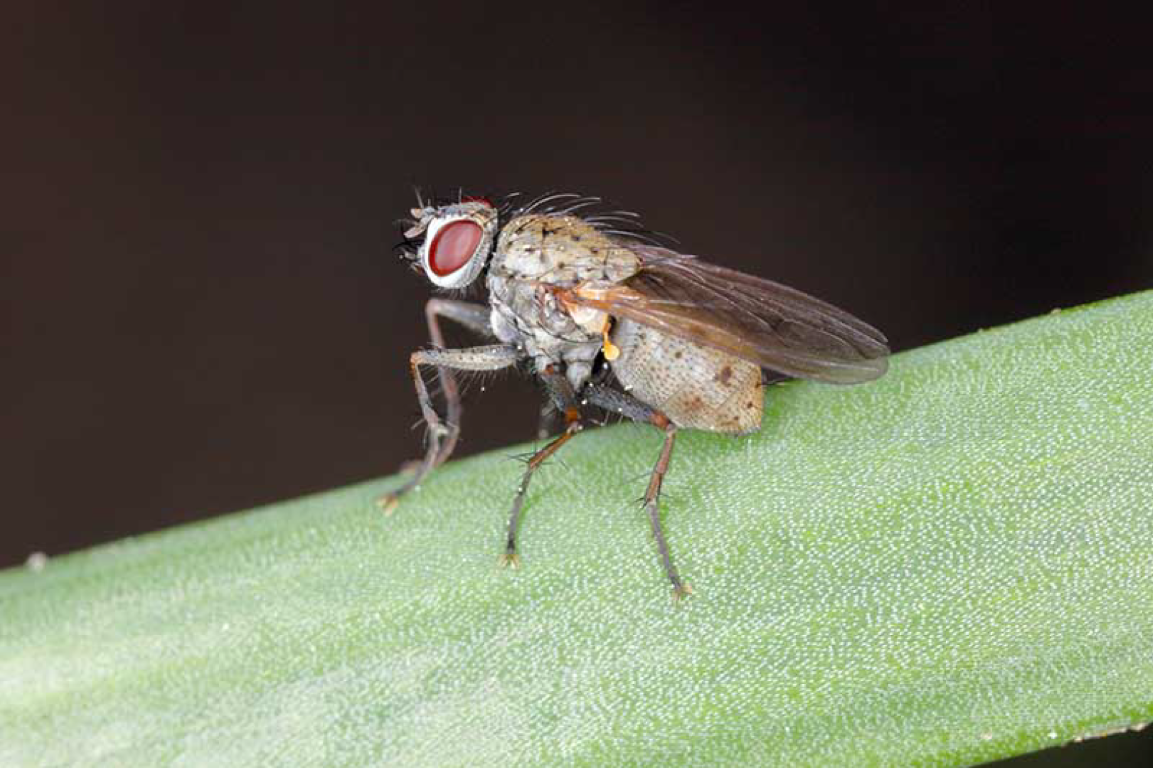 BRISQUE: 45.08 |  BRISQUE: 38.66 | 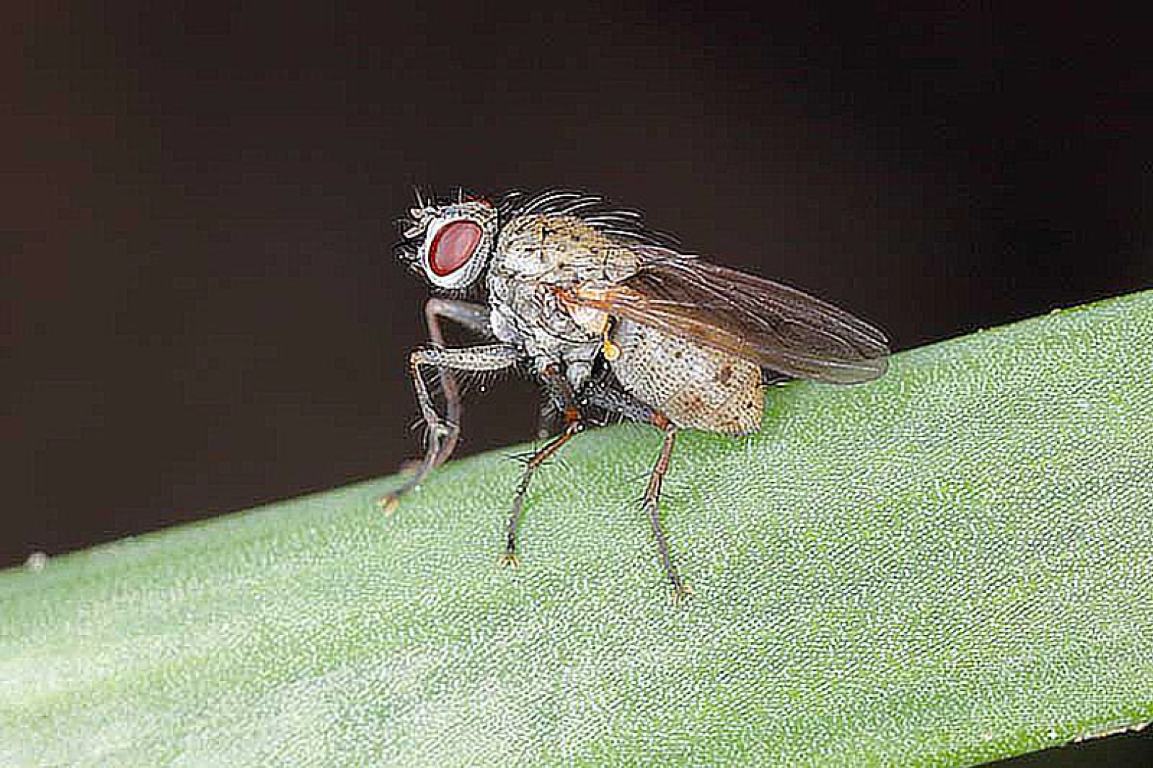 BRISQUE: 39.89 |
| Image | Original Image | Tikhonov | Sharpen |
|---|---|---|---|
| 1-1 | 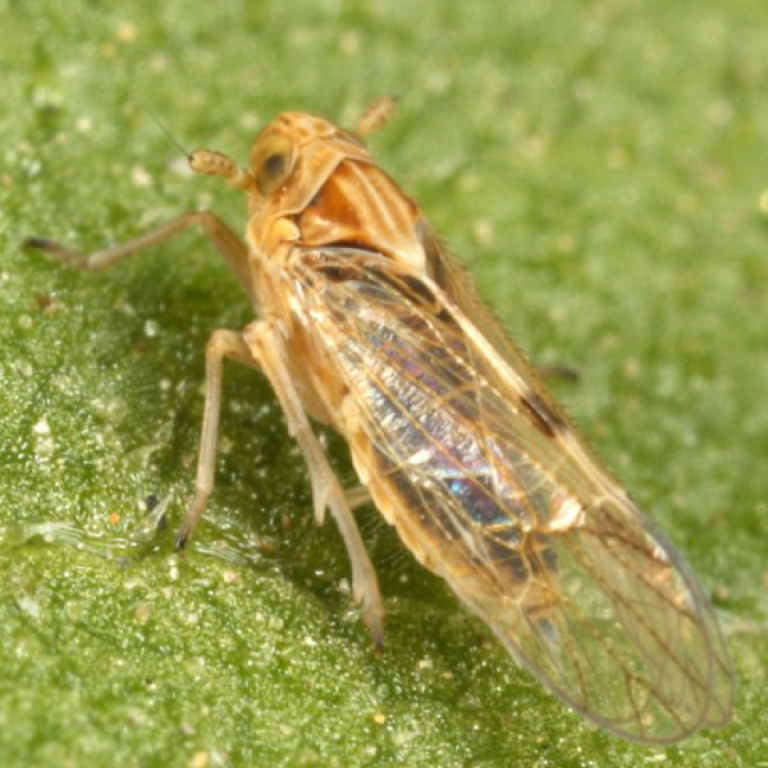 BRISQUE: 32.45 | 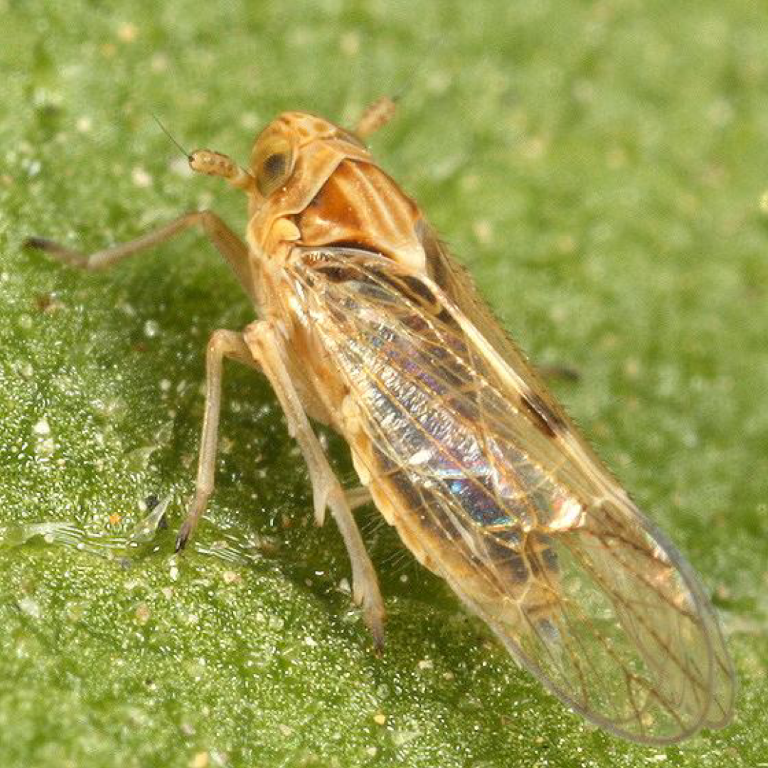 BRISQUE: 10.87 | 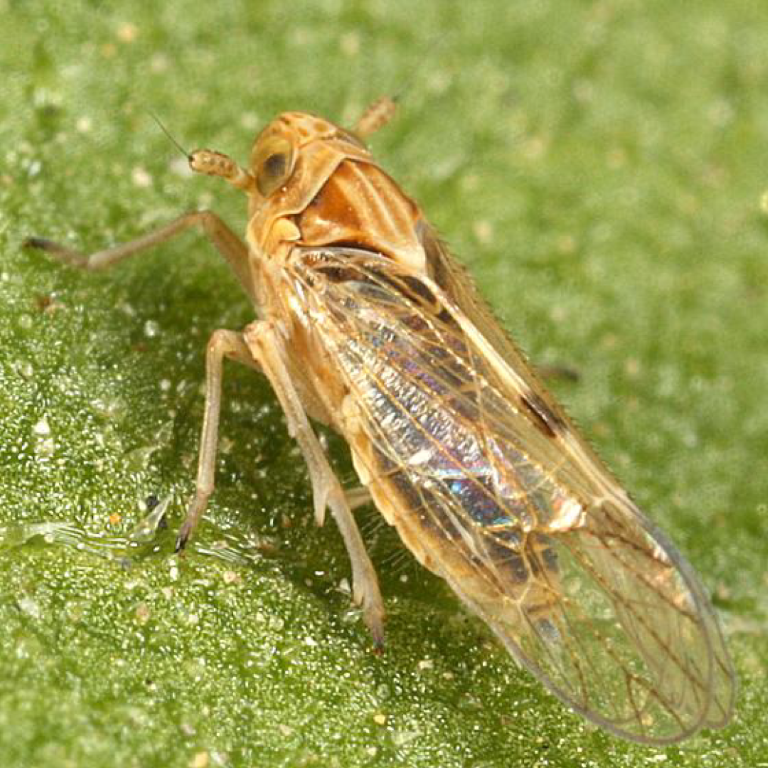 BRISQUE: 16.95 |
| 4-12 |  BRISQUE: 35.65 |  BRISQUE: 33.99 |  BRISQUE: 26.77 |
| 4-13 |  BRISQUE: 40.56 | 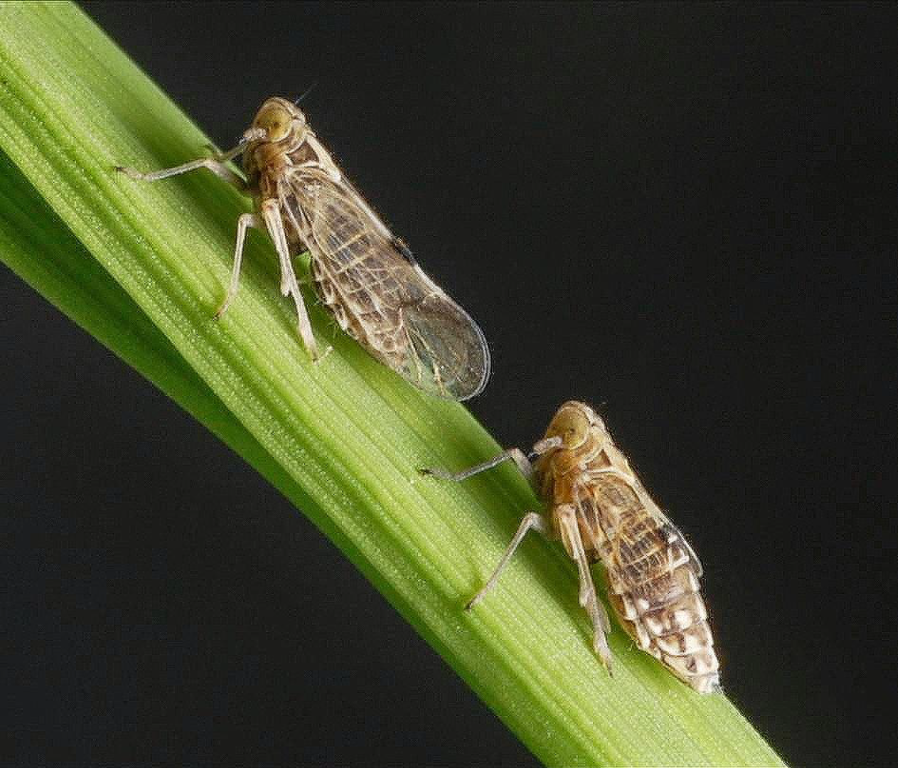 BRISQUE: 26.02 | 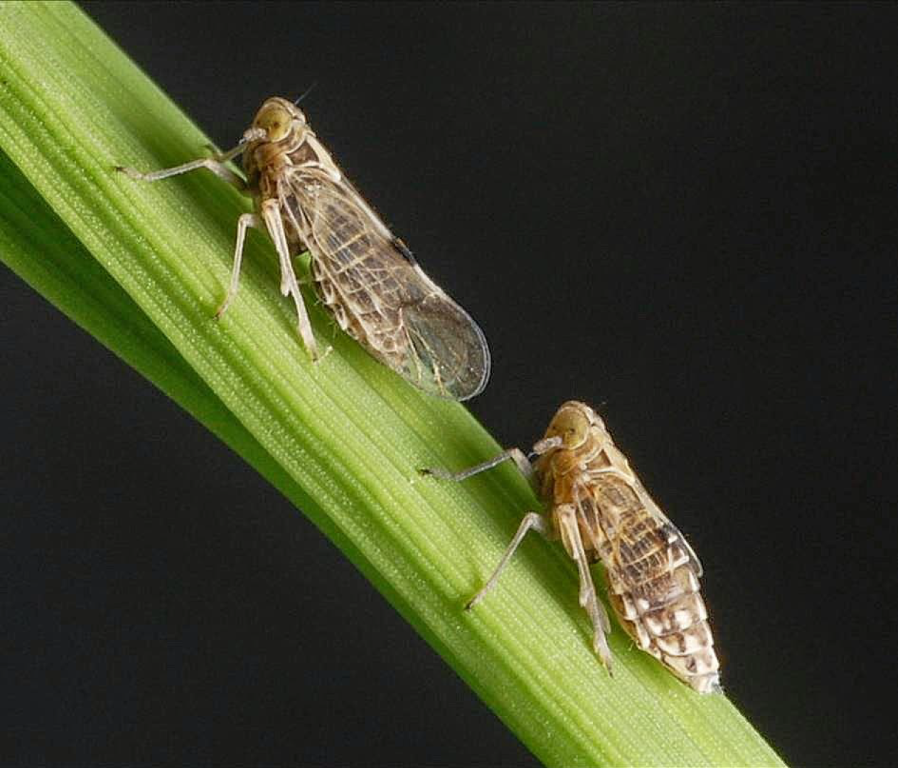 BRISQUE: 37.8 |
| leaf04 | 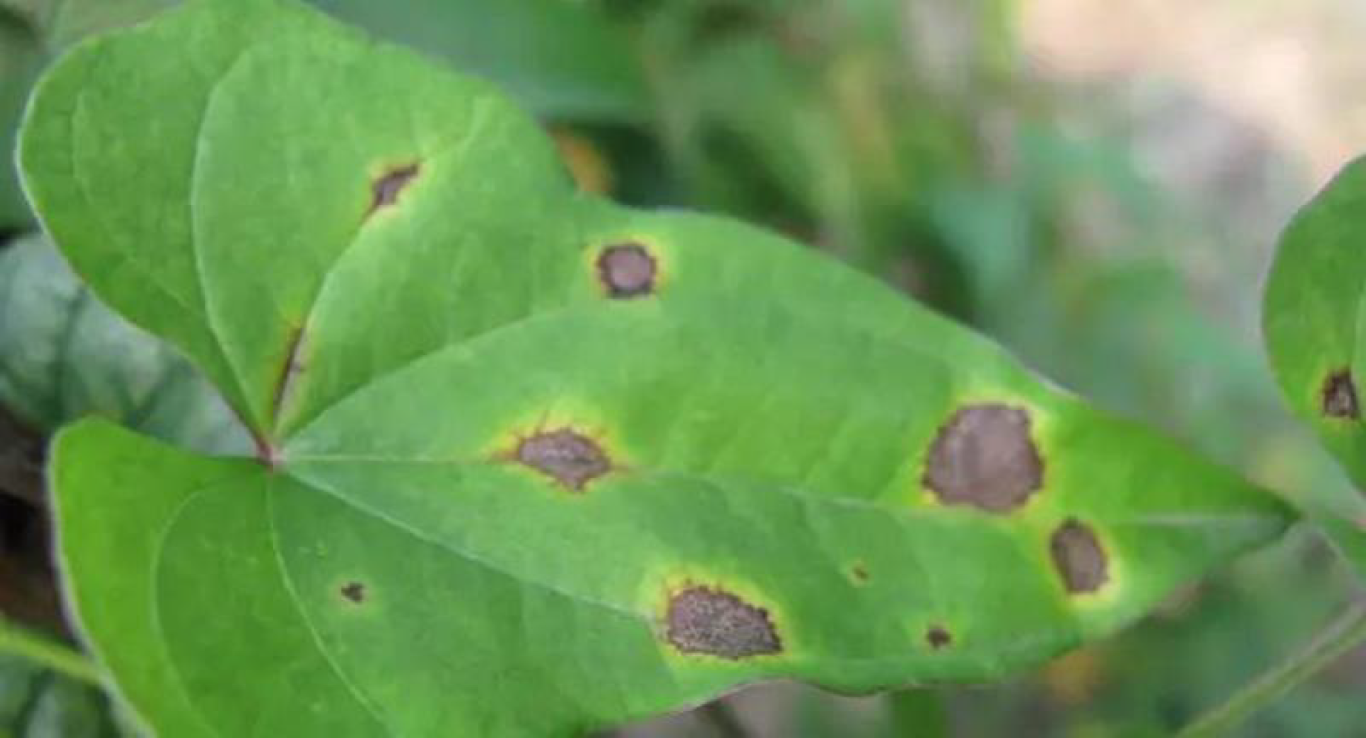 BRISQUE: 44.11 |  BRISQUE: 18.85 |  BRISQUE: 31.4 |
| Image | Original | Wiener | RL | Damped-LS | Tikhonov | Sharpen | TV |
|---|---|---|---|---|---|---|---|
| 0-11 | 38.26 | 19.58 | 29.33 | 19.35 | 27.74 | 29.46 | 30.21 |
| 0-13 | 51.14 | 25.42 | 26.85 | 26.26 | 24.24 | 37.1 | 22.24 |
| 0-14 | 36.84 | 11.18 | 13.24 | 18.27 | 13.44 | 19.07 | 23.9 |
| 0-15 | 43.46 | 43.42 | 43.43 | 43.44 | 43.46 | 43.46 | 43.45 |
| 0-17 | 34.22 | 43.7 | 37.37 | 43.31 | 34.67 | 34.14 | 31.14 |
| 0-3 | 45.24 | 32.07 | 11.39 | 33.78 | 24.16 | 42.7 | 32.68 |
| 1-1 | 32.45 | 11.81 | 15.29 | 11.45 | 10.87 | 16.95 | 23.33 |
| 1-9 | 35.81 | 18.89 | 18.93 | 17.79 | 20.9 | 22.41 | 17.72 |
| 4-10 | 45.08 | 37.84 | 38.66 | 39.89 | 36.69 | 45 | 32.63 |
| 4-12 | 35.65 | 28.16 | 33.49 | 29.4 | 33.99 | 26.77 | 20.32 |
| 4-13 | 40.56 | 26.35 | 21.76 | 24.03 | 26.02 | 37.8 | 26.42 |
| leaf.04 | 44.11 | 28.47 | 26.52 | 30.39 | 18.85 | 31.4 | 27.81 |
| Image ID | Original BRISQUE | Best Filter | Final BRISQUE | PIQE Improvement |
|---|---|---|---|---|
| 0-11 | 38.26 | Wiener | 19.58 | Yes |
| 0-13 | 51.14 | Total Variation | 22.24 | Yes |
| 0-14 | 36.84 | Wiener | 11.18 | Yes |
| 0-3 | 45.24 | Lucy–Richardson | 11.39 | Yes |
| 1-1 | 32.45 | Tikhonov | 10.87 | Yes |
| 4-13 | 40.56 | Lucy–Richardson | 21.76 | Yes |
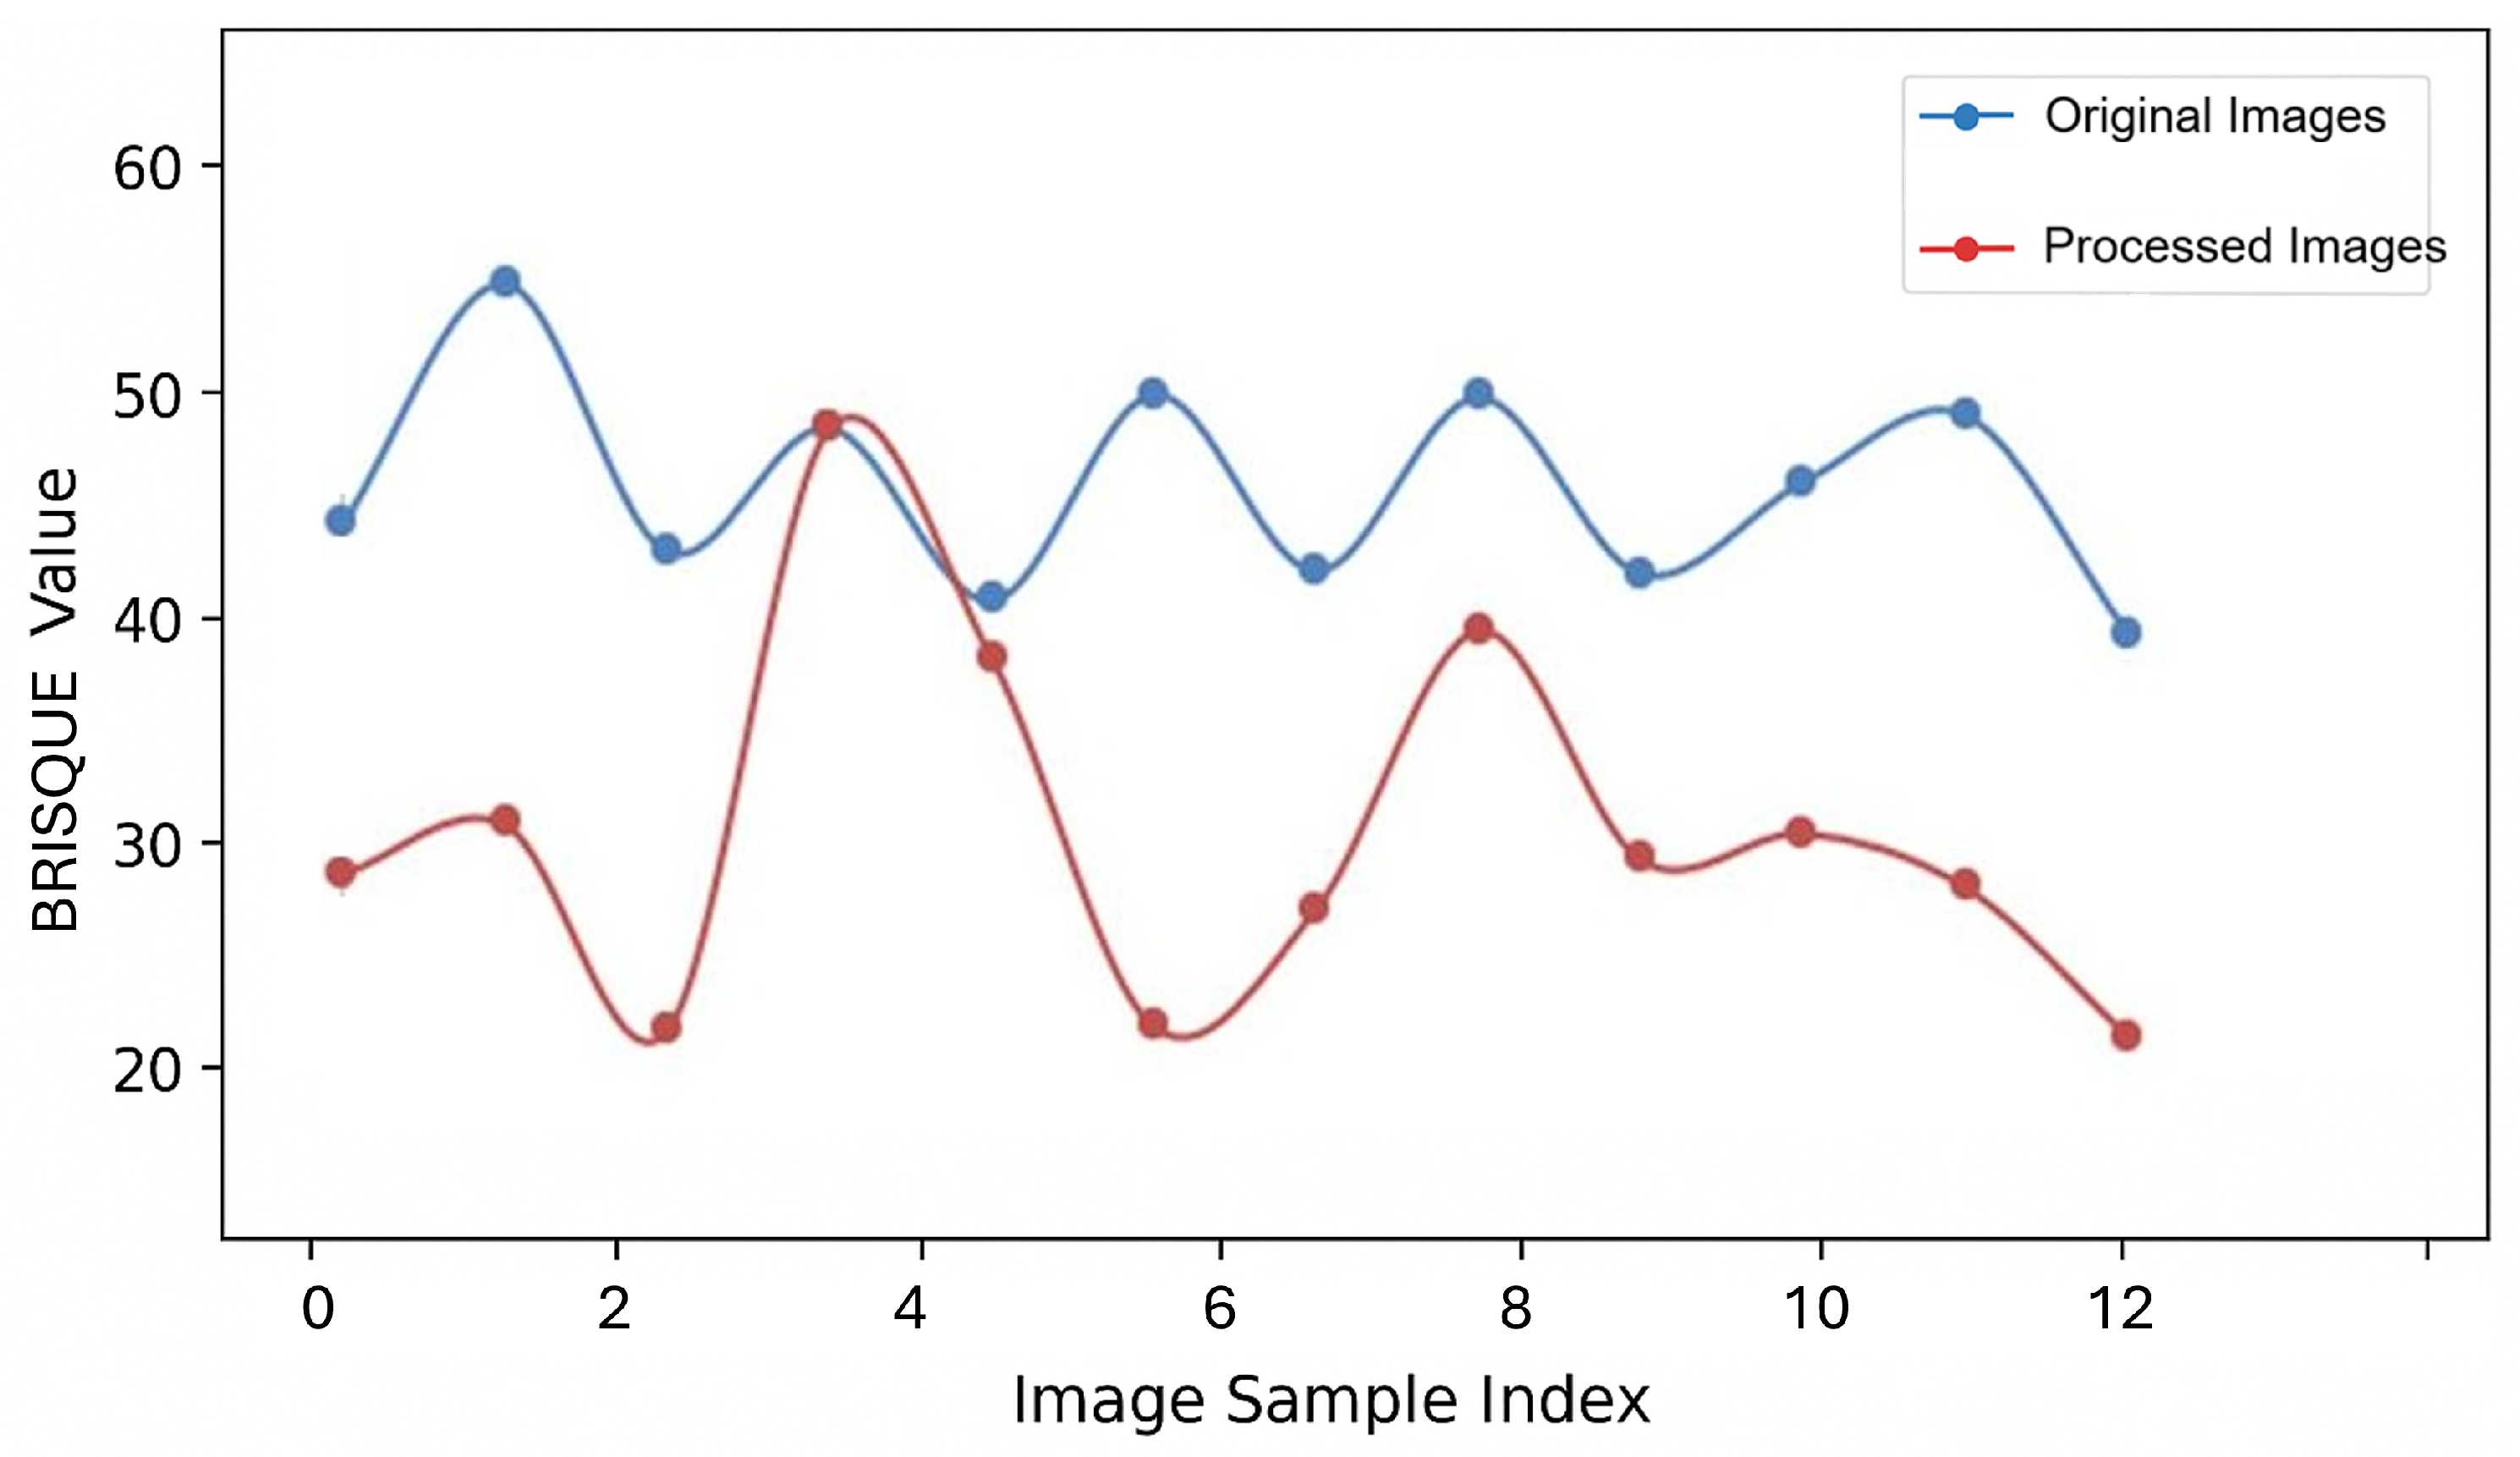
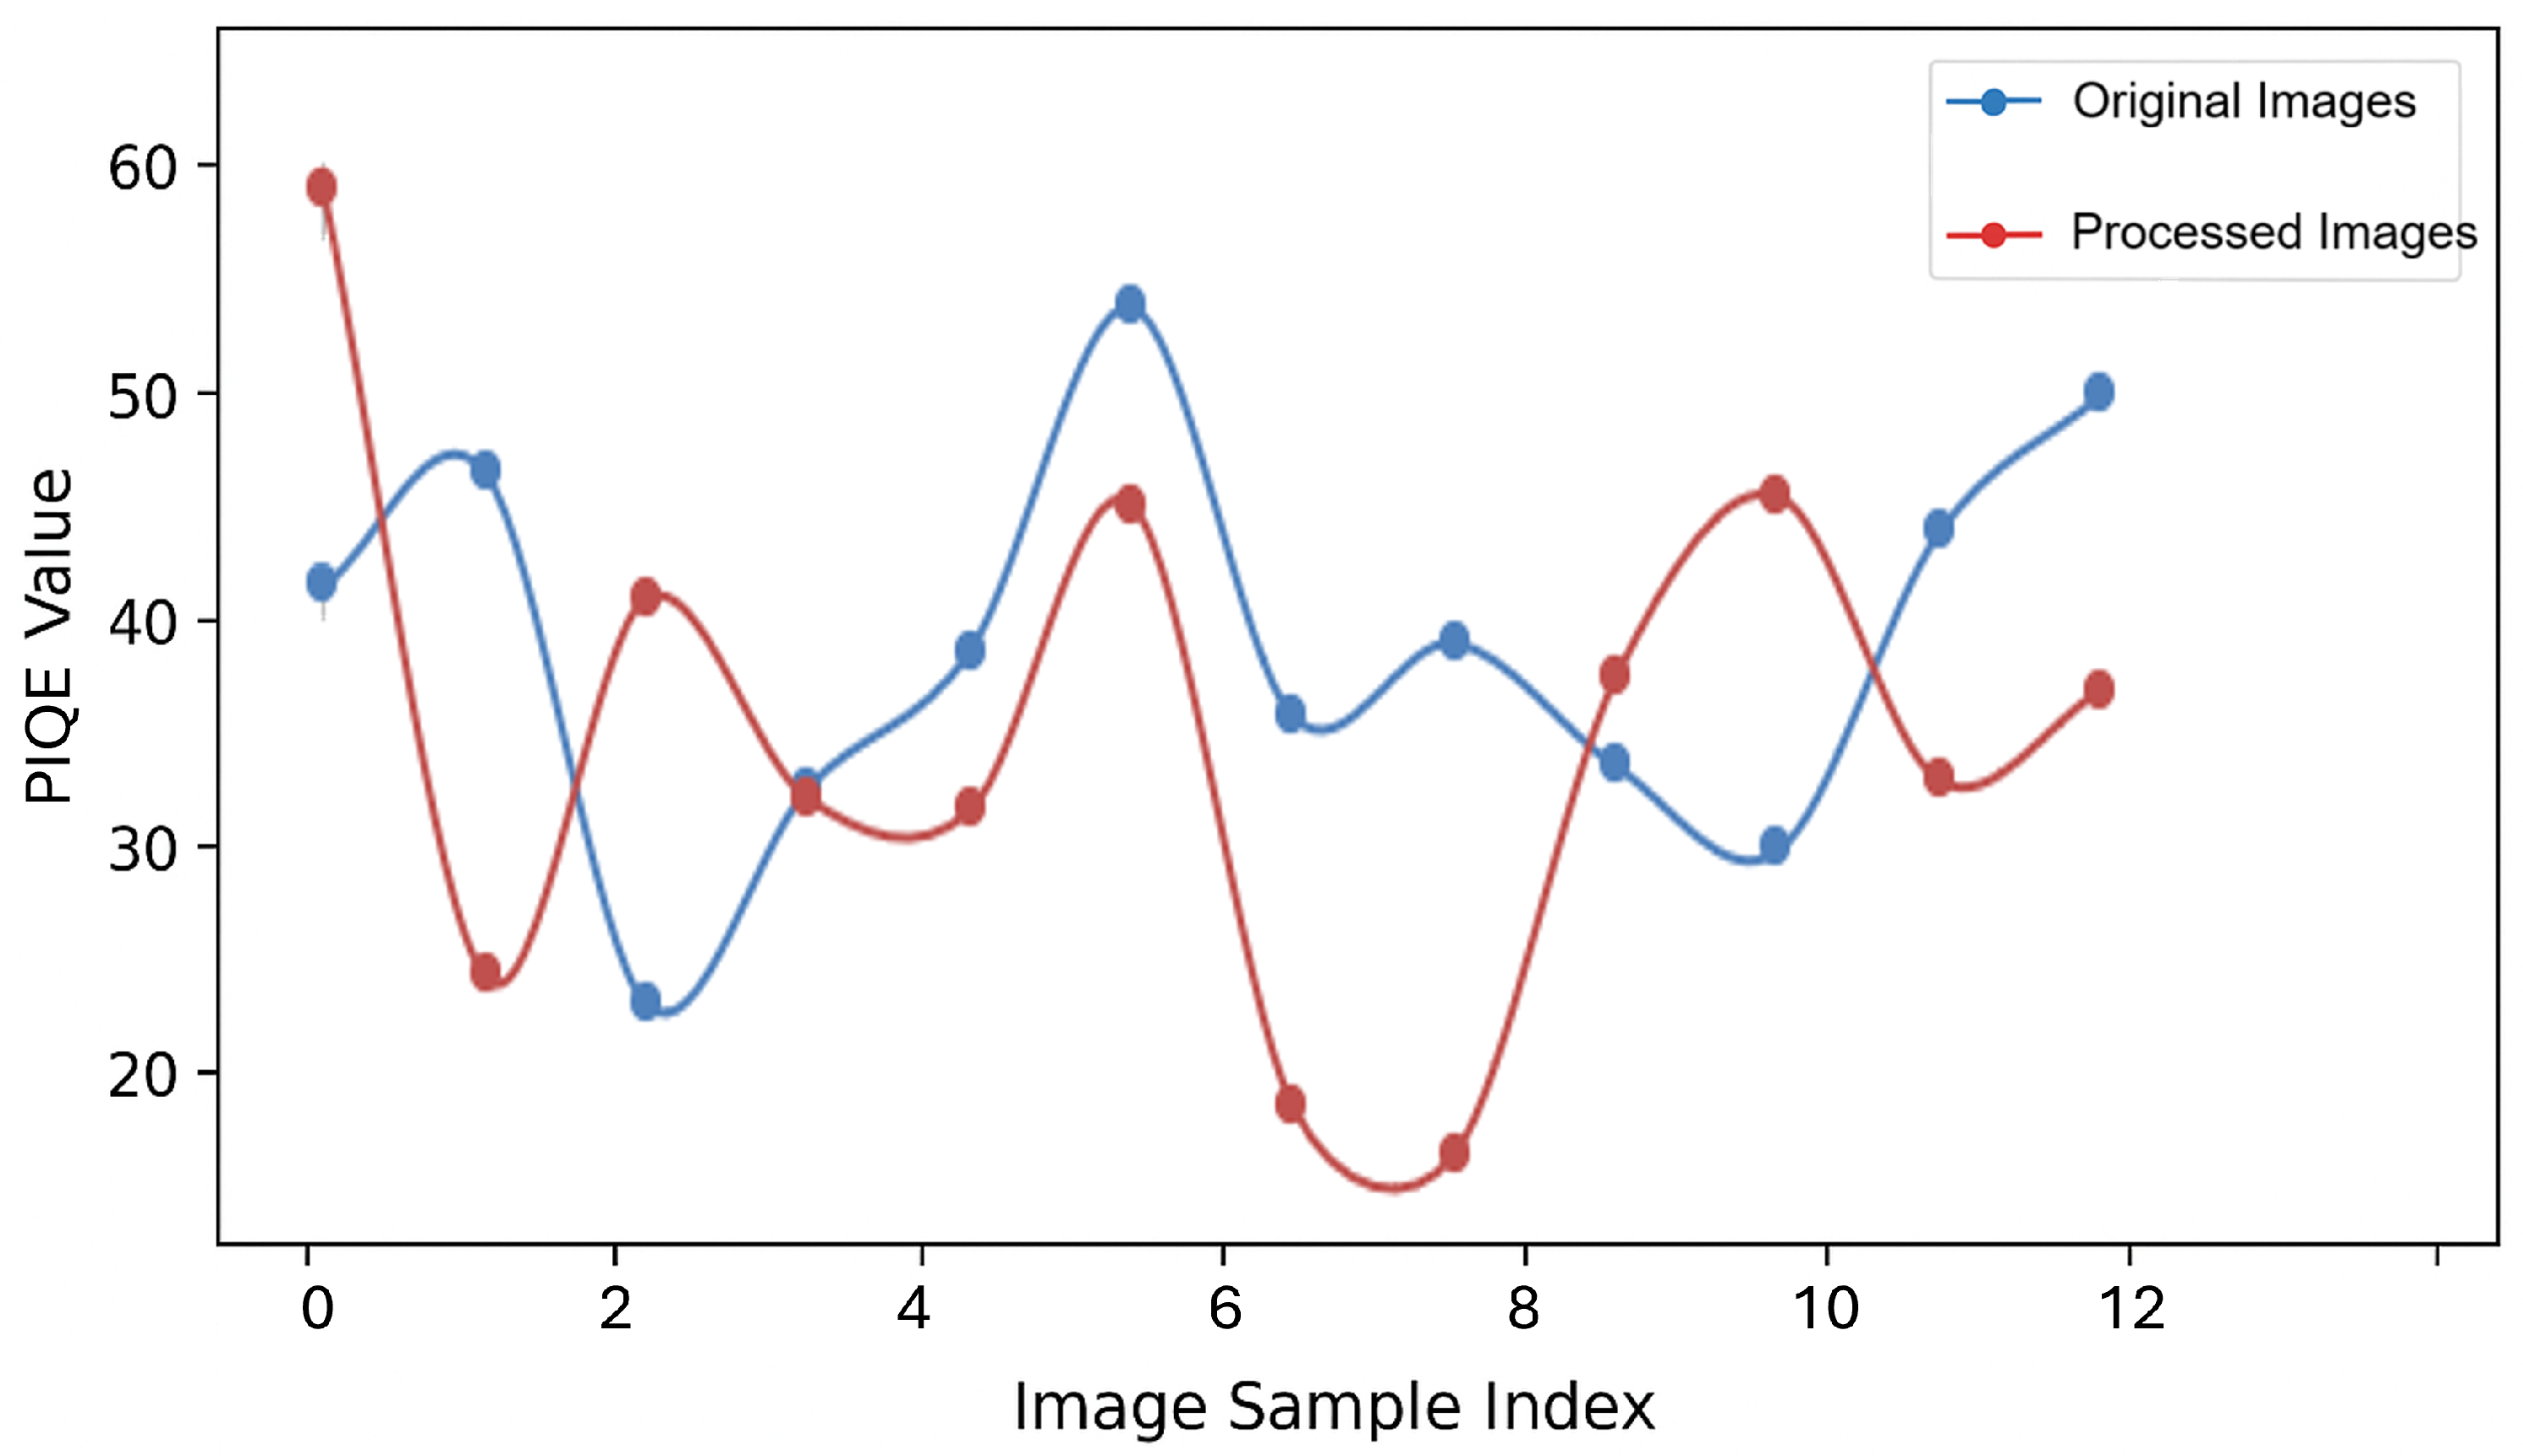
| Mean | 40.75 | – | 16.17 | 4.56 (Reduction) |
| Image | Original | Clustering Components | Gradient Filter |
|---|---|---|---|
| 0-1 | 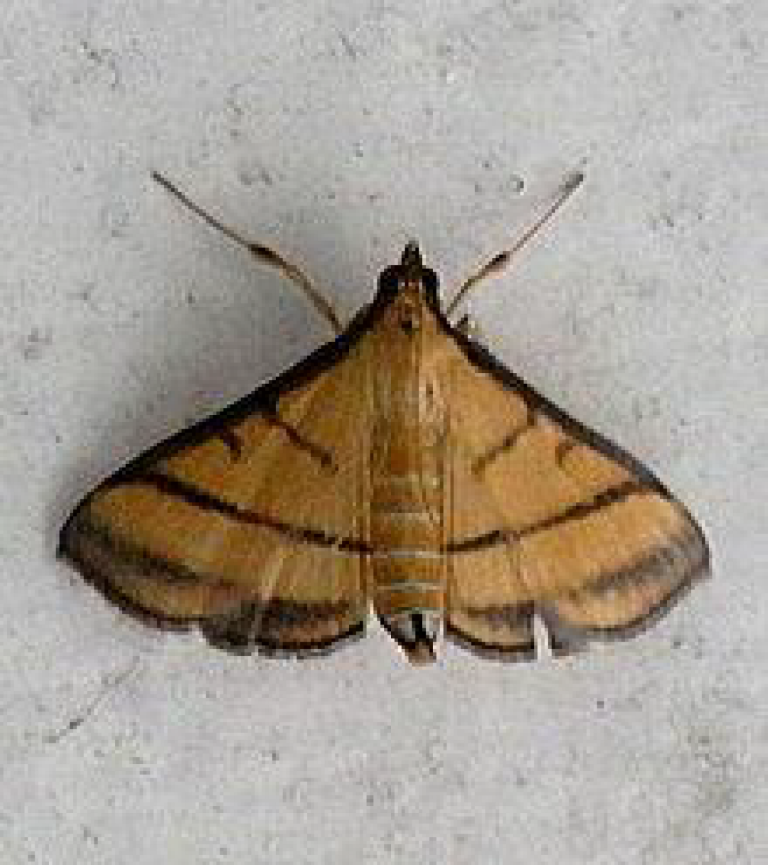 |  |  |
| 0-3 |  |  |  |
| 0-4 |  |  |  |
| 0-5 |  |  |  |
| 0-7 |  | 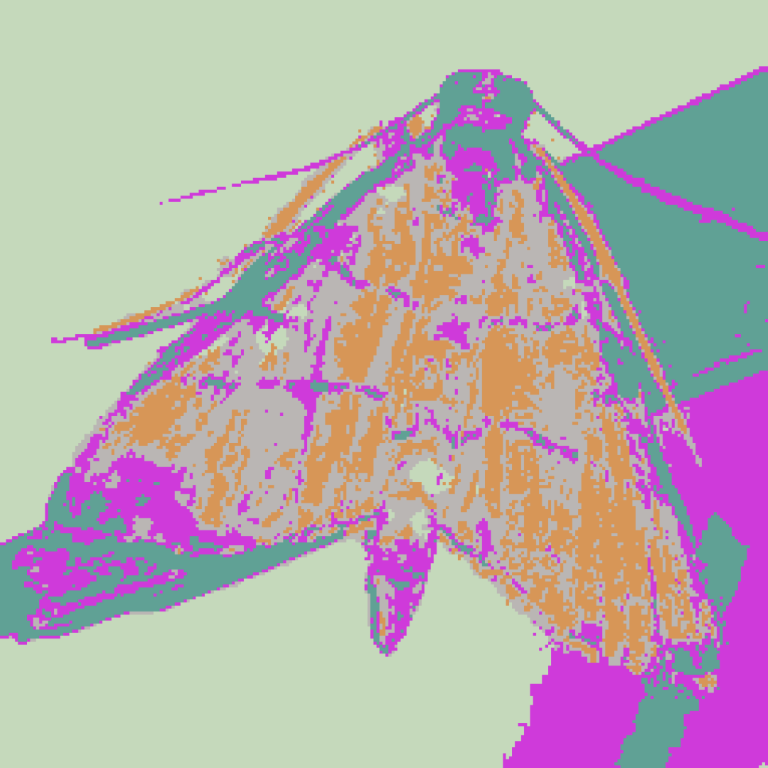 | 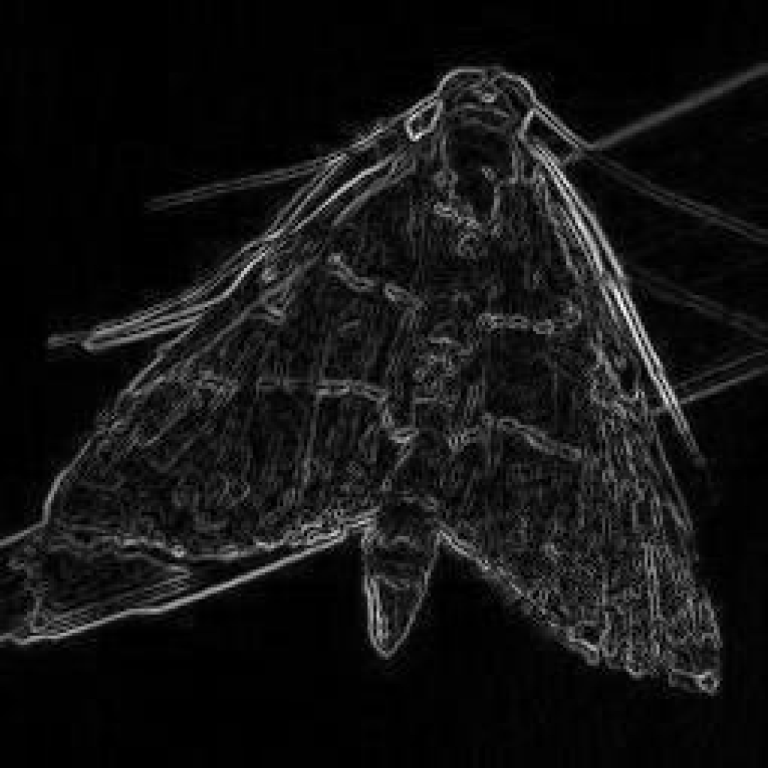 |
| 0-10 | 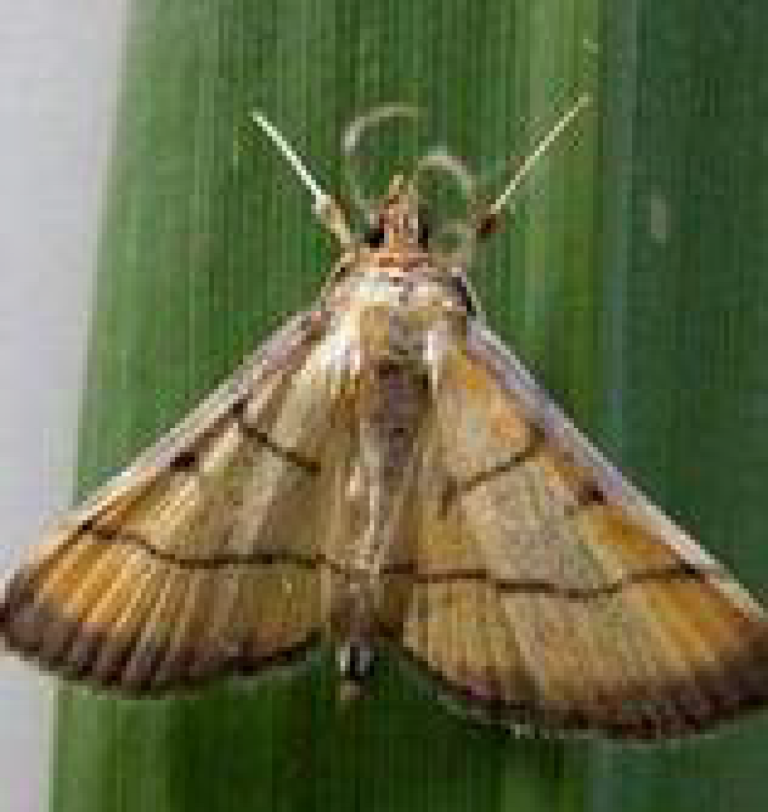 |  | 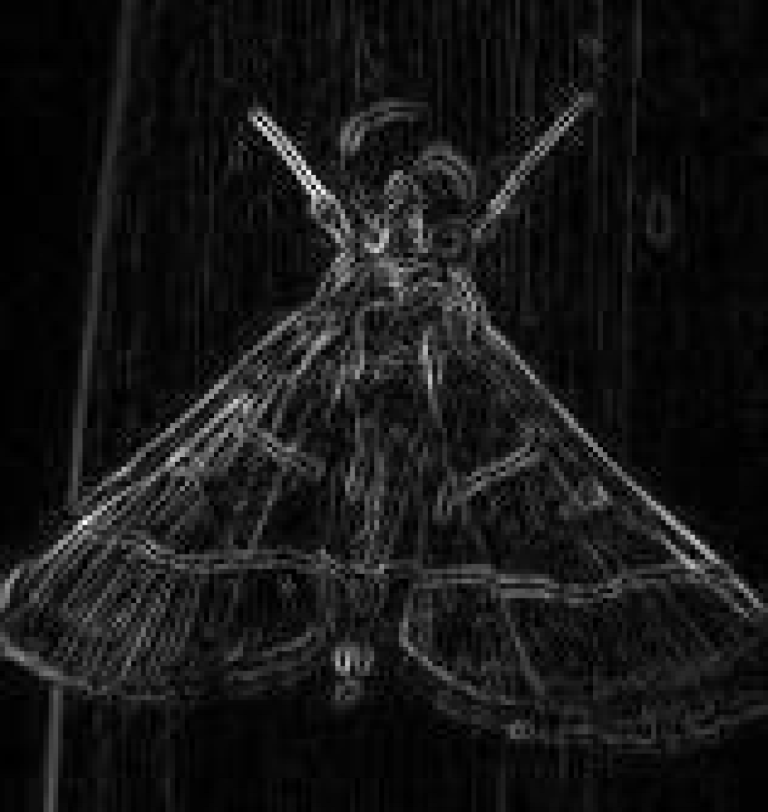 |
| 0-11 | 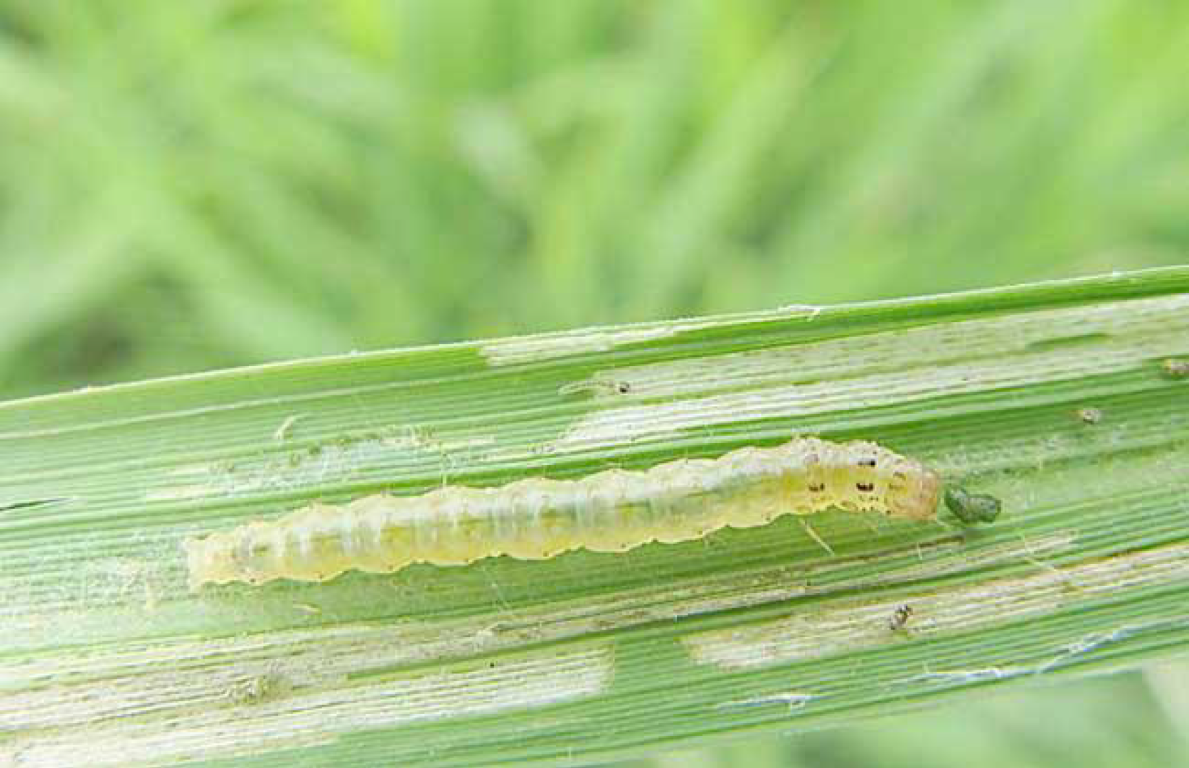 |  |  |
| 0-12 | 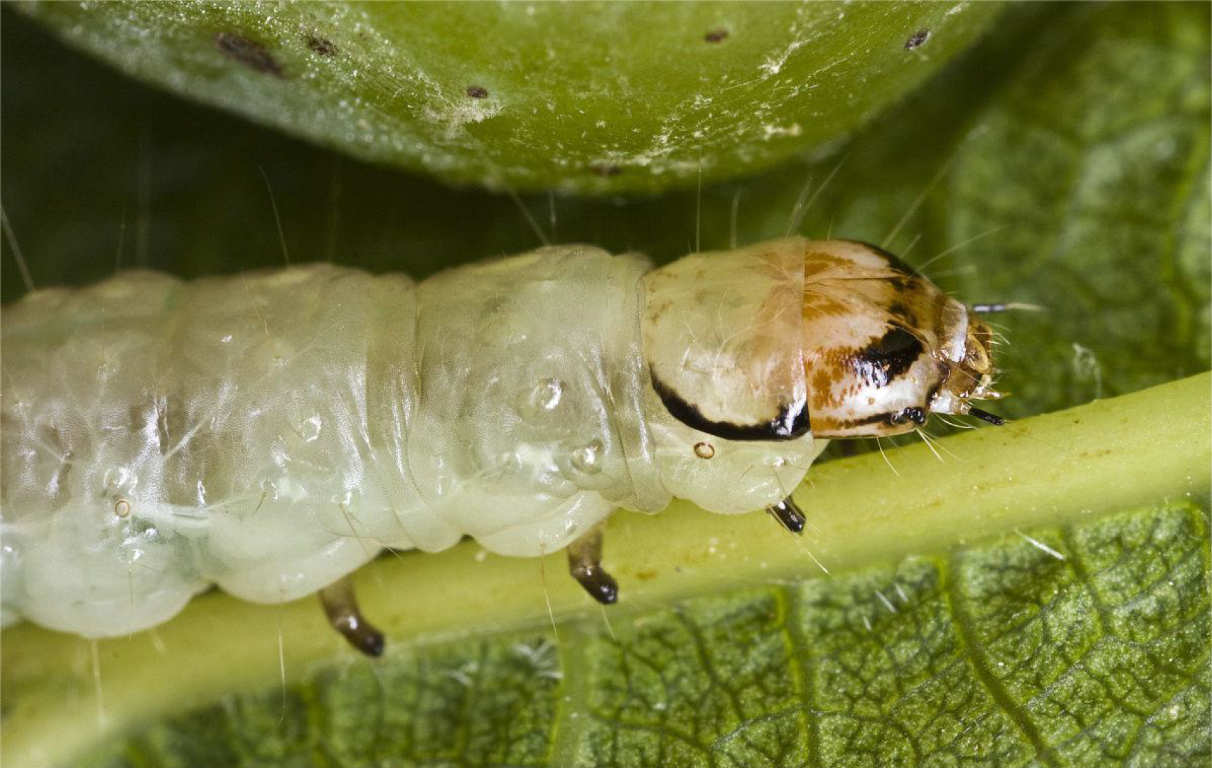 |  |  |
| 0-13 | 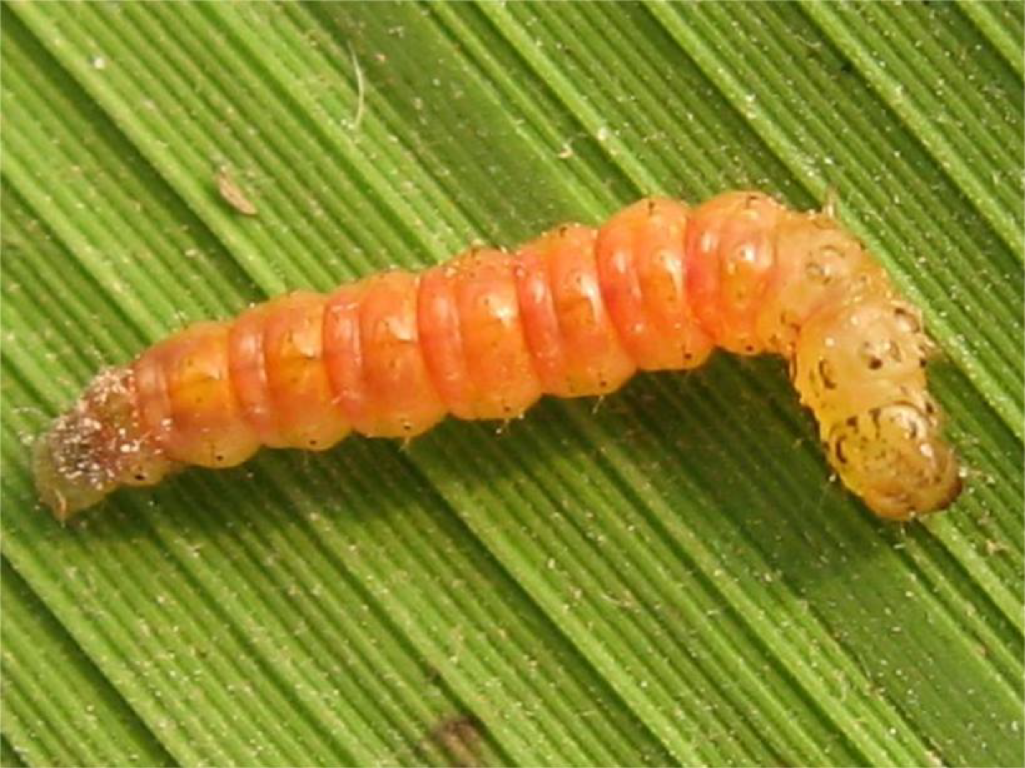 |  | 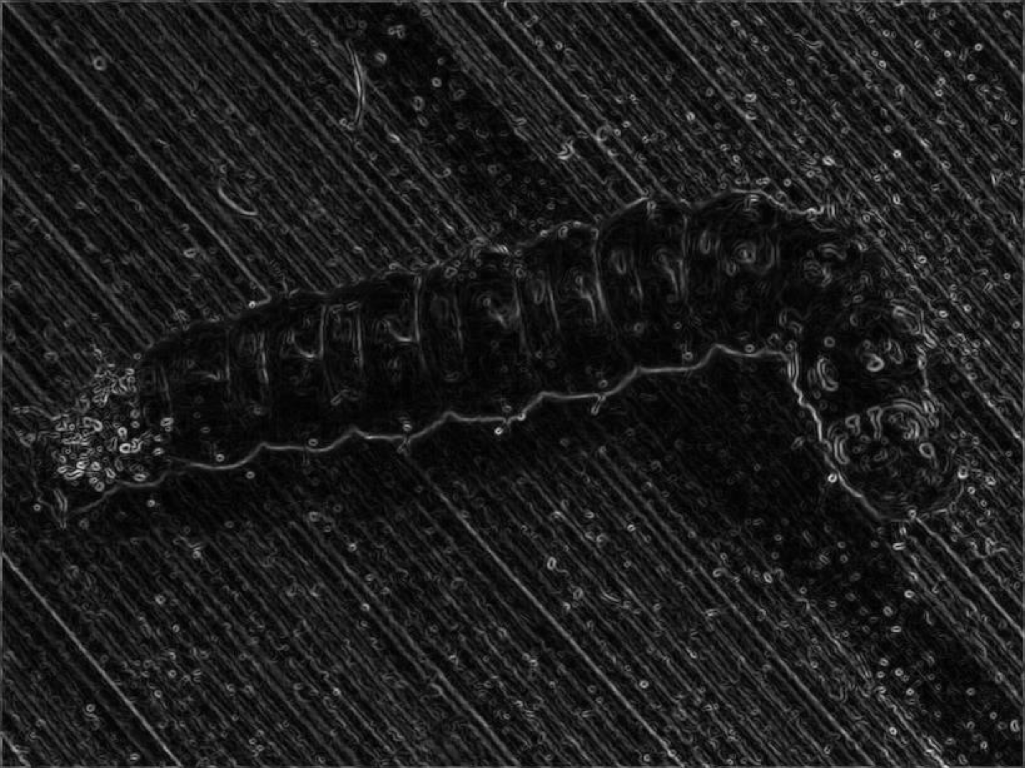 |
| 0-14 | 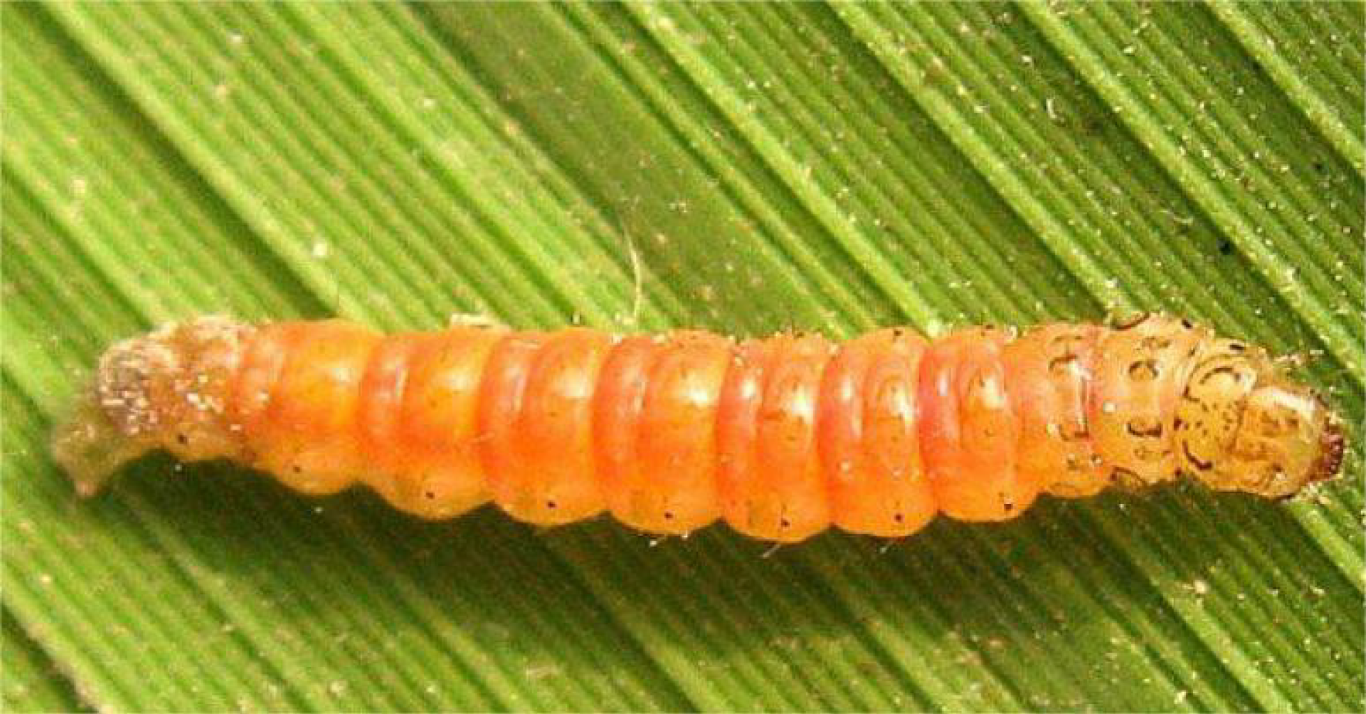 | 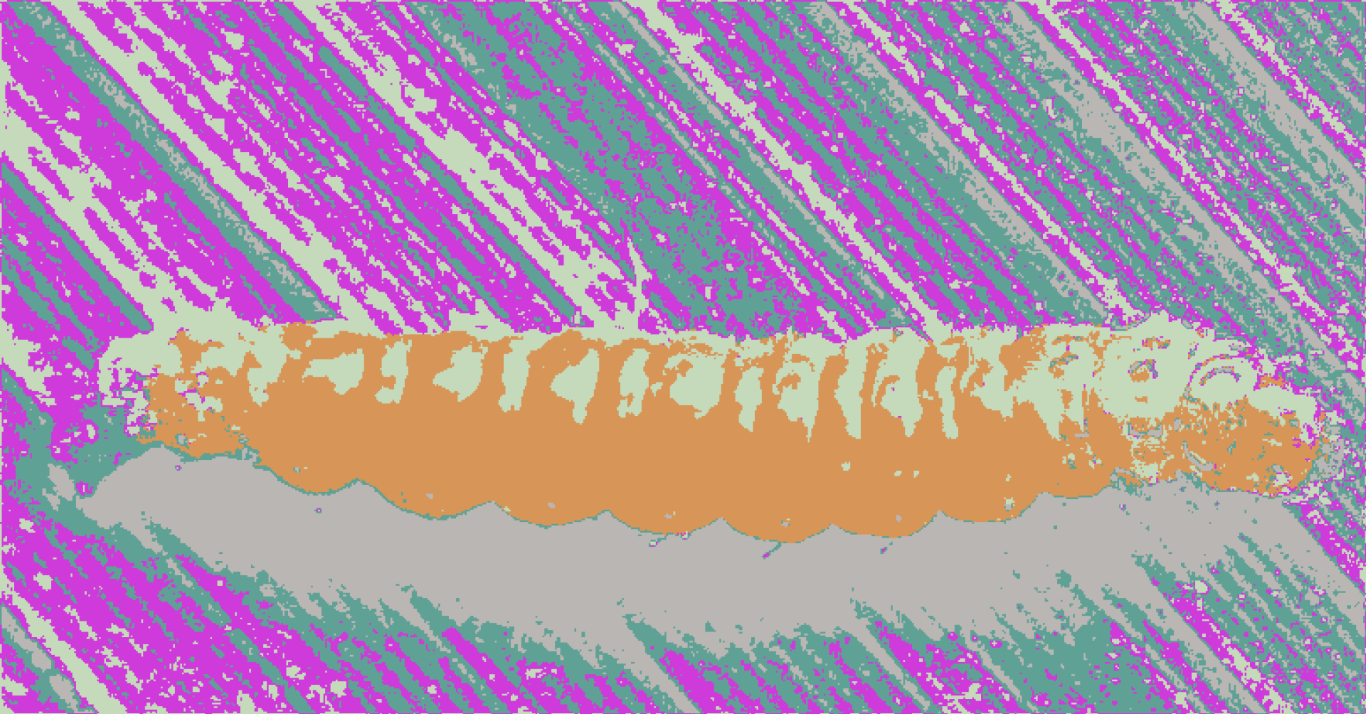 | 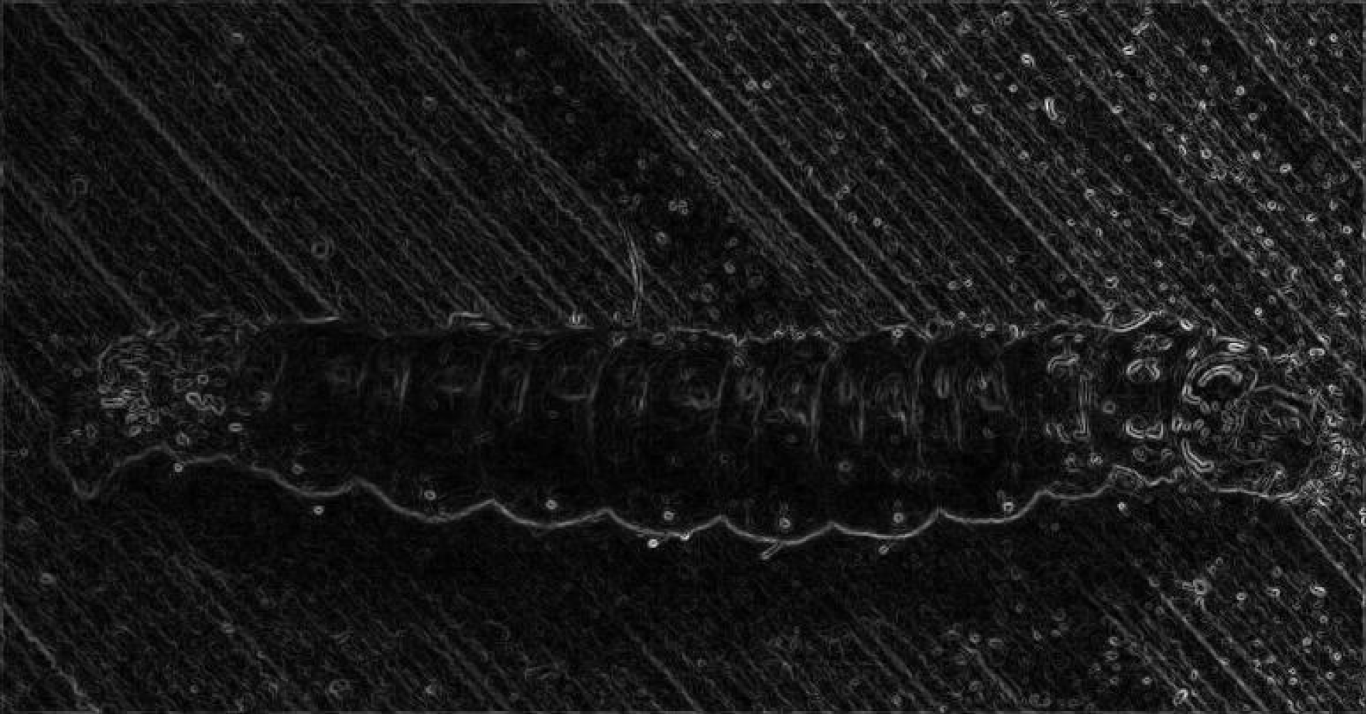 |
| 0-15 | 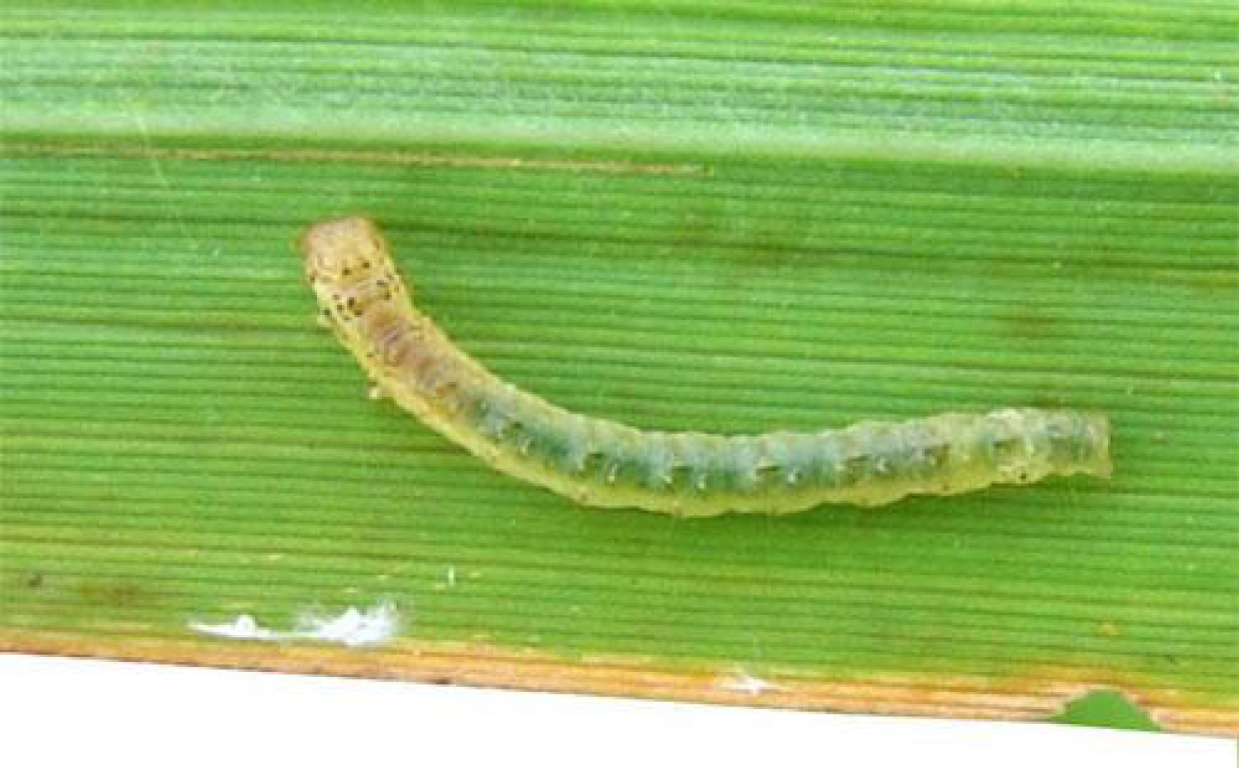 |  | 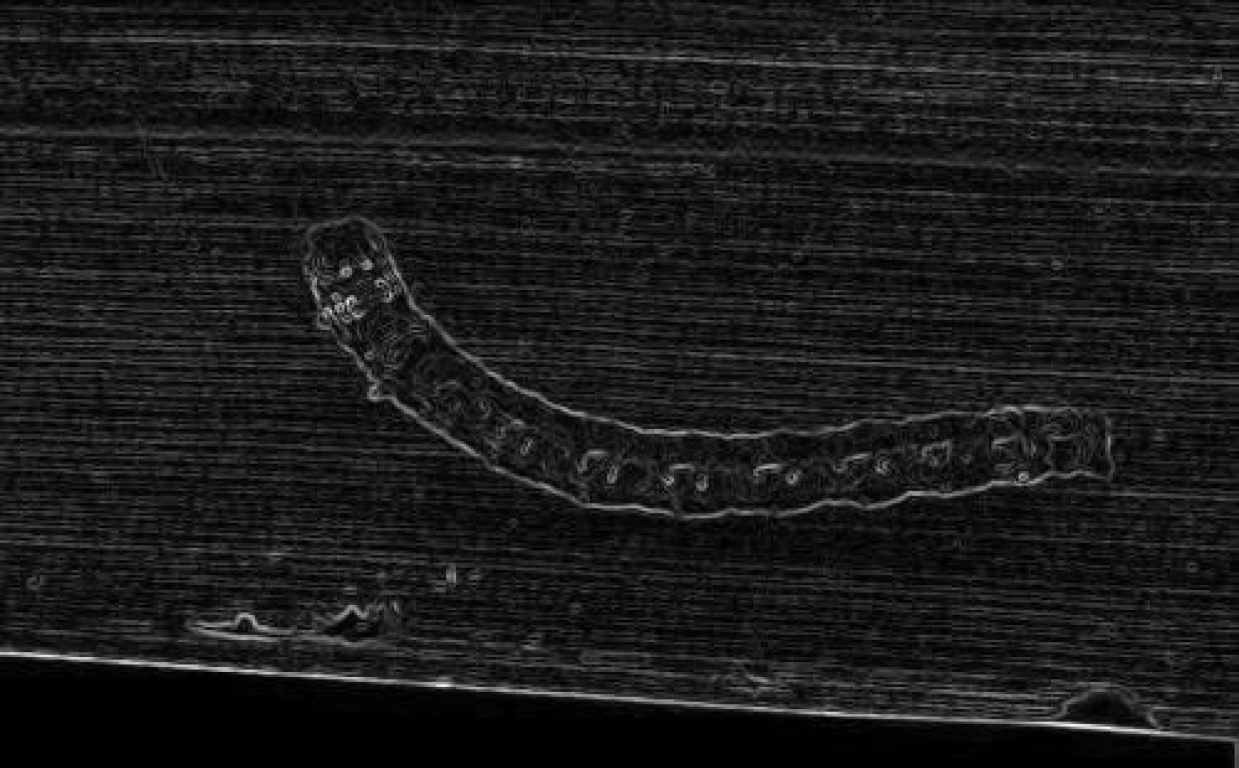 |
| 0-16 |  |  | 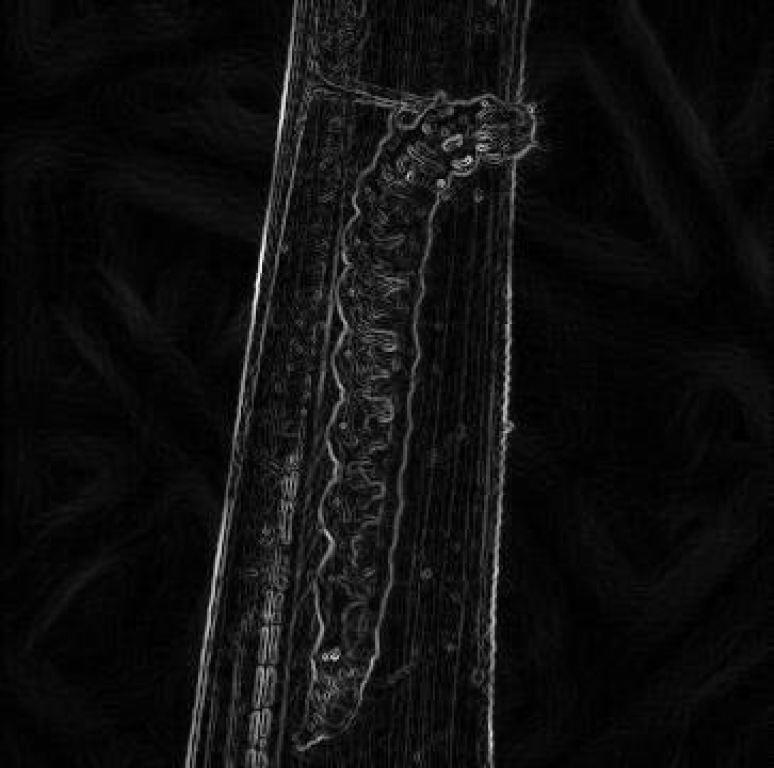 |
| 0-17 |  | 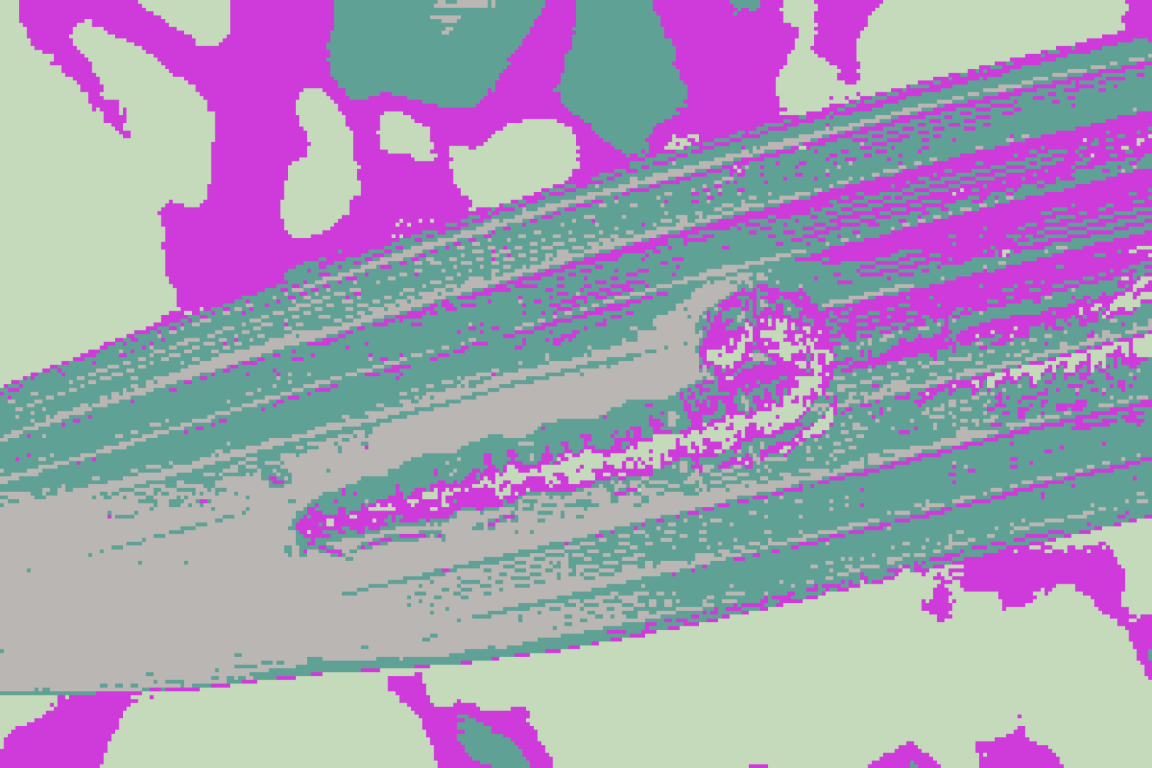 | 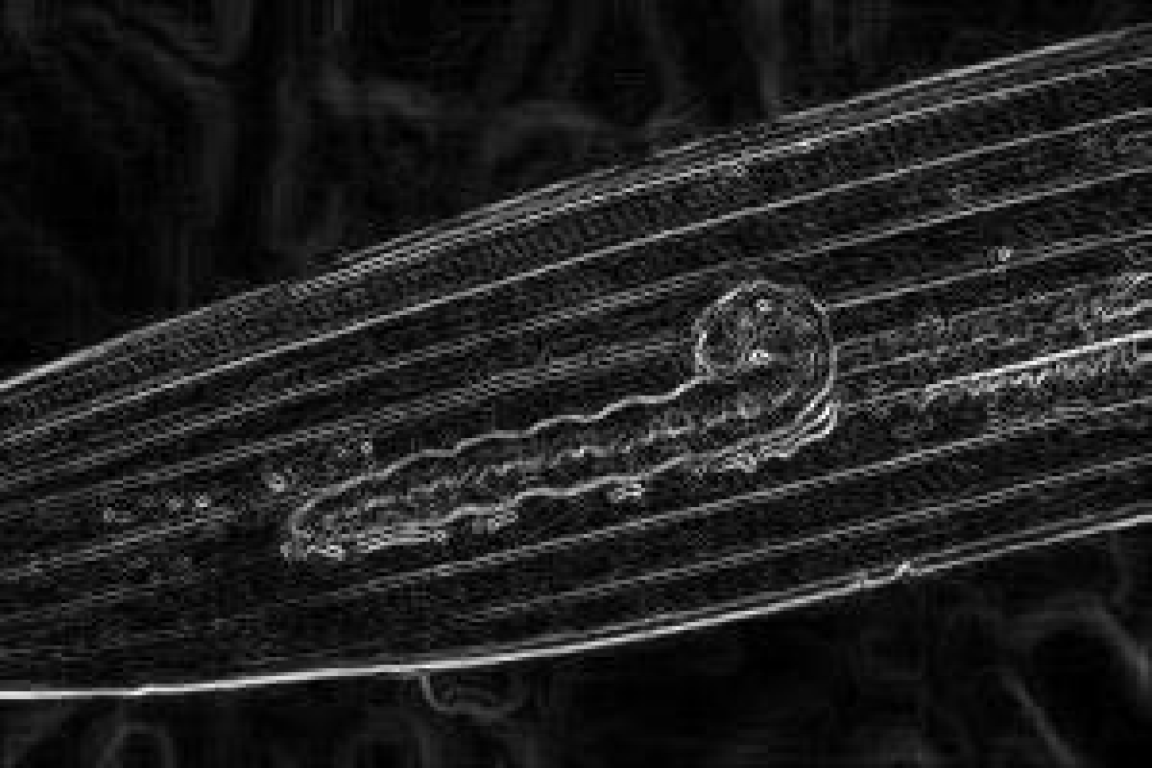 |
| 0-19 | 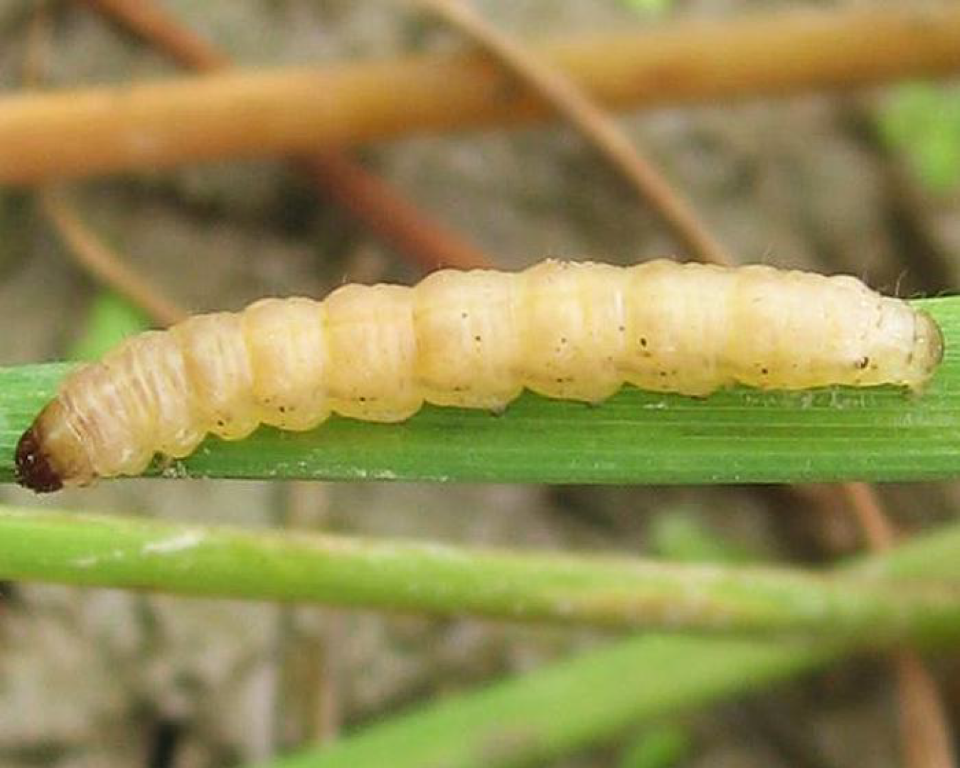 | 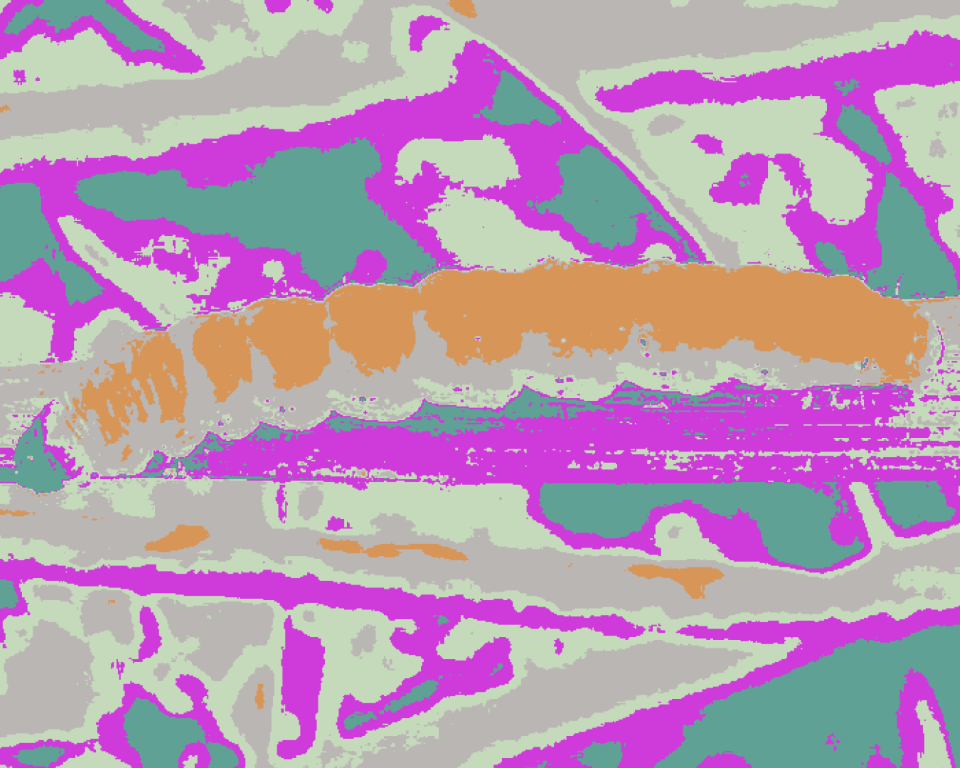 | 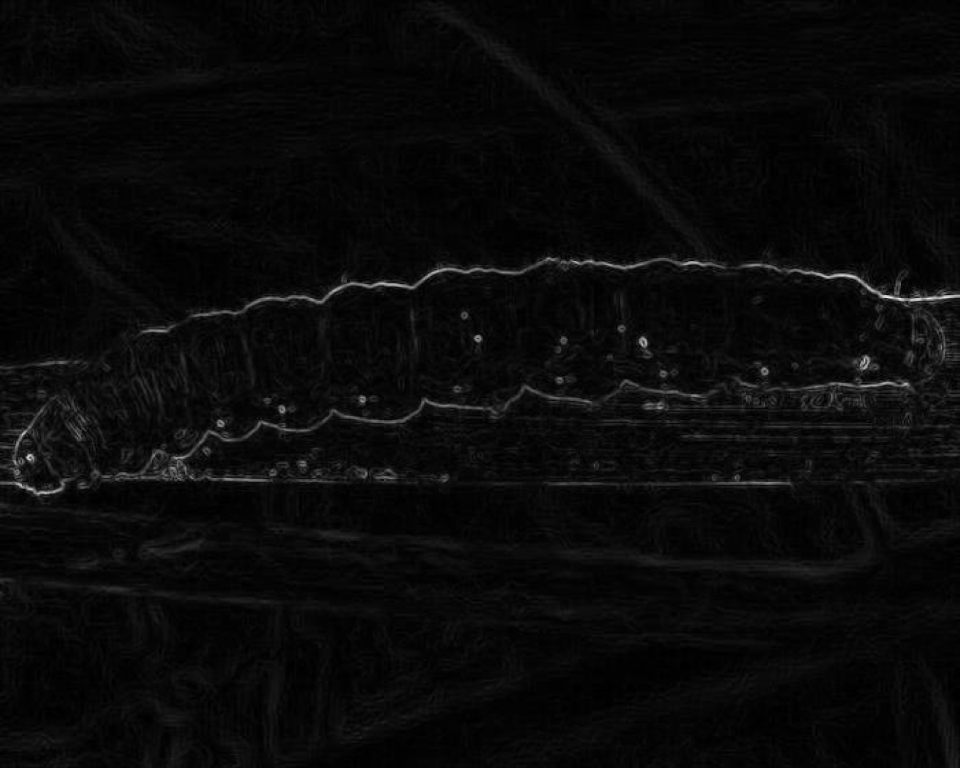 |
| 1-1 | 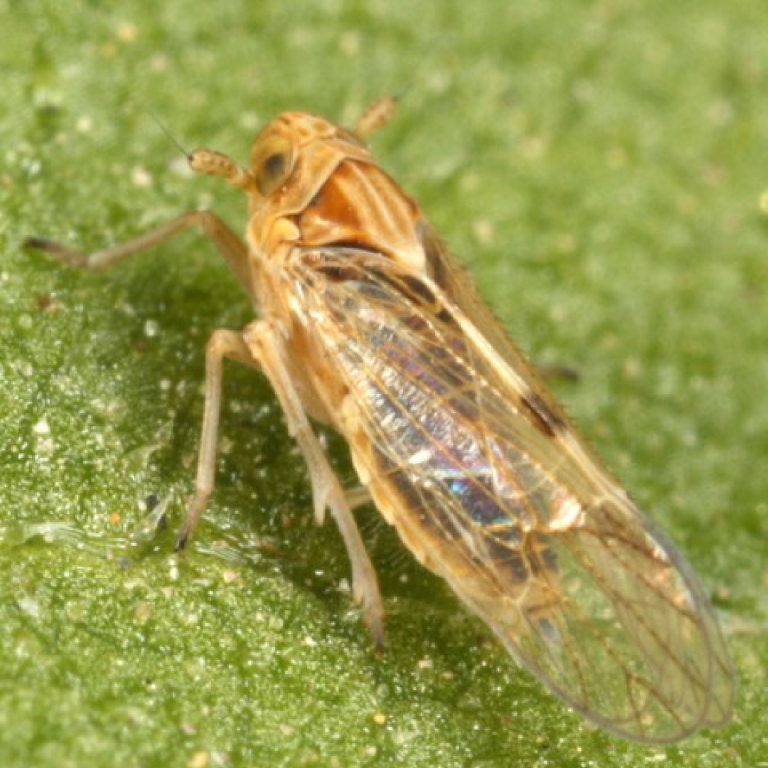 |  | 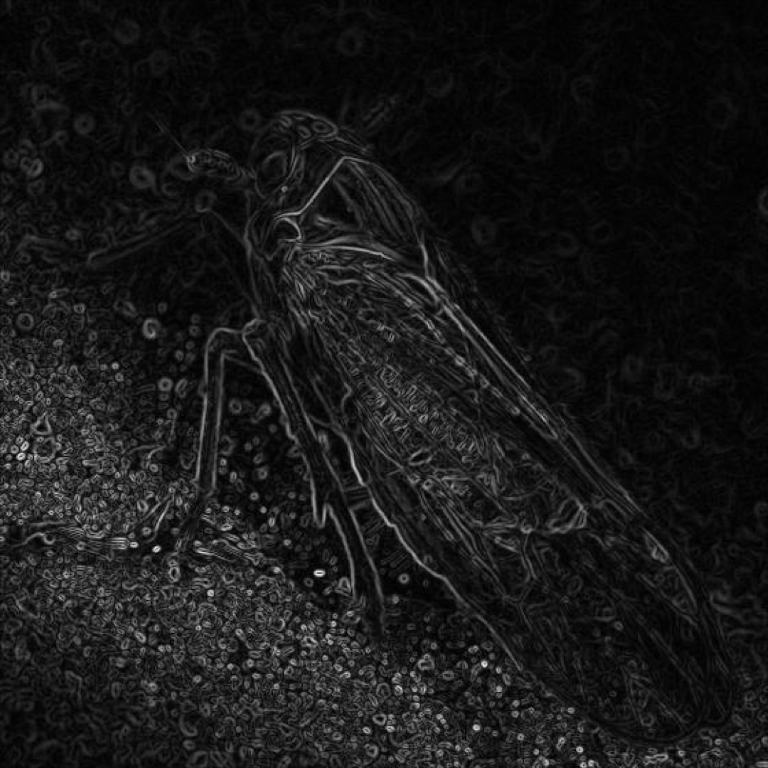 |
| 1-4 | 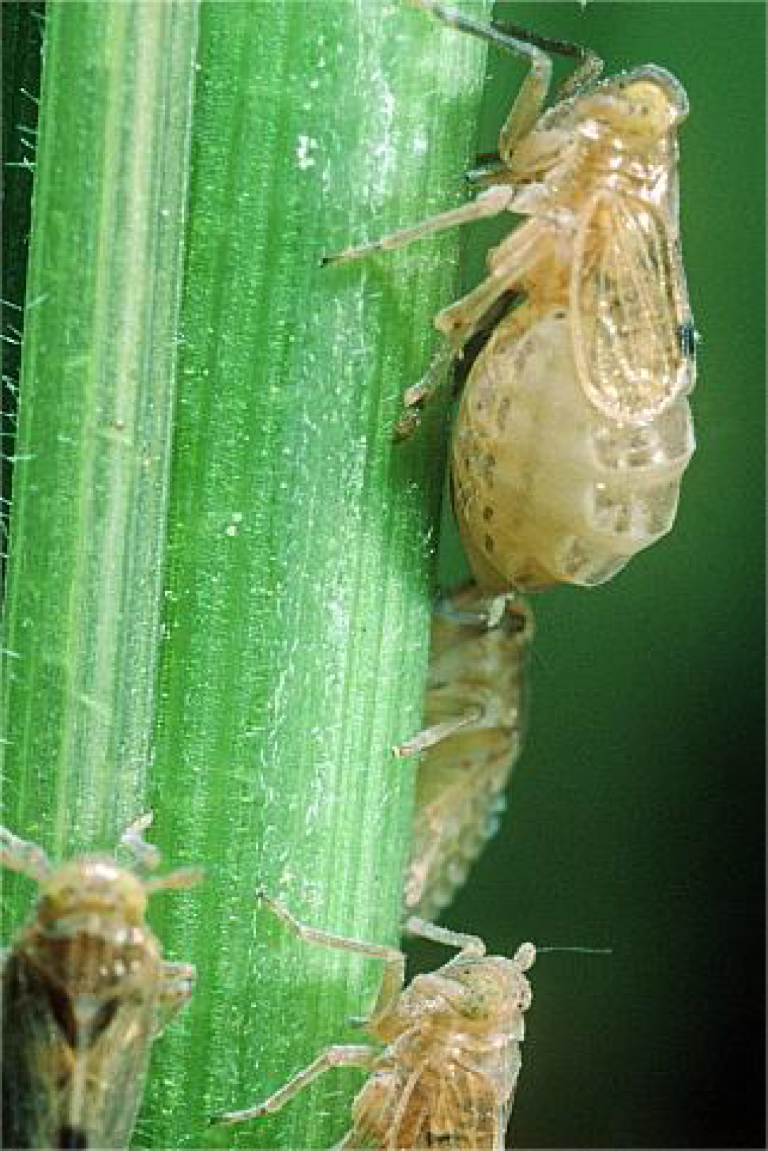 | 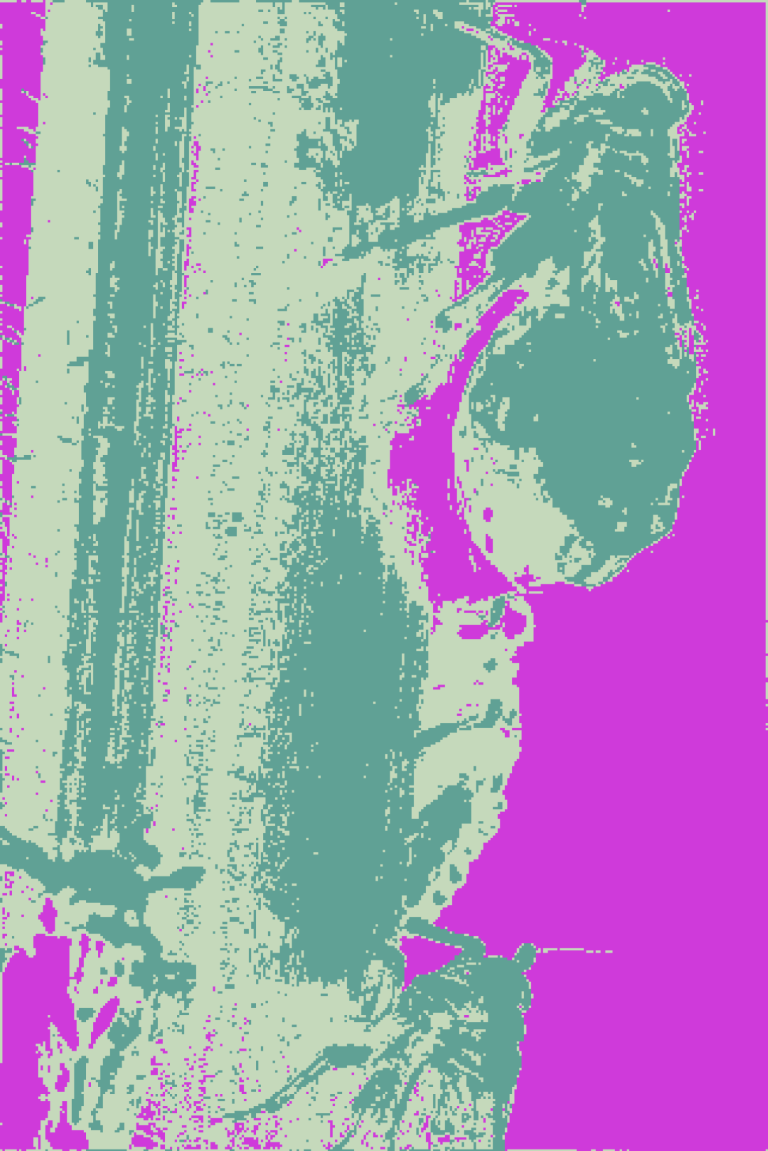 |  |
| 1-9 |  | 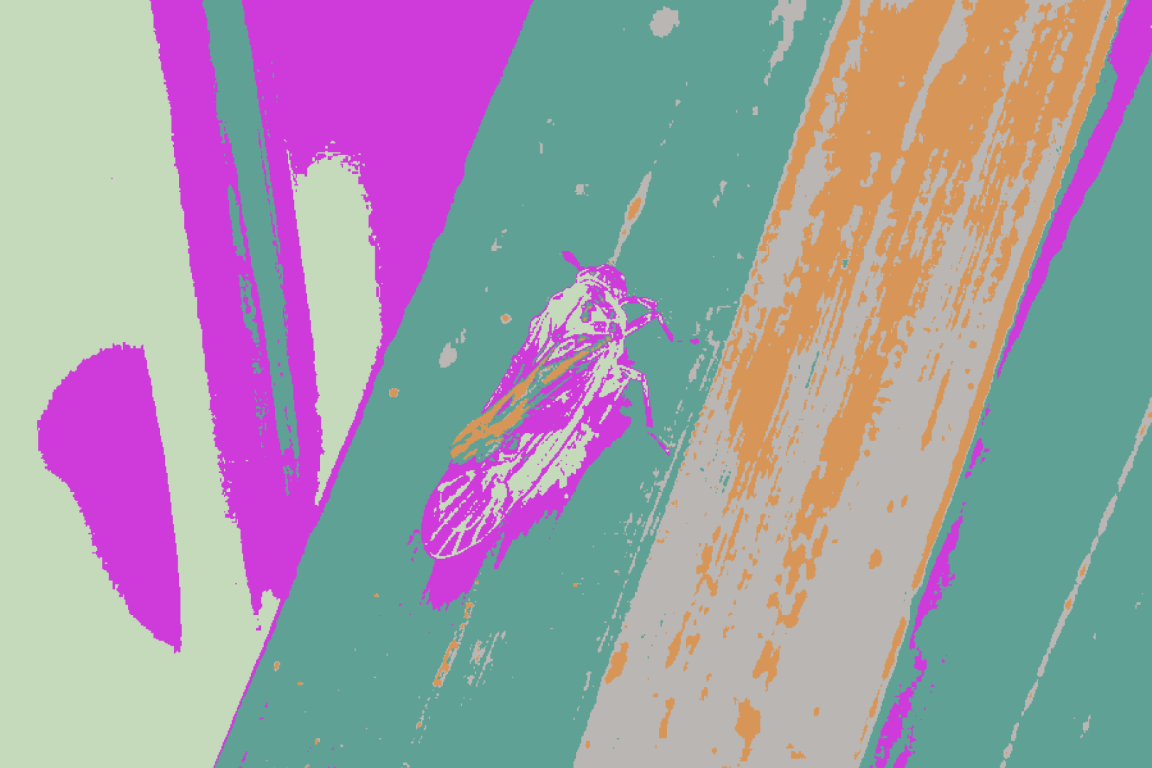 | 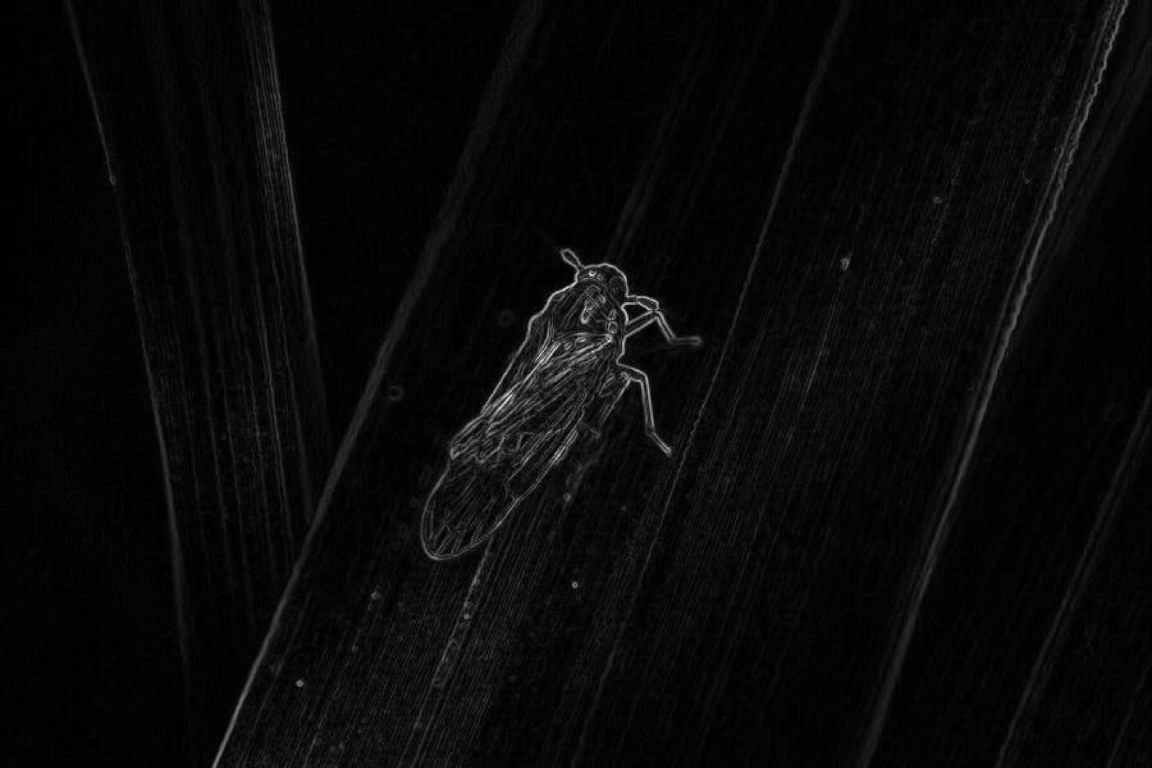 |
| 3-1 | 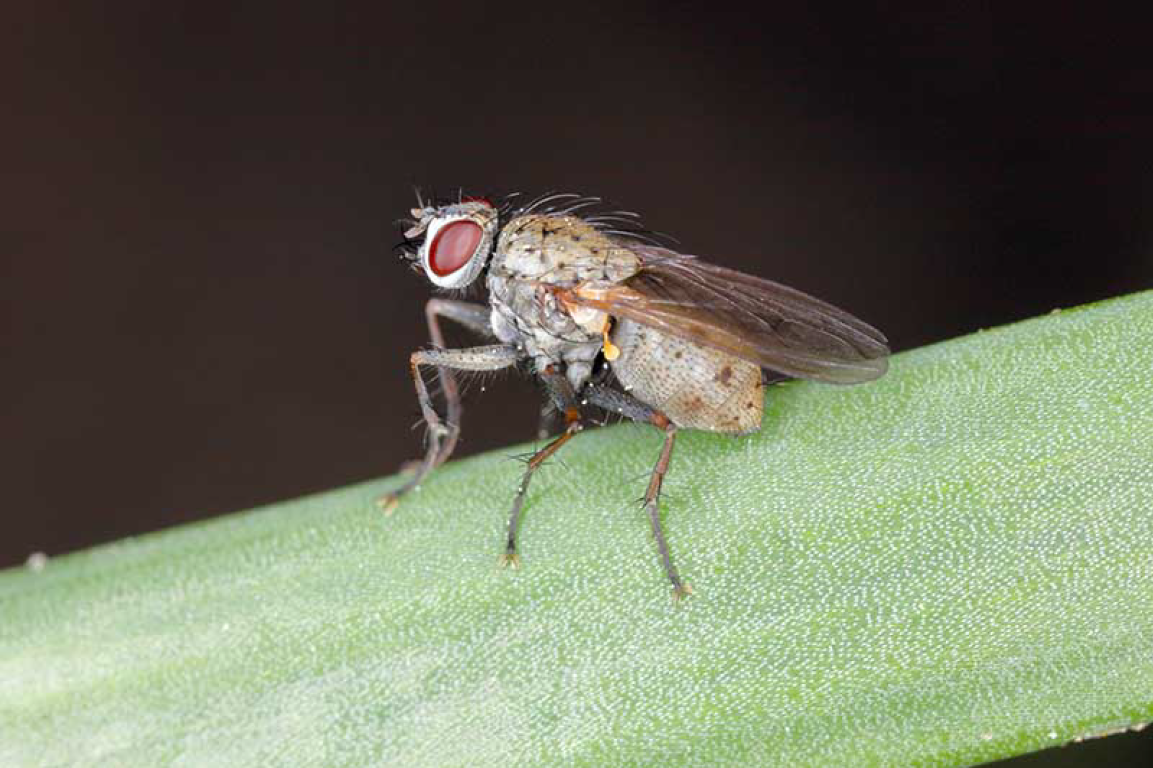 |  | 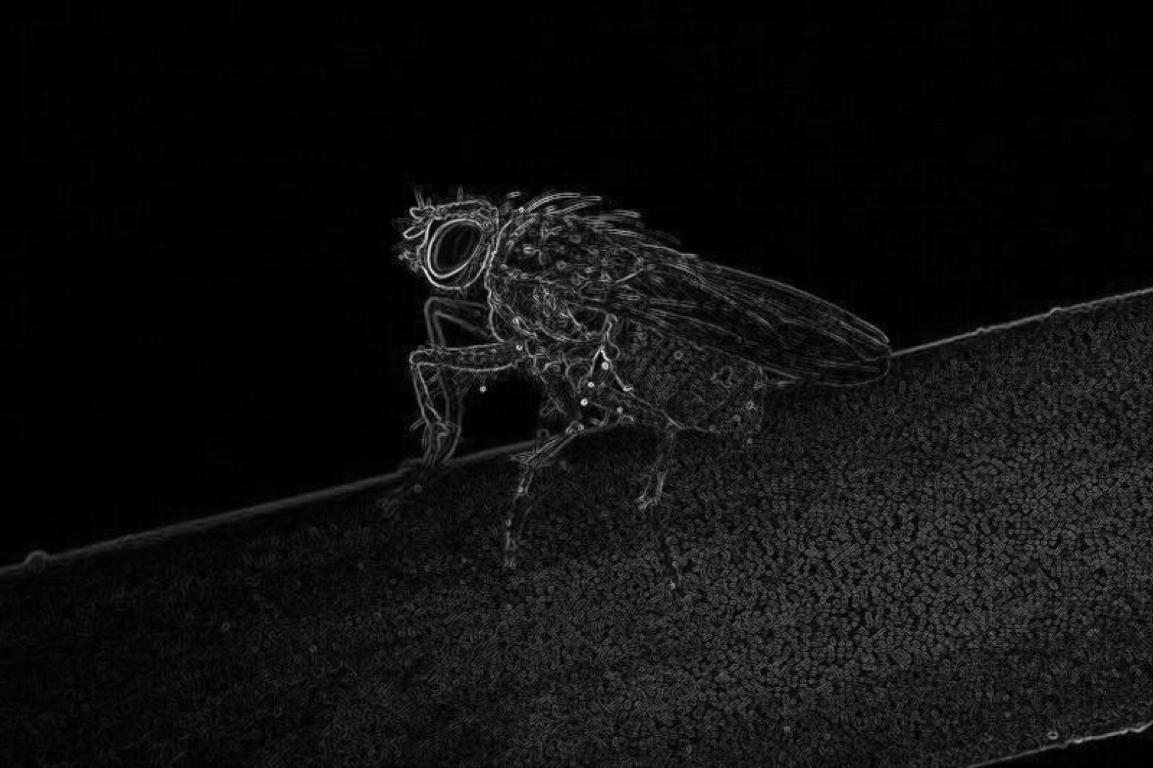 |
| 4-11 | 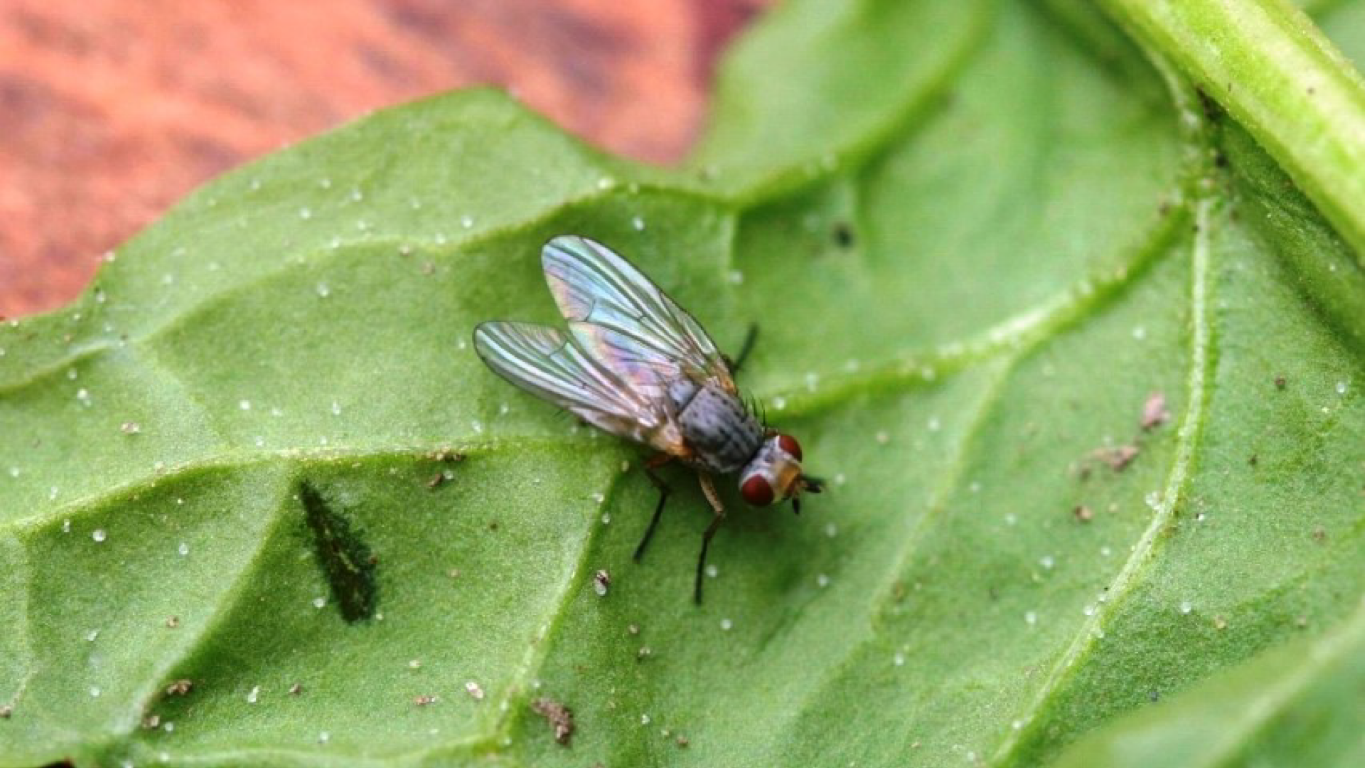 | 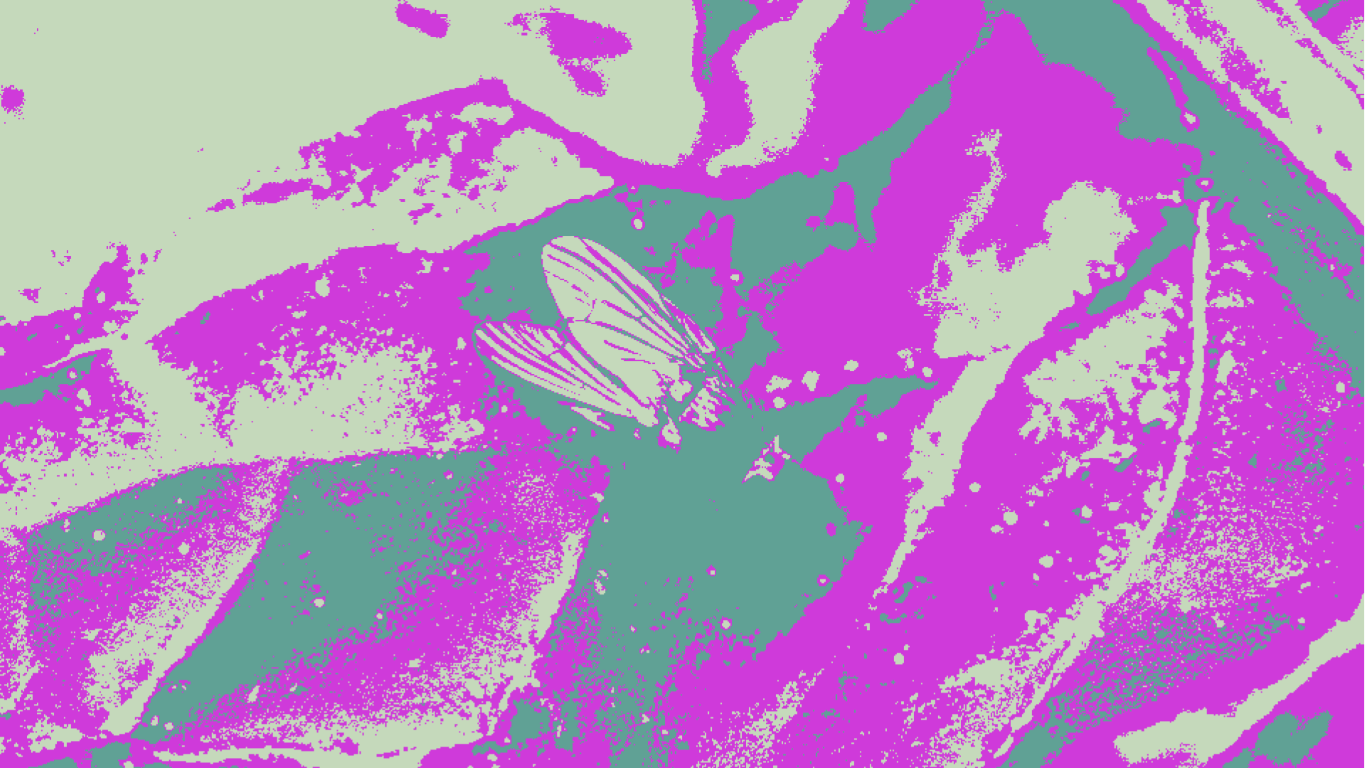 | 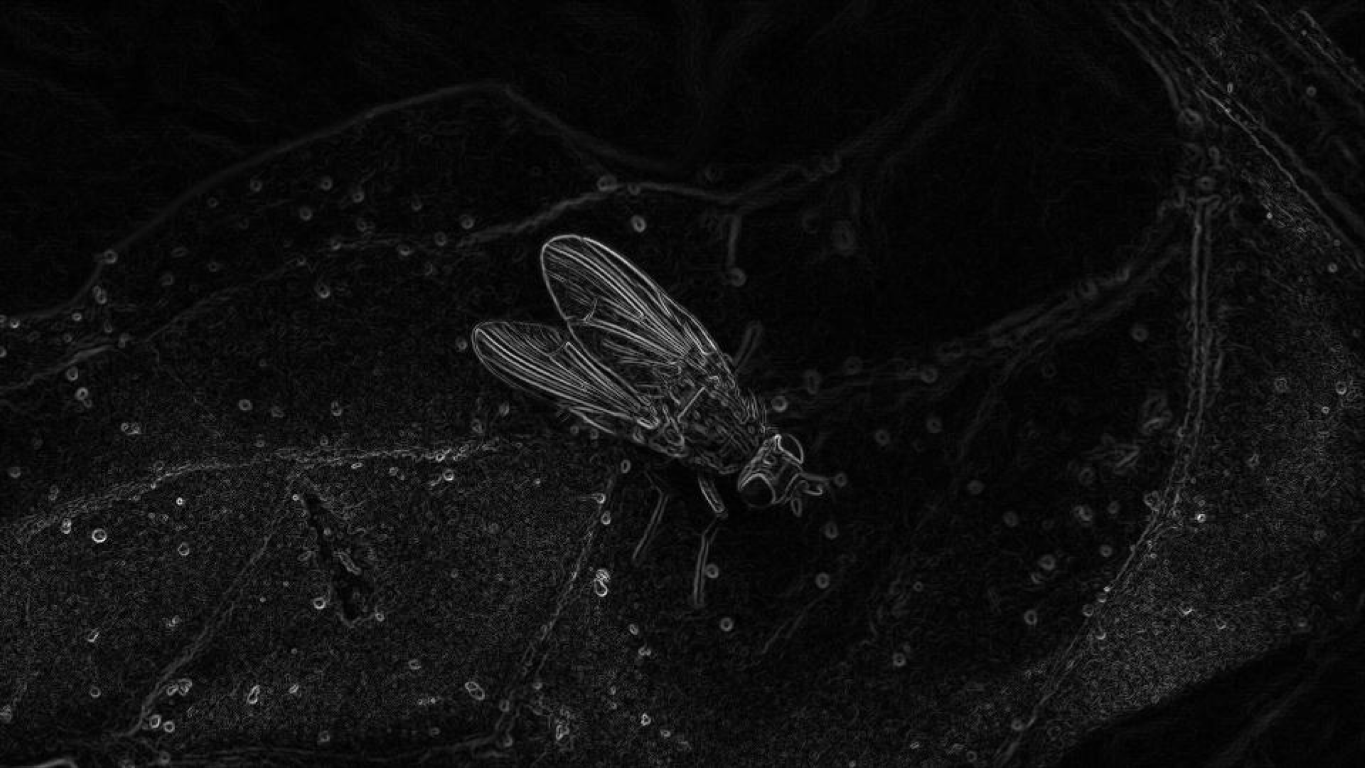 |
| 4-12 | 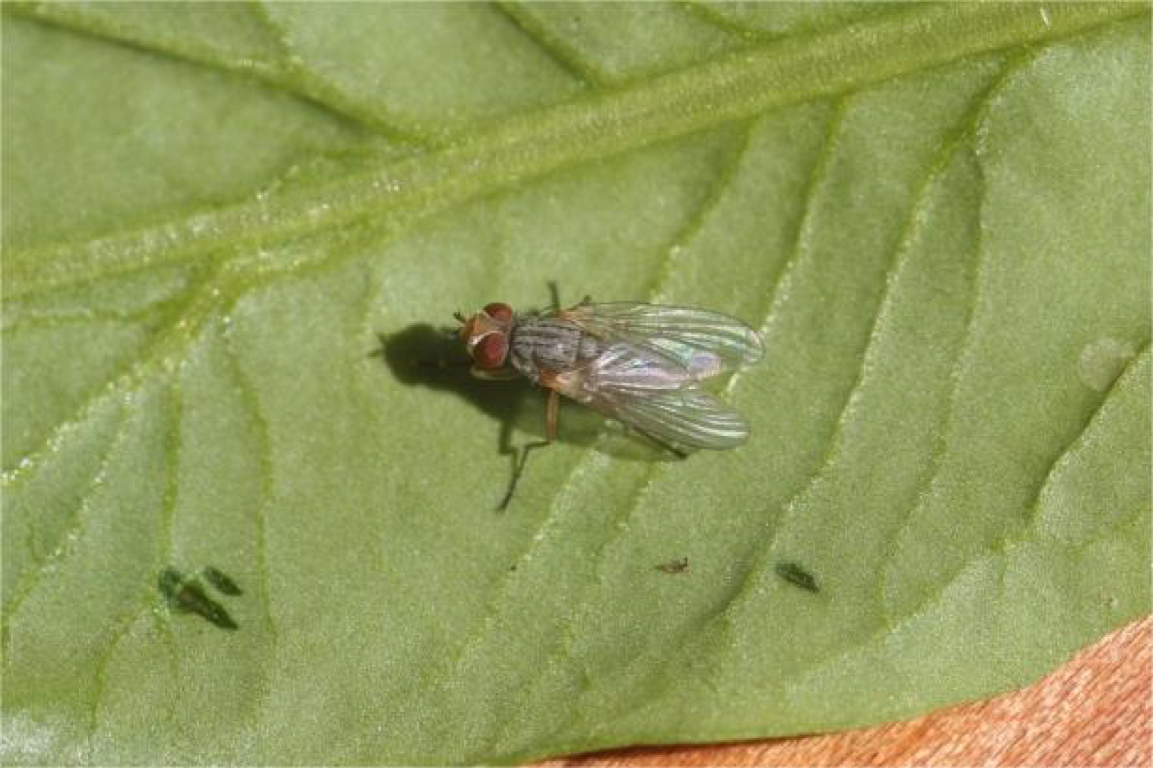 | 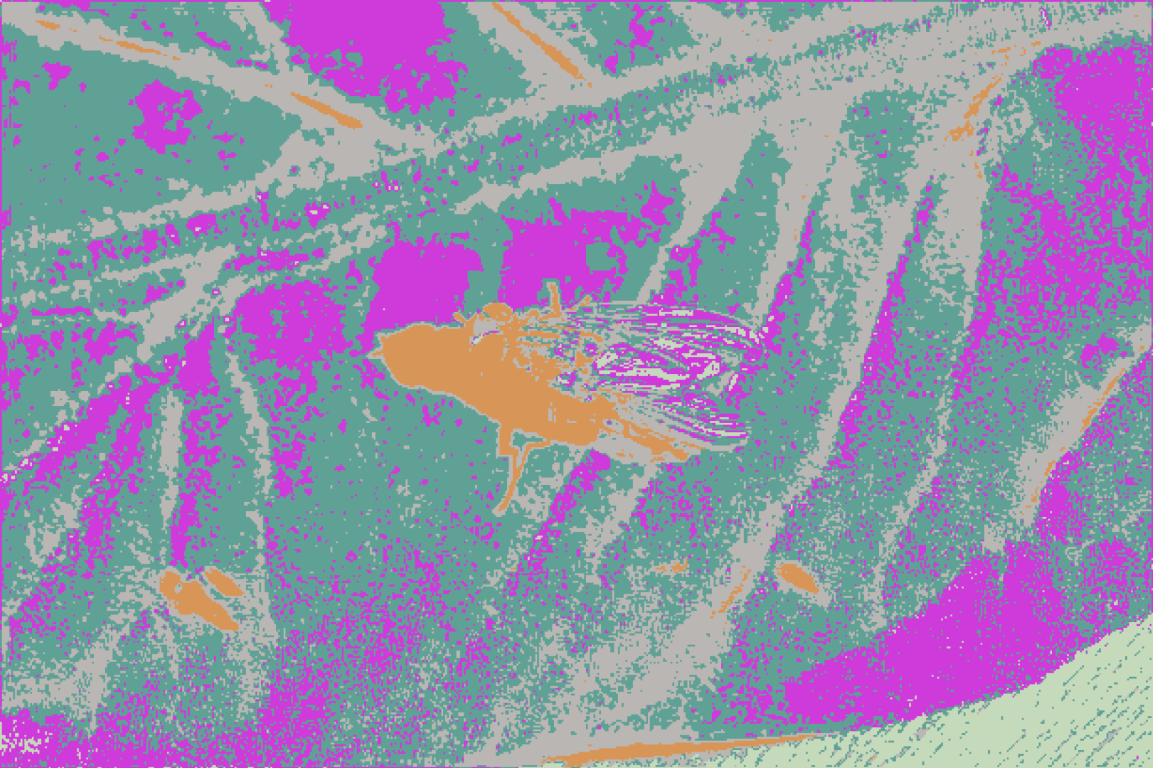 |  |
| 4-13 |  | 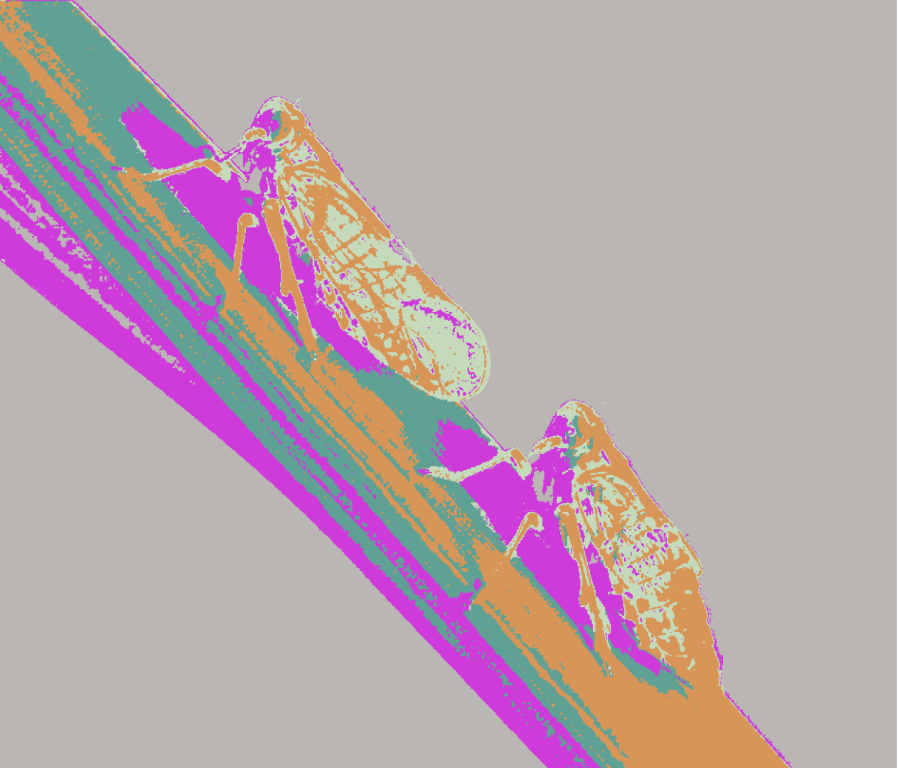 | 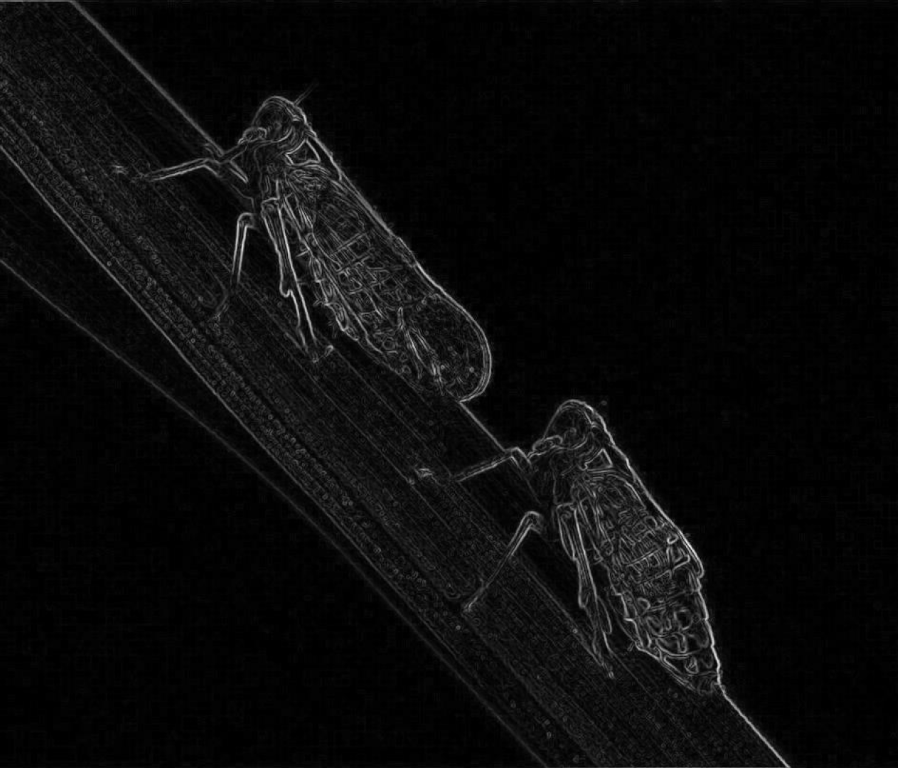 |
| leaf 01 |  | 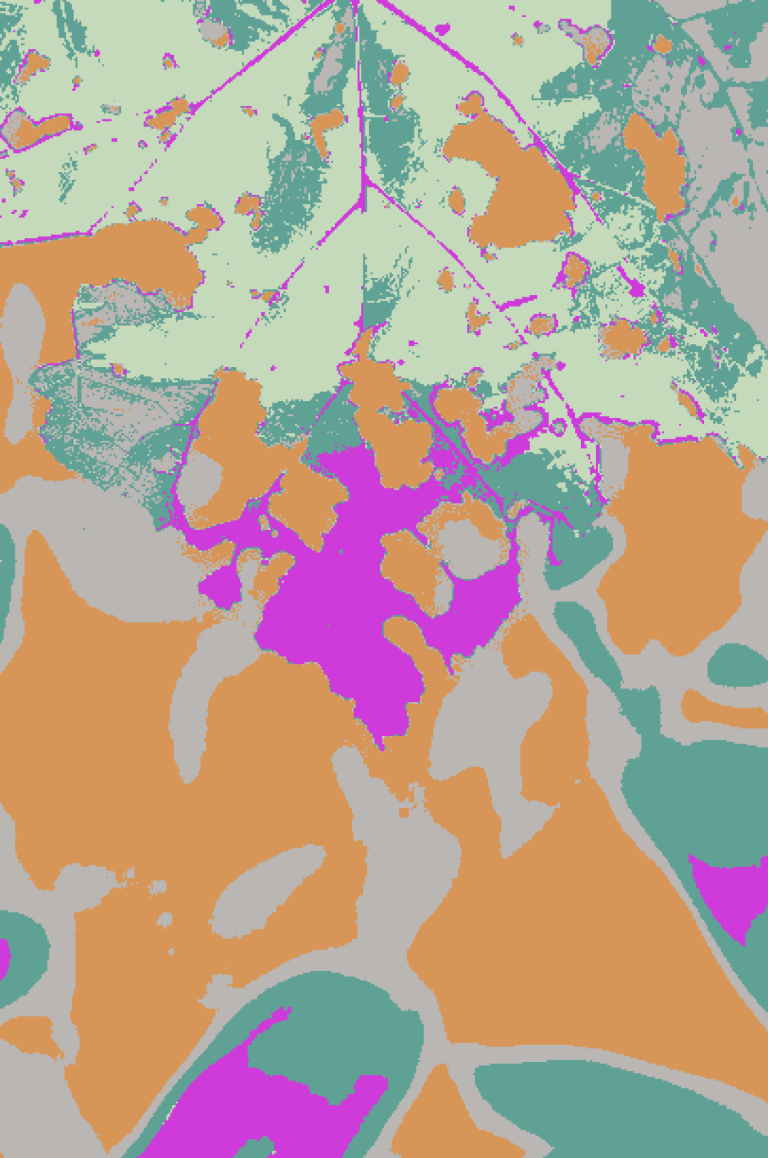 |  |
| leaf 02 |  |  |  |
| leaf 03 |  |  |  |
| leaf 04 | 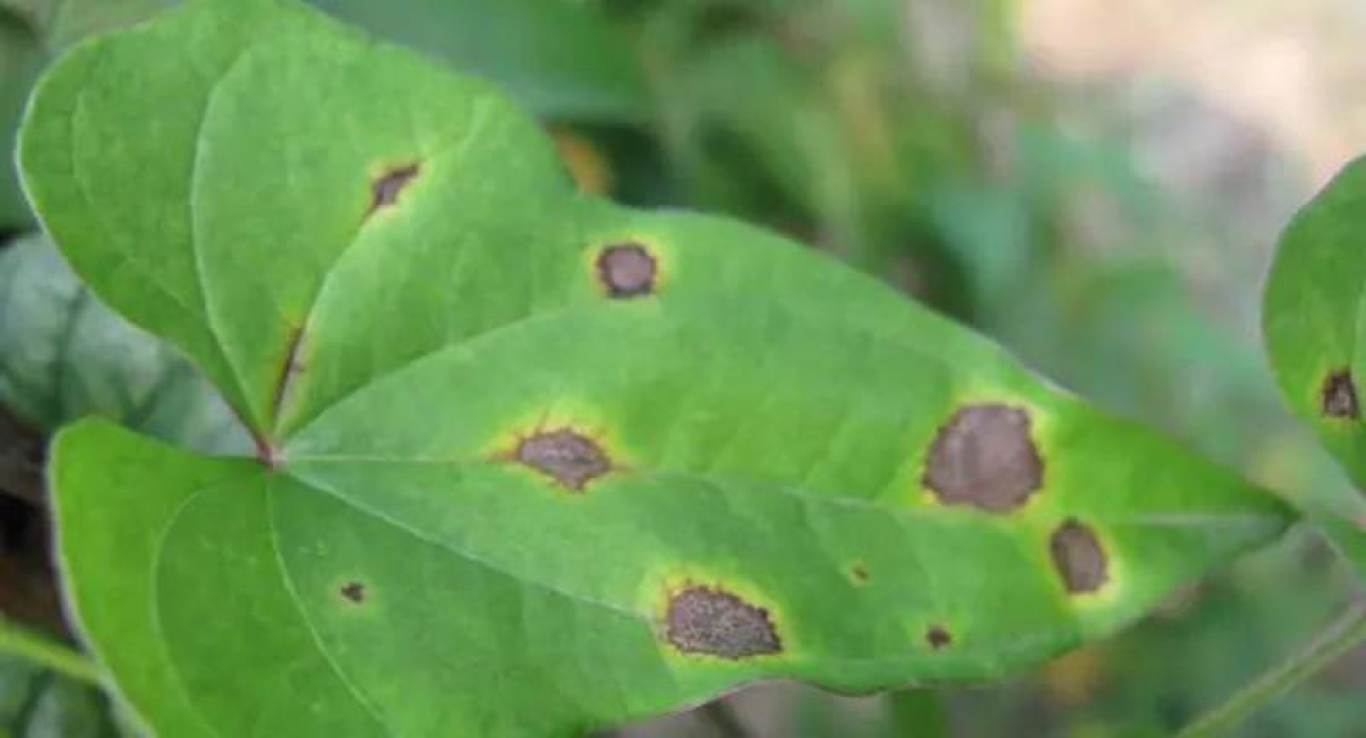 |  | 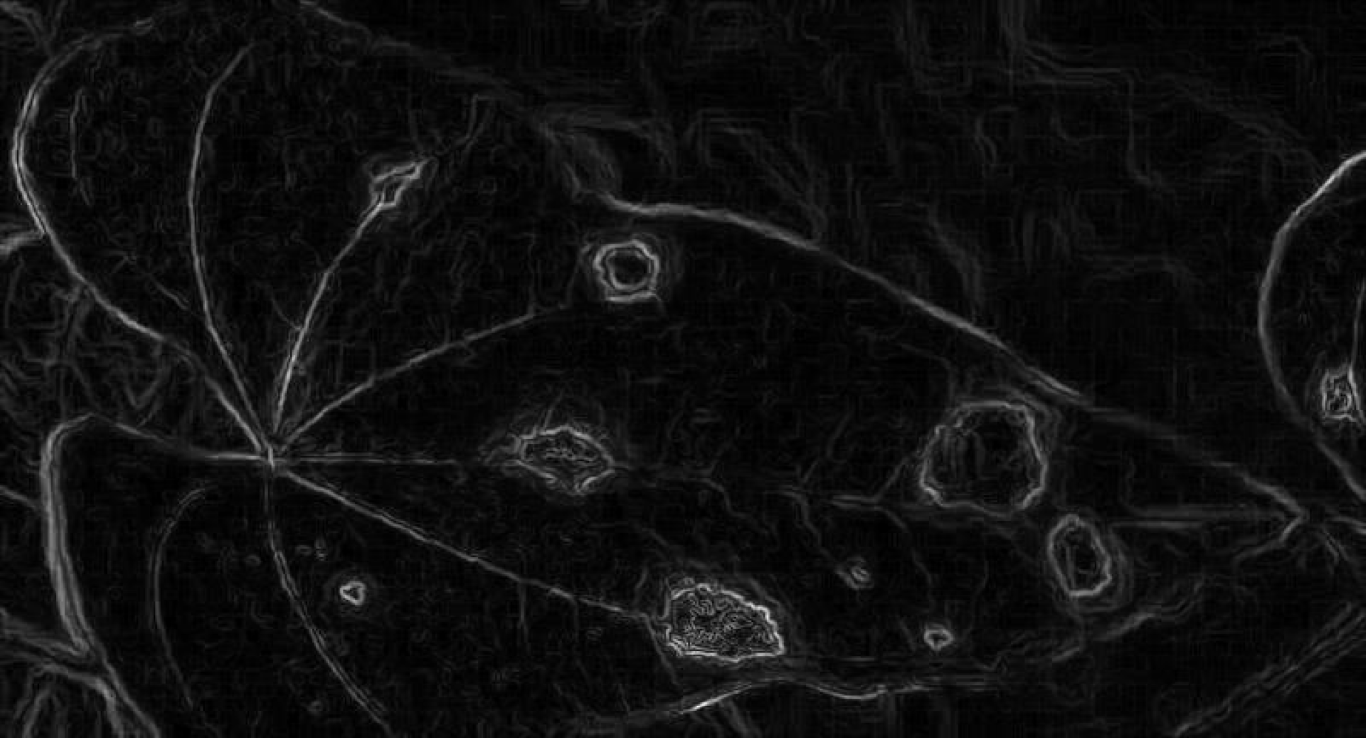 |
| leaf 05 | 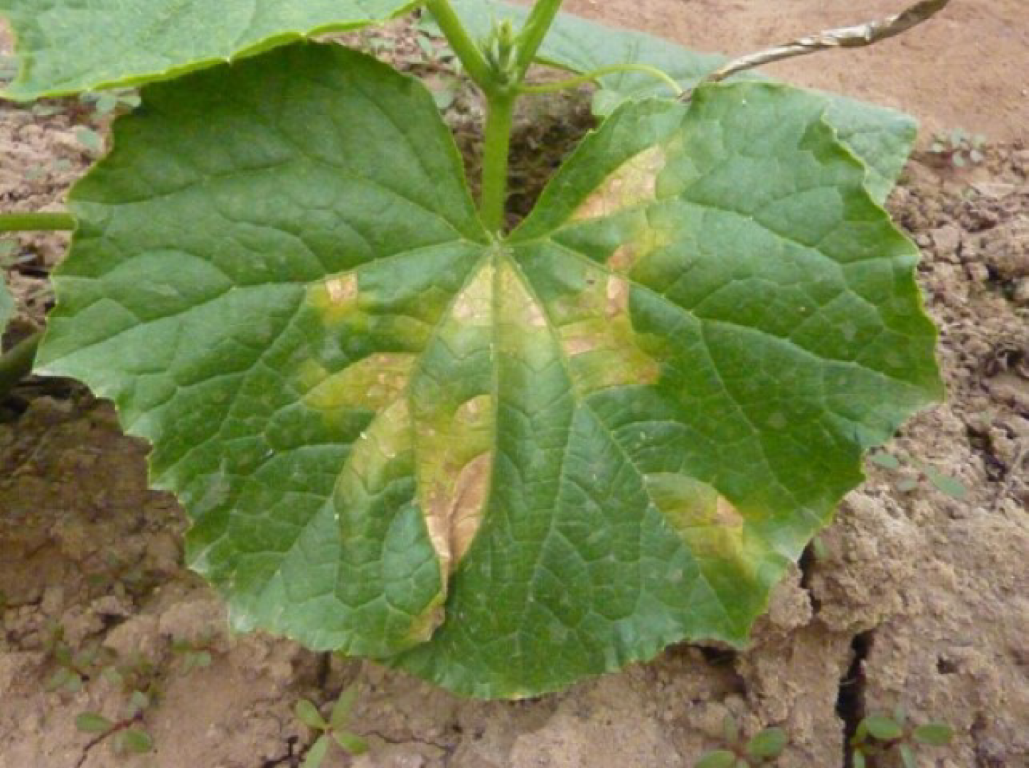 | 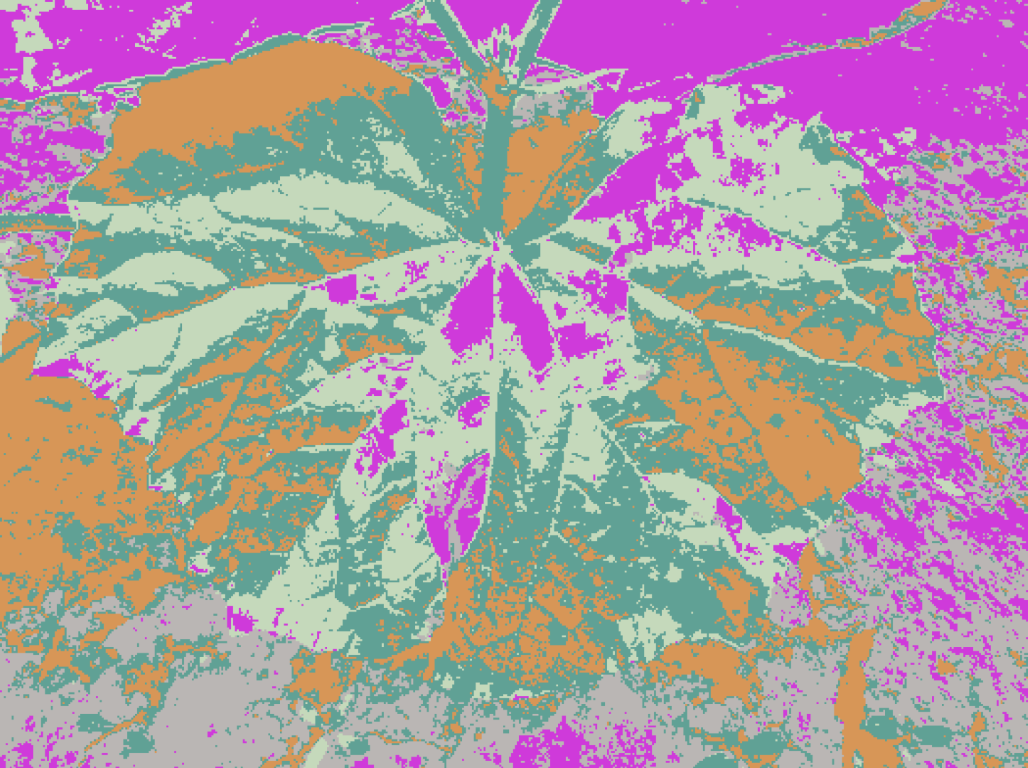 |  |
| leaf 06 |  |  |  |
| leaf 07 |  |  |  |
| leaf 08 |  |  |  |
| Image | Original | Sobel | Canny | Prewitt |
|---|---|---|---|---|
| 0-4 | 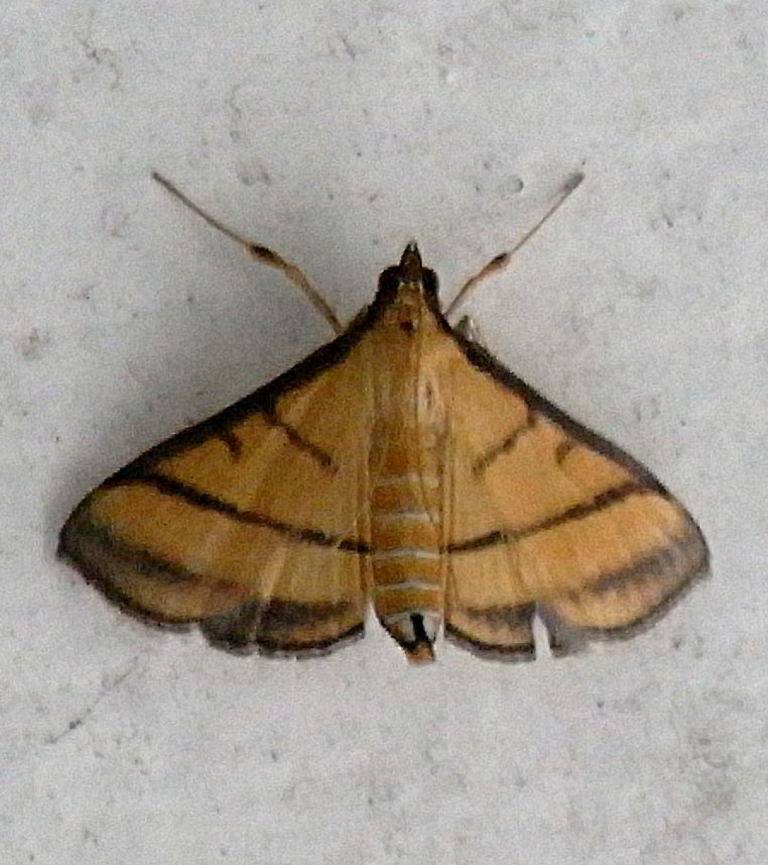 |  | 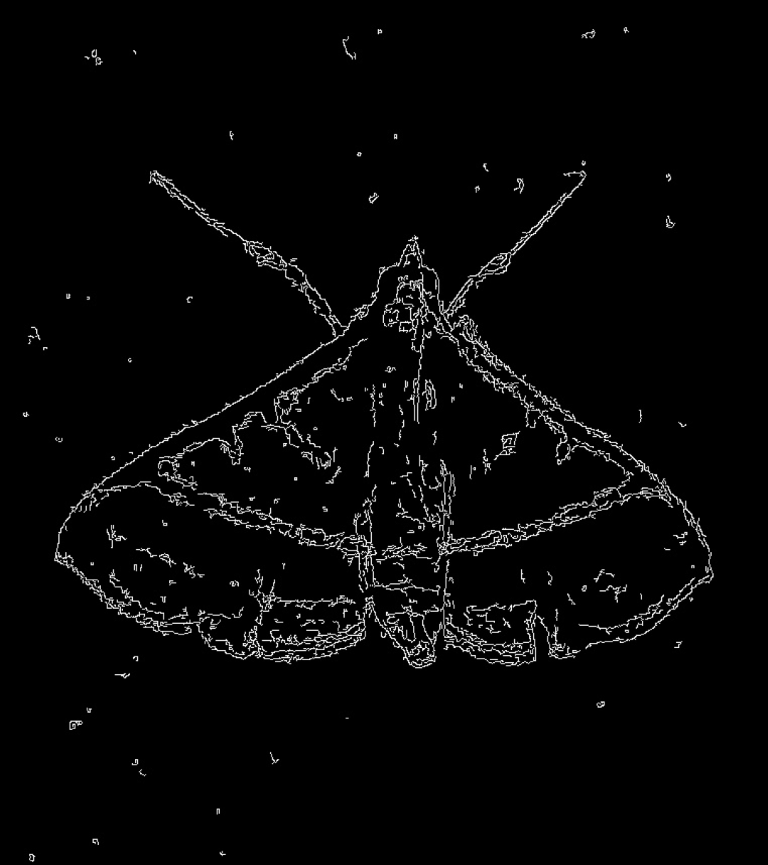 | 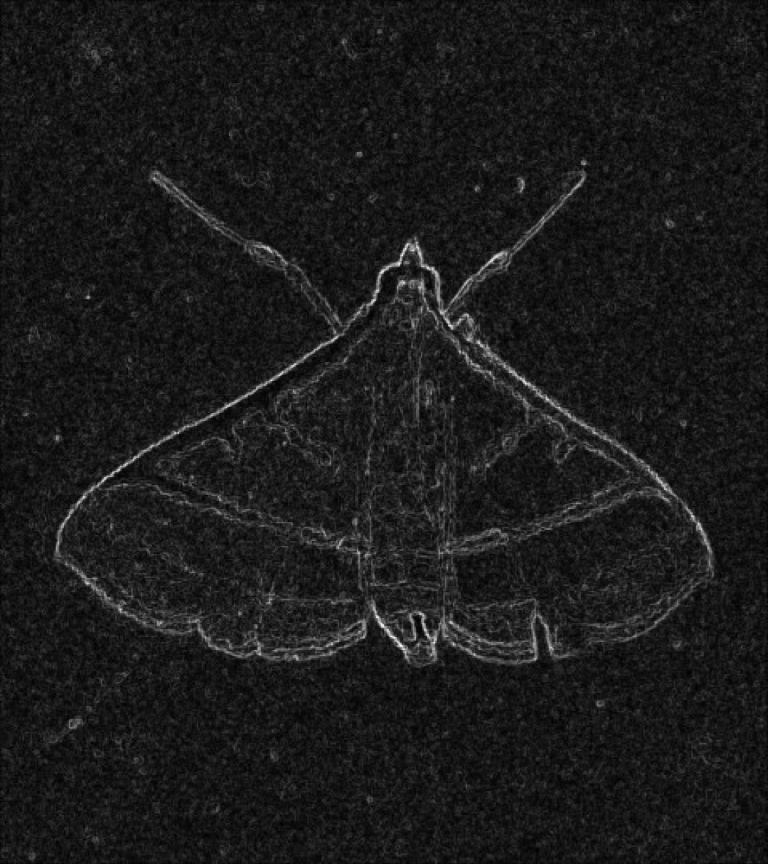 |
| 0-7 |  | 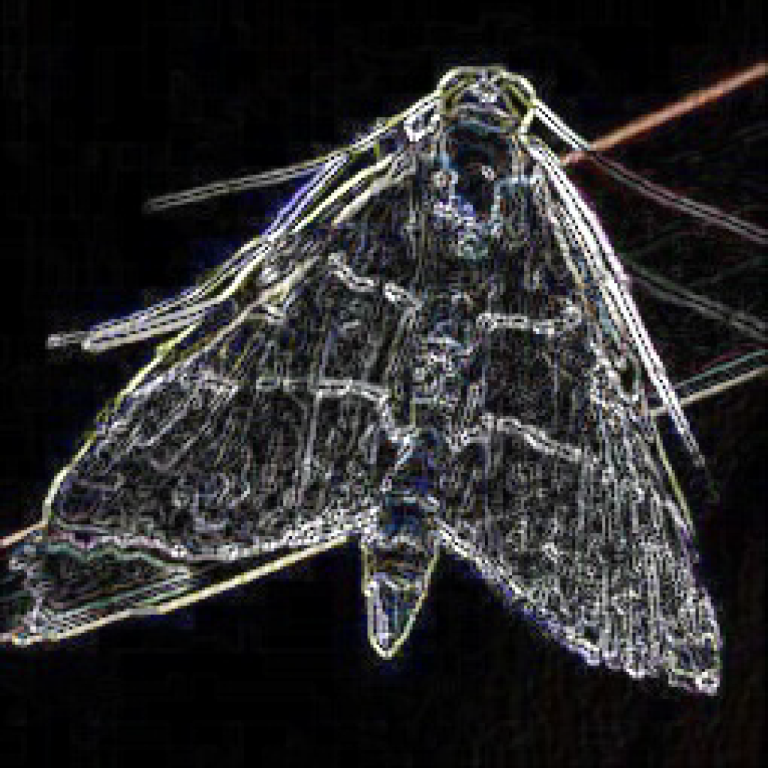 |  |  |
| 0-17 |  |  |  |  |
| 4-13 | 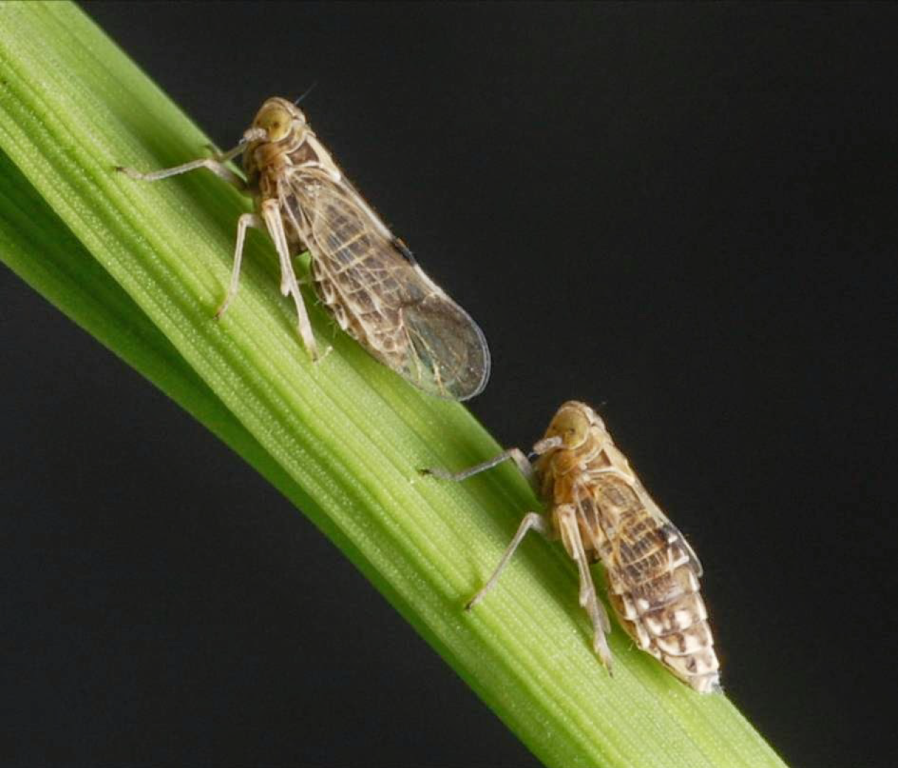 |  |  | 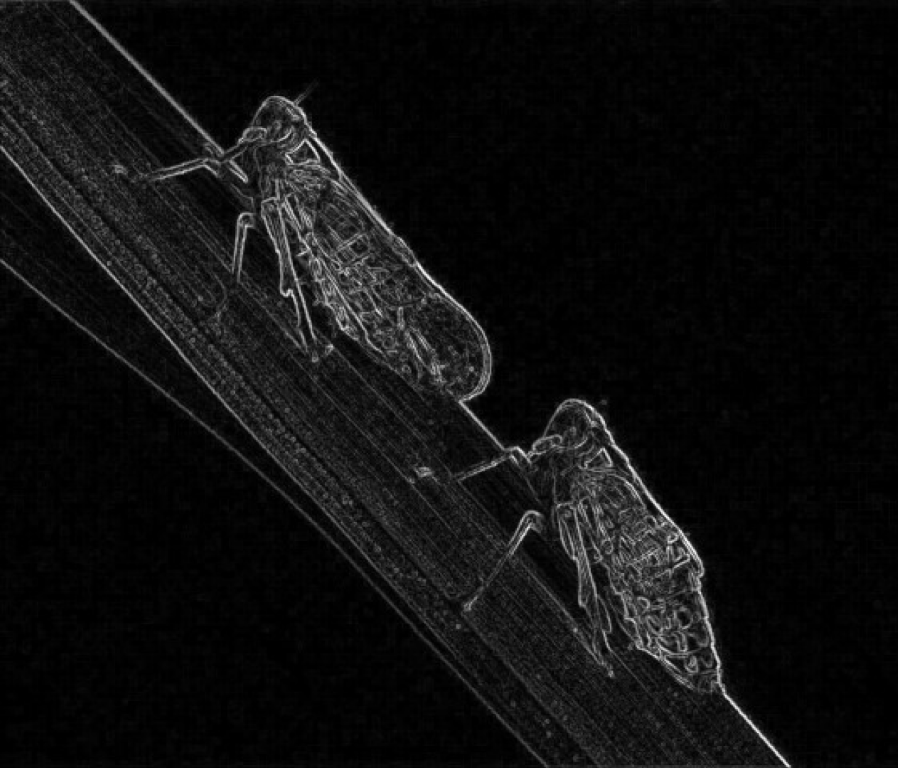 |
| leaf 01 | 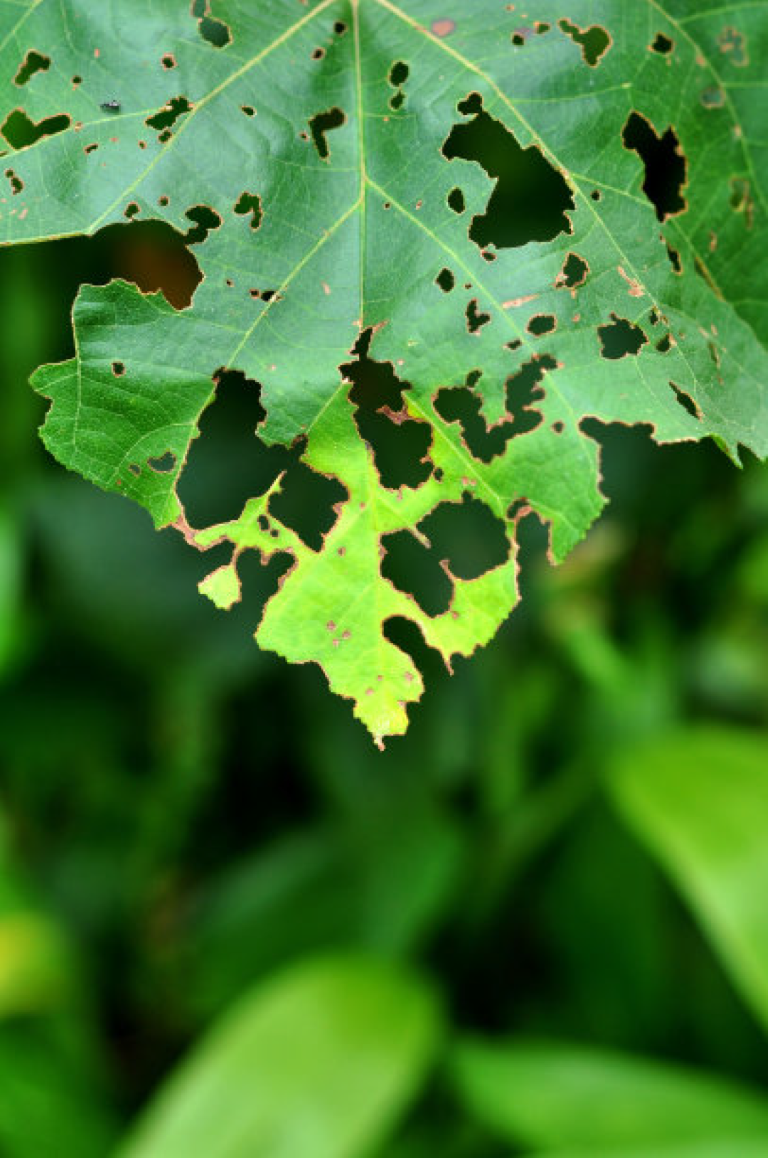 | 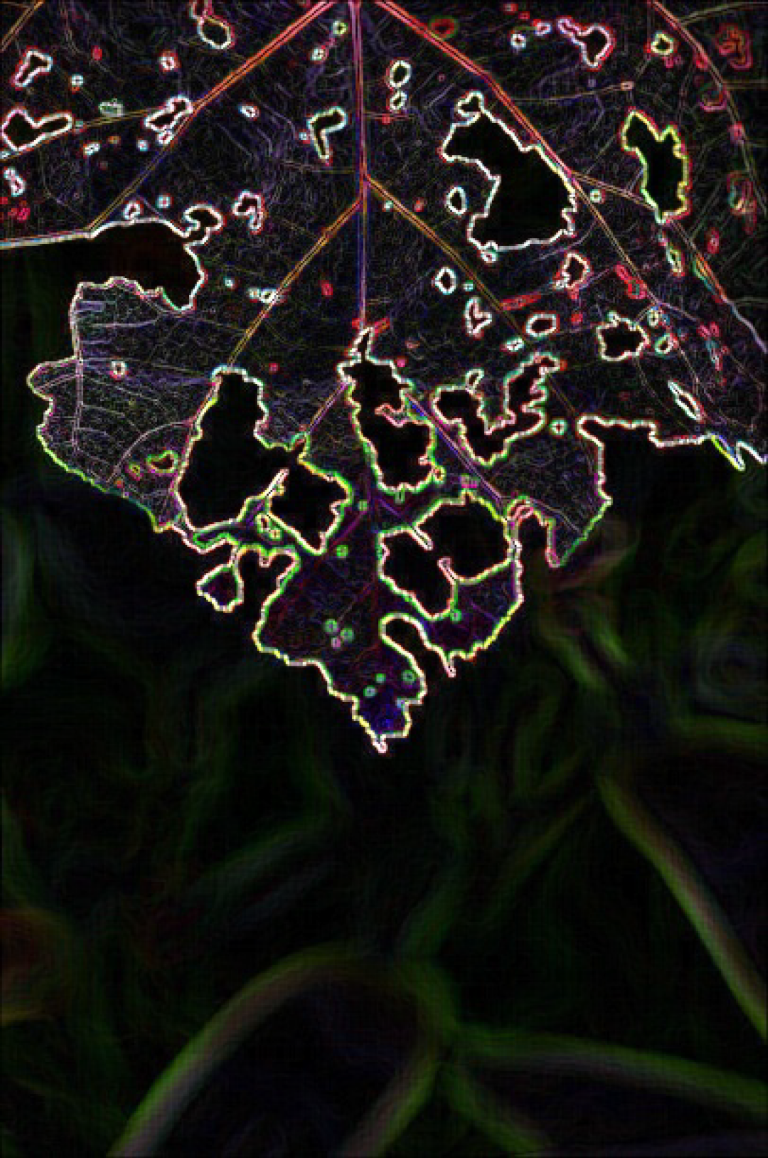 | 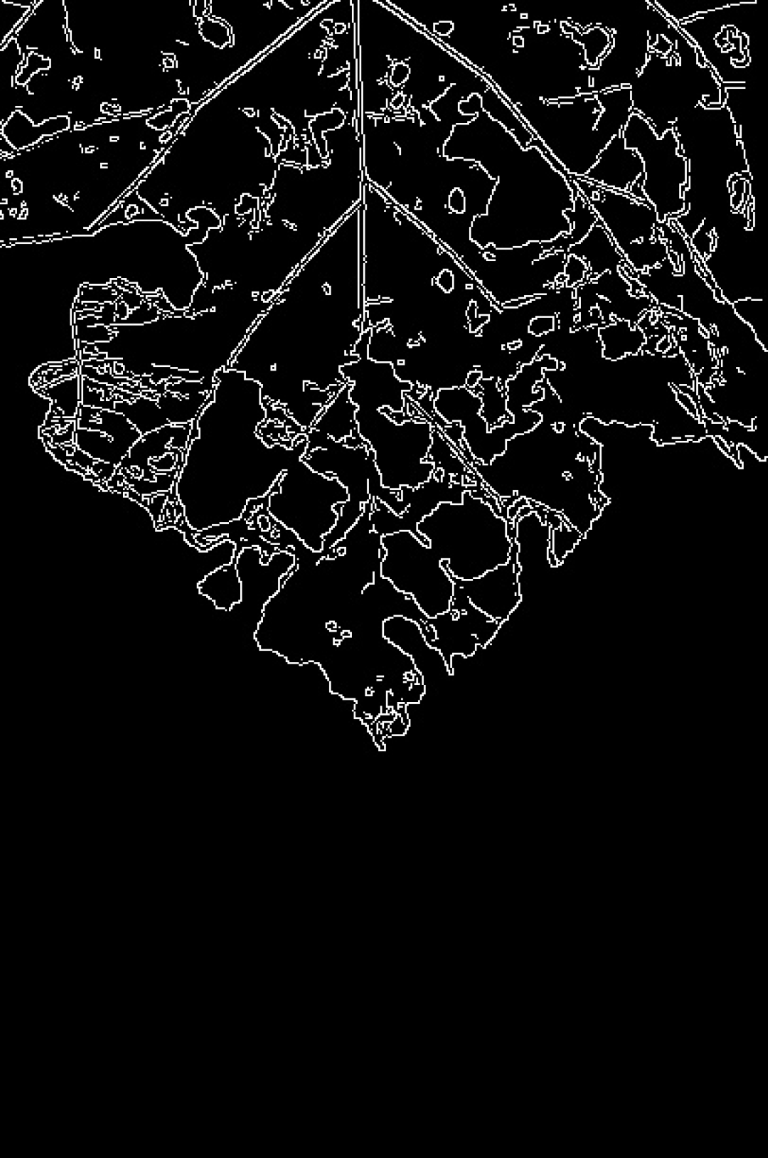 | 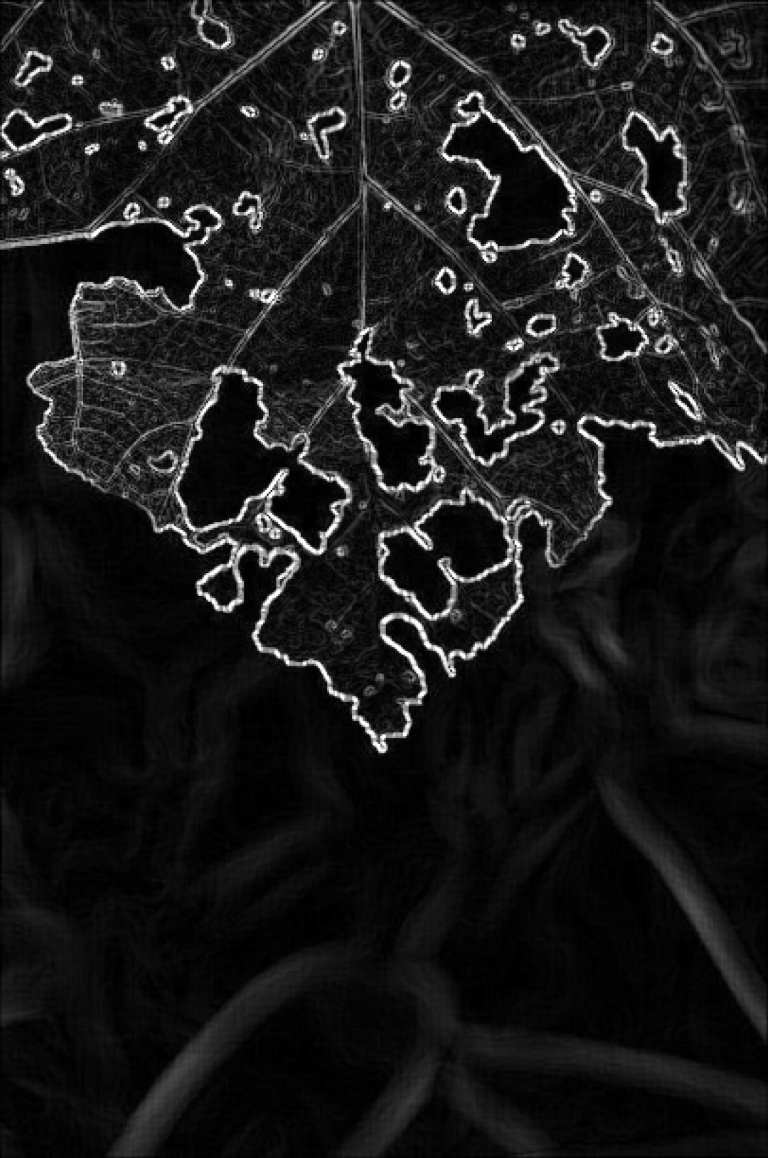 |
| leaf 04 | 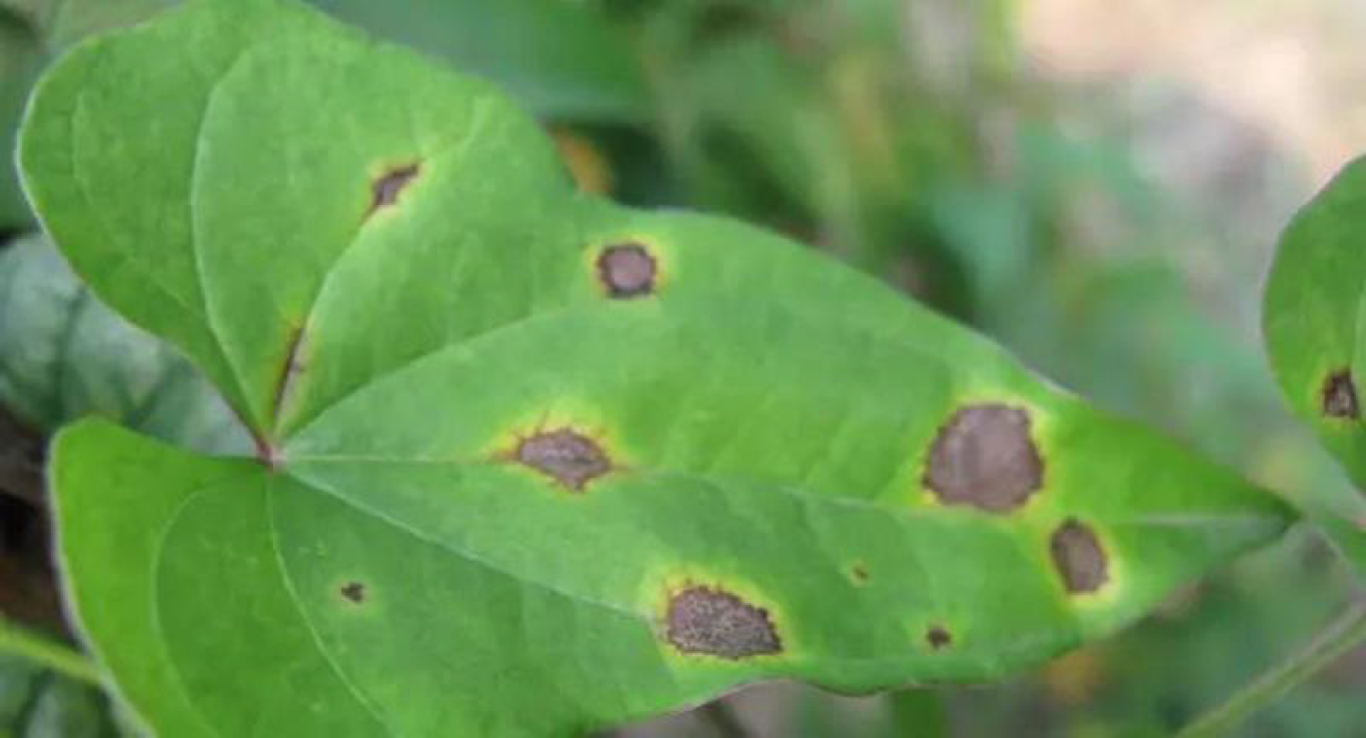 | 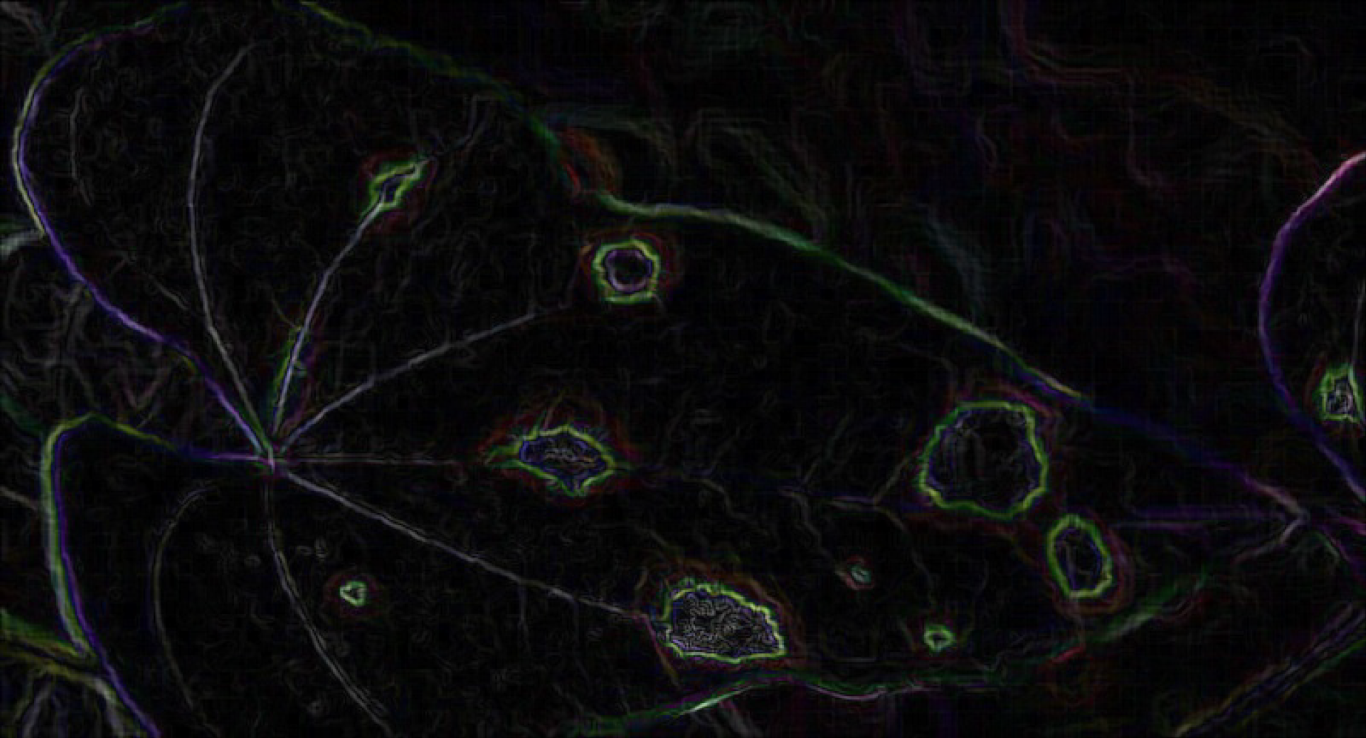 |  |  |
| leaf 08 |  |  | 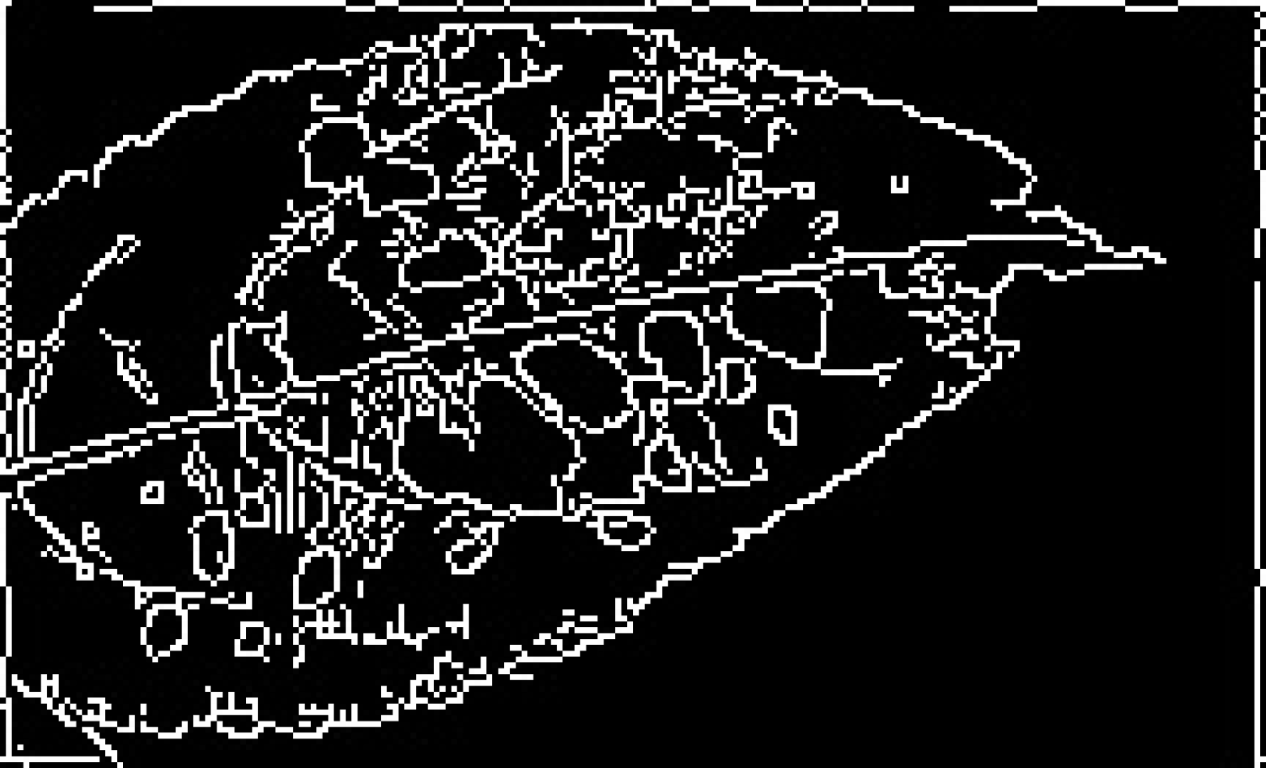 | 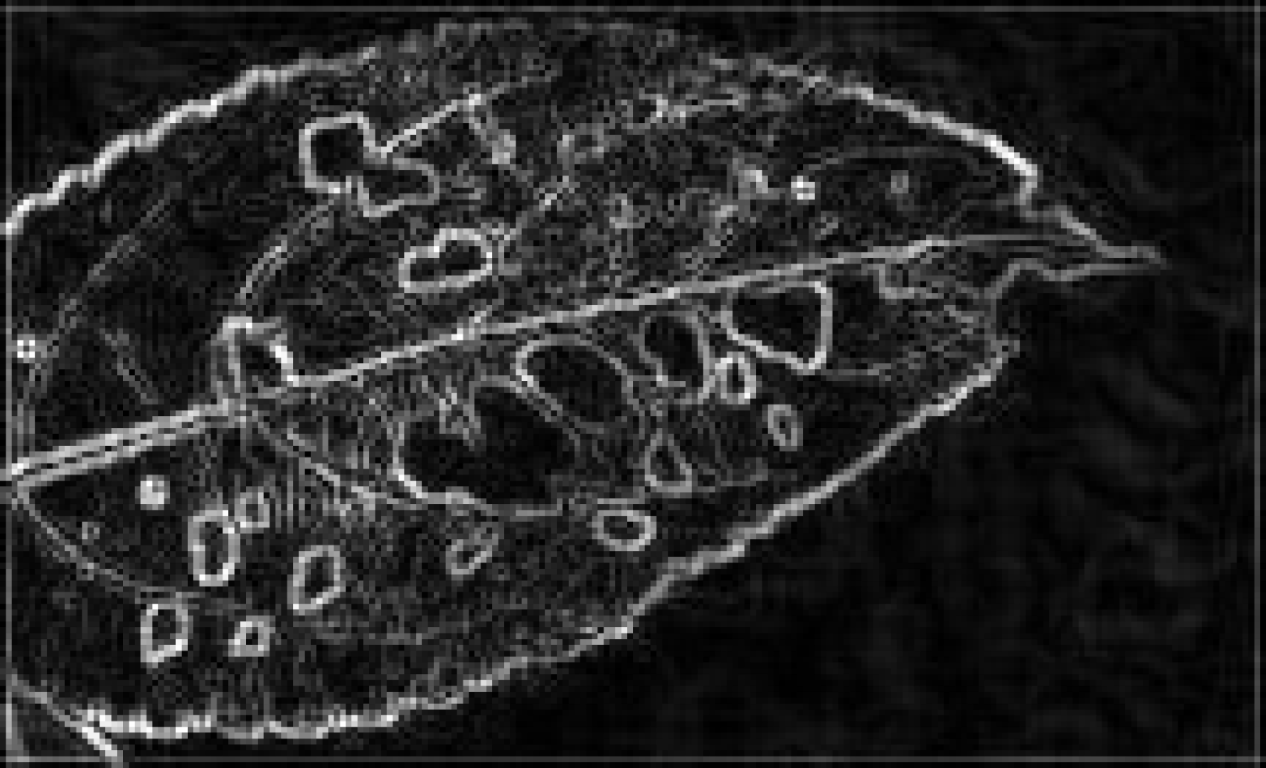 |
 |  |  |  |
 |  |  |  |
| Condition | Avg. Conf. | mAP@0.5 | Notes |
|---|---|---|---|
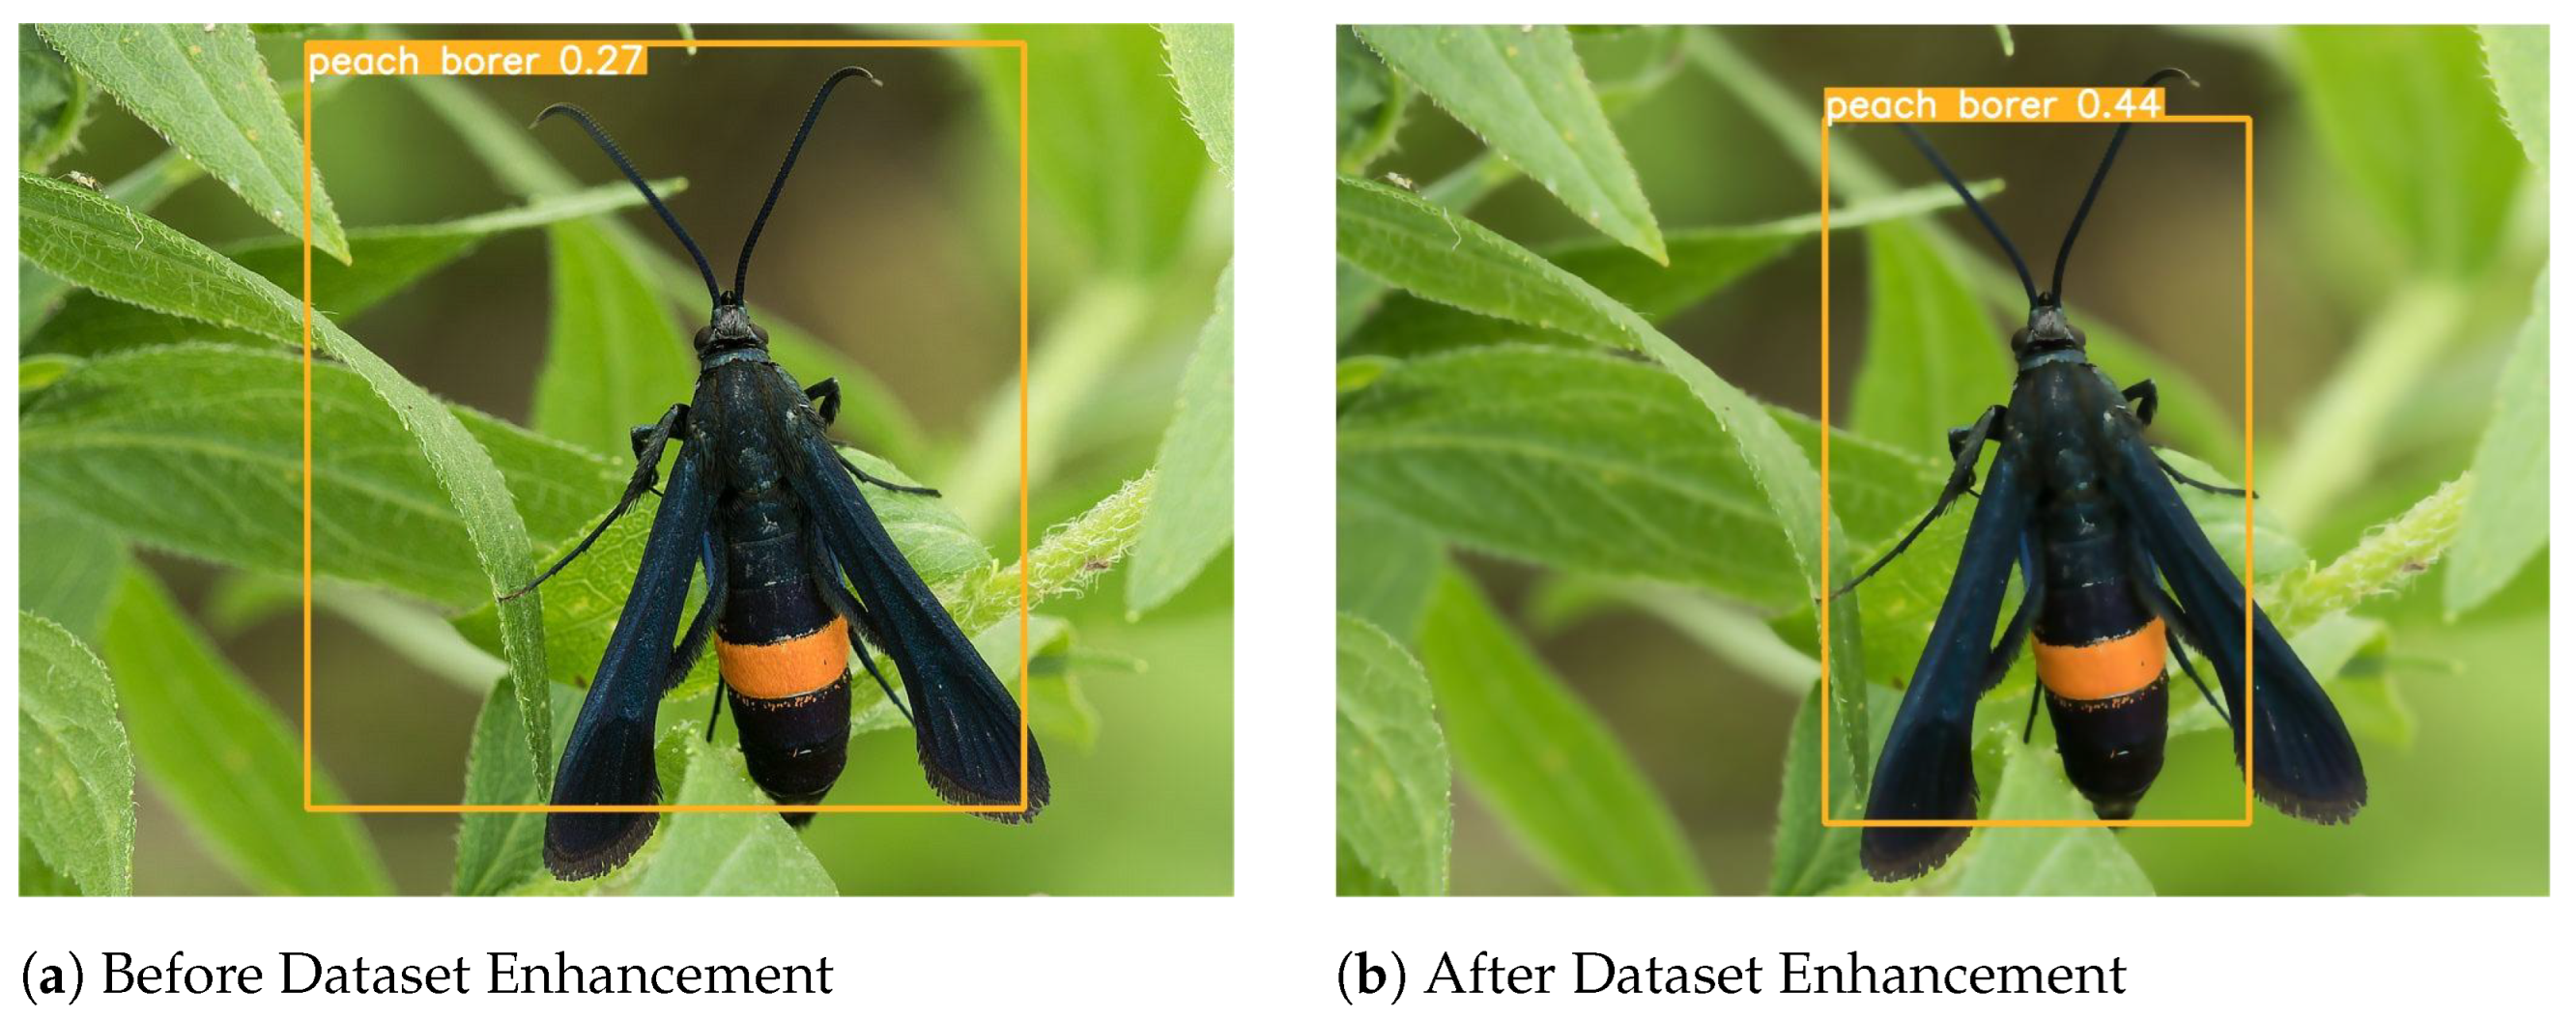
| Before Enhancement | 0.27 | 0.42 | Low confidence due to limited training samples. |
| After Enhancement | 0.44 | 0.67 | 63% increase in confidence and 59% improvement in mAP after augmentation. |
| Study | Core Methodology | Key Strength | Limitation/Distinction from Our Work | Reported Performance |
|---|---|---|---|---|
| [8] | Image Processing + ANN | High precision for specific pests in controlled environments. | Relies on hand-crafted features; performance may degrade with variable field image quality. | Precision: 0.96 |
| [11] | Deep CNN | High classification accuracy for 14 tea pest species. | Focuses on classification of pre-localized, often clean images; does not address full detection under quality constraints. | Accuracy: 97.75% |
| [14] | Mask R-CNN + Wavelet Transform + F-RNet | Excellent segmentation of disease spots; handles co-occurring diseases. | Advanced but complex; lacks a systematic prior assessment of input image quality to guide preprocessing. | Detection Acc.: 88% |
| [18] | Deep Learning (Faster R-CNN, SSD) | A real-time system for tomato pests/diseases. | Uses deep learning on raw images; performance is contingent on dataset quality without explicit quality checks. | mAP: ∼83% |
| Our Proposed Method | Systematic NR-IQA + Tailored Preprocessing + YOLOv5 | Robustness to real-world image degradations; generalizable pipeline. | Directly addresses input quality as a prerequisite; manual filter tuning. | mAP@0.5: 0.67 (up from 0.42); Confidence: +63% |
Disclaimer/Publisher’s Note: The statements, opinions and data contained in all publications are solely those of the individual author(s) and contributor(s) and not of MDPI and/or the editor(s). MDPI and/or the editor(s) disclaim responsibility for any injury to people or property resulting from any ideas, methods, instructions or products referred to in the content. |
© 2025 by the authors. Licensee MDPI, Basel, Switzerland. This article is an open access article distributed under the terms and conditions of the Creative Commons Attribution (CC BY) license (https://creativecommons.org/licenses/by/4.0/).
Share and Cite
Jia, S.; Horri Rezaei, M.; Honarvar Shakibaei Asli, B. Enhancing Pest Detection in Deep Learning Through a Systematic Image Quality Assessment and Preprocessing Framework. J. Exp. Theor. Anal. 2025, 3, 39. https://doi.org/10.3390/jeta3040039
Jia S, Horri Rezaei M, Honarvar Shakibaei Asli B. Enhancing Pest Detection in Deep Learning Through a Systematic Image Quality Assessment and Preprocessing Framework. Journal of Experimental and Theoretical Analyses. 2025; 3(4):39. https://doi.org/10.3390/jeta3040039
Chicago/Turabian StyleJia, Shuyi, Maryam Horri Rezaei, and Barmak Honarvar Shakibaei Asli. 2025. "Enhancing Pest Detection in Deep Learning Through a Systematic Image Quality Assessment and Preprocessing Framework" Journal of Experimental and Theoretical Analyses 3, no. 4: 39. https://doi.org/10.3390/jeta3040039
APA StyleJia, S., Horri Rezaei, M., & Honarvar Shakibaei Asli, B. (2025). Enhancing Pest Detection in Deep Learning Through a Systematic Image Quality Assessment and Preprocessing Framework. Journal of Experimental and Theoretical Analyses, 3(4), 39. https://doi.org/10.3390/jeta3040039


