Article

Machine Learning-Driven Prediction of Heat Transfer Coefficients for Pure Refrigerants in Diverse Heat Exchangers Types

by
Edgar Santiago Galicia
1,*,
Andres Hernandez-Matamoros
2 and
Akio Miyara
1
1
Department of Mechanical Engineering, Saga University, 1 Honjo-machi, Saga 840-8502, Japan
2
Department of Frontier Media Sciences, Meiji University, 4-21-1 Nakano, Tokyo 164-8525, Japan
*
Author to whom correspondence should be addressed.
J. Exp. Theor. Anal. 2025, 3(4), 32; https://doi.org/10.3390/jeta3040032
Submission received: 4 August 2025 / Revised: 19 September 2025 / Accepted: 11 October 2025 / Published: 16 October 2025

Abstract

Traditional empirical correlations for predicting saturated flow boiling heat transfer coefficients (HTC) often struggle with accuracy and generalizability, particularly across different refrigerants, heat exchanger geometries, and operating conditions. To address these limitations, this study investigates the application of machine learning for more robust HTC prediction. A comprehensive dataset was compiled, consisting of 22,608 data points from over 140 published studies, covering 18 pure refrigerants under diverse experimental setups. The primary goal was to evaluate the performance of different machine learning approaches—Wide Neural Network (WNN), Linear Regression (LR), and Support Vector Machine (SVM)—in predicting HTCs across varying tube types and heat exchanger configurations. The results indicate that the WNN model achieved the highest predictive accuracy, with a Root Mean Square Error (RMSE) of 1.97 and a coefficient of determination (R2) of 0.91, corresponding to less than 5% prediction error for all refrigerants. These outcomes confirm that machine learning models can effectively capture the complex thermofluid interactions involved in boiling heat transfer. This work demonstrates that data-driven methods provide a reliable and generalizable alternative to empirical correlations.

1. Introduction

The global push to mitigate climate change and protect the ozone layer has driven the development of next-generation refrigerants with low Ozone Depletion Potential (ODP) and Global Warming Potential (GWP), as mandated by international agreements such as the Montreal Protocol [1]. This shift has catalyzed extensive experimental efforts to evaluate the thermophysical properties and heat transfer characteristics of environmentally friendly refrigerants. However, the wide variety of candidate fluids, combined with complex interactions among operational parameters, heat exchanger designs, and environmental conditions, poses significant challenges to the accurate prediction of the heat transfer coefficient (HTC) [2,3].
Traditional approaches for predicting heat transfer coefficients (HTC), whether based on analytical modeling or experimental data, have typically led to the development of empirical correlations. While these correlations offer practical value within a defined scope, they are inherently limited in their generalizability. Most are formulated using data obtained under specific conditions, meaning they are only valid for a narrow set of refrigerants, flow regimes, surface geometries, or operating parameters. As a result, applying these correlations outside their original context—such as to different refrigerants, varying tube diameters, or under non-standard heat flux and pressure conditions—often leads to significant inaccuracies. Furthermore, these traditional correlations frequently neglect complex nonlinear interactions among the physical parameters involved, resulting in notable prediction discrepancies, particularly under conditions that deviate from the experimental baseline [4,5,6,7,8].
This limitation has created a growing demand for more flexible and robust prediction methods capable of capturing a wider range of thermofluid behaviors with higher accuracy across diverse systems. In recent years, numerical simulation, image processing, and artificial intelligence (AI) have emerged as powerful alternatives. In particular, the prediction of heat transfer coefficient (HTC) using machine learning has gained increasing importance, as it enables accurate modeling of complex boiling and condensation phenomena that are often difficult to capture with traditional empirical correlations. Unlike conventional approaches that are typically limited to specific refrigerants or narrow operating conditions, machine learning models provide the potential to establish a more general correlation applicable across a wide spectrum of working fluids, geometries, and thermodynamic states. This generalization is especially critical for emerging low-GWP refrigerants and their mixtures, where reliable experimental data are still limited [9,10,11,12,13,14]. By leveraging large experimental datasets and advanced learning algorithms, machine learning-based HTC prediction not only improves current design accuracy but also paves the way for robust predictive tools that can support the optimal design and operation of next-generation heat exchangers. Such capability is expected to be particularly valuable in assessing the performance of mixed refrigerants, where non-ideal thermophysical properties and complex phase interactions pose significant challenges for traditional correlations [15].
Among AI-based approaches, machine learning (ML) has gained substantial traction in mechanical and thermal engineering applications due to its ability to learn complex nonlinear relationships from data. ML techniques have shown significant promise in modeling flow boiling and condensation heat transfer phenomena [16,17,18,19,20]. For instance, Enoki et al. [16] developed a neural network trained on 12 independent datasets encompassing eight refrigerants, reporting an overall standard deviation of 8.4% in HTC predictions. Similary, Zhu et al. [9] utilized an artificial neural network (ANN) to predict HTC in mini-channels with serrated fins using R134a, achieving a Mean Absolute Relative Deviation (MARD) of 11.41% for boiling and 6.06% for condensation. Scalabrin et al. [21] investigated eight pure fluids and one constant-composition ternary mixture, resulting in a comprehensive database of 5236 experimental heat transfer data points. Of these, 4803 points were used to train multilayer feedforward network (MLFN) equations, which achieved an overall average absolute deviation (AAD) of 7.72%. These findings demonstrate the strong predictive capability of the MLFN approach and highlight its effectiveness in capturing the complex heat transfer behavior of different working fluids. Bard et al. [22] examined the role of feature engineering and numerical modeling techniques in predicting heat transfer coefficients (HTCs) in microchannels, addressing the high cost and complexity typically associated with physical experiments in thermal engineering. Their study used a comprehensive database of 16,953 experimental observations from 50 experiments involving 12 working fluids, including both circular and square minichannels under upward and horizontal saturated flow boiling conditions. Six different variable selection methods were applied to capture diverse feature distributions, and several machine learning models were evaluated. The best performance was obtained with a support vector machine (SVM) combined with the LASSO selection method on a unicategorical dataset, achieving a mean absolute percentage error (MAPE) of 10.64%, while the most accurate model trained on the full dataset also used SVM, in combination with the Boruta selection method, and achieved a MAPE of 11.33%. These results underscore the importance of feature selection in model performance and highlight the usefulness of machine learning as a powerful tool for predicting HTCs in microchannel applications. Lin et al. [23] based on DimNet, developed a data-driven empirical model to predict the pre-dryout heat transfer coefficient (HTC) of flow boiling within microfin tubes. The model was trained on a large database consisting of 7349 experimental data points for 16 refrigerants and optimized through systematic comparisons of dominant dimensionless parameter sets as well as adjustments to the network configuration. As a result, the final model demonstrated an overall mean absolute error (MAE) of 13.8%, confirming the effectiveness of data-driven approaches in capturing the complex heat transfer behavior associated with flow boiling in microfin tubes. Zhou et al. [17] collected 4882 experimental data points from 37 independent sources, covering 17 different working fluids and performed a comparison of four machine learning models—Artificial Neural Networks (ANN), Random Forest, AdaBoost, and Extreme Gradient Boosting (XGBoost). Following parametric optimization, ANN and XGBoost were found to offer the highest prediction accuracy, achieving Mean Absolute Errors (MAEs) of 6.8% and 9.1%, respectively. By using a comprehensive set of dimensionless input parameters, these models outperformed a widely accepted generalized empirical correlation, even demonstrating robust performance on unseen datasets when the working fluid was represented in the training data. Rossos et al. [12], considered a dataset comprising 1423 heat treatment time series collected from IoT devices was analyzed to predict the time required to reach 50 °C—a critical threshold for pest mortality. They conducted a nExploratory Data Analysis (EDA) to understand the data structure and trends, followed by the application of various machine learning models, including Random Forest, XGBoost, Ridge Regression, and Support Vector Regression (SVR). These results underscore the potential of machine learning as a powerful and generalizable tool for accurately predicting condensation heat transfer coefficients in mini/micro-channel systems. More recently, Kinjo et al. [20] developed a deep learning model to predict the heat transfer coefficient for micro fine tubes using 13 different refrigerants, encompassing a total of 4584 data points. They achieved a mean square error of 2.4.
A major challenge lies in the absence of standardized methodologies for evaluating and comparing the performance of machine learning models across different studies. The inconsistent use of evaluation metrics such as R2, RMSE, and MAE hinders meaningful benchmarking and slows progress toward the development of reliable and generalizable predictive frameworks. However, previous studies have reported R2 values ranging between 0.81 and 0.99, Main Absolute Error (MAE) lower than 2.8, along with Root Mean Squared Error (RMSE) values lower than 2.4, indicating that machine learning models are capable of achieving relatively high predictive accuracy [15].
Nevertheless, a comprehensive comparison of diverse machine learning models using a robust database that includes variations in tube type, heat exchanger configuration, and refrigerant properties has not yet been reported. While previous studies have focused on individual fluids, specific geometries, or limited datasets, a systematic evaluation across multiple variables and a wide range of experimental conditions is still lacking. Conducting such a comparison is crucial to understanding the relative performance of different machine learning approaches, identifying the most suitable models for heat transfer prediction, and revealing how input features such as geometry and refrigerant type influence predictive accuracy.
Building upon these advancements, this study investigates the application of machine learning to improve the prediction of saturated flow boiling HTCs. Unlike previous studies limited to single-tube geometries, our work considers diverse heat exchanger configurations and tube types to enhance the generalizability of predictions. We evaluate the performance of three ML models—Wide Neural Networks (WNN) [24,25], Linear Regression (LR) [26,27], and Support Vector Machines (SVM) [28,29]—trained on a dataset comprising over 22, 608 experimental observations involving 18 refrigerants under various saturated boiling conditions. In addition, 9 tube types (Microfin/Herringbone, Microfin/Spiral, Multiport/Cricle, Multiport/Rectangle, Plate/Chevron, Plate/Oblique-Washboard, Plate/Zig-zag, Smooth tube, and others) and 3 heat exchanger types (Multiport Tube, Plate Heat Exchanger and Round Tube) were considered on the database.
Furthermore, this research explores how ML models can refine and augment existing empirical correlations to improve predictive reliability and reduce mean prediction errors. By integrating experimental observations with advanced computational tools, this work contributes to the ongoing effort to design more accurate, efficient, and environmentally sustainable thermal systems. Diverse machine learning models were compared under the same input conditions.

2. Machine Learning-Based Prediction Models

In this study, machine learning techniques are employed to uncover relationships between input variables—such as flow parameters and thermophysical properties—and target outputs like the heat transfer coefficient (HTC). Three predictive models are evaluated: Wide Neural Networks (WNN), Linear Regression (LR), and Support Vector Machines (SVM). The following subsections provide an overview of each method used in this research.

2.1. Linear Regression

Linear Regression (LR) [26,27] is a widely-used statistical method for modeling the relationship between one or more independent variables and a dependent variable. It serves as a baseline algorithm in predictive modeling. LR assumes a linear relationship between the dependent variable y and the set of independent variables x 1 , x 2 , , x p . The general form is:
y = β 0 + β 1 x 1 + β 2 x 2 + + β p x p + ε
where β 0 is the intercept, β 1 , , β p are the model coefficients, and ε is the random error.
The coefficients β are estimated using the least squares method, which minimizes the sum of squared differences between predicted and actual values:
β ^ = arg min β i = 1 n y i β 0 j = 1 p β j x i j 2

Assumptions

Linear regression relies on the following assumptions:
  • Linearity: The relationship between predictors and the response is linear.
  • Independence: Observations are independent of each other.
  • Homoscedasticity: Constant variance of errors across observations.
  • Normality: Errors are normally distributed.

2.2. Wide Neural Networks

Wide Neural Networks (WNN) are a class of artificial neural networks characterized by a high number of neurons within each hidden layer, which significantly enhances their ability to model complex and nonlinear relationships in data. Unlike traditional deep networks that emphasize depth through multiple stacked layers, WNNs leverage width to improve representational capacity, making them particularly suitable for problems involving intricate patterns and large, high-dimensional datasets [24,25].
A typical WNN architecture comprises three main components: an input layer, one or more wide hidden layers, and an output layer. The hidden layers contain a large number of neurons, which allows the network to capture a broader and more detailed range of features from the input data. This structural design increases the network’s expressiveness and makes it capable of approximating highly nonlinear functions.
The training process of WNNs involves adjusting the network’s internal weights to minimize a loss function, which measures the error between the predicted and actual outputs. This is achieved through optimization algorithms such as Stochastic Gradient Descent (SGD) or the Adam optimizer [30]. These algorithms iteratively update the weights based on the computed gradients, enabling the network to learn from the data and improve prediction accuracy over time.
WNNs offer several advantages, notably their effectiveness in handling large datasets and their ability to model complex interactions without the need for extremely deep architectures. However, these benefits come with certain challenges. The large number of parameters increases the risk of overfitting, especially when the training dataset is limited. Furthermore, WNNs require more computational resources and longer training times compared to narrower or shallower networks. Despite these limitations, when properly regularized and trained, Wide Neural Networks serve as powerful tools for predictive modeling, especially in engineering and scientific applications where capturing fine-grained relationships is essential.

2.3. Support Vector Machines

Support Vector Machines (SVM) are powerful supervised learning models used for classification and regression, particularly suitable for high-dimensional datasets. SVM aims to find the hyperplane that best separates data points belonging to different classes. The optimal hyperplane maximizes the margin between the classes [28].

2.3.1. Mathematical Model

Given training data { ( x i , y i ) } i = 1 n where x i R p and y i { 1 , 1 } , the SVM optimization problem is formulated as:
min w , b 1 2 w 2 subject to y i ( w · x i + b ) 1 , i
This optimization ensures that the classifier finds a hyperplane defined by vector w and bias term b that separates the classes with the maximum possible margin, leading to improved generalization on unseen data. For datasets that are not linearly separable, soft-margin SVMs introduce slack variables to allow for some misclassification, and kernel functions are used to project data into higher-dimensional spaces where linear separation becomes feasible. Commonly used kernels include the polynomial kernel and the radial basis function (RBF) kernel, both of which are instrumental in capturing nonlinear relationships between input features.

2.3.2. The Kernel Method

To effectively handle nonlinear relationships between input variables and target outputs, Support Vector Machines (SVMs) utilize a mathematical technique known as the “kernel trick.” This method allows the algorithm to implicitly map the input data into a higher-dimensional feature space without the need to explicitly compute the coordinates in that space. By doing so, SVMs can transform problems that are not linearly separable in the original input space into ones that are linearly separable in the higher-dimensional space, allowing for more accurate and flexible decision boundaries [29].
Several kernel functions are commonly used to perform this transformation, each with its own characteristics. The polynomial kernel introduces interactions of features up to a specified degree, making it suitable for problems where the relationship between variables can be described by polynomial functions. The Radial Basis Function (RBF) kernel, also known as the Gaussian kernel, is particularly popular due to its ability to handle localized variations in data. It maps points based on their distance from one another, enabling the model to fit very complex patterns.
These kernel functions enhance the learning capacity of SVMs without increasing the computational complexity dramatically, as all calculations are performed using inner products in the transformed space. This makes SVMs not only powerful for handling nonlinear regression and classification problems but also efficient and scalable [28,29].

3. Date Base Description

This study employs a large and diverse dataset to enhance the prediction accuracy of saturated flow boiling heat transfer coefficients (HTC) using machine learning techniques. Traditional empirical correlations often lack the flexibility to generalize across different refrigerants, tube geometries, and operating conditions. To address these limitations, a robust and comprehensive dataset was compiled from over 140 published experimental studies. The complete database is available in [31].

Input Data Selection

The dataset comprises 22,608 data points corresponding to saturated flow boiling conditions for 18 pure refrigerants, covering a broad spectrum of experimental setups. In this dataset, refrigerant type, tube geometry, and heat exchanger configuration were explicitly treated as categorical variables, allowing the machine learning models to account for variations in these key parameters. This careful categorization ensures that the dataset captures a wide range of real-world conditions and operational scenarios, providing a robust foundation for developing accurate and generalizable predictive models. Each data point records key experimental variables such as refrigerant, saturation temperature, wall temperature, pressure, vapor quality, mass flux, tube diameter, as detailed in Table 1, tube type and heat exchanger type as shown in Figure 1 and Figure 2, respectevely. In addition, thermophysical properties such as density, viscosity, surface tension, specific heat, and thermal conductivity for both liquid and vapor phases were included, resulting in a total of 20 input features used for training the machine learning models. Not reported or missing thermal properties on the publised papers were calculated using Refprop 10.0 [32].
The refrigerants with the highest number of recorded data points include R32 (3609 points), R134a (3100 points), R245fa (2392 points), and R744 (2387 points) indicating a strong representation of both traditional and next-generation low-GWP fluids. This extensive and detailed dataset serves as a robust foundation for training machine learning algorithms, enabling reliable and generalizable predictions of boiling HTC across a wide range of refrigerants and flow conditions.
The diversity and distribution of tube types included in the dataset are illustrated in Figure 1, which presents the number of data points associated with each tube geometry. The dataset is clearly dominated by Smooth Tubes, with over 10,000 data points, providing a strong foundation for model training in conventional geometries. Microfin/Spiral and Multiport/Rectangle tubes also contribute significantly, each with between 3000–5000 observations. These are followed by Plate/Chevron, Multiport/Circle, and Others, each offering a few thousand data points. Meanwhile, Microfin/Herringbone, Plate/Zig-Zag, and Plate/Oblique-Washboard are underrepresented, contributing fewer than 500 data points each.
This distribution underscores an important feature of the dataset: while it captures a broad variety of heat exchanger tube types, the sample size varies significantly among them. The overrepresentation of smooth and spiral tubes may reflect their wider industrial usage and experimental accessibility, while the scarcity of data for certain enhanced surfaces points to a need for further experimental studies in those configurations. Nevertheless, this diverse dataset remains robust enough to train predictive models with strong generalization capabilities across different refrigerants and exchanger types.
By encompassing a wide range of flow conditions, refrigerants, and geometric parameters, this dataset forms a valuable foundation for training and evaluating machine learning models aimed at predicting saturated flow boiling HTC with high accuracy. The compiled database is made publicly available in [31], offering a critical resource for further advancements in heat exchanger design, performance optimization, and AI-assisted thermal engineering research.
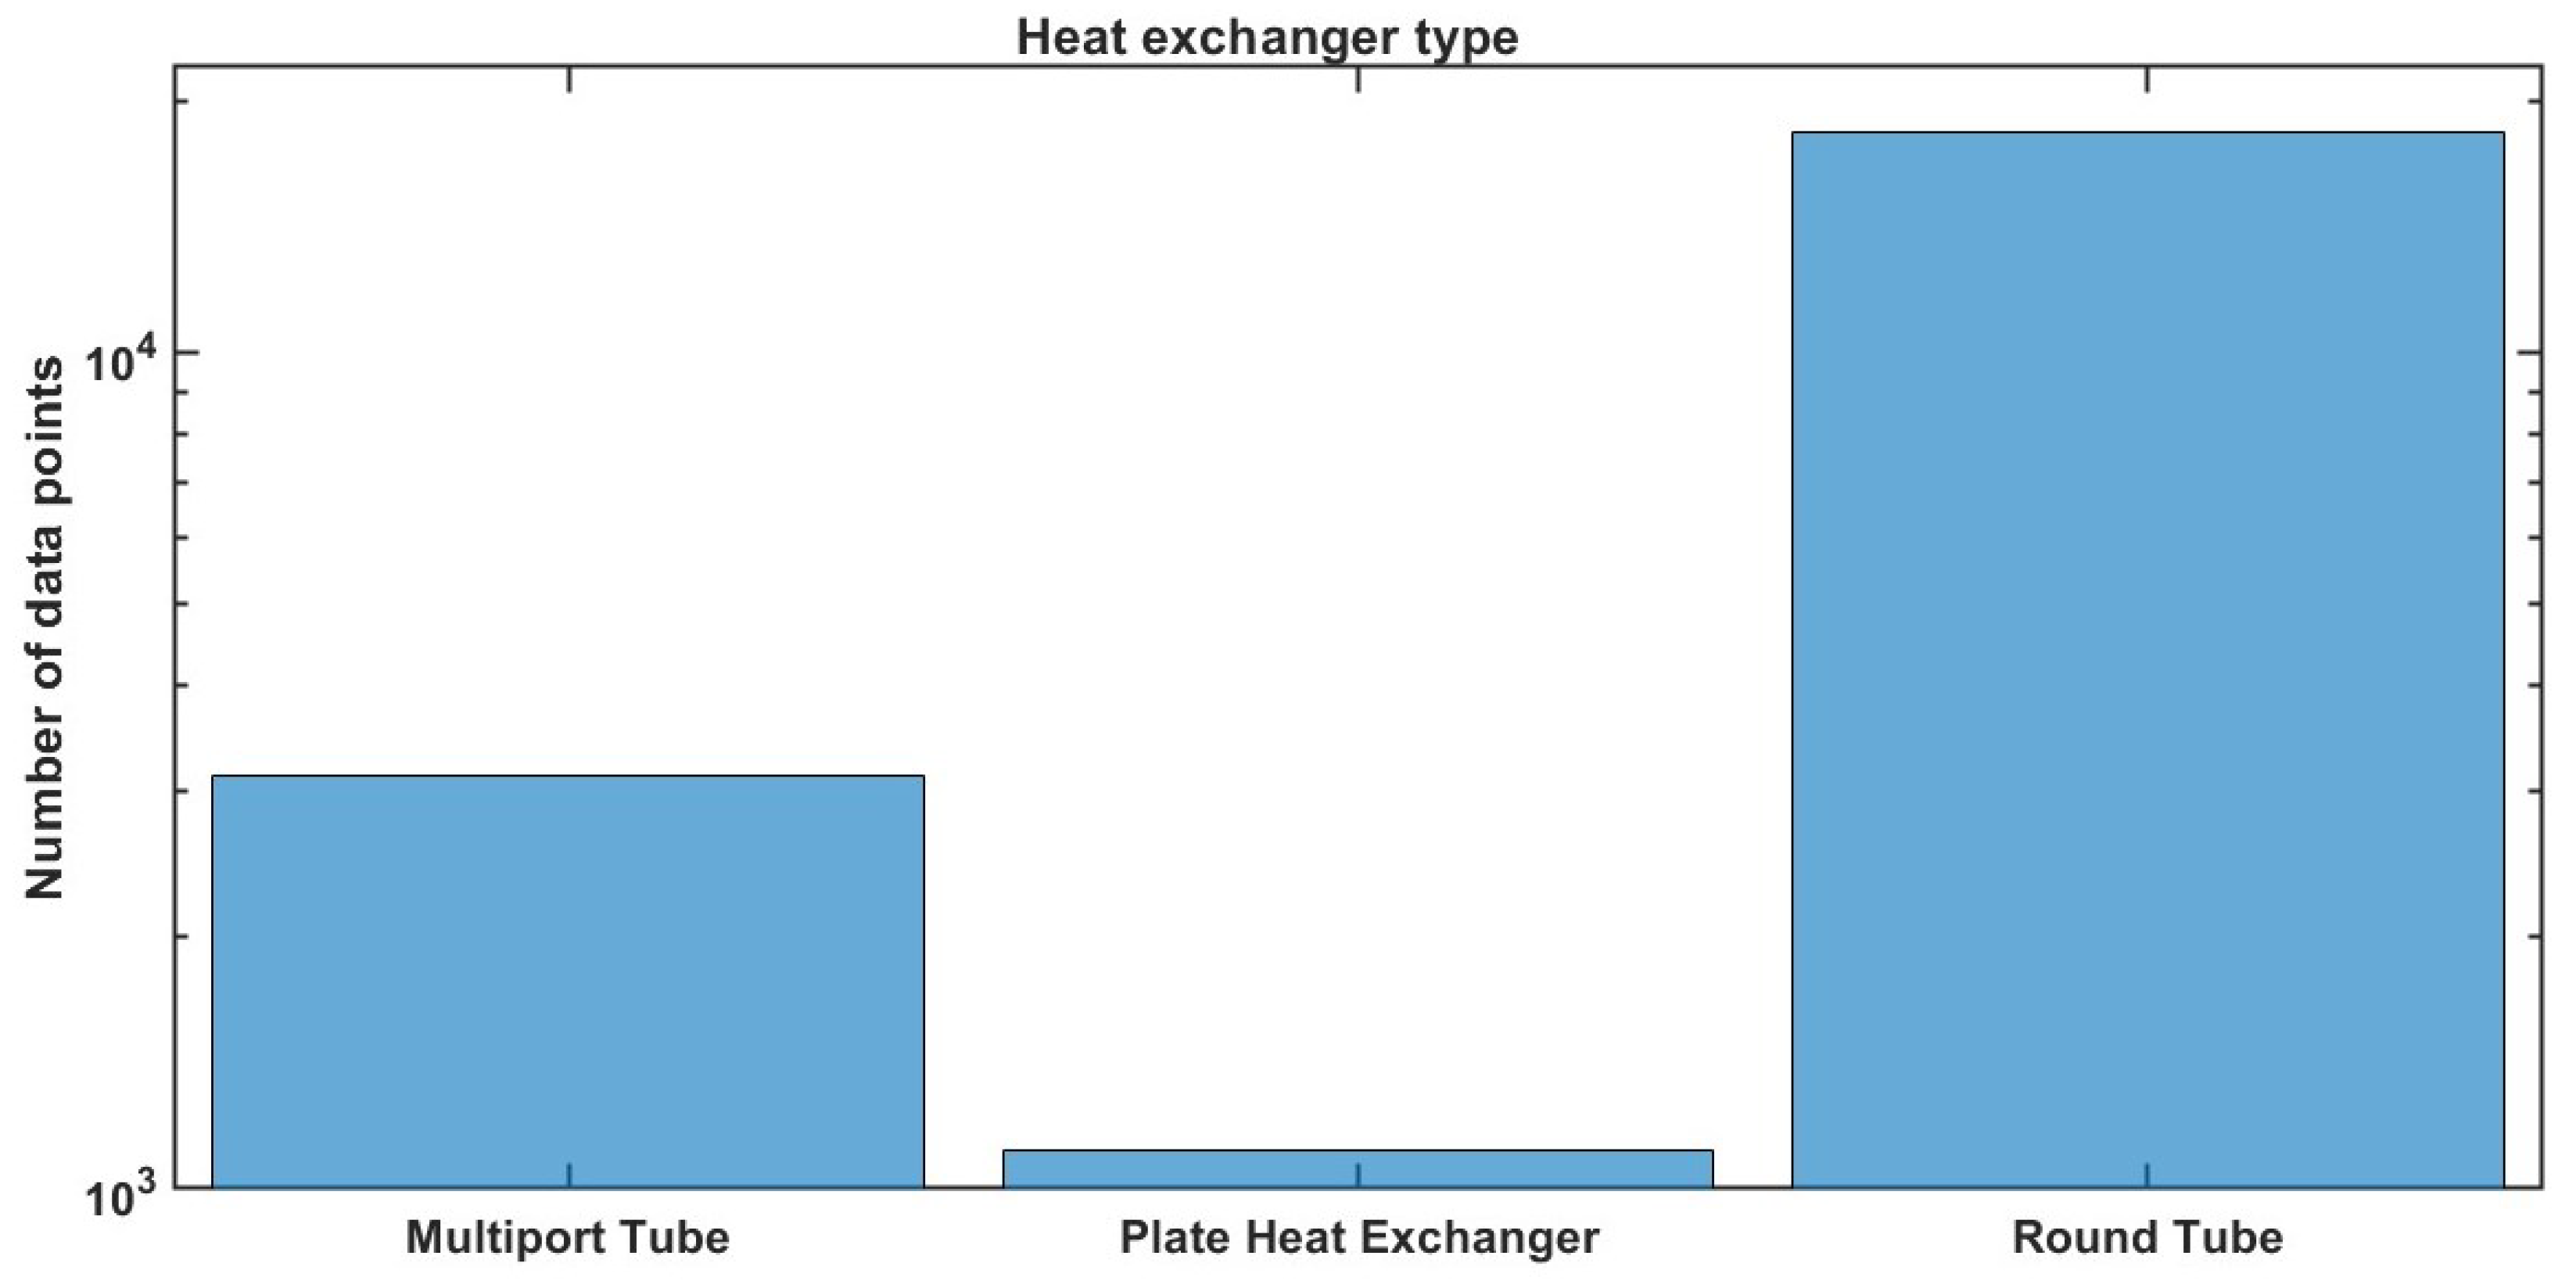
The dataset used in this study features a broad range of heat exchanger types, which is crucial for ensuring the generalizability of machine learning models predicting saturated flow boiling heat transfer coefficients (HTC). As shown in Figure 2, the majority of the experimental data originates from Round Tube configurations, contributing more than 10,000 data points corresponding to the 81.2% of the data base, and making it the most extensively represented heat exchanger type in the dataset. This predominance likely reflects the widespread use and accessibility of round tubes in both laboratory and industrial applications.
Multiport tubes represent the second most populated category, contributing over 3000 data points (13.9%). These tubes, which are common in compact heat exchangers and automotive applications, provide valuable diversity in the dataset and support the training of models capable of handling more complex flow structures.
In contrast, Plate Heat Exchangers are underrepresented, with fewer than 2000 data points that represents 4.9% of the data points. It highlights an imbalance in the dataset and underscores the need for additional experimental work in this area to strengthen the model’s accuracy for plate-type geometries.
Overall, the distribution of data across these three major heat exchanger types supports the development of predictive models with good coverage of conventional geometries, while also identifying opportunities for further enrichment of underrepresented configurations to enhance model robustness in future research.

4. Results

The complete experimental heat transfer coefficient (HTC) dataset was organized and analyzed using a 5-fold cross-validation approach (K = 5). In this method, the dataset was divided into five equally sized subsets, with four subsets (representing 80% of the total data) used for training the machine learning models and the remaining subset (20%) reserved for testing and validation. This process was repeated five times, rotating the testing subset in each iteration, to ensure that every data point was used both for training and validation. By employing this systematic cross-validation strategy, the models’ predictive performance could be evaluated more reliably and potential overfitting minimized. Multiple models were trained and evaluated, and the most accurate one was chosen for fitting the heat transfer correlation. This section provides a detailed overview of the models tested, emphasizing the inclusion of various types of predictor variables—both numerical and categorical. The correlation fitting was guided by the outcomes of the machine learning models, linking experimental parameters and thermophysical characteristics. A thorough validation ensured the selected model reliably represented the complex relationships among the predictors. By applying sophisticated machine learning algorithms, the study developed a strong heat transfer correlation that aligns with the system’s physical behavior. This successful combination of machine learning and classical heat transfer analysis sets the stage for creating more precise and efficient predictive models in future work.

4.1. Evaluation of the Prediction Performance

In this study, the predictive performance of multiple machine learning models was evaluated using the Root Mean Square Error (RMSE) as the primary comparison metric. RMSE measures the square root of the average squared differences between predicted and actual values, offering a clear representation of prediction accuracy. Due to its sensitivity to large errors and its alignment with physical units, RMSE is particularly suitable for evaluating regression models in heat transfer analysis. All the analysis and machine learning model was performed using Matlab 2024b software [33].
The results reveal that among the 28 evaluated models, the bagged trees training model achieved the best performance, with an RMSE of 1.9695, followed closely by the Gaussian Process Regression and Wide Neural Newtwork, both yielding RMSE values under 3. In contrast, traditional linear regressors and certain tree-based models showed significantly higher RMSE values, often exceeding 4, indicating larger deviations between predicted and experimental values. A general resume of the trained models is presented in Table 2.
Given the importance of accurately capturing complex nonlinear behavior in boiling heat transfer, RMSE is considered the most reliable and representative metric for comparing model performance in this study. Lower RMSE values correspond to higher prediction fidelity, making it the central criterion for model selection and evaluation throughout the analysis.
Conversely, several linear models like Interactions Linear and Efficient Linear Least Squares show poor predictive performance, with R2 values close to zero or even negative. This indicates that these models fail to capture the non-linear relationships in the dataset. For example, the Interactions Linear model reports a high RMSE (6.9622) and a negative R2 (–0.0838), suggesting it performs worse than a simple mean-based predictor. High MAPE values (over 100%) further support the conclusion that these linear methods are not suitable for this problem, likely due to the complexity and non-linearity inherent in the data.
Neural network models show mixed performance. The Narrow Neural Network performs reasonably well (R2 = 0.6855), while the Trilayered Neural Network offers one of the highest R2 values (0.7364) but a slightly higher RMSE (3.1019) compared to tree-based models. Interestingly, the Medium Neural Network and Bilayered Neural Network balance performance metrics effectively, with RMSE values close to 3, nevertheless, a MAPE of more than 80% is presented. These results suggest that tree-based models and certain kernel or neural network architectures are better suited for capturing the complex patterns in the data, offering a significant improvement over traditional linear models, but need to be improved in comparisson with Bagged trees model.

4.2. Bagged Trees Model Result Analysis

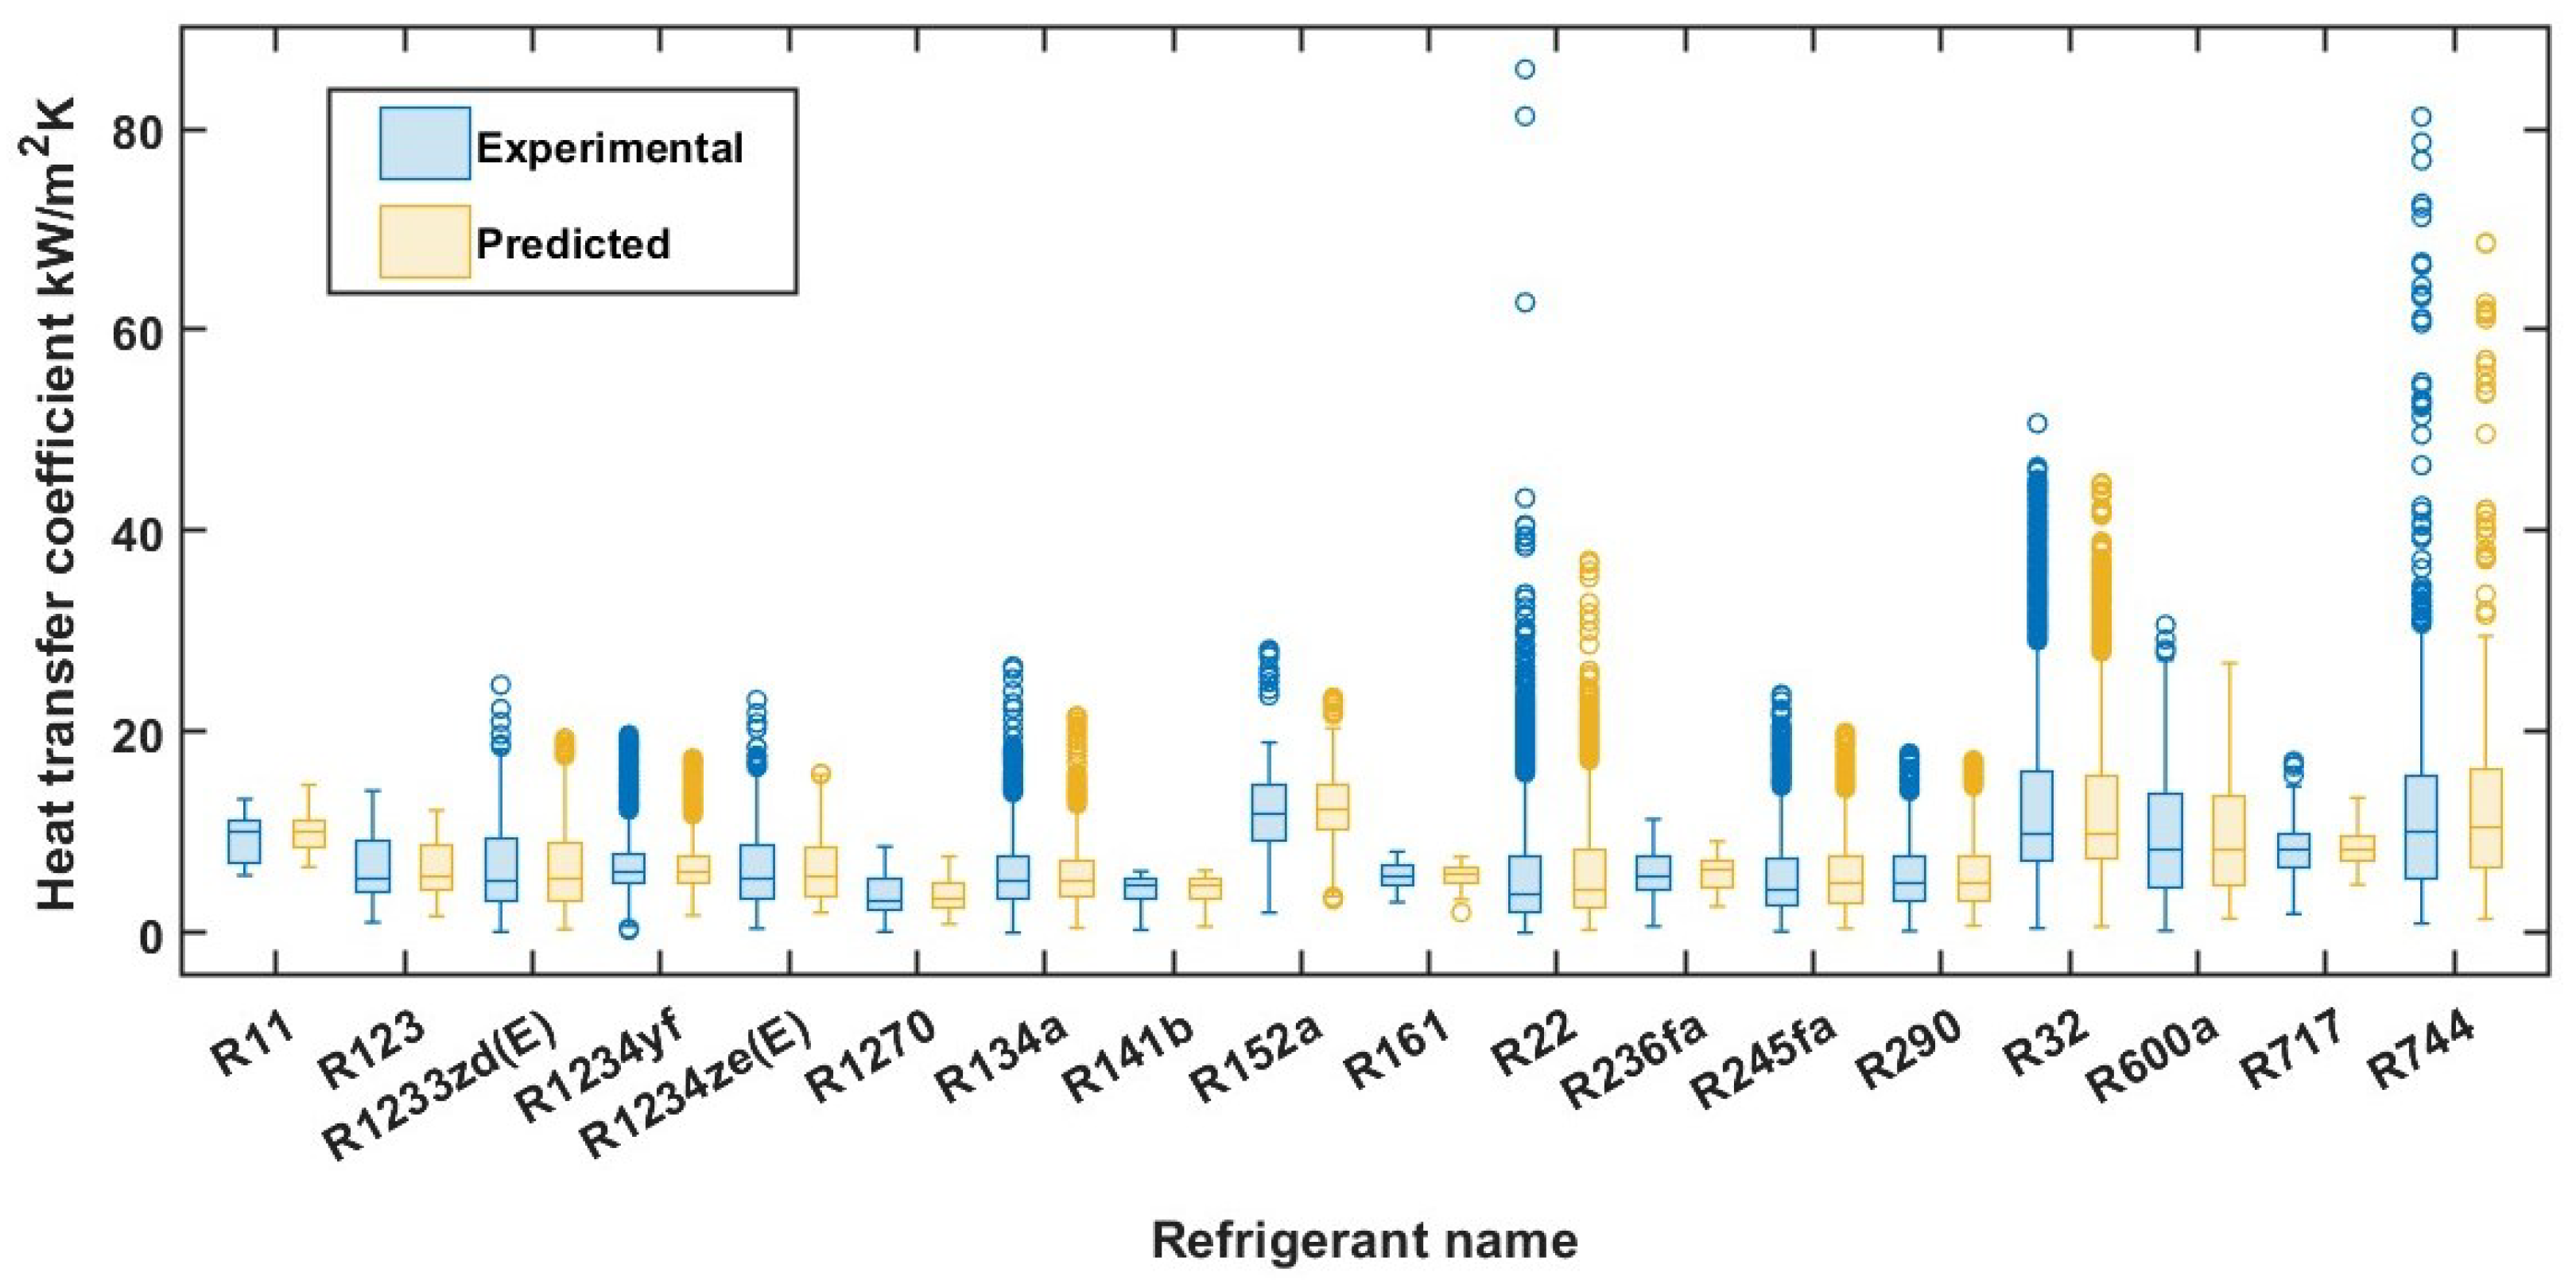
Figure 3 illustrates a comparative analysis of experimental versus predicted heat transfer coefficient (HTC) across a diverse range of refrigerants. The x-axis enumerates various refrigerant names, while the y-axis quantifies the heat transfer coefficient in kW/m2K. For each refrigerant, two distinct box plots are presented: one representing the Experimental and Predicted heat transfer coefficient values represented by the blue and yellow dots, respectively. The model demonstrates excellent predictive performance across the majority of refrigerants included in the dataset. In particular, R11 serves as a clear example of the model’s accuracy: the boxplot representing the predicted HTC values shows remarkable alignment with the experimental boxplot, including nearly identical medians and interquartile ranges. This close correspondence indicates that the model not only captures the central tendency of the heat transfer coefficient data but also reliably reflects the spread and variability observed in experimental measurements, with minimal deviation or systematic bias.
Similarly, strong agreement between predicted and experimental data is observed for a wide range of refrigerants, including R1233zd(E), R1234yf, R1234ze(E), R1270, R134a, R141b, R152a, R161, R236fa, R245fa, R290, and R32. For these fluids, the predicted values consistently track the experimental trends, with minimal underestimation or overestimation across the interquartile range and relatively low occurrence of outliers. This robust performance across both traditional and low-GWP refrigerants highlights the model’s generalization capability, suggesting that it has effectively learned the underlying relationships between thermophysical parameters and flow boiling HTC. Underprediction is also evident in the case of R22, where the predicted heat transfer coefficient (HTC) values are consistently lower than the experimentally measured ones. The model fails to capture the upper extremes and outliers in the experimental dataset, particularly at higher HTC values. This suggests that the model may lack sufficient representation of the complex thermal and phase-change behavior specific to R22 under certain operating conditions. Such discrepancies indicate areas where the training data may be sparse or where the refrigerant exhibits boiling characteristics that are not well captured by the current feature set or model structure.
A similar underprediction trend is observed for R744, although the magnitude and frequency of the discrepancies are comparatively limited. Importantly, this behavior is confined to a small subset of the data—fewer than 10 data points in each case—which represents a minor portion of the overall dataset. Despite the limited occurrence, these results emphasize the importance of ensuring balanced data distribution across refrigerants and operating conditions, particularly for fluids with unique thermophysical properties or transcritical behavior, such as R744. Future work may focus on targeted data augmentation or feature engineering strategies to improve model accuracy for these specific cases.
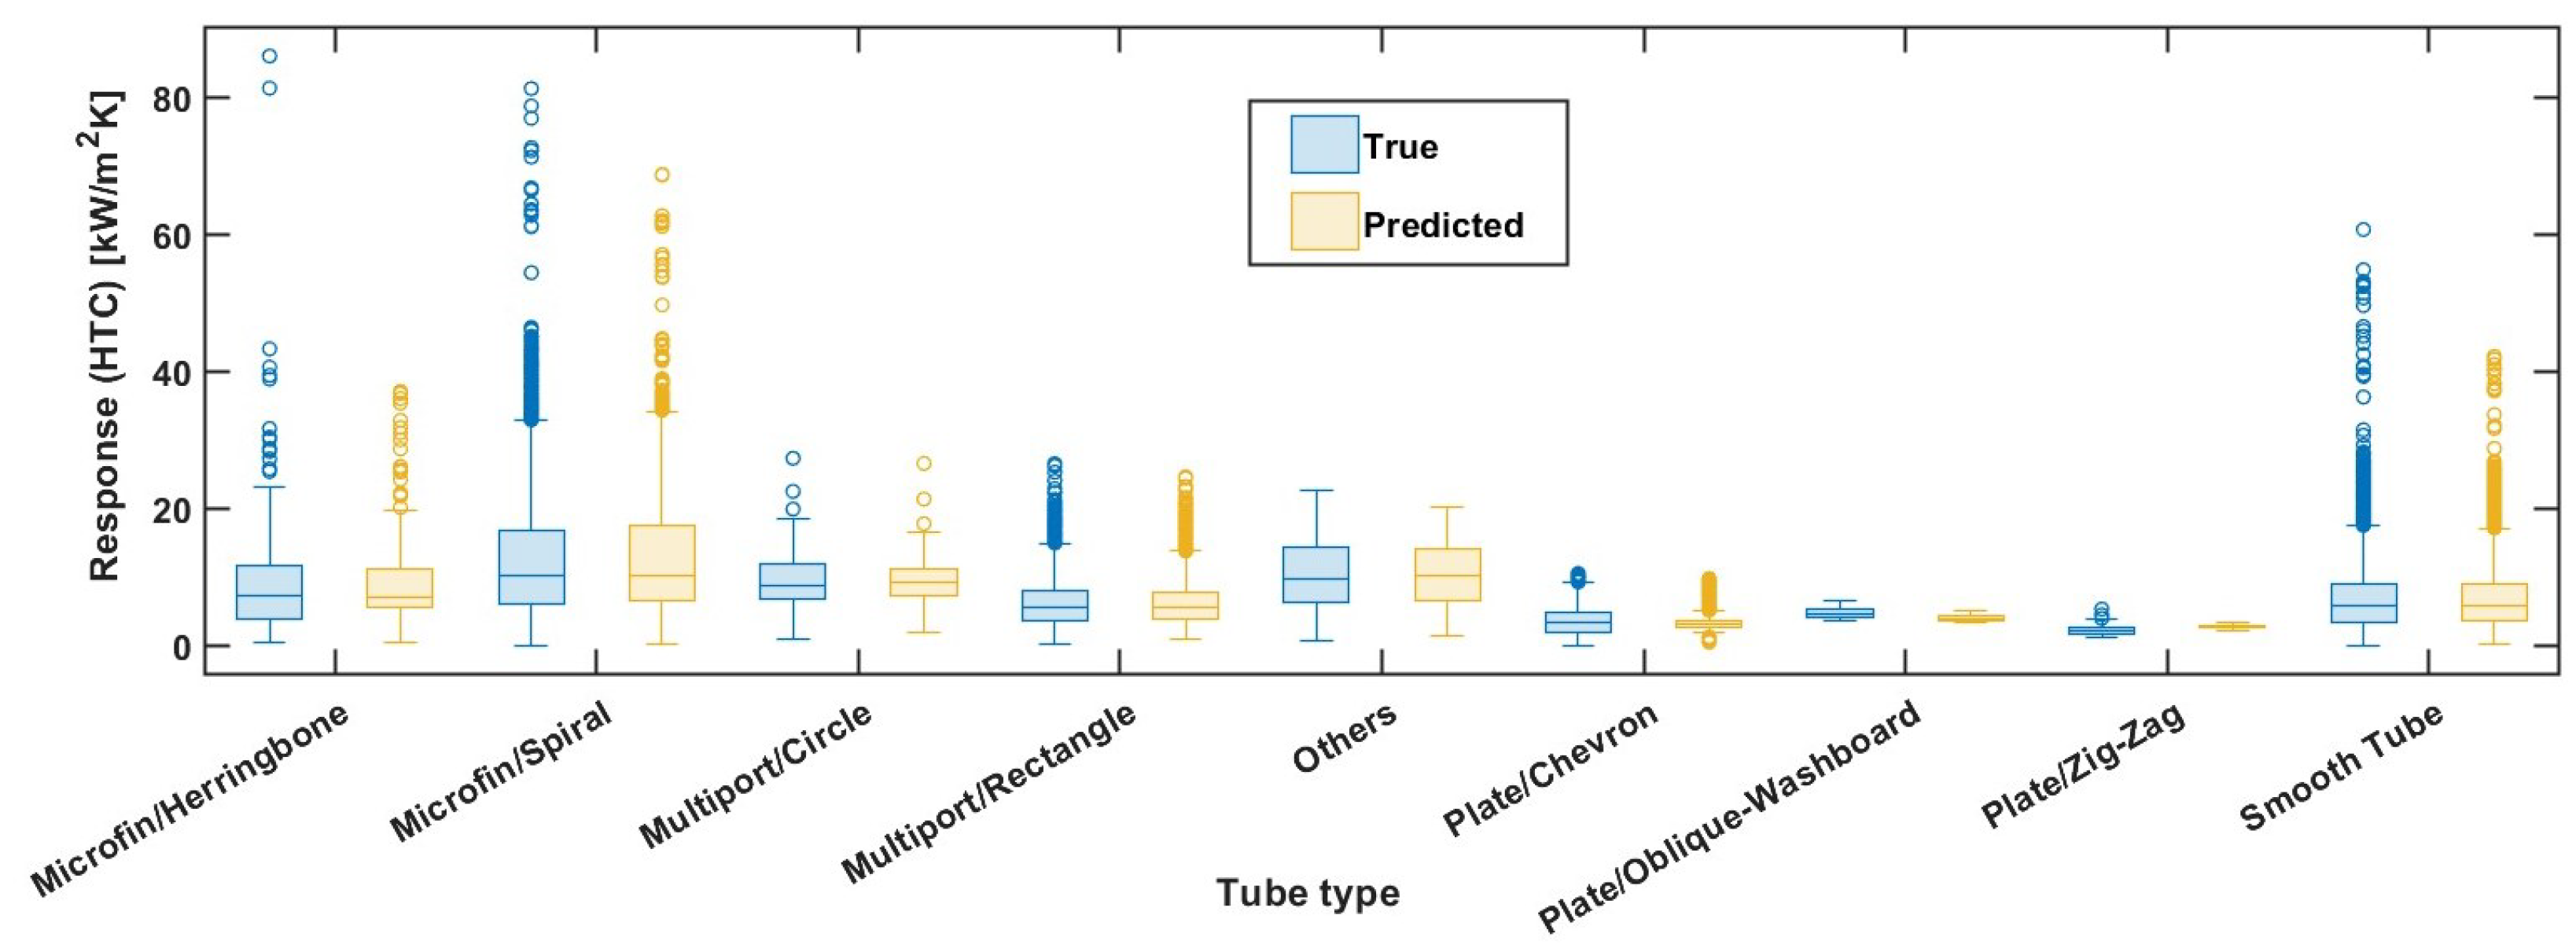
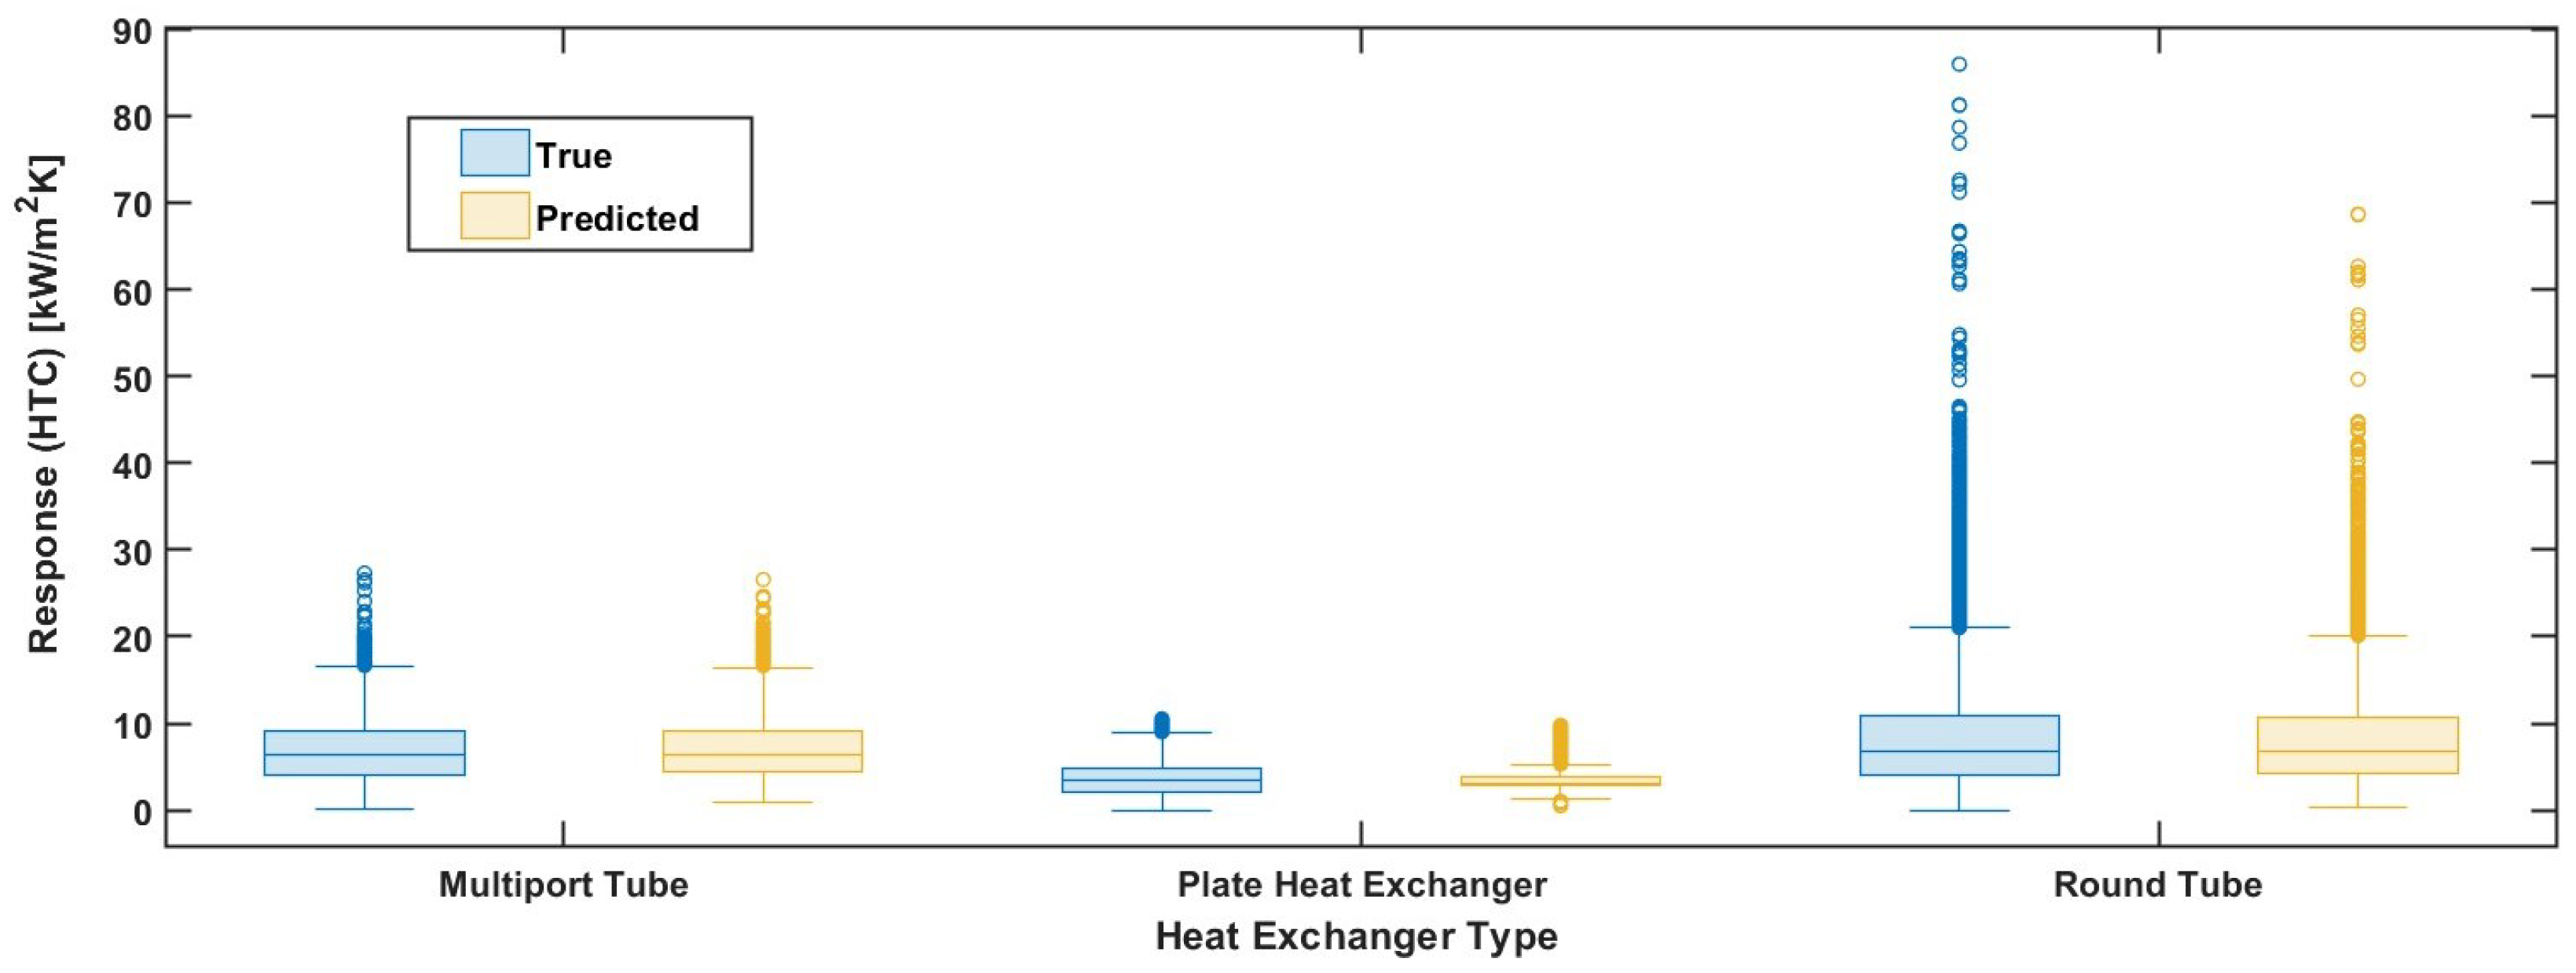
In order to compare the HTC prediction accuracy across tube types and heat exchanger configurations, Figure 4 and Figure 5 were analyzed. It is noticeable that, even for cases with a limited number of experimental data points—such as plate/zig-zag and plate/oblique configurations—the HTC predictions remain accurate, with no evidence of overprediction or negative values. This consistency demonstrates that the machine learning (ML) model is capable of producing reliable predictions even when the data availability is relatively small. On the other hand, for smooth tubes, where the dataset includes more than 10,000 experimental points, the model exhibits the same predictive behavior as shown as shown in Figure 4, further reinforcing its robustness across both data-rich and data-scarce categories. In Figure 5, the comparison between experimental and predicted HTC values is shown for different heat exchanger types. Round tubes, which account for more than 81% of the total dataset, exhibit a strong agreement between predicted and experimental results. Interestingly, the same predictive accuracy is also observed for plate heat exchangers, which contribute only about 4.9% of the dataset. This indicates that the model generalizes well across categories, regardless of the imbalance in data distribution.
Overall, the results confirm that for this ML model, the prediction of HTC shows consistent trends across all three categorical variables—tube type, heat exchanger type, and refrigerant—independent of the number of data points available. This demonstrates the strength of treating these parameters as categorical inputs, allowing the model to effectively capture underlying physical behaviors without being biased by dataset size.
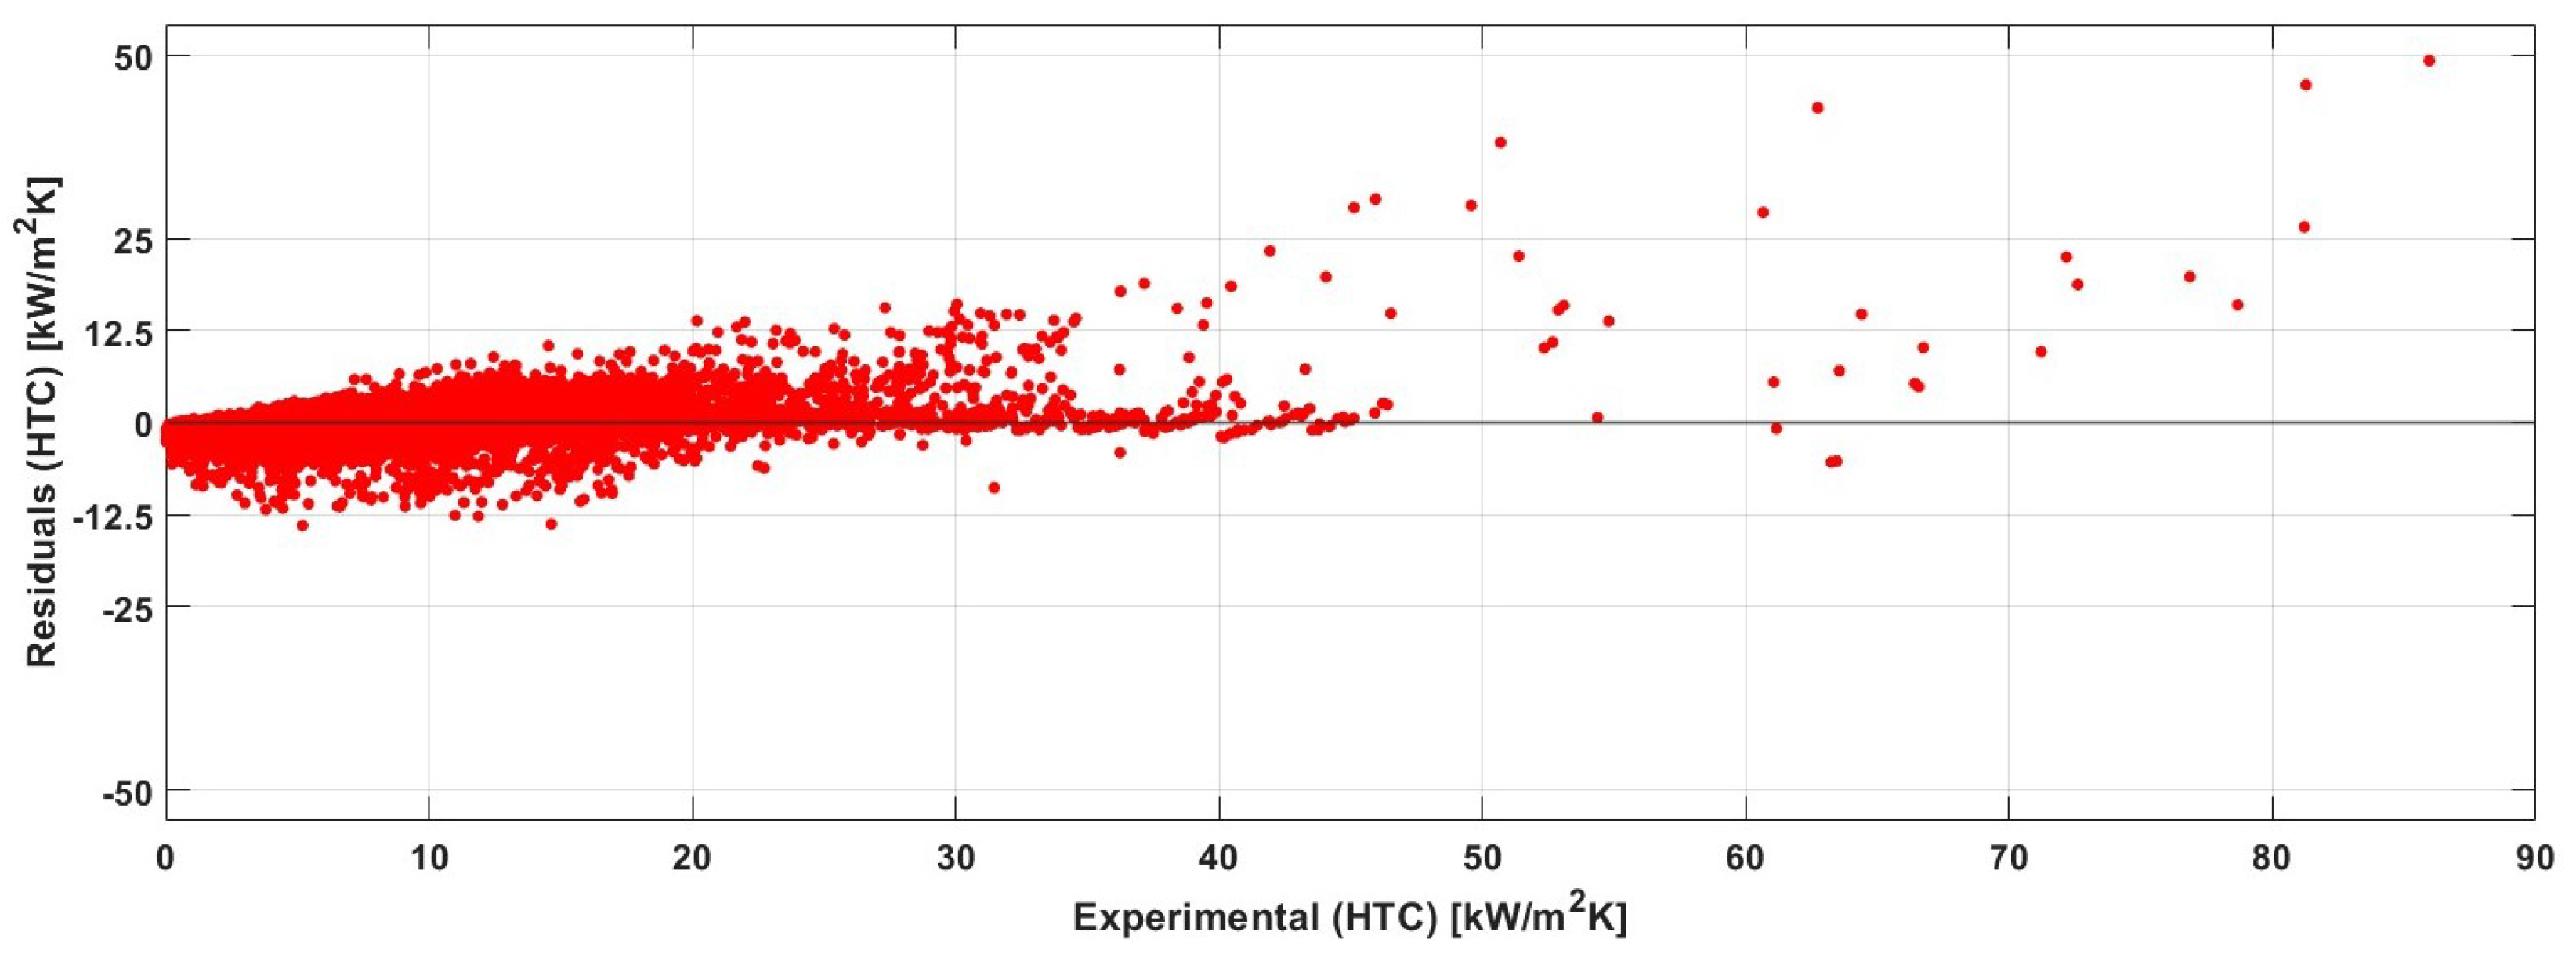
To provide a clearer understanding of the differences between the experimental and predicted heat transfer coefficient values, a residual analysis is presented in Figure 6. In this figure, the residuals of the predicted Heat Transfer Coefficient (HTC) are generally distributed within a narrow band around zero across the majority of the experimental data, which highlights the robustness of the proposed machine learning model. Nevertheless, it is observed that the residuals increase at higher experimental HTC values. This behavior is mainly associated with flow conditions close to the superheated regime, where data become sparse and less consistently reported in the literature. The limited availability of measurements under these conditions reduces the ability of the model to generalize accurately, leading to noticeable deviations.
A closer examination of the dataset indicates that the range of 50–90 kW/m2·K corresponds to only about 0.11% of the total data points included in the database. In other words, although residuals are higher in this regime, their relative contribution to the overall dataset is marginal. Consequently, the underprediction observed at high HTC values does not significantly impact the global accuracy of the model. Instead, the results reinforce that the proposed approach remains reliable for the vast majority of operating conditions encountered in practical heat transfer applications. Moreover, the incorporation of additional experimental data in this regime would help clarify whether the model can be further improved or if the reported discrepancies are simply a result of specific operating conditions where experimental HTC measurements remain limited.
This trend underscores the critical need to expand experimental research in high-HTC regions, particularly under superheated or extreme operating conditions. Enriching the database with more consistent and representative measurements in these regimes would enhance the training of data-driven models, improve predictive accuracy, and reduce residuals at the upper extremes. By capturing these challenging conditions, the machine learning approach can be further refined, increasing confidence in its applicability across the full spectrum of practical heat transfer scenarios.
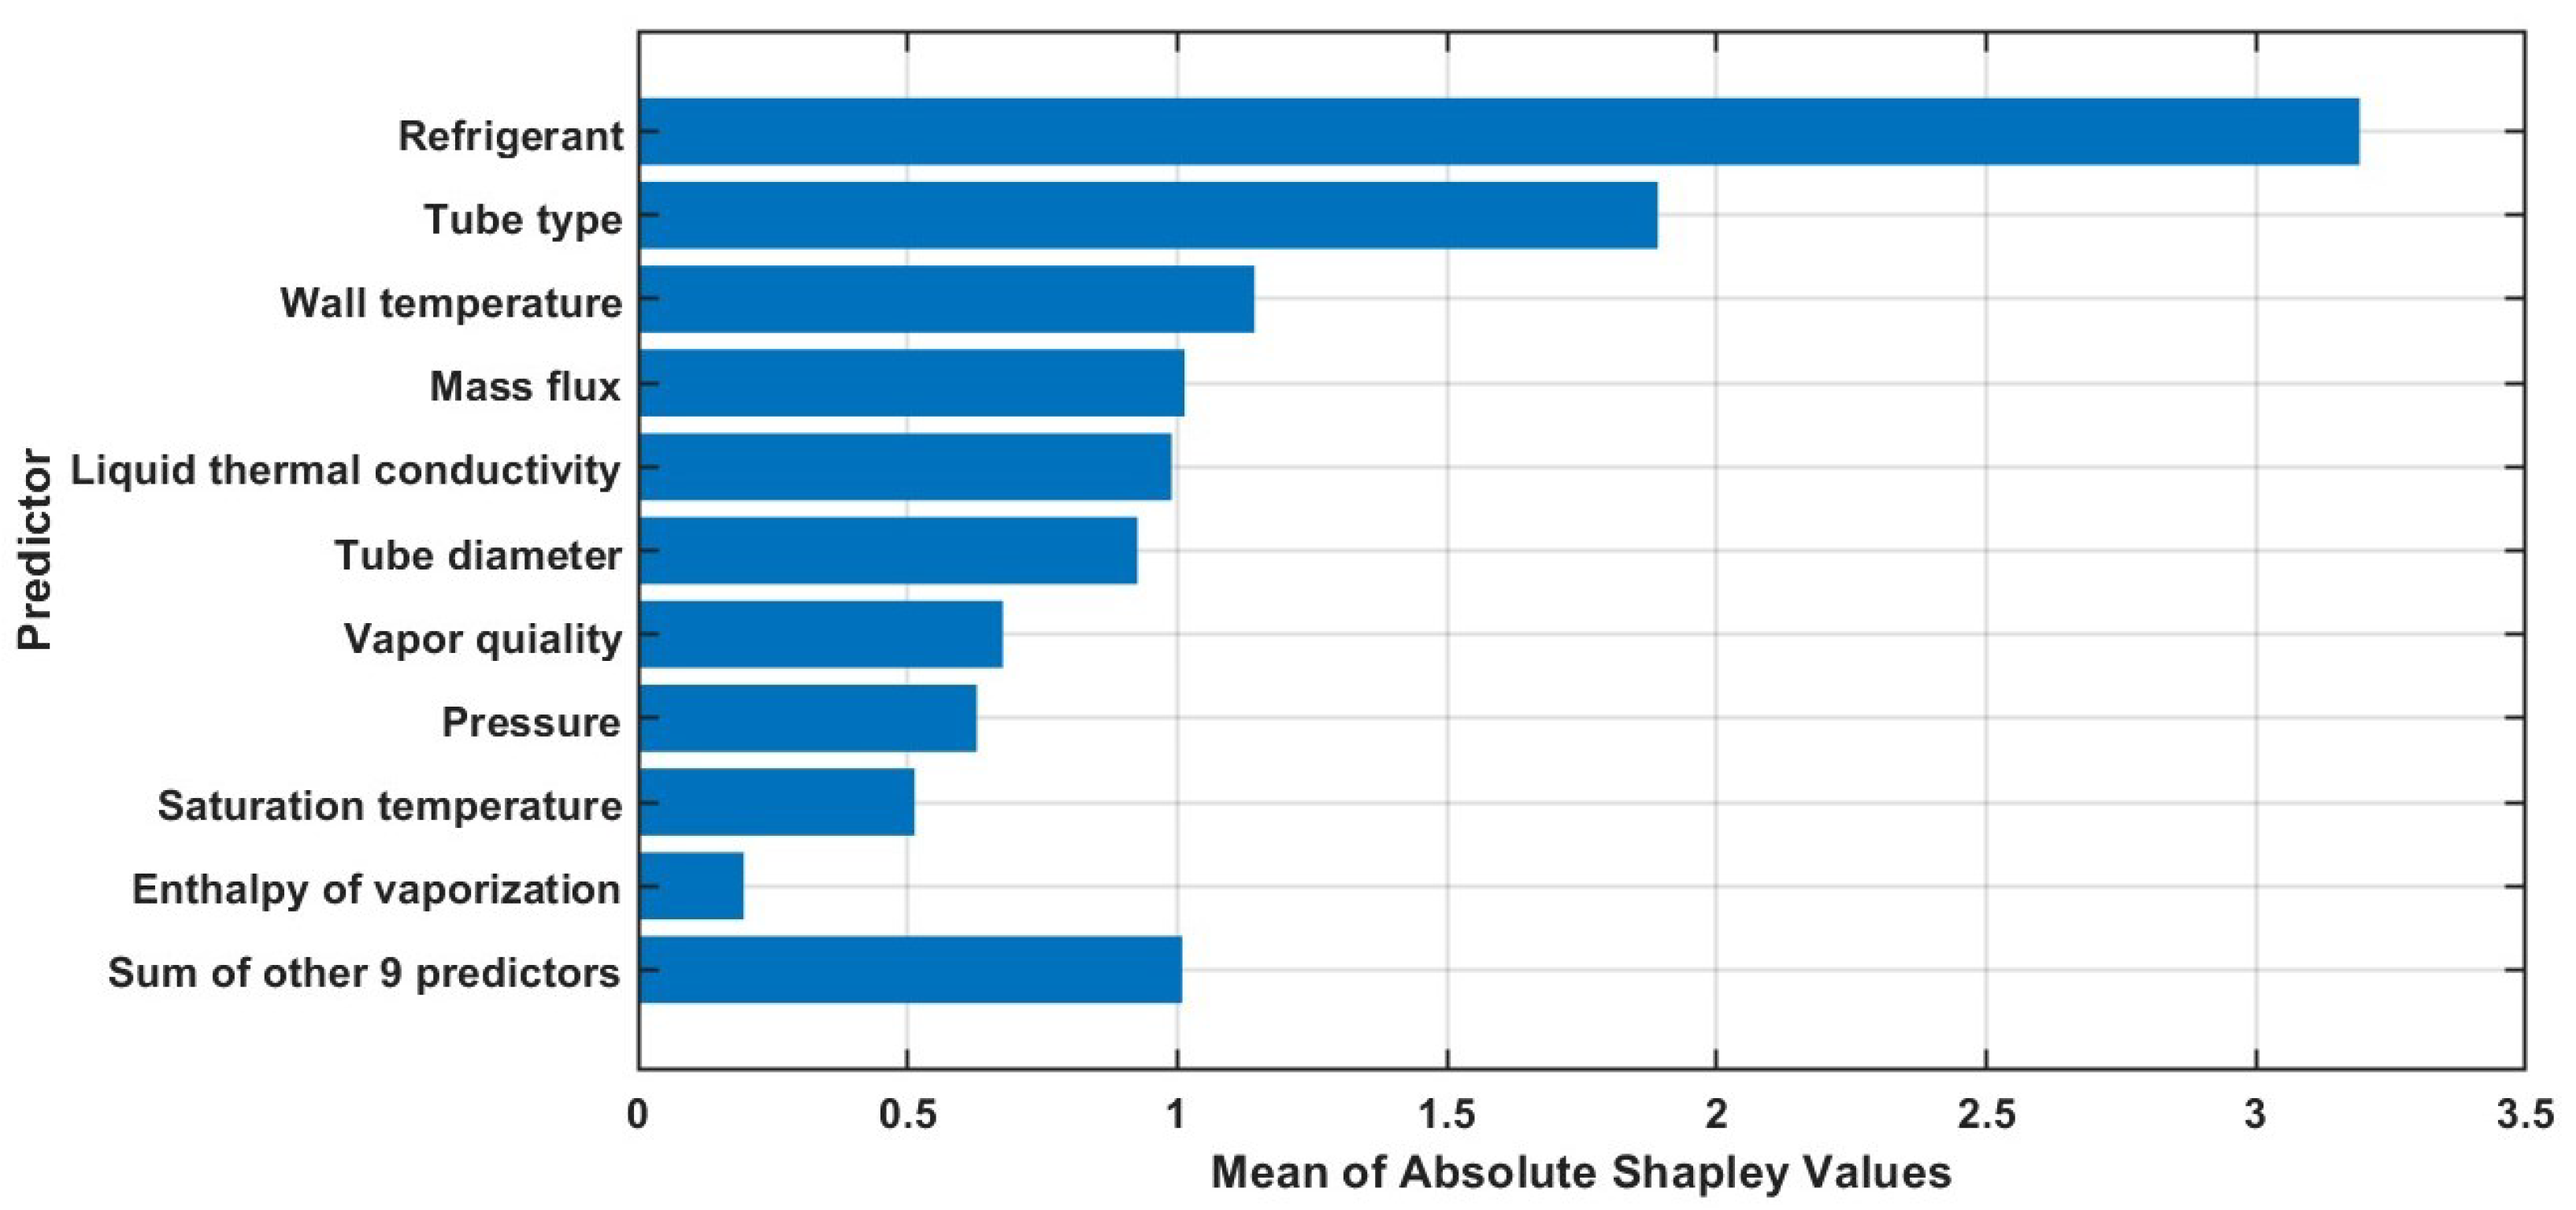
To evaluate the relative influence of each input parameter on the model’s predictions, Figure 7 presents the mean of the absolute SHAP (Shapley Additive Explanations) values for all predictors. On the x-axis, the “Mean of Absolute Shapley Values” quantifies the average contribution of each input variable to the model’s output, with larger values indicating greater predictive influence. The y-axis lists the corresponding predictor variables.
The results of the SHAP analysis reveal a distinct hierarchy in feature importance. At the top, refrigerant type stands out as the most dominant predictor, with a mean absolute SHAP value of approximately 3.2, highlighting its critical role in determining the heat transfer coefficient (HTC). This is expected, as different refrigerants possess unique thermophysical properties that strongly influence phase-change heat transfer behavior. Following refrigerant, tube type emerges as the second most influential factor, with a SHAP value close to 1.9. This reflects the significant effect of heat exchanger geometry—particularly enhancements like micro-fin tubes or multiport channels—on boiling performance. Wall temperature and mass flux rank next in importance, both contributing meaningfully to the model’s predictive power. Wall temperature shows slightly higher influence, consistent with its direct relationship to heat flux and phase-change rate. Liquid thermal conductivity and tube diameter show intermediate influence, each with SHAP values near 1.0, indicating that while not as dominant as refrigerant or geometry, these properties still play meaningful roles in determining HTC.
Lower down the importance scale are vapor quality, pressure, and saturation temperature, with vapor quality being the most significant among them. These parameters, although physically relevant, may contribute less to variability in the dataset or may be partially accounted for by more dominant features.
The enthalpy of vaporization is identified as the least influential individual variable, exhibiting a minimal SHAP value, suggesting that its variation across the refrigerants used may be too narrow to substantially affect model output.
Interestingly, the combined effect of the “Sum of other 9 predictors” yields an influence comparable to that of liquid thermal conductivity and tube diameter. This indicates that although some predictors contribute marginally on their own, their aggregated effect is non-negligible and reinforces the importance of a comprehensive feature set.

4.3. Partial Dependence Plot for the Bagged Trees Model

In this subsection, the partial dependence of the input features with the highest Shapley values is analyzed and discussed, as illustrated in Figure 7. These features were identified as the most influential variables in determining the predicted Heat Transfer Coefficient (HTC) using the Shapley Additive Explanations (SHAP) framework. The use of partial dependence plots (PDPs) allows us to evaluate the marginal effect of each selected variable on the model’s output while averaging out the influence of all other parameters. This approach provides a clearer understanding of how individual thermophysical or geometric properties contribute to the overall prediction of HTC. In addition, by linking the SHAP importance ranking with the PDP trends, it is possible to confirm whether the model’s learned relationships are physically meaningful and consistent with established heat transfer theory. Such analysis not only reinforces the interpretability of the machine learning model but also highlights the relative contribution of key input variables, thereby enhancing the credibility of the predictive framework.
The Partial Dependence Plot (PDP) in Figure 8 demonstrates the expected influence of tube geometry on the predicted Heat Transfer Coefficient (HTC), with modified tube types consistently outperforming smooth tubes. Enhanced geometries—such as microfin, spiral, or patterned plate designs—show higher predicted HTC values, reflecting their ability to promote turbulence, increase surface area, and improve liquid-vapor distribution during boiling. In contrast, smooth and basic rectangular multiport tubes exhibit lower HTC values, as anticipated due to their lack of internal surface enhancements.
These results are consistent with physical principles and experimental observations, confirming the model’s ability to accurately capture the thermal performance trends associated with different tube configurations. In summary, the analysis reinforces that enhanced tube geometries significantly improve boiling heat transfer and should be prioritized in the design of high-efficiency heat exchangers.
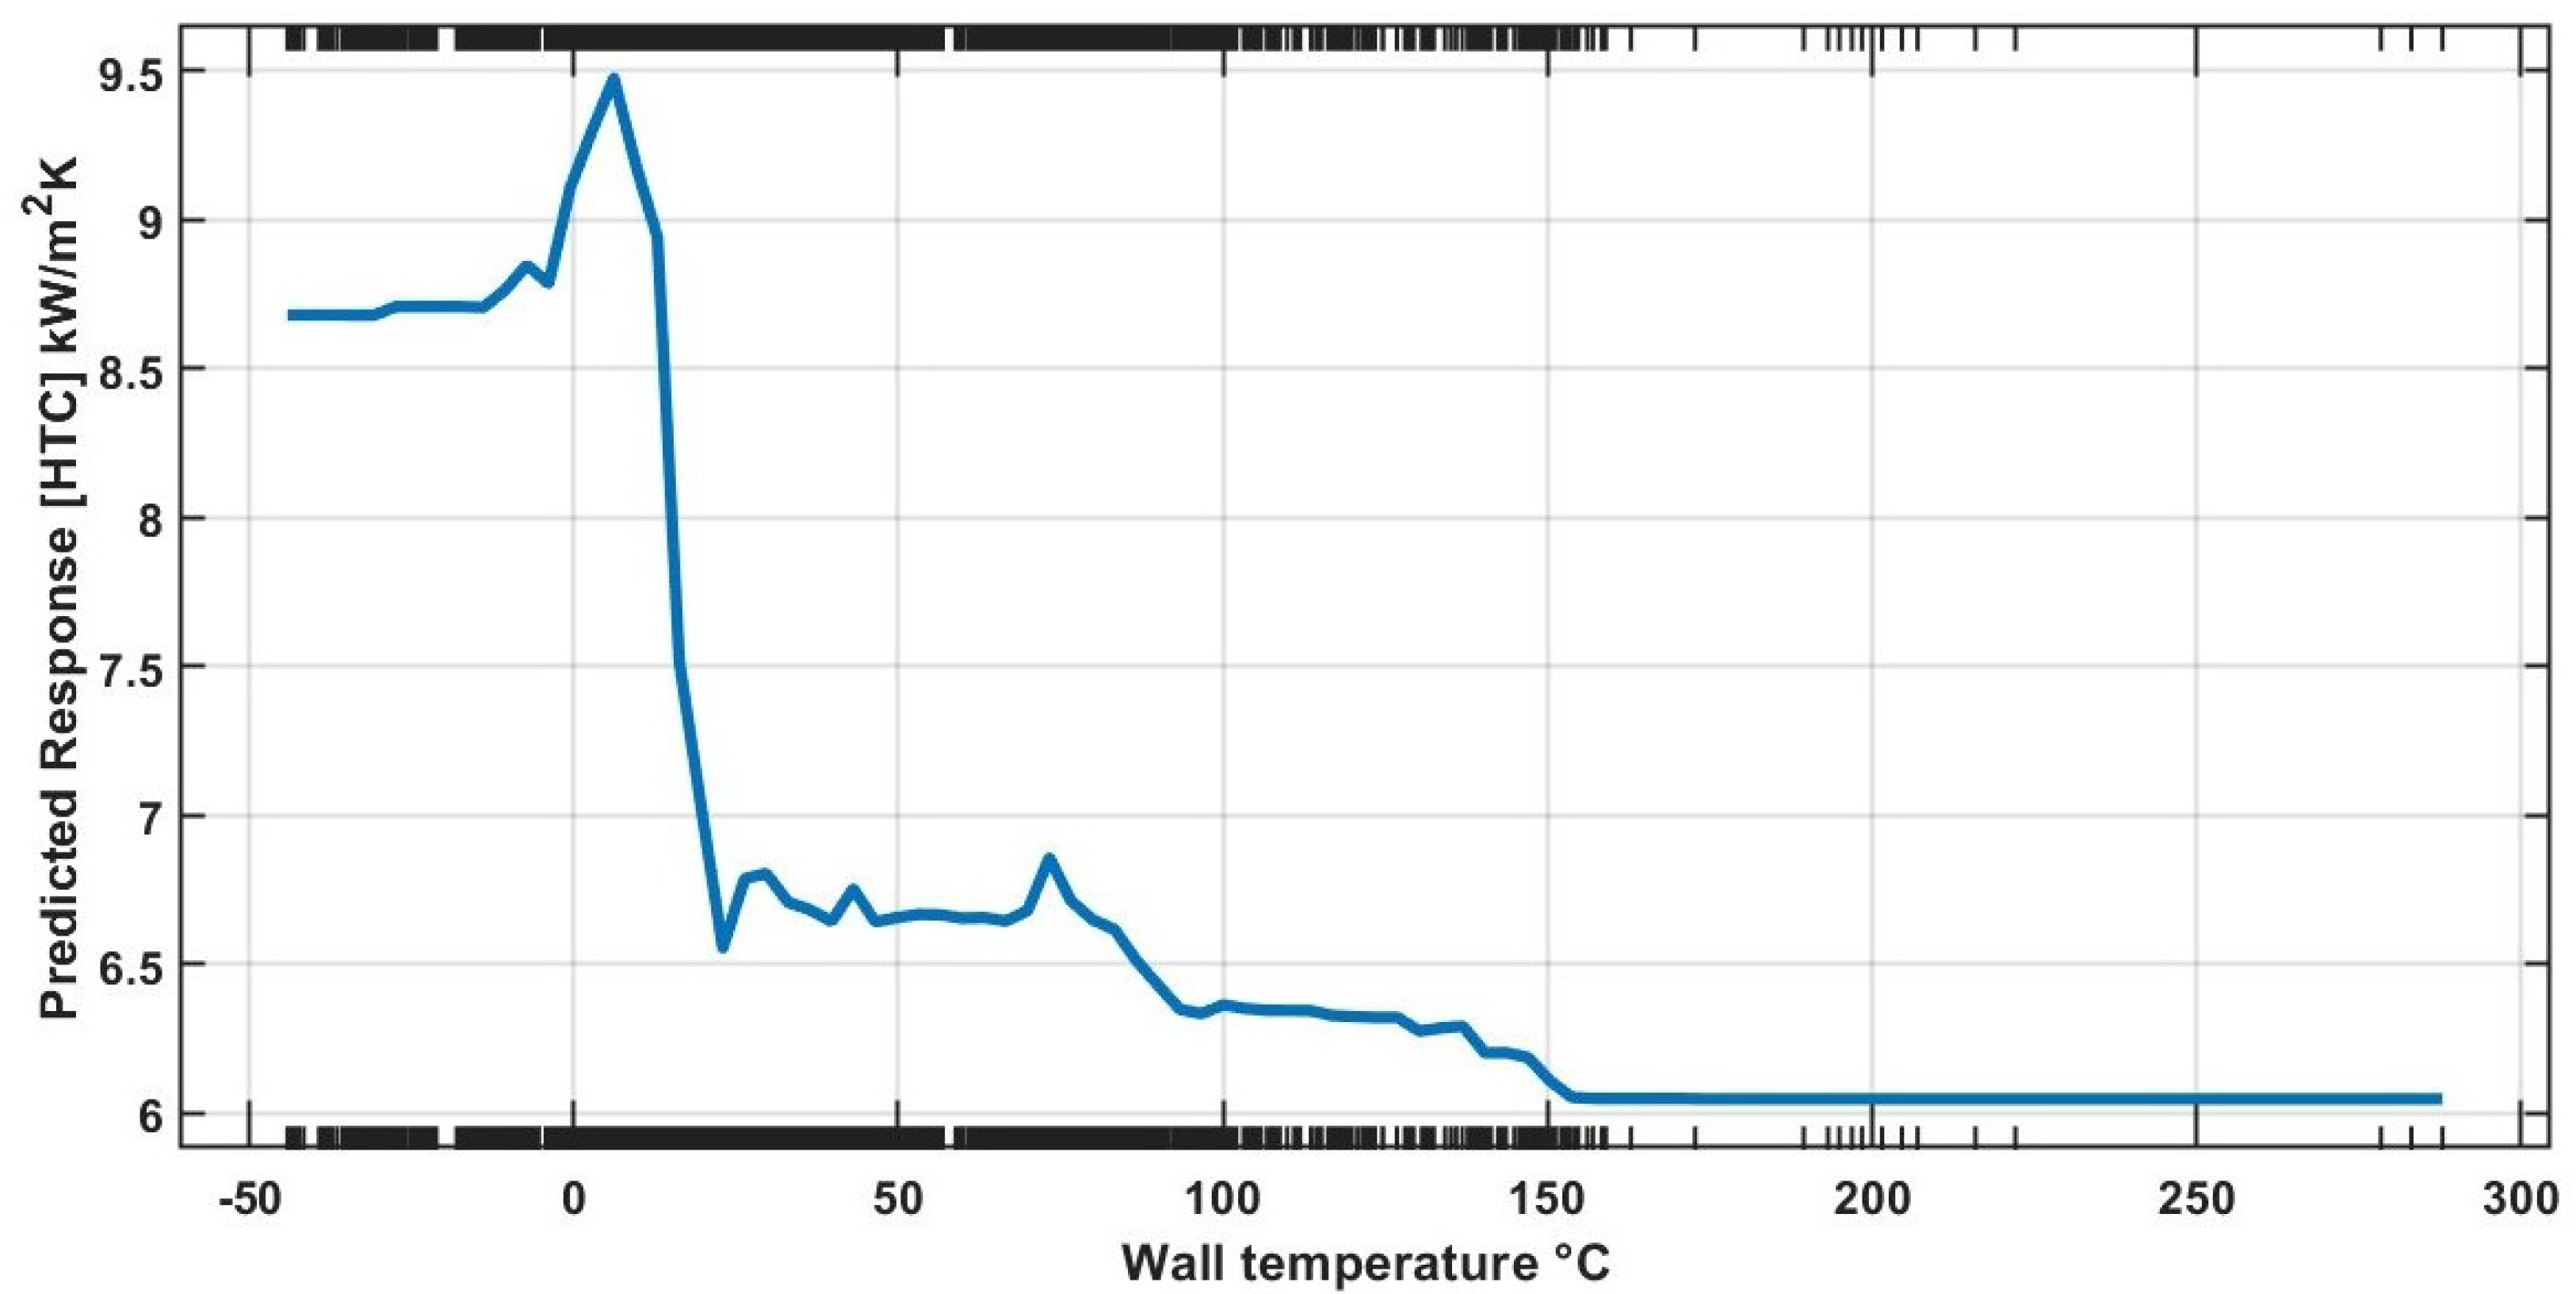
As shown in Figure 9, the effect of the wall temperature on the heat transfer coefficient (HTC) is significantly more pronounced at lower wall temperatures, especially as the wall temperature approaches 0 °C. In this low-temperature range, even small changes in wall temperature can lead to noticeable variations in HTC, indicating strong sensitivity in heat transfer performance. However, as the wall temperature increases beyond a certain threshold—approximately 150 °C—the HTC experiences a drastic decrease, dropping from values around 20 °C to much lower levels. Beyond this point, the influence of wall temperature becomes minimal, and additional increases in wall temperature no longer produce a meaningful change in HTC. This suggests a nonlinear relationship, where the wall temperature plays a dominant role at first but becomes almost irrelevant at high temperatures due to other limiting heat transfer mechanisms.
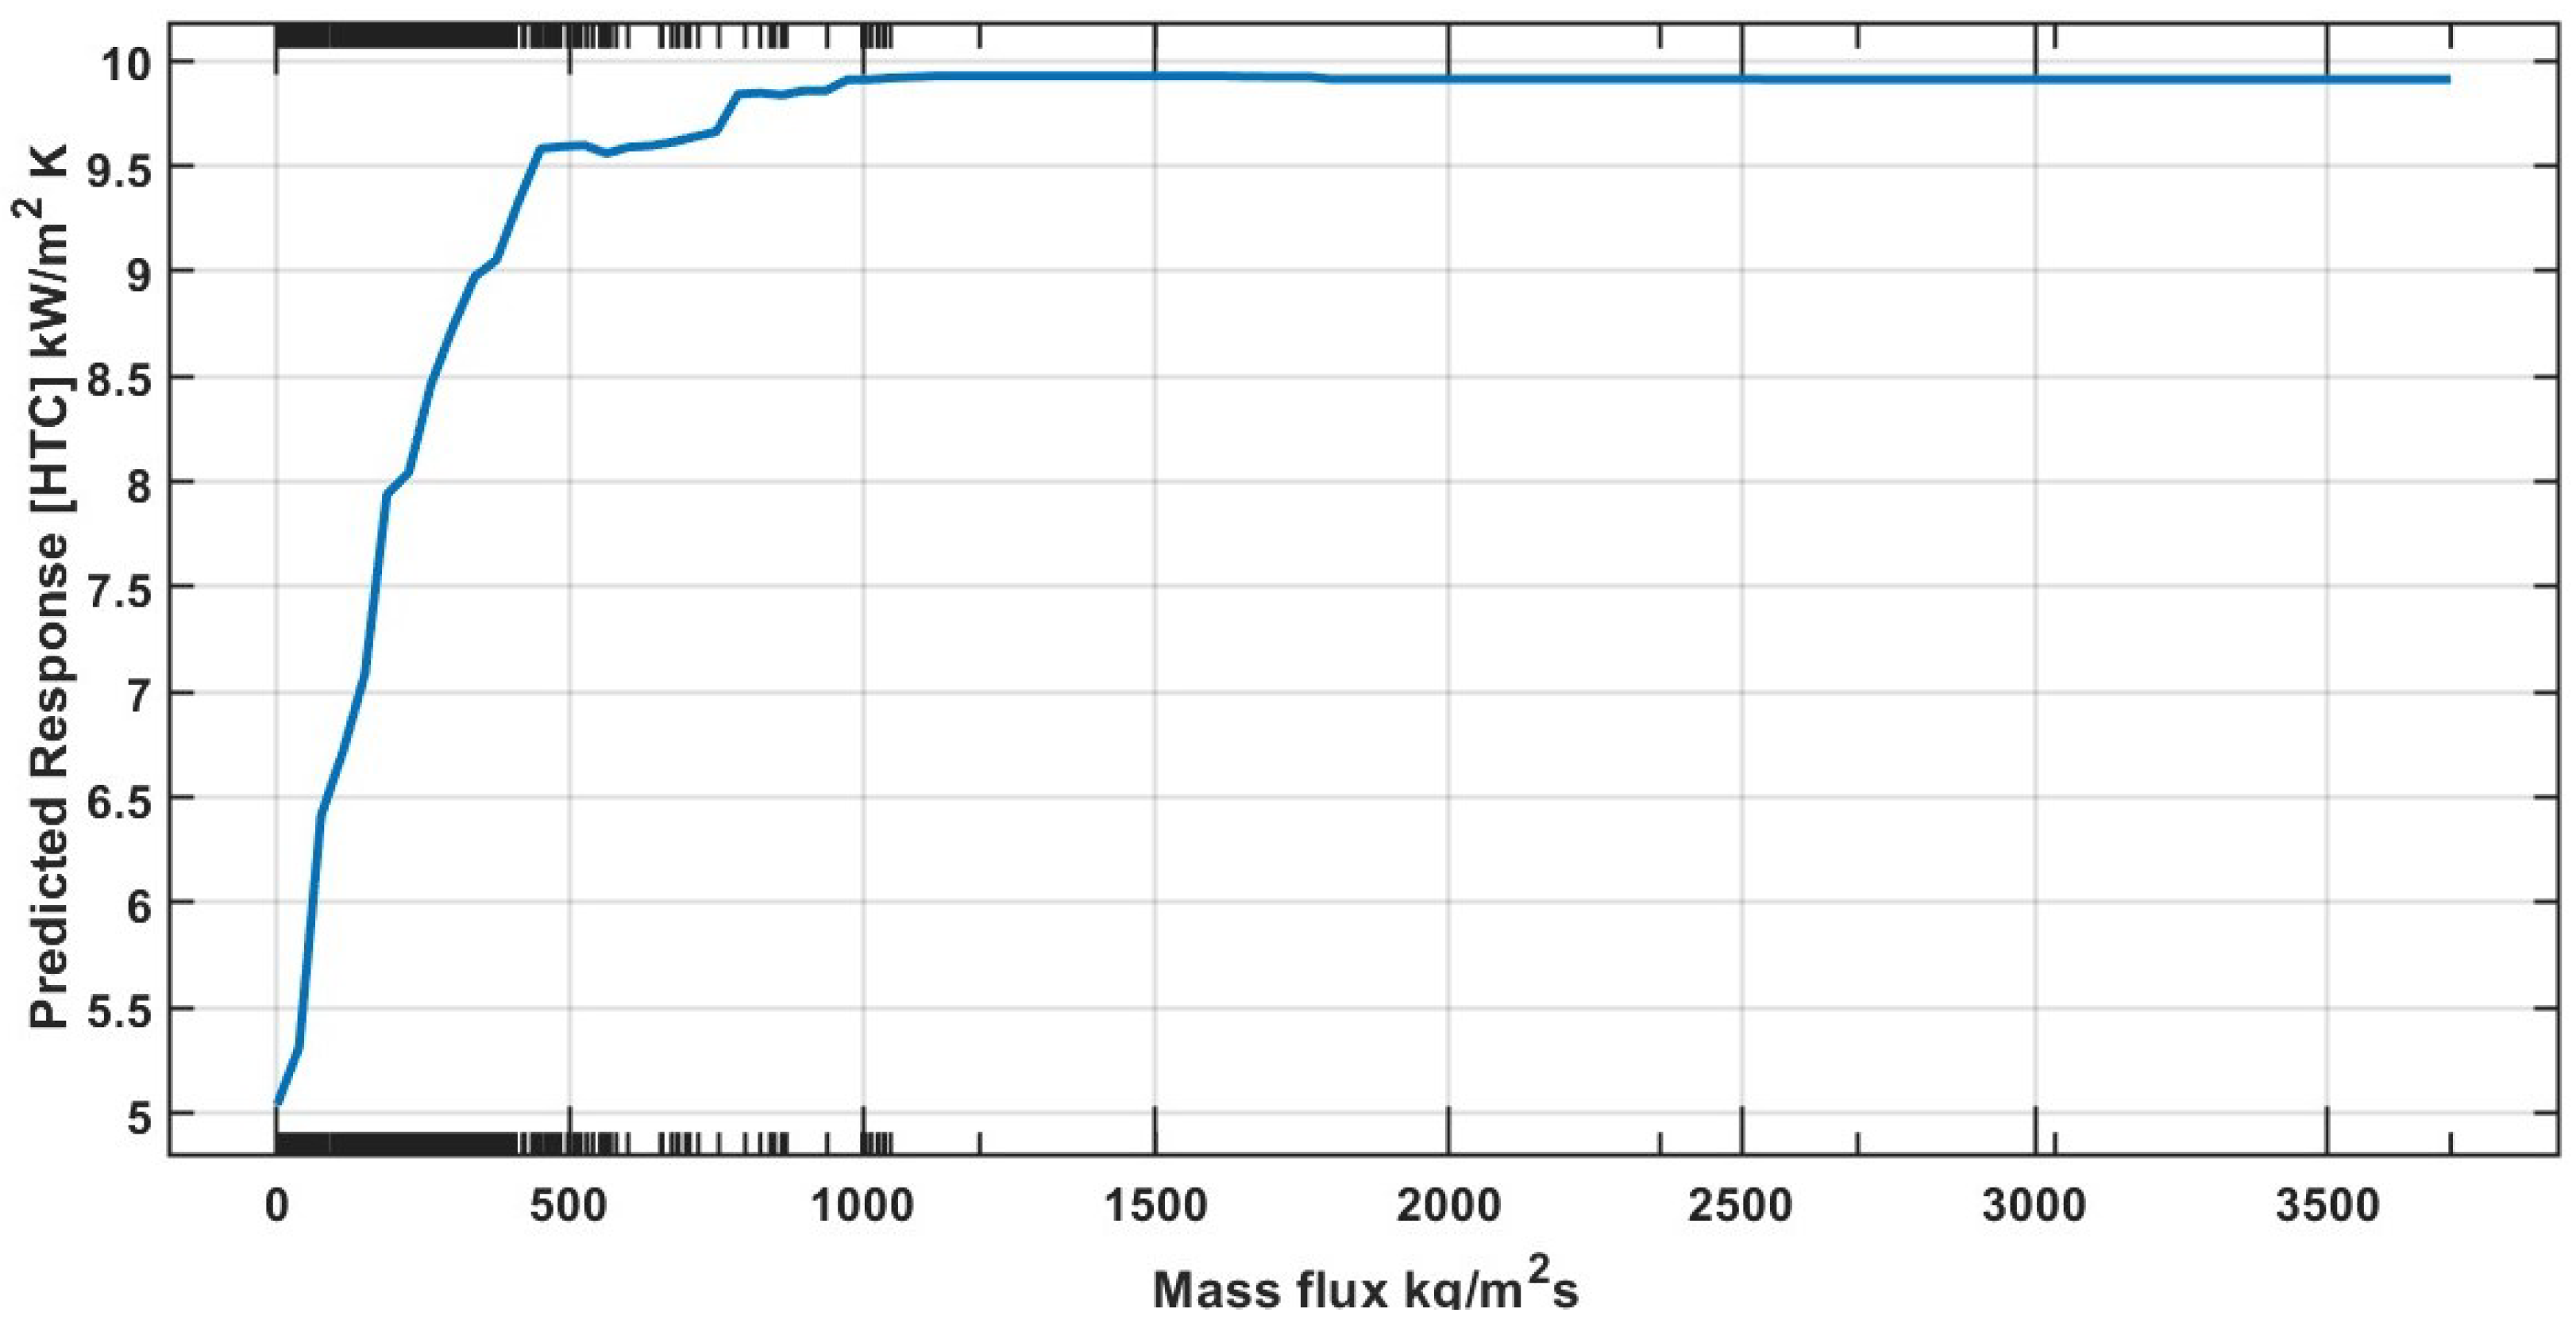
On the other hand, the effect of mass flux on the heat transfer coefficient (HTC) is illustrated in Figure 10. As expected, HTC increases with increasing mass flux, especially in the low to moderate range. This behavior aligns with the enhanced convective transport that comes with greater fluid motion. However, once the mass flux reaches approximately 900 kg/m2·s, the rate of HTC improvement begins to diminish, and the sensitivity to further increases becomes marginal. Beyond 1000 kg/m2·s, and up to the upper tested limit of 3500 kg/m2·s, the effect of mass flux on HTC is negligible, indicating a plateau in performance where other factors—such as thermal boundary layer limitations or saturation effects—become dominant.
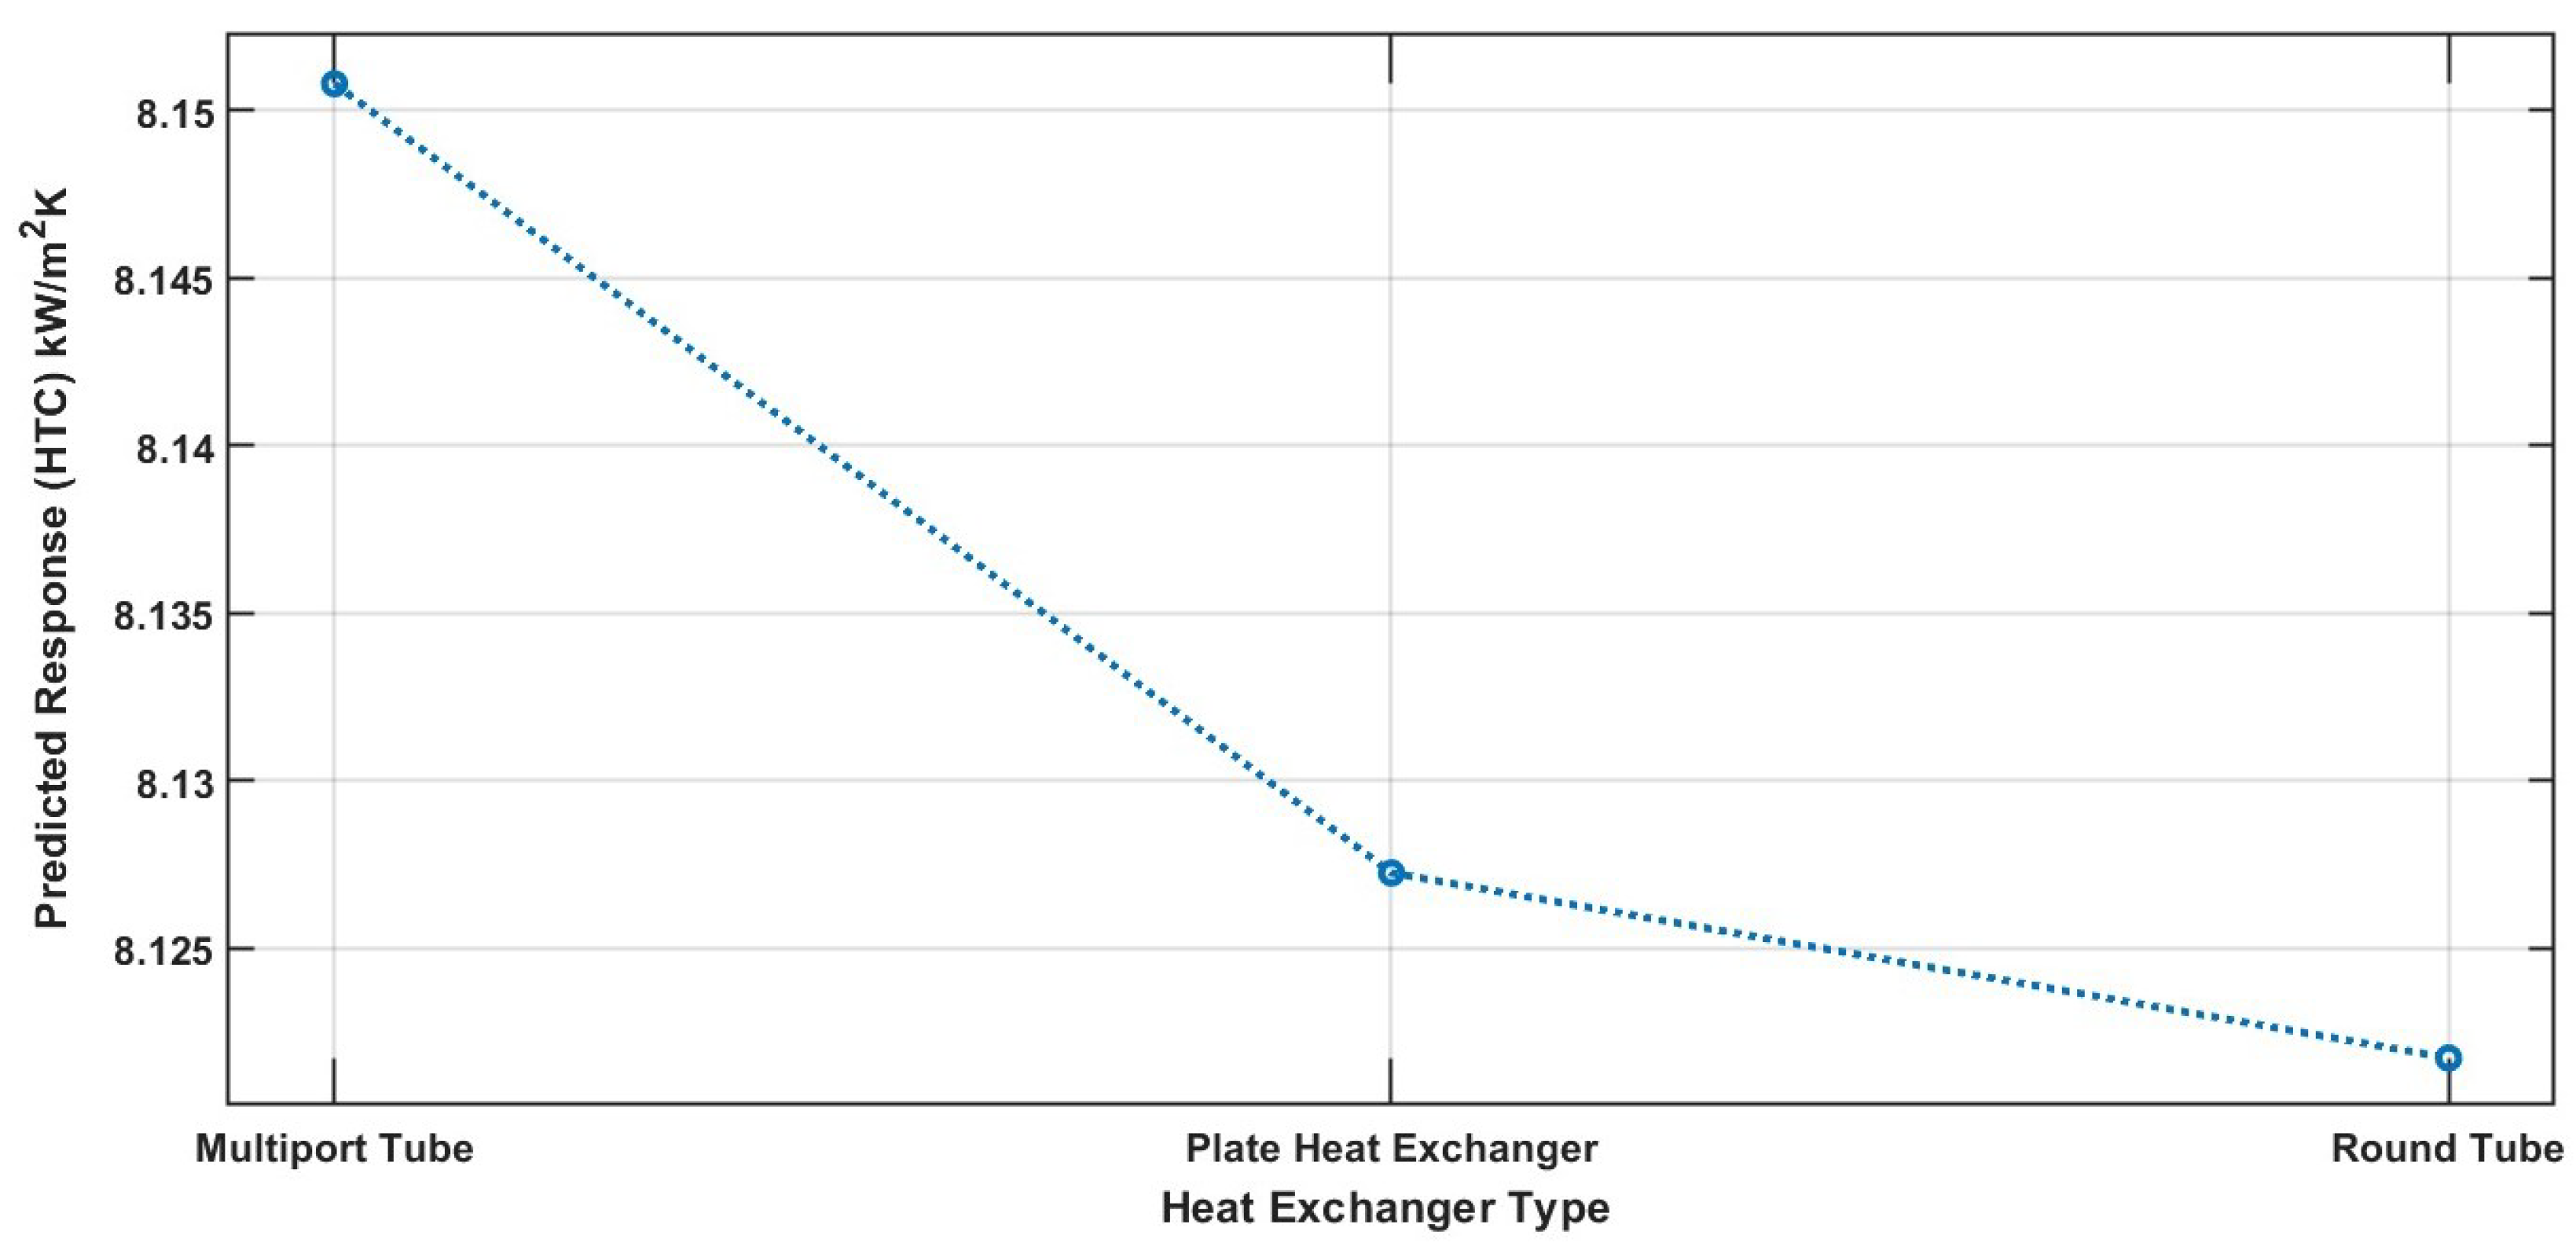
In addition, Figure 11 presents the partial dependence for the Heat Transfer Coefficient (HTC) across three widely used heat exchanger types: multiport tubes, plate heat exchangers, and round tubes. Although the predicted HTC values fall within a relatively narrow numerical range, the trend observed in the graph provides valuable insights into the thermal performance characteristics of each configuration. In general terms and as expected, multiport tube heat exchangers yield the highest predicted HTC.
This geometry is specifically engineered to enhance phase-change heat transfer by incorporating multiple small channels, which promote high surface-area-to-volume ratios, better liquid-vapor distribution, and increased turbulence—factors that collectively improve boiling performance. Plate heat exchangers rank second, with slightly lower predicted HTC values. These units typically consist of corrugated plates that form narrow flow passages, which can support efficient heat transfer through controlled turbulence and large surface area. However, depending on the refrigerant flow regime and phase distribution, plate geometries may not always maintain the same level of enhancement seen in multiport structures.
At the lower end of the performance spectrum are round tube heat exchangers, which exhibit the smallest predicted HTC values. Their simpler internal structure lacks the complex surface enhancements or flow manipulation features found in the other two geometries, resulting in reduced boiling efficiency and heat transfer rates. This outcome aligns with fundamental heat transfer theory and reinforces the model’s ability to capture realistic physical trends.
In summary, the PDP confirms that heat exchanger geometry plays a meaningful role in determining flow boiling heat transfer performance. Despite the modest absolute differences, the model clearly distinguishes between the thermal effectiveness of the different exchanger types. The superior performance of multiport tubes highlights their suitability for applications requiring compactness and high efficiency, while the lower predictions for round tubes emphasize the importance of structural enhancements when designing modern, high-performance thermal systems. This analysis further supports the value of geometry-specific modeling in optimizing the design and selection of heat exchangers for various refrigerants and operating conditions.

5. Conclusions

Based on the comprehensive analysis presented, this study confirms the effectiveness of machine learning models in accurately predicting the heat transfer coefficient (HTC) for saturated flow boiling across a wide range of refrigerants, tube geometries, and heat exchanger types. Utilizing a robust dataset compiled from over 140 experimental sources and incorporating key thermophysical properties, the model demonstrates strong predictive performance, with most residuals falling within ±5 kW/m2·K and a high coefficient of determination (R2 ≈ 0.90). Among the input variables, the type of refrigerant and tube geometry emerge as the most influential factors, as shown by SHAP analysis, underscoring their dominant role in boiling heat transfer behavior.
Partial Dependence Plots further demonstrate the model’s ability to capture realistic physical trends. Enhanced tube configurations, such as microfin or spiral geometries, consistently show higher predicted HTCs compared to smooth and rectangular multiport tubes. This finding aligns with experimental evidence confirming that internal surface enhancements promote superior heat transfer performance. Similarly, for heat exchanger types, multiport tubes exhibit the highest predicted HTC, followed by plate and round tubes, reflecting their structural capacity to facilitate efficient phase-change processes.
Overall, this research demonstrates that machine learning not only enhances the accuracy of HTC predictions but also provides interpretable insights into the influence of geometric and physical parameters. As expected, smooth surfaces exhibited lower HTC performance compared to modified configurations or surfaces, highlighting the significant role of surface enhancements in improving heat transfer behavior. The findings support the integration of data-driven tools in thermal system design, particularly in selecting optimal refrigerants and exchanger geometries. These insights can be leveraged to develop next-generation heat exchangers with improved performance, reliability, and energy efficiency.

Author Contributions

Conceptualization, E.S.G., A.H.-M. and A.M.; methodology, E.S.G. and A.H.-M.; software, E.S.G., A.H.-M.; validation, E.S.G.; investigation, E.S.G., A.H.-M.; data curation, E.S.G.; writing—original draft preparation, E.S.G.; project administration, A.M. All authors have read and agreed to the published version of the manuscript.

Funding

This research was funded by the New Energy and Industrial Technology Development Organization (NEDO) under the research project (Project ID: P23001).

Data Availability Statement

Data used in the present research is available online at https://www.recdb.org/ (accessed on 11 August 2025).

Acknowledgments

The authors would like to express their heartfelt appreciation to the New Energy and Industrial Technology Development Organization (NEDO) for its generous financial support of this research.

Conflicts of Interest

The authors declare no conflicts of interest.

References

  1. UNEP. Amendment to the Montreal Protocol on Substances That Deplete the Ozone Layer, Kigali, 15 October 2016. Available online: https://treaties.un.org/doc/Publication/CN/2016/CN.872.2016-Eng.pdf (accessed on 9 April 2025).
  2. Calm, J.M. The next generation of refrigerants-historical review, considerations, and outlook. Int. J. Refrig. 2008, 7, 1123–1133. [Google Scholar] [CrossRef]
  3. American Society of Heating, Refrigerating and Air-Conditioning Engineers (ASHRAE). ANSI/ASHRAE Standard 34, Designation and Safety Classification of Refrigerants. 2016. Available online: https://www.ashrae.org/file%20library/technical%20resources/standards%20and%20guidelines/standards%20addenda/34_2016_g_20180628.pdf (accessed on 20 January 2024).
  4. Ganesan, V.; Patel, R.; Hartwig, J.; Mudawar, I. Review of databases and correlations for saturated flow boiling heat transfer coefficient for cryogens in uniformly heated tubes, and development of new consolidated database and universal correlations. Int. J. Heat Mass Transf. 2021, 179, 121656. [Google Scholar] [CrossRef]
  5. Wan, J. The heat transfer coefficient predictions in engineering applications. J. Phys. Conf. Ser. 2021, 2108, 012022. [Google Scholar] [CrossRef]
  6. Bertsch, S.-S.; Groll, E.-A.; Garimella, S.-V. A composite heat transfer correlation for saturated flow boiling in small channels. Int. J. Heat Mass Transf. 2009, 52, 2110–2118. [Google Scholar] [CrossRef]
  7. Kim, S.-M.; Mudawar, I. Universal approach to predicting saturated flow boiling heat transfer in mini/micro-channels—Part II. Two-phase heat transfer coefficient. Int. J. Heat Mass Transf. 2013, 64, 1239–1256. [Google Scholar] [CrossRef]
  8. Fang, X.D.; Wu, Q.; Yuan, Y. A general correlation for saturated flow boiling heat transfer in channels of various sizes and flow directions. Int. J. Heat Mass Transf. 2016, 107, 972–981. [Google Scholar] [CrossRef]
  9. Zhu, G.; Wen, T.; Zhang, T.-D. Machine learning based approach for the prediction of flow boiling/condensation heat transfer performance in mini channels with serrated fins. Int. J. Heat Mass Transf. 2021, 166, 120783. [Google Scholar] [CrossRef]
  10. Reynoso-Jardón, E.; Tlatelpa-Becerro, A.; Rico-Martínez, R.; Calderón-Ramírez, M.; Urquiza, G. Artificial neural networks (ANN) to predict overall heat transfer coefficient and pressure drop on a simulated heat exchanger. Int. J. Appl. Eng. Res. 2019, 14, 3097–3103. [Google Scholar]
  11. Hughes, M.T.; Chen, S.M.; Garimella, S. Machine-learning-based heat transfer and pressure drop model for internal flow condensation of binary mixtures. Int. J. Heat Mass Transf. 2022, 194, 123109. [Google Scholar] [CrossRef]
  12. Rossos, S.; Agrafioti, P.; Sotiroudas, V.; Athanassiou, C.G.; Kaloudis, E. Predicting Heat Treatment Duration for Pest Control Using Machine Learning on a Large-Scale Dataset. Agronomy 2025, 15, 1254. [Google Scholar] [CrossRef]
  13. Qiu, Y.; Garg, D.; Zhou, L.; Kharangate, C.-R.; Kim, S.-M.; Mudawar, I. An artificial neural network model to predict mini/micro-channels saturated flow boiling heat transfer coefficient based on universal consolidated data. Int. J. Heat Mass Transf. 2020, 149, 119211. [Google Scholar] [CrossRef]
  14. Son, S.; Heo, J.Y.; Lee, J.I. Prediction of inner pinch for supercritical CO2 heat exchanger using artificial neural network and evaluation of its impact on cycle design. Energy Convers. Manag. 2018, 163, 66–73. [Google Scholar] [CrossRef]
  15. Sami, M.; Sierra, F. Using Machine Learning (ML) for Heat Transfer Coefficient (HTC) measurement in buildings: A systematic review. Build. Environ. 2025, 281, 113220. [Google Scholar] [CrossRef]
  16. Enoki, K.; Sei, Y.; Okawa, T.; Saito, K. Prediction for flow boiling heat transfer in small diameter tube using deep learning. Jpn. J. Multiph. Flow 2017, 31, 412–421. [Google Scholar] [CrossRef]
  17. Zhou, L.; Garg, D.; Qiu, Y.; Kim, S.M.; Mudawar, I.; Kharangate, C.R. Machine learning algorithms to predict flow condensation heat transfer coefficient in mini/micro-channel utilizing universal data. Int. J. Heat Mass Transf. 2020, 162, 120351. [Google Scholar] [CrossRef]
  18. Santiago-Galicia, E.; Hernandez-Matamoros, A.; Miyara, A. Prediction of heat transfer coefficient and pressure drop of flow boiling and condensation using machine learning. J. Phys. Conf. Ser. 2024, 2766, 012152. [Google Scholar] [CrossRef]
  19. Santiago-Galicia, E.; Hernandez-Matamoros, A.; Miyara, A. Machine Learning-Based Approach to Correct Saturated Flow Boiling Heat Transfer Correlations. Front. Artif. Intell. Appl. 2024, 389, 235–248. [Google Scholar]
  20. Kinjo, T.; Sei, Y.; Giannetti, N.; Saito, K.; Enoki, K. Prediction of Boiling Heat Transfer Coefficient for Micro-Fin Using Mini-Channel. Appl. Sci. 2024, 14, 6777. [Google Scholar]
  21. Scalabrin, G.; Condosta, M.; Marchi, P. Modeling flow boiling heat transfer of pure fluids through artificial neural networks. Int. J. Therm. Sci. 2006, 45, 643–663. [Google Scholar] [CrossRef]
  22. Bard, A.; Qiu, Y.; Kharangate, C.R.; French, R. Consolidated modeling and prediction of heat transfer coefficients for saturated flow boiling in mini/micro-channels using machine learning methods. Appl. Therm. Eng. 2022, 210, 118305. [Google Scholar] [CrossRef]
  23. Lin, L.; Gao, L.; Kedzierski, M.A.; Hwang, Y. A general model for flow boiling heat transfer in microfin tubes based on a new neural network architecture. Energy AI 2022, 8, 100151. [Google Scholar] [CrossRef]
  24. Christopher, M. Bishop: Pattern Recognition and Machine Learning, Chapter 4.3.4. Available online: https://www.microsoft.com/en-us/research/wp-content/uploads/2006/01/Bishop-Pattern-Recognition-and-Machine-Learning-2006.pdf (accessed on 16 January 2025).
  25. Srivastava, N.; Hinton, G.; Krizhevsky, A.; Sutskever, I.; Salakhutdinov, R. Dropout: A simple way to prevent neural networks from overfitting. J. Mach. Learn. Res. 2014, 15, 1929–1958. [Google Scholar]
  26. McCullagh, P.; Nelder, J. Generalized Linear Models, 2nd ed.; Chapman and Hall/CRC: Boca Raton, FL, USA, 1989; ISBN 0-412-31760-5. [Google Scholar]
  27. Montgomery, D.C.; Peck, E.A.; Vining, G.G. Introduction to Linear Regression Analysis; John Wiley & Sons: Hoboken, NJ, USA, 2021. [Google Scholar]
  28. Duan, K.B.; Sathiya, S.K. Which Is the Best Multiclass SVM Method? An Empirical Study. Mult. Classif. Syst. LNCS 2005, 3451, 278–285. [Google Scholar]
  29. Cortes, C.; Vapkin, V. Support-vector networks. Mach. Learn. 1995, 20, 273–297. [Google Scholar] [CrossRef]
  30. Kingma, D.P.; Ba, J. Adam: A method for stochastic optimization. arXiv 2014, arXiv:1412.6980. [Google Scholar]
  31. Refrigerant Evaporator and Condenser Database. Available online: https://www.recdb.org/ (accessed on 11 August 2025).
  32. Lemmon, E.W.; Bell Ian, H.; Huber, M.L.; McLinden, M.O. NIST Standard Reference Database 23: Reference Fluid Thermodynamic and Transport Properties-Refprop, Version 10.0; National Institute of Standards and Technology: Gaithersburg, MD, USA, 2018. [Google Scholar]
  33. The MathWorks Inc. MATLAB, Version: 24.1.0.2578822 (R2024a); The MathWorks Inc.: Natick, MA, USA, 2024. [Google Scholar]
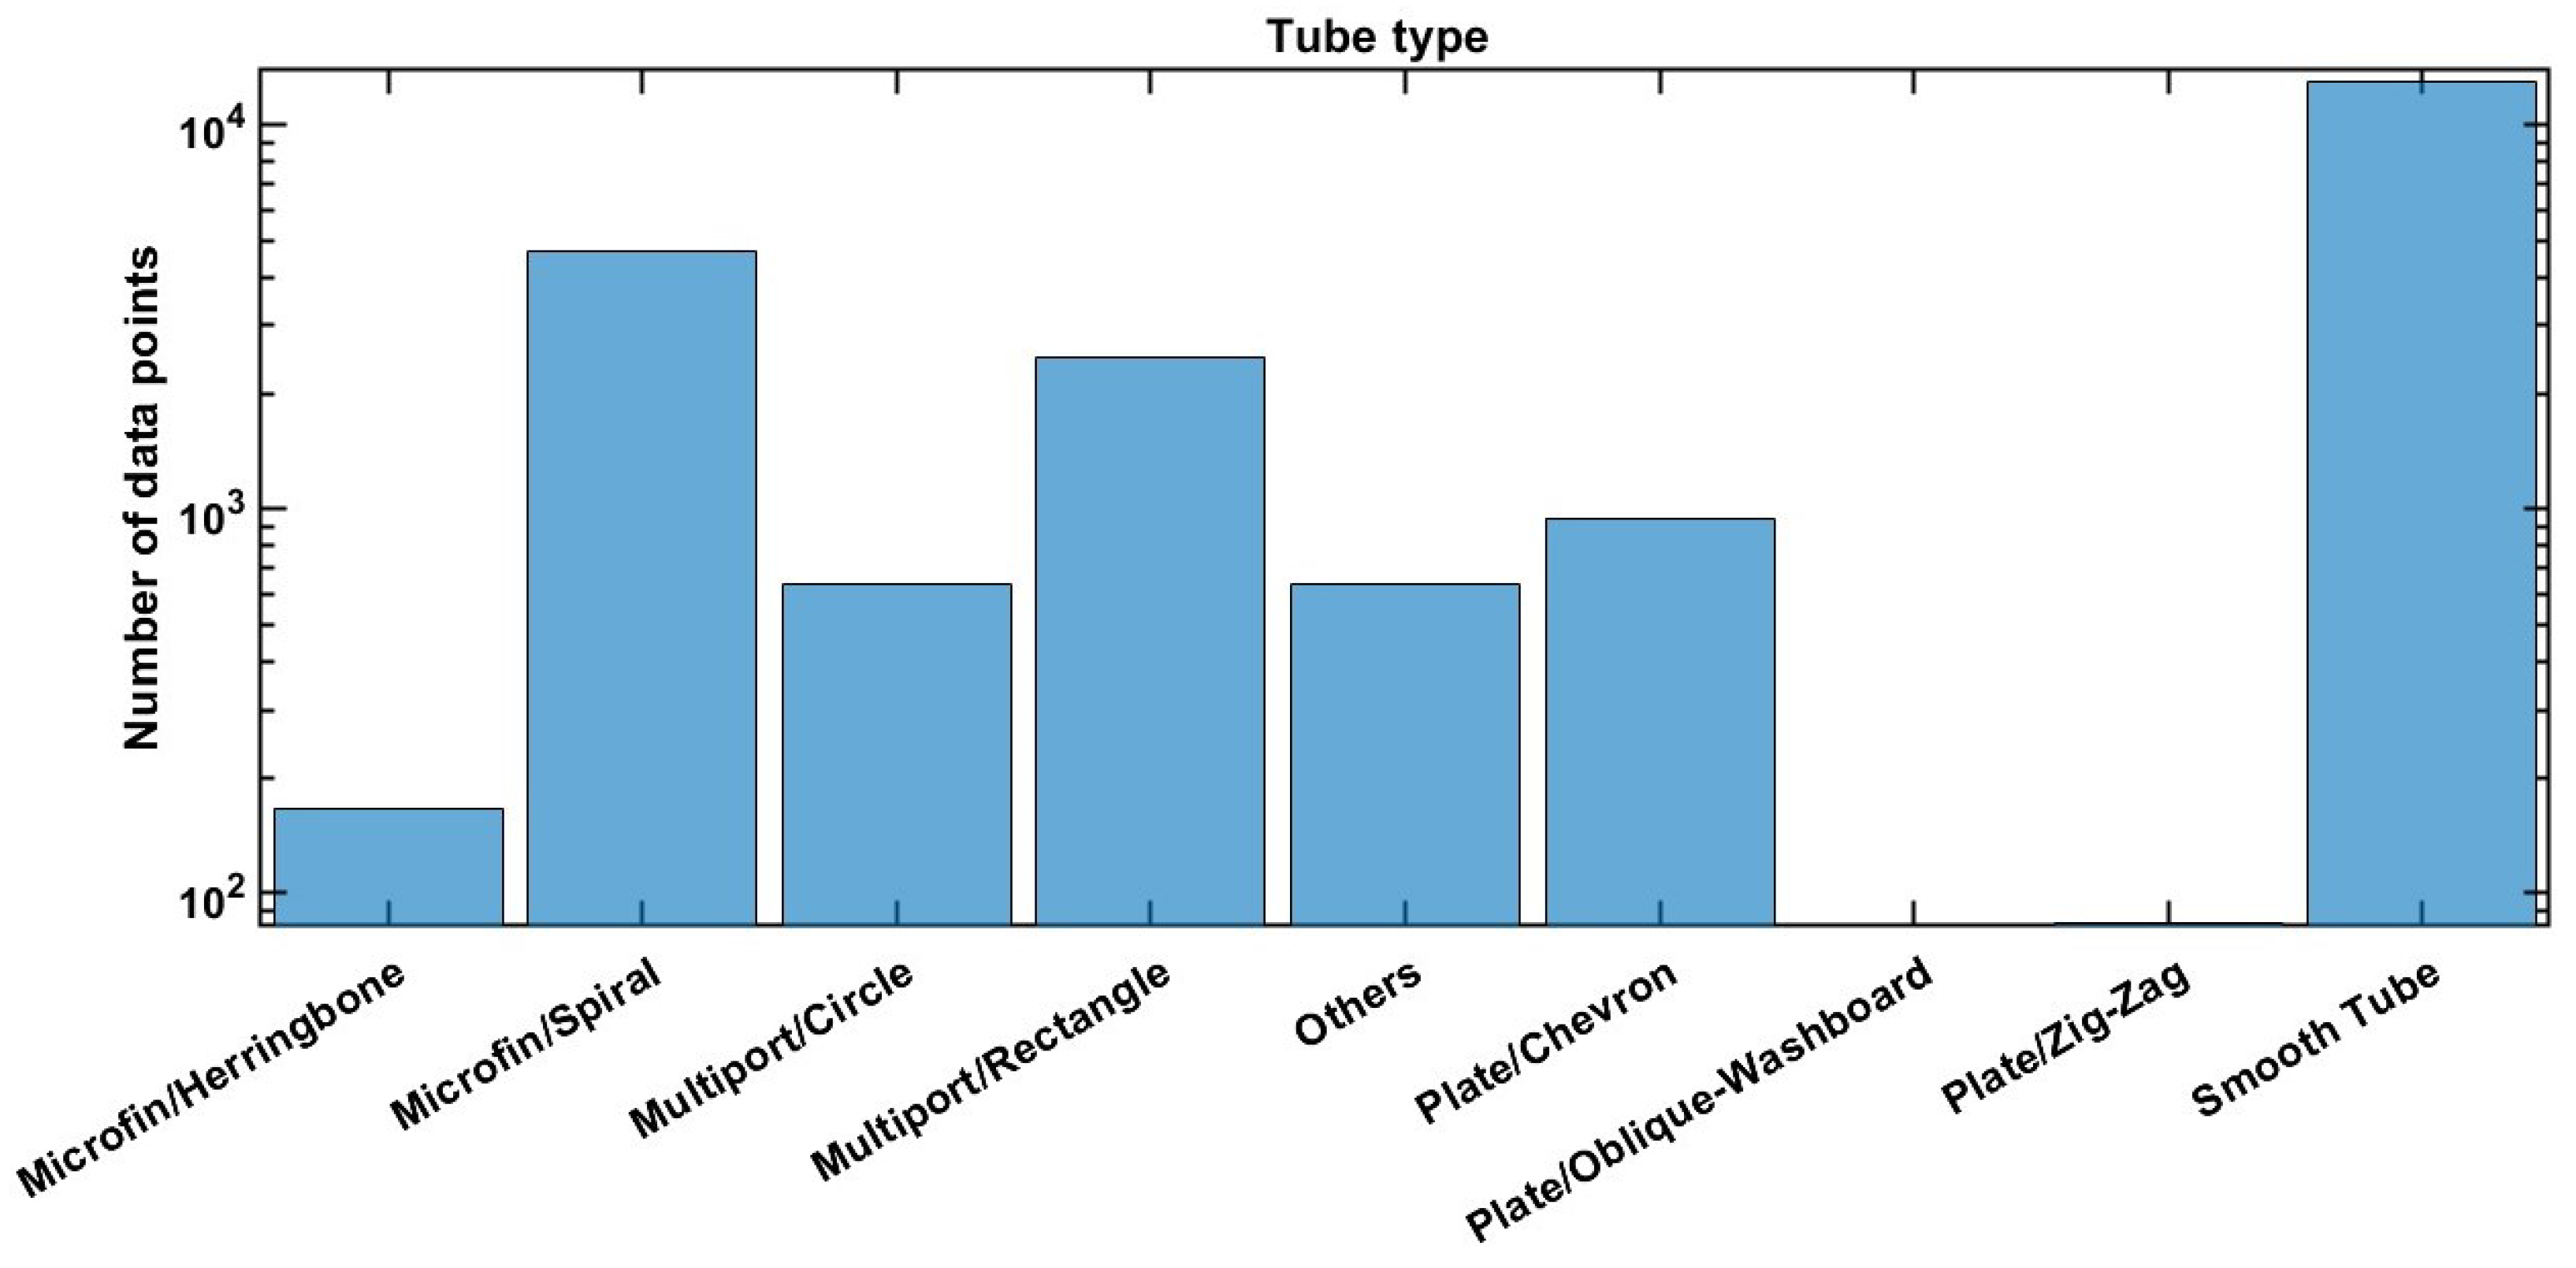
Figure 1. Considered number of data points for each tube type.
Jeta 03 00032 g001
Figure 2. Considered number of data points for each heat exchanger type.
Jeta 03 00032 g002
Figure 3. Comparison between the Experimental and Predicted Heat transfer coefficient for each refrigerant.
Jeta 03 00032 g003
Figure 4. Comparison between the Experimental and Predicted Heat transfer coefficient for each tube type.
Jeta 03 00032 g004
Figure 5. Comparison between the Experimental and Predicted Heat transfer coefficient for each heat exchanger type.
Jeta 03 00032 g005
Figure 6. Experimental vs. Residual heat transfer coefficient.
Jeta 03 00032 g006
Figure 7. Mean Absolute Shapley values corresponding to each input parameter.
Jeta 03 00032 g007
Figure 8. Partial dependence plot for each tube type.
Jeta 03 00032 g008
Figure 9. Partial dependence plot for wall temperature.
Jeta 03 00032 g009
Figure 10. Partial dependence plot for mass flux.
Jeta 03 00032 g010
Figure 11. Partial dependence plot for heat exchanger type.
Jeta 03 00032 g011
Table 1. Heat transfer coefficient considered database description.
Refrigerant T sat T wall PressureVapor QualityMass FluxHidraulic DiameterLiquid Thermal ConductivityLiquid DensityBoiling Data
Points
[°C][°C][MPa][x][kg/m2s] D h  [mm] λ l  [mW/m· K] ρ l [kg/m3]
R1157–7569–850.29–0.470−0.99150–5601.9572.8–77.61348–1395100
R12349–8151–1320.208–0.50−0.3–0.85167–4700.19–1.9562.4–701306–1399213
R1233zd(E)25–1450–1730.129–2.490–0.930–10000.650–651.3–82.7842–12631371
R1234yf6–416–600.385–1.040–0.9950–9400.564–458.7–69.41029–11571828
R1234ze(E)0–720–77.320.215–1.70–0.9920–9400.65–1.7559–83.1974–12402124
R12705–207–1070.676–1.010–0.9550–3004–9.43107–113514–538158
R134a−7–70−1.4–1030.22–2.11−0.1–1.071–37101.9–12.761.6–95.4996–13193100
R141b34–6039–630.108–0.250–0.9350–3068.6–10.9281–88.11162–1216122
R152a10–3212–670.372–0.730.0–0.96100–5801.1284–295–104881–936251
R161−5–8−1–170.368–0.560–0.99100–2506.34121.7–129733–757160
R22−15.5–35−14–2870.29–1.354−0.06–150–7001.5–13.8478.9–101.71150–13322104
R236fa3134–530.330780−0.02–0.8200–12001.03711338151
R245fa18–1300–2040.116–2.34−0.03–115–15000.636–1.7555.4–90.2938–13552392
R2900–352–940.47–1.210–0.9950–4991.54–9.4389.1–105.9476–528.731
R328–409–920.364–2.480–145–4990.643–677.6–138.8892–11953609
R600a−20–41−18–1420.072–0.540–0.9920–5001–9.4383.7–106.6529–6021460
R717−25–10−14–80.151–0.610–0.968–1004502–566625–671347
R744−50–25−44–280.687–6.430–176–7200.81–11.4680.7–168.7710–11532387
Total22,608
Experimental parameters reported on the used database.
Table 2. Table result of the machine-learning models.
Trainig Model PresetRMSEMSERSquaredMAEMAPE %
Bagged Trees1.973.880.911.0228.85
Fine Tree2.204.860.881.0728.35
Medium Tree2.586.640.841.3734.22
Exponential GPR2.777.650.821.6563.39
Rational Quadratic GPR2.797.790.811.6964.33
Matern 5/2 GPR2.848.070.811.7466.12
Wide Neural Network2.878.210.801.8675.15
Squared Exponential GPR2.878.220.801.7767.35
Trilayered Neural Network3.109.620.772.1477.29
Bilayered Neural Network3.169.980.762.2180.91
Coarse Tree3.1810.100.761.8544.85
Fine Gaussian SVM3.2110.310.751.7866.32
Least Squares Regression Kernel3.2310.440.752.1176.95
Medium Neural Network3.3010.920.742.2682.53
Narrow Neural Network3.6413.230.692.5186.69
Boosted Trees3.7714.180.662.5263.36
Cubic SVM3.8614.890.652.4684.43
SVM Kernel3.9415.510.632.2576.22
Medium Gaussian SVM4.1517.230.592.4376.78
Quadratic SVM4.2818.330.562.5885.87
Stepwise Linear4.6421.560.522.4556.20
Coarse Gaussian SVM5.0525.530.393.0998.68
Linear5.1226.210.413.4086.95
Linear SVM5.2627.670.343.32111.09
Robust Linear5.5630.940.313.2969.42
Efficient Linear Least Squares6.4141.060.024.36145.44
Efficient Linear SVM6.6243.77−0.044.16119.09
Interactions Linear6.9648.47−0.082.3753.53
Machine learning model type and performance.
Disclaimer/Publisher’s Note: The statements, opinions and data contained in all publications are solely those of the individual author(s) and contributor(s) and not of MDPI and/or the editor(s). MDPI and/or the editor(s) disclaim responsibility for any injury to people or property resulting from any ideas, methods, instructions or products referred to in the content.