Article

Proof of Concept for Determination of Static–Dynamic Material Loss Factor Damping via Simulation and Numerical Methods

by
Amir Javidinejad
Faculty of Mechanical Engineering, Department of Mechanical Engineering, California State Polytechnic University-Pomona, Pomona, CA 91768, USA
J. Exp. Theor. Anal. 2025, 3(1), 9; https://doi.org/10.3390/jeta3010009
Submission received: 3 January 2025 / Revised: 14 February 2025 / Accepted: 25 February 2025 / Published: 6 March 2025

Abstract

:
The vibration response of a component, particularly the frequency response of the component, can be used in the determination of the loss factor damping, η, due to energy dissipation and the elastic modulus (E). The ASTM E756-04 standard provides the methodology and the guidance for the determination of the loss factor damping and elastic modulus experimentally. This standard specifically calls for the use of a beam with a rectangular cross-section. Also, the theoretical formulation developed there is based on such a beam cross-section. Here, in this paper, the theoretical formulation and numerical simulation for determining the loss factor damping and elastic modulus are a derivation of the methodology used in the ASTM standard and other R&D work, but for a circular plate configuration. The delta change derivation, both theoretically and numerically, is proven to be accurate and validated here. This method is useful in the characterization of materials that have applications in structural vibration, aerospace subcomponents, micro and mini sensory devices, medical devices, and many other areas. Similar to the ASTM standard, the materials could include metals, ceramics, rubbers, plastics, reinforced epoxy matrices, composites, and woods. This paper mainly formulates the technique via numerical and computational methods. It is the intention of the author to also, as a future research agenda, experimentally produce data that can be correlated with this theoretical and numerical methodology.

1. Introduction

Vibration-based structural damage detection has been investigated in detail by others and can be found in the references [1,2,3,4,5,6,7,8]. The methods used mostly represent damage using either natural frequencies or mode shapes and the derived measures, such as the displacement mode shapes [9,10,11,12,13,14]. It is known that natural frequencies have low sensitivity to damage and, thus, can usually be used to reflect damage to a moderate degree [15,16]. Mode shapes and displacements have greater sensitivity to damage than natural frequencies. Nevertheless, the measurement of a mode shape is time-consuming, expensive, and requires lots of sensors distributed on the structure [17]. Thus, it can be concluded that natural frequencies are a more viable source for the determination of damage in materials. One of the phenomena that can be considered a form of structural decay like structural damage is the loss factor damping, which is an indication of elastic modulus degradation due to loading hysteresis.
By definition, damping represents a physical phenomenon that dissipates vibration energy in a dynamic system [18,19,20,21,22]. Commonly, much of this energy dissipates within the system, mostly in the form of heat, while the rest dissipates outside the system in the form of acoustic radiation [23,24,25]. A greater amount of loss factor damping is due to the inability of the material to return to its previous state in the elastic range after the loading and unloading [23]. In this paper, the vibration concepts are used to determine this loss factor damping and its effects.
As a background review of the vibration concepts, one should know that the equation for a motion of a system with a single degree of freedom with viscous damping and no external loads is
m u ¨ + c u ˙ + k u = 0
where m = mass, c = damping and k = stiffness.
This equation can be normalized by the mass, m, to give (ζ = viscous damping ratio 0 = < ζ < 1, ω0 in the undamped natural frequency)
u ¨ + 2 ζ ω 0 u ˙ + ω 0 2 u = 0
where c/m = 2ζω0, k/m = ω02 and c = 2ζk1/2.
Now, when used for a steady-state harmonic vibration, if you plot the stress vs. strain for a specified period segment, you will determine that there is an elliptical hysteresis on the stress–strain curve known as phase shift. This is due to the fact that even in the linear elastic region the material [polymer] does not really fall back to the original state and there is a hysteresis effect [23] as shown in Figure 1 following.
The elastic modulus for the loading of the material is known as the storage modulus E’ and the difference between the elastic storage modulus and the unloading curve is known as the loss modulus E″ [23].
Following Hooke’s law and incorporating the storage and loss modulus, one would have
σ ~ = E ~ ε ~ = E + i E ε ~
Hereby, if the E’ is identified as the storage modulus and the E″ is referred to as the loss modulus that relates to the E by a factor of η (known as the loss factor damping), then
E = E η = E η
Then, by considering Equation (3),
E ~ = E 1 + i η
Then, one can conclude that the loss factor damping is
t a n δ = E E = η
Also, the loss factor damping, η, is related to the loss angle δ (the phase shift between the stress and the strain). For a single-degree-of-freedom model, at the first resonance, the viscous damping predicts higher damping than the loss factor damping (ζ > η). Also, for a two-degree-of-freedom system, the viscous damping and loss factor damping match in predicting the damping at the first resonance frequency (η = ζ). However, for the second resonance frequency, the loss factor damping is twice the viscous damping (η = 2ζ). For illustrative purposes, please see the data shown in Appendix A Figure A1 from the COMSOL resources authored by Henrik Sonnerlind [24].
This loss of energy is generally due to internal material friction, external friction, thermoelastic damping, etc. The damping loss factor of a mechanical subsystem contains components such as the internal friction, acoustic radiation loss of subsystem vibration, and boundary connection damping of the subsystem [25].
Here, in this paper, all the loss components are considered as one loss factor damping. For a list of the typical loss factor damping for different materials, refer to Appendix A Table A1. For aluminum, the maximum expected material loss factor damping is η = 0.02.
A methodology established by ASTM E756-04 [26,27] measures the vibration-damping properties of materials: the loss factor, η, and Young’s modulus, E, or the shear modulus, G. The test is based on the analysis of the peaks in the frequency response function (FRF) measured without interfering with the system being analyzed. In this ASTM standard, cantilevered beams are utilized for determination of the vibration material damping. This methodology is a very complex approach and instrumentation such as an environmental chamber, thermocouples, exciter transducers, response transducer signal generator, spectrum analyzer, amplifier, oscilloscope, and recorder are needed. Also, the test specimens are required to be prepared for testing. This can be an expensive approach.
Here, in this paper, the methodology adapted to examine the material loss factor damping involves the use of a clamped circular plate. Later in this paper, the illustration of the circular plate used and its boundary conditions would be presented. The novelty of this method is that the loss factor damping can be evaluated by the FEA numerical methods. The need for experimentation is not there. The FEA procedures, as explained in Figure 2, can be utilized. According to the results shown in Table 1, the plates with the loss factor damping have a displacement 2% lower than the plates without the loss factor damping. This indicates that the numerical approach in this study is adequate and valid as a source for capturing the material loss factor damping. The cost of this method is significantly reduced from the ASTM method.

2. Validation of the Elastic Modulus and Loss Factor Damping per the ASTM Standards

According to the ASTM standards in reference [26,27], the elastic modulus (E) of the uniform rectangular beam, as a function of the resonance natural frequency, is
E = 12 ρ l 4 f n 2 H 2 C n 2
where l is the beam length (here, it is equivalent to the diameter of the circle), ρ is the mass density, H is the beam thickness, fn is the n-th resonance frequency, and Cn is a coefficient associated with mode n. This equation can easily be manipulated for a circular plate cross-section. By trial and error modifications of the Cn coefficient, a valid coefficient for a circular plate can be determined.
However, Equation (7) can be developed mathematically as well. One should know that the equation for the angular frequency of a clamped circular plate is [28]
ω = α r 2 D ρ H
where ω = 2πfn, D = EH3/[12(1 − v2)], v = 0.33 and α = 10.2158, 39.7711, 89.1041 and … for mode n = 1, 2, 3 and …, respectively.
By substitution of the above terms into Equation (8), one would have
E = 12 ρ d 4 f n 2 H 2 C n 2
where Cn2 = 1/[(1 − 0.332)(4π2)/(16(α2))] and d = 2r.
Also, from the ASTM E756-04 standard [27], one can determine the loss factor damping (η) by the half-power-bandwidth method of the n-mode, as follows:
η = Δ f f n
where Δf is difference between the frequencies (f2, f1) at the half bandwidth calculated by
hbw = Displacement   Amplitude   at   f n 2 .
For an analysis process flow for determination of the elastic modulus with and without loss factor damping, refer to Figure 2.

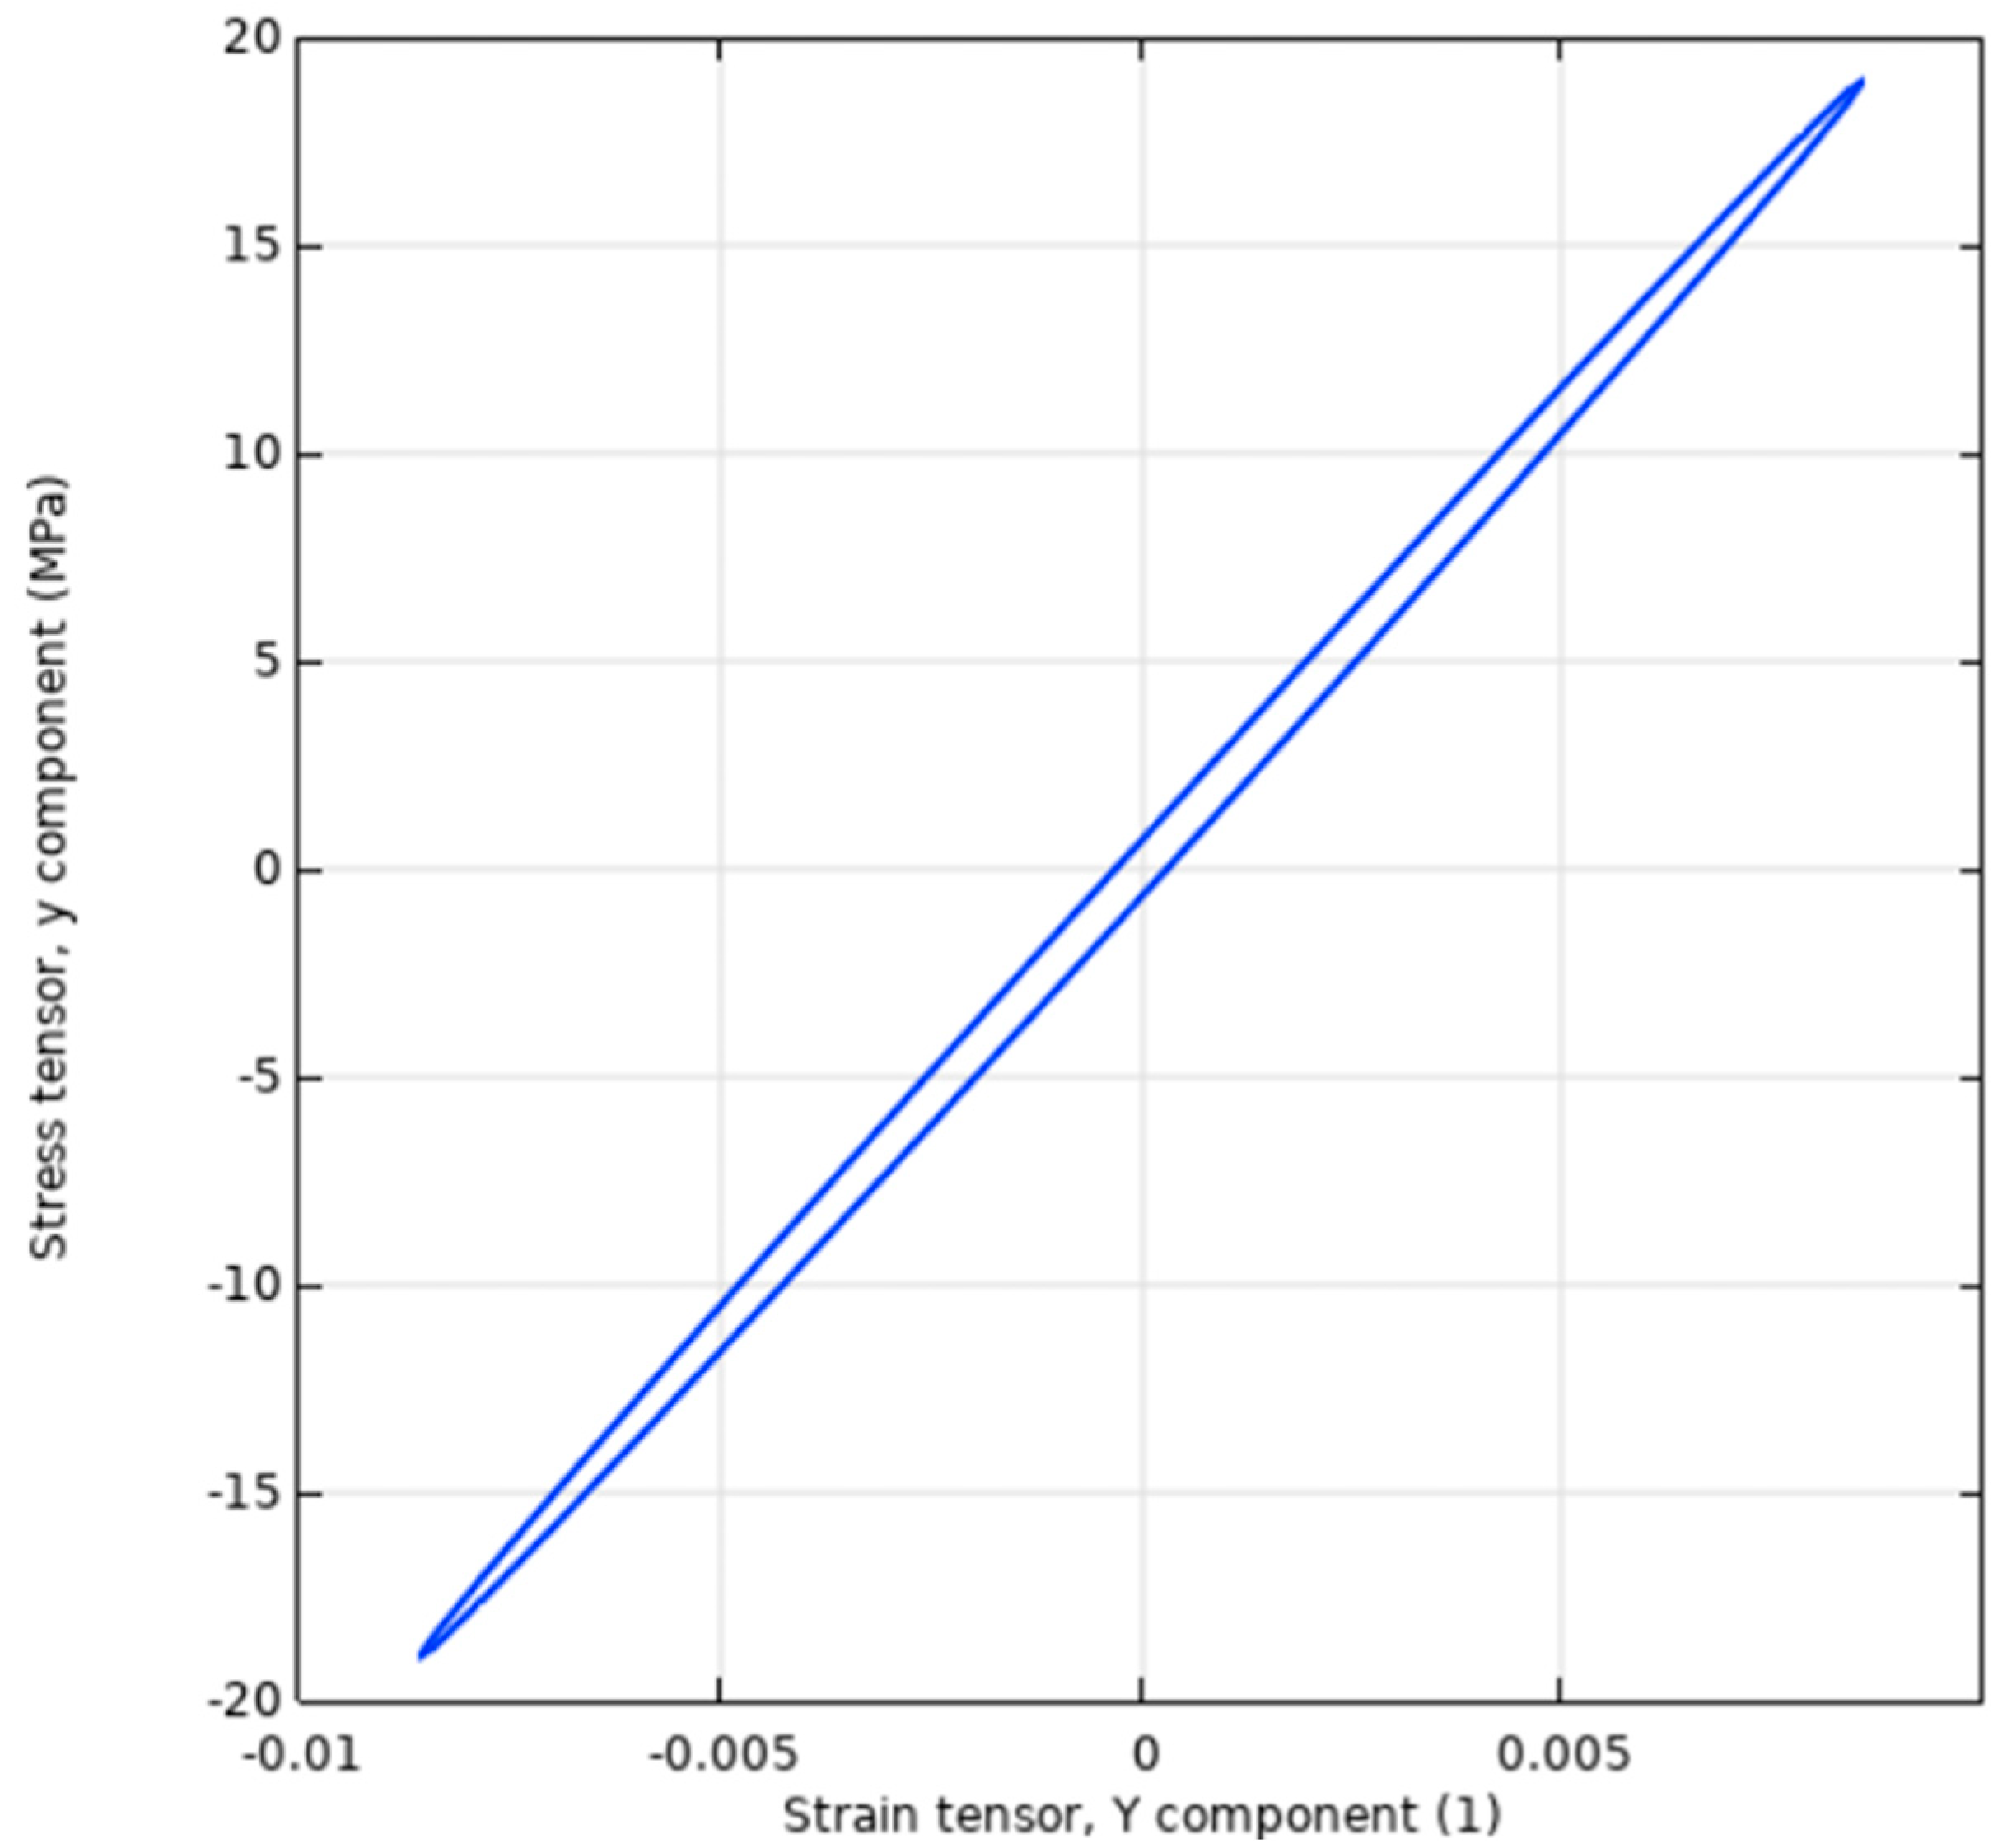
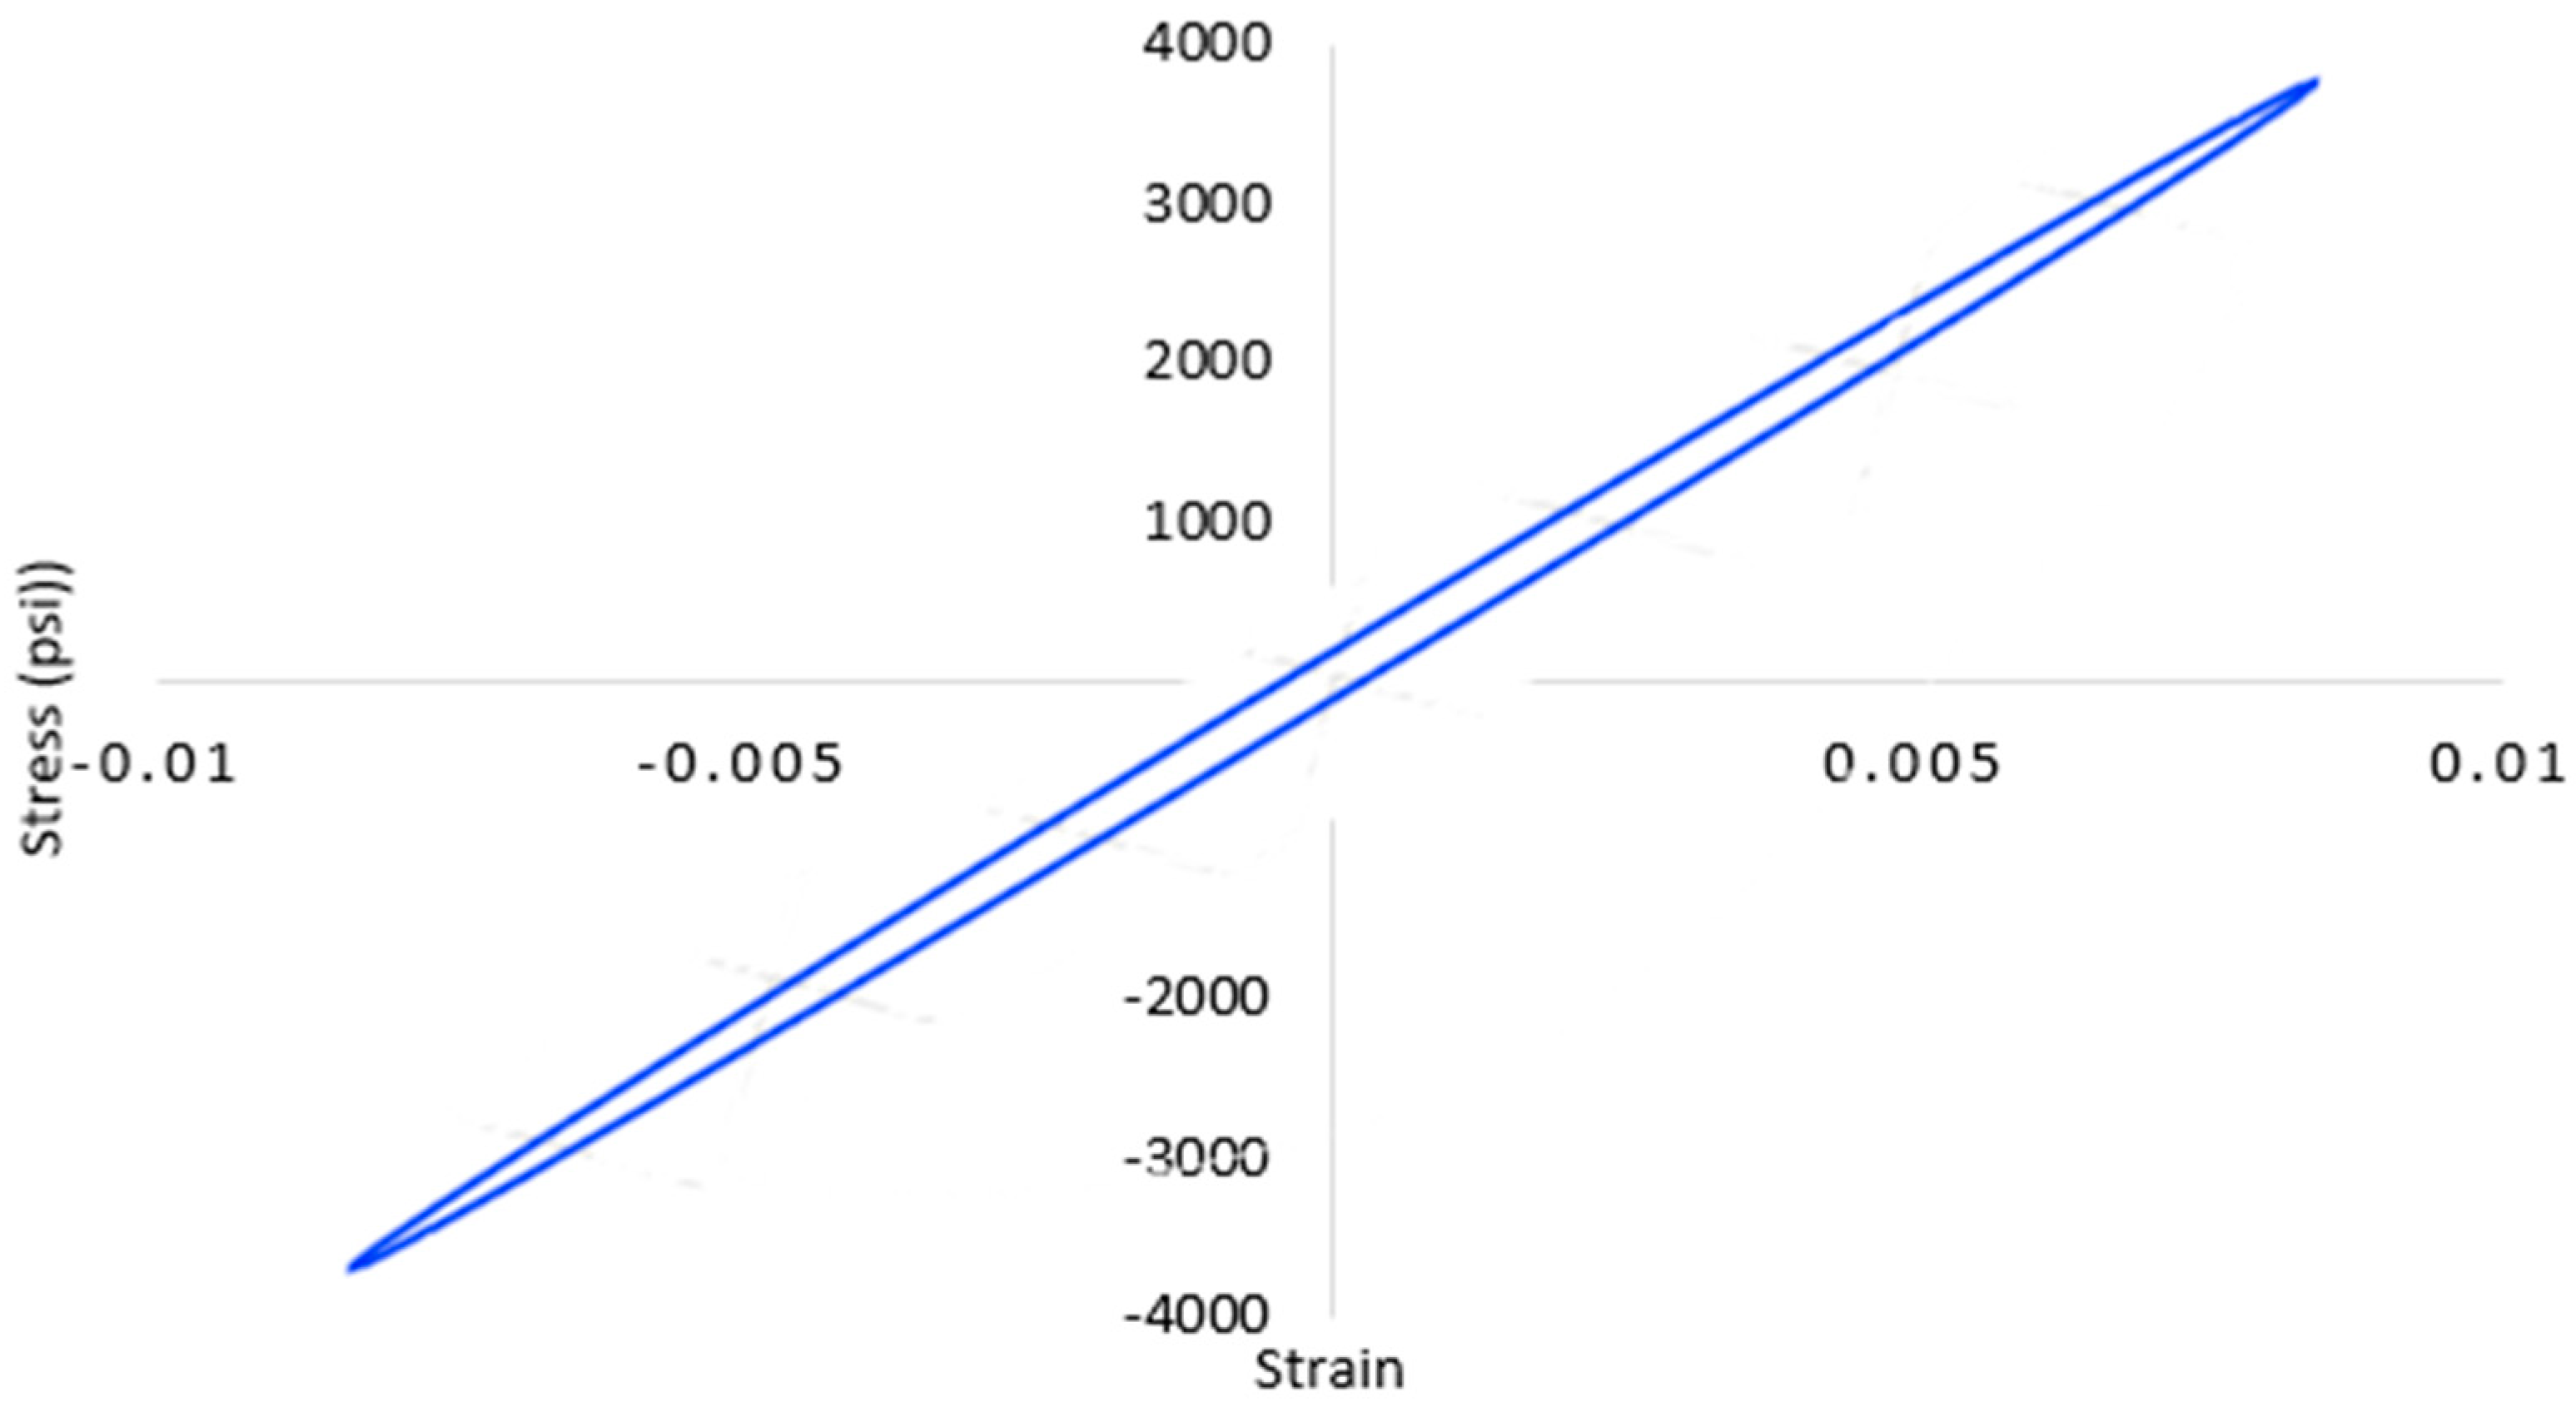
3. Numerical Case (Static Hysteresis)

For numerical analysis purposes, consider aluminum with an elastic modulus of E = 10 × 106 psi. For a maximum loss factor damping of η = 0.02, the new damped elastic modulus, Ed, would be as follows, if the modulus is to be reduced by the loss modulus, E″, (where E″ = Eη),
E d = E E η
E d = 10 × 10 6 ( 10 × 10 6 × 0.02 ) = 9.8 × 10 6   p s i
Plots of the stress vs. strain curve with the original aluminum elastic modulus and the newly damped elastic modulus are illustrated in Figure 3 for comparison purposes. The 2% elastic modulus reduction shown by Equation (15) is also consistent with a 2% displacement reduction without the material loss factor damping.
The hysteresis phenomenon is obvious in this comparison plot, where the straight line represents the stress vs. strain response for the original material without loss factor damping and the dotted line represents the stress vs. strain response for the material with the loss factor damping. The phase shift is apparent in this plot.
Now, this shift in the elastic modulus for the structural system, with and without the loss factor damping, can be further investigated by vibration analysis of the system in question.

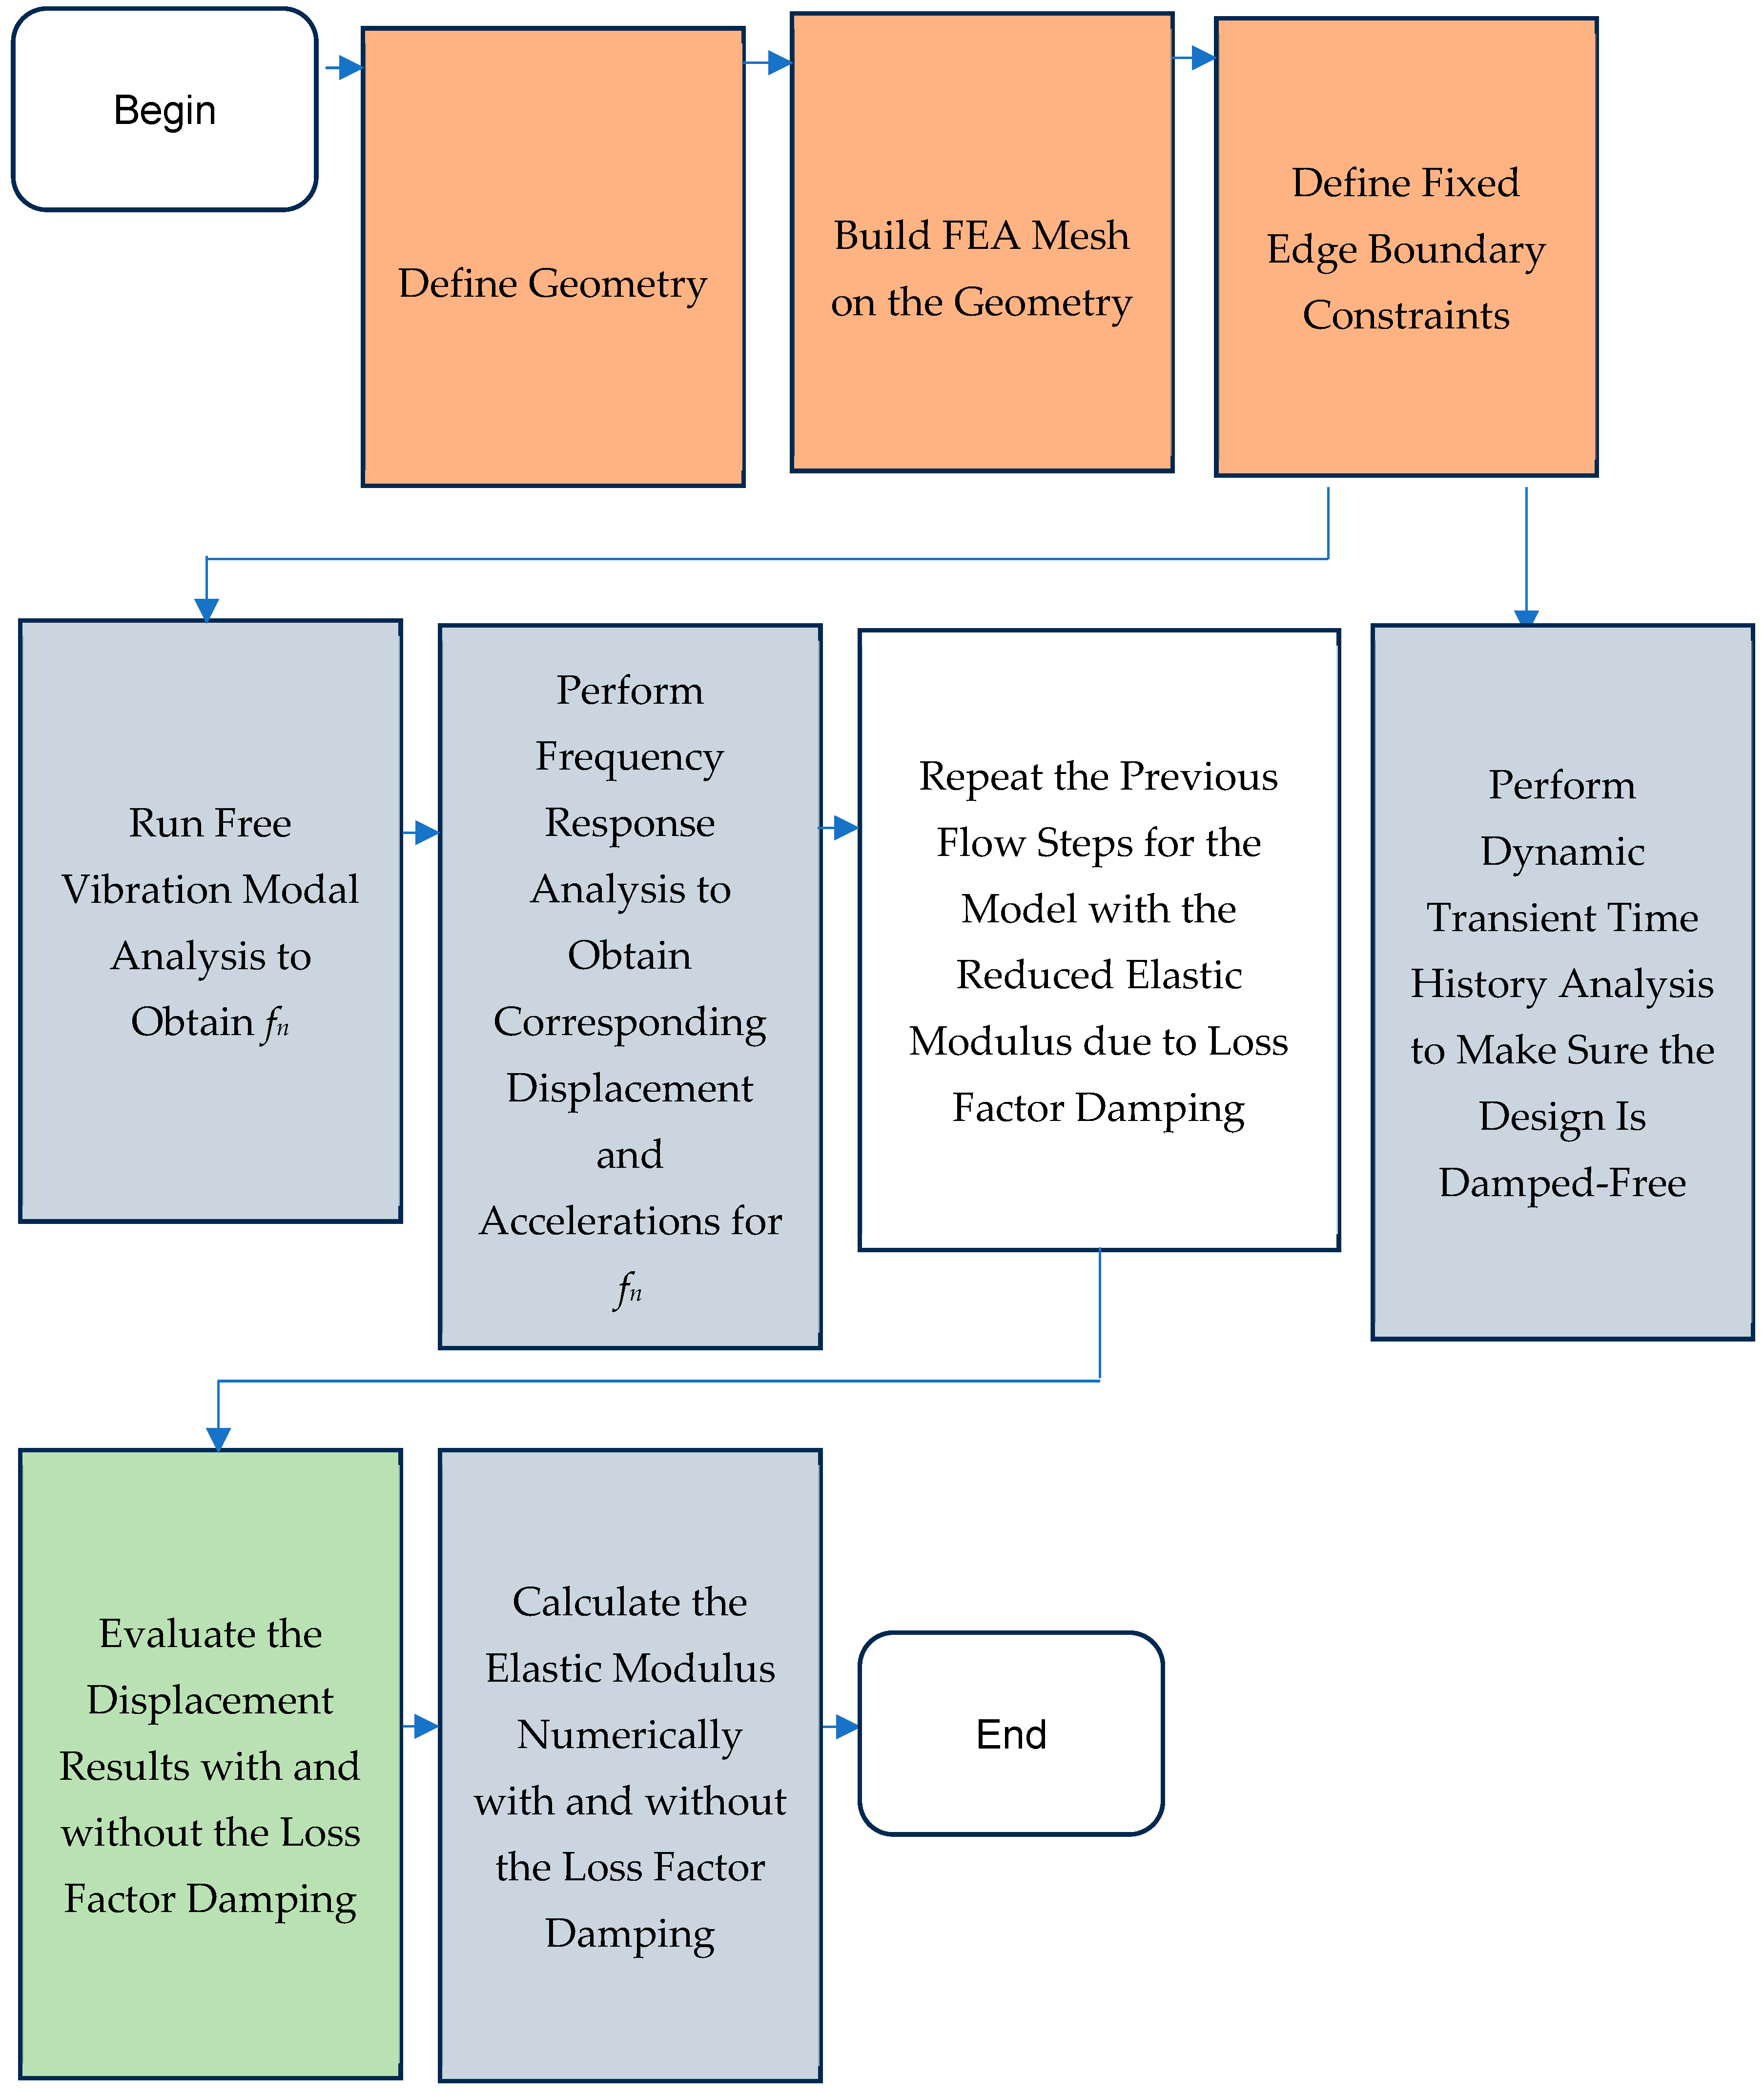
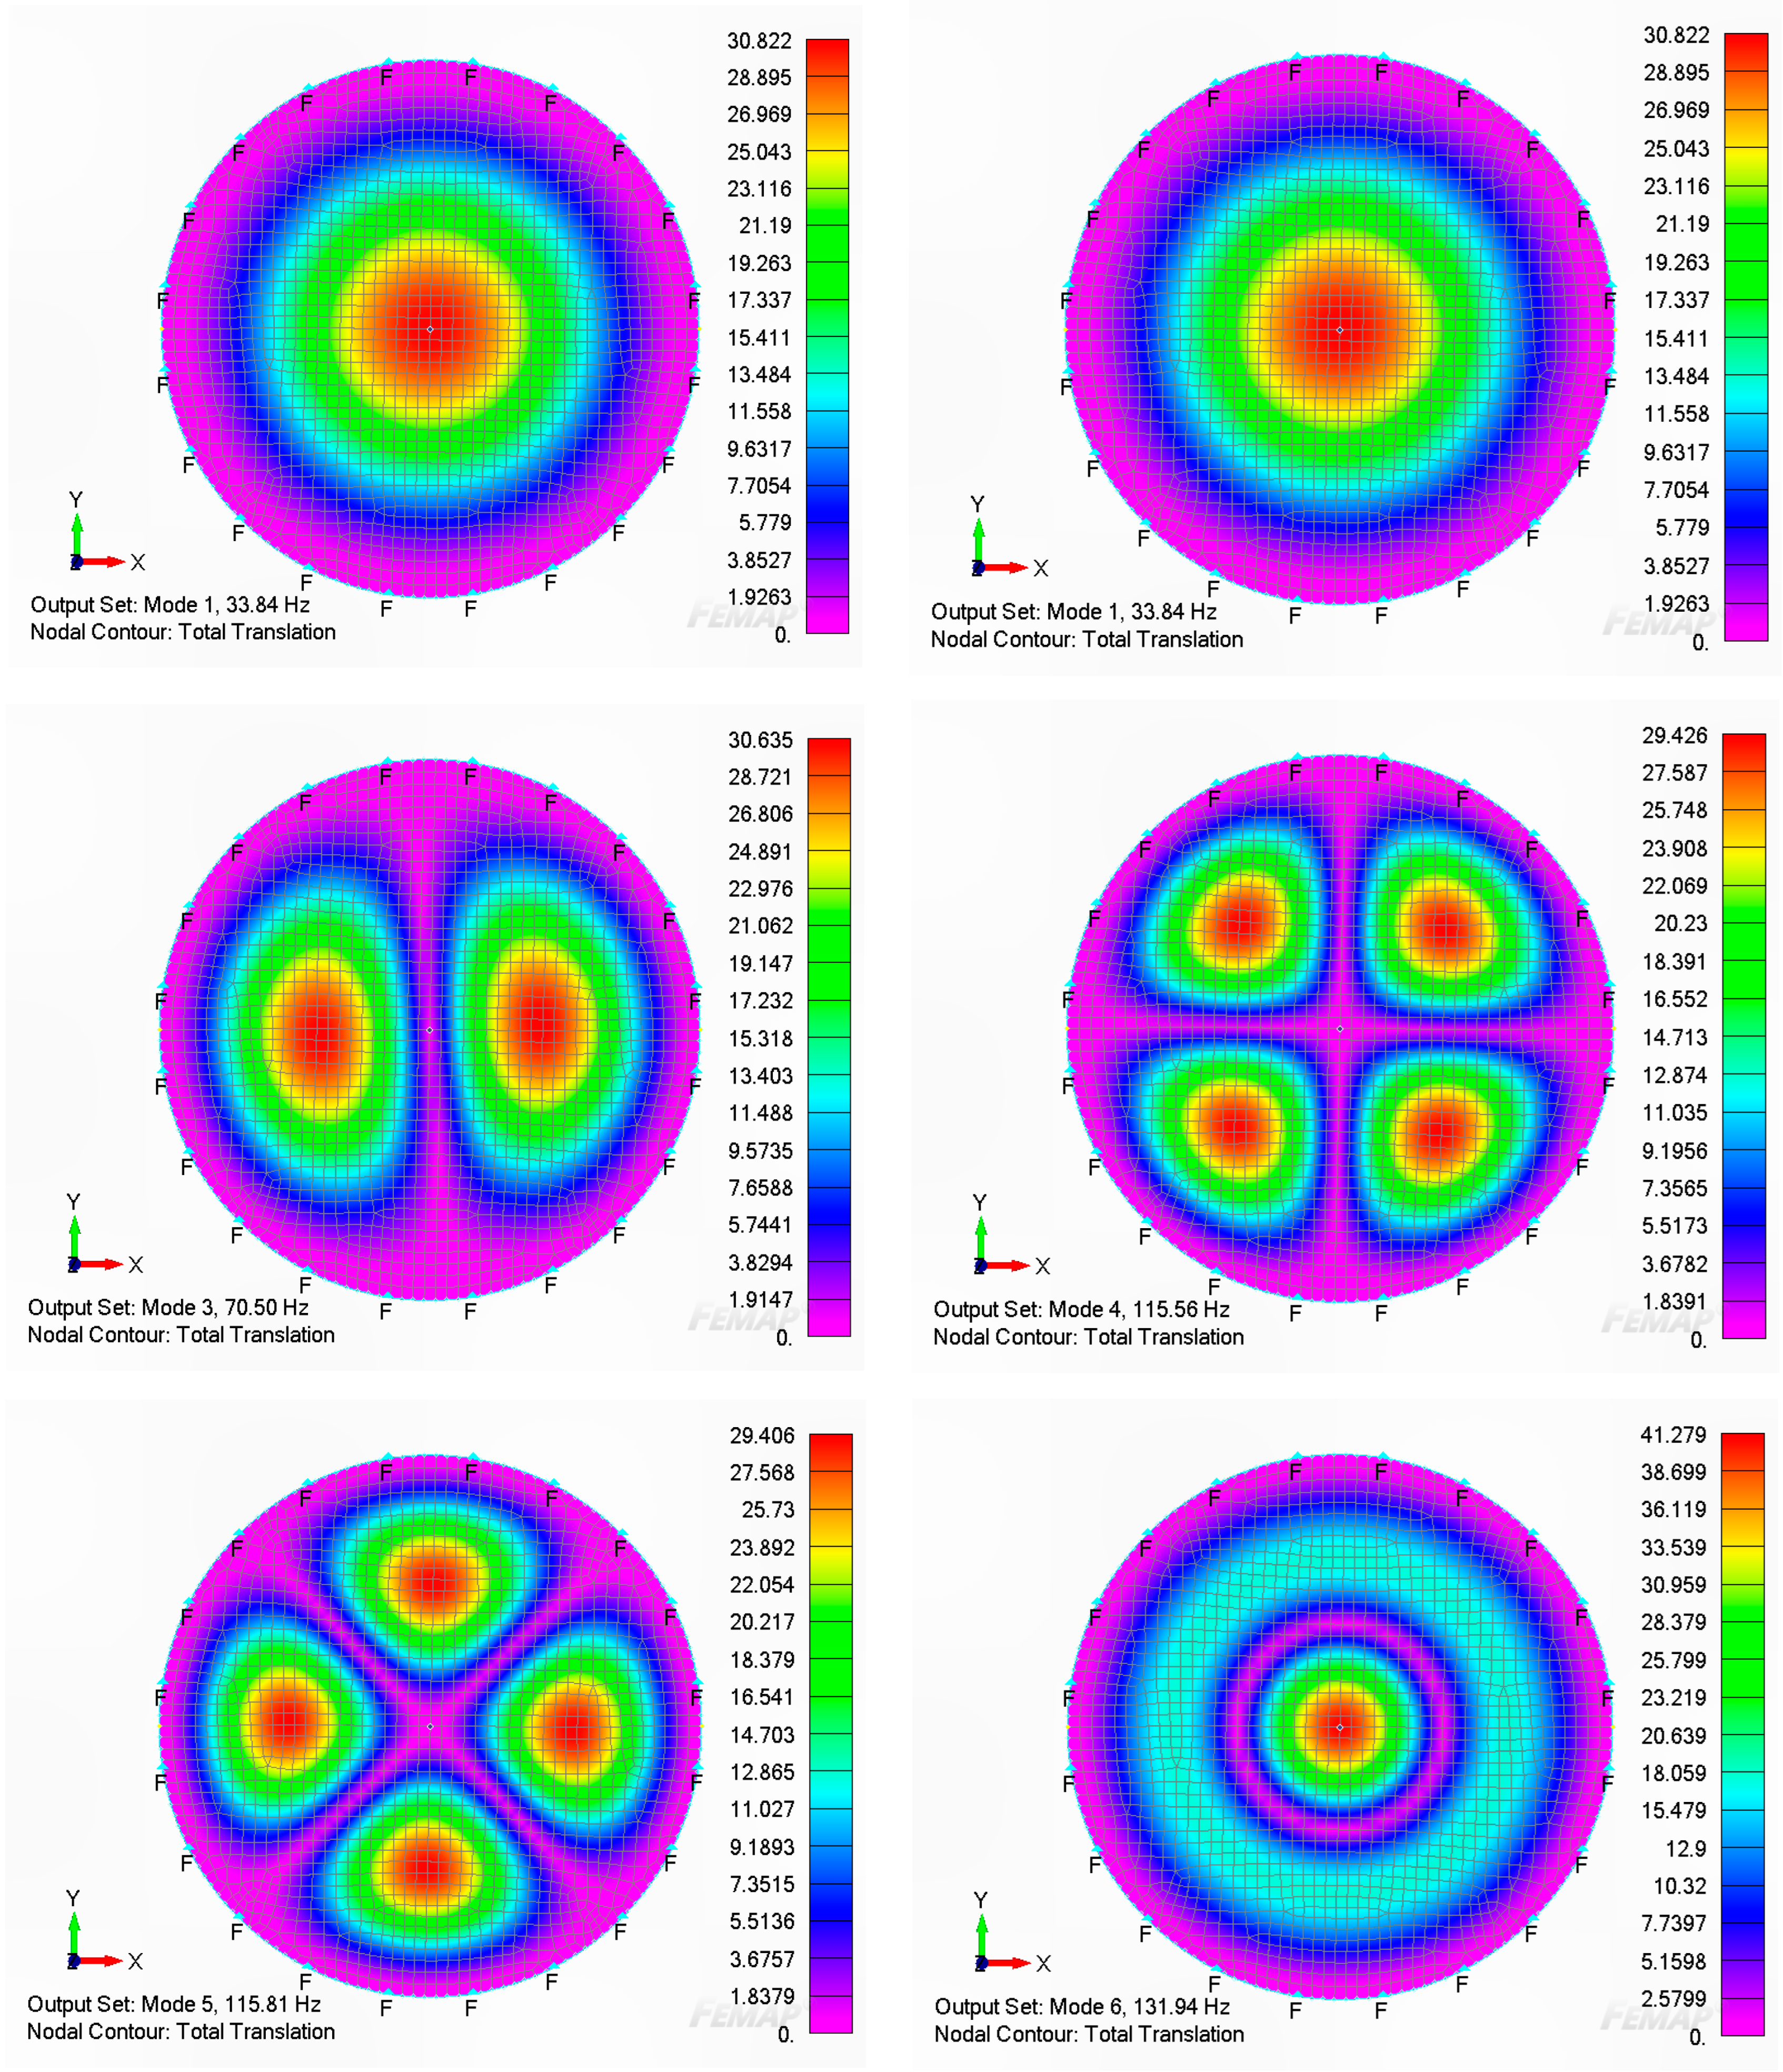
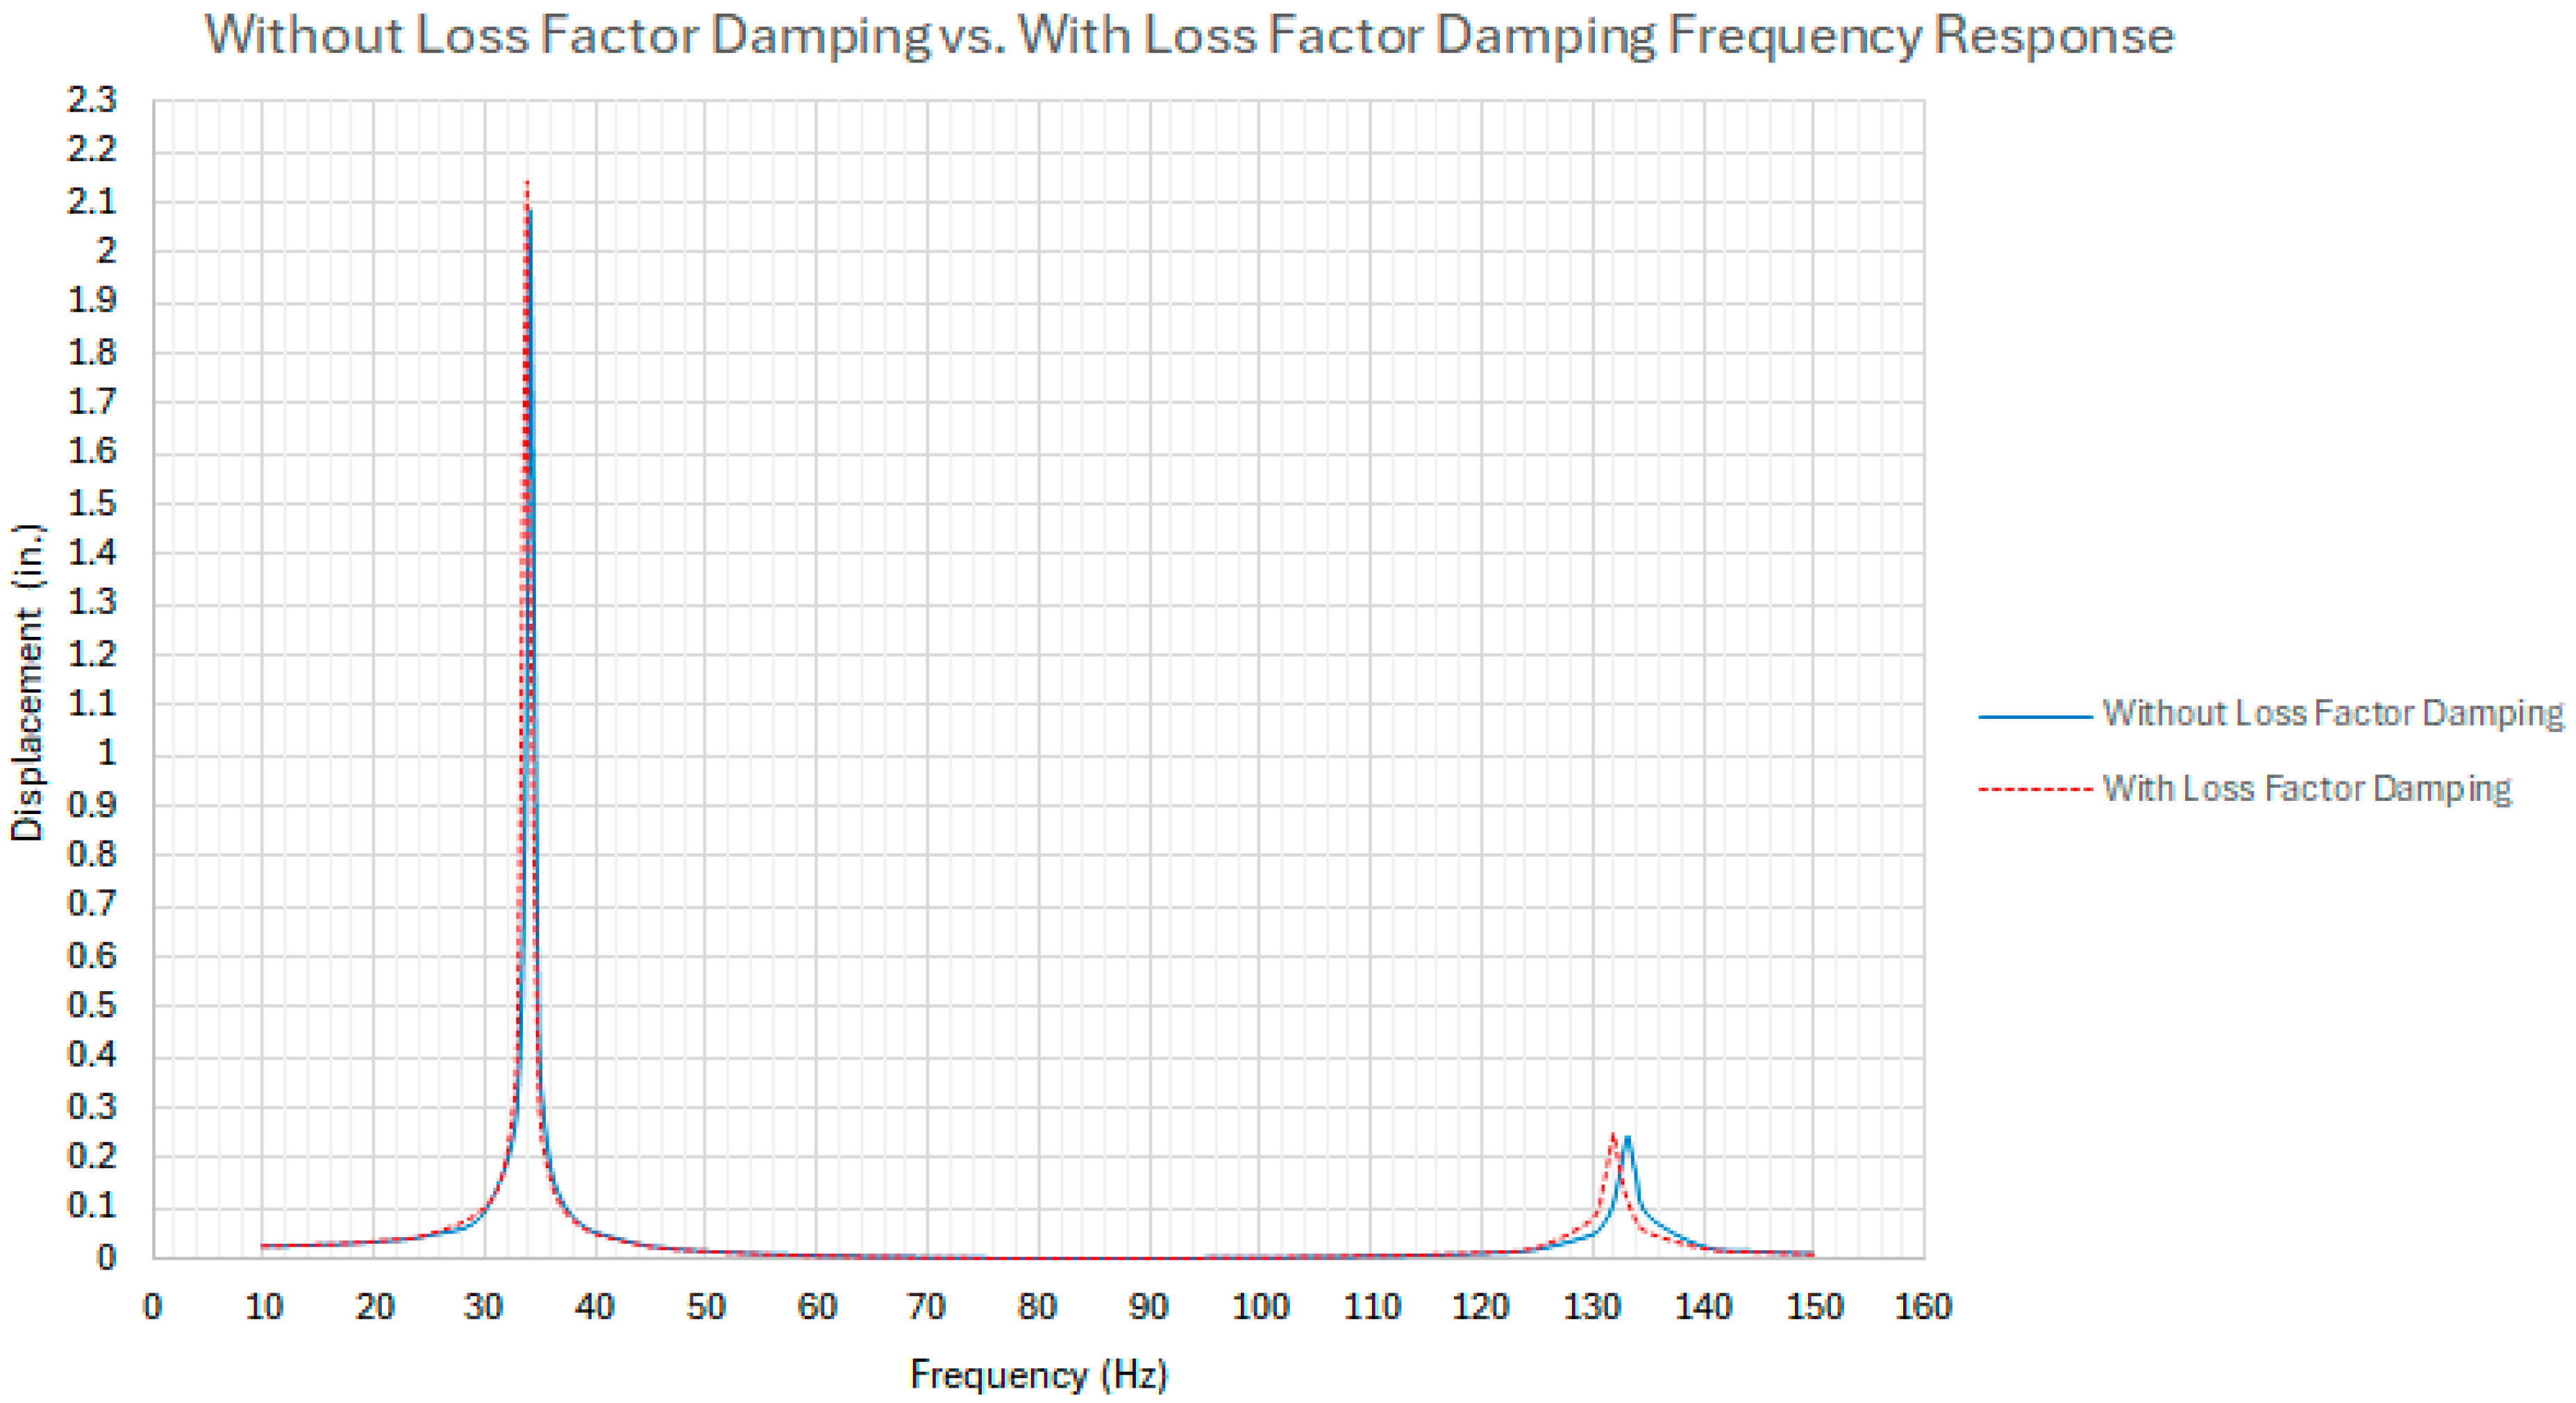
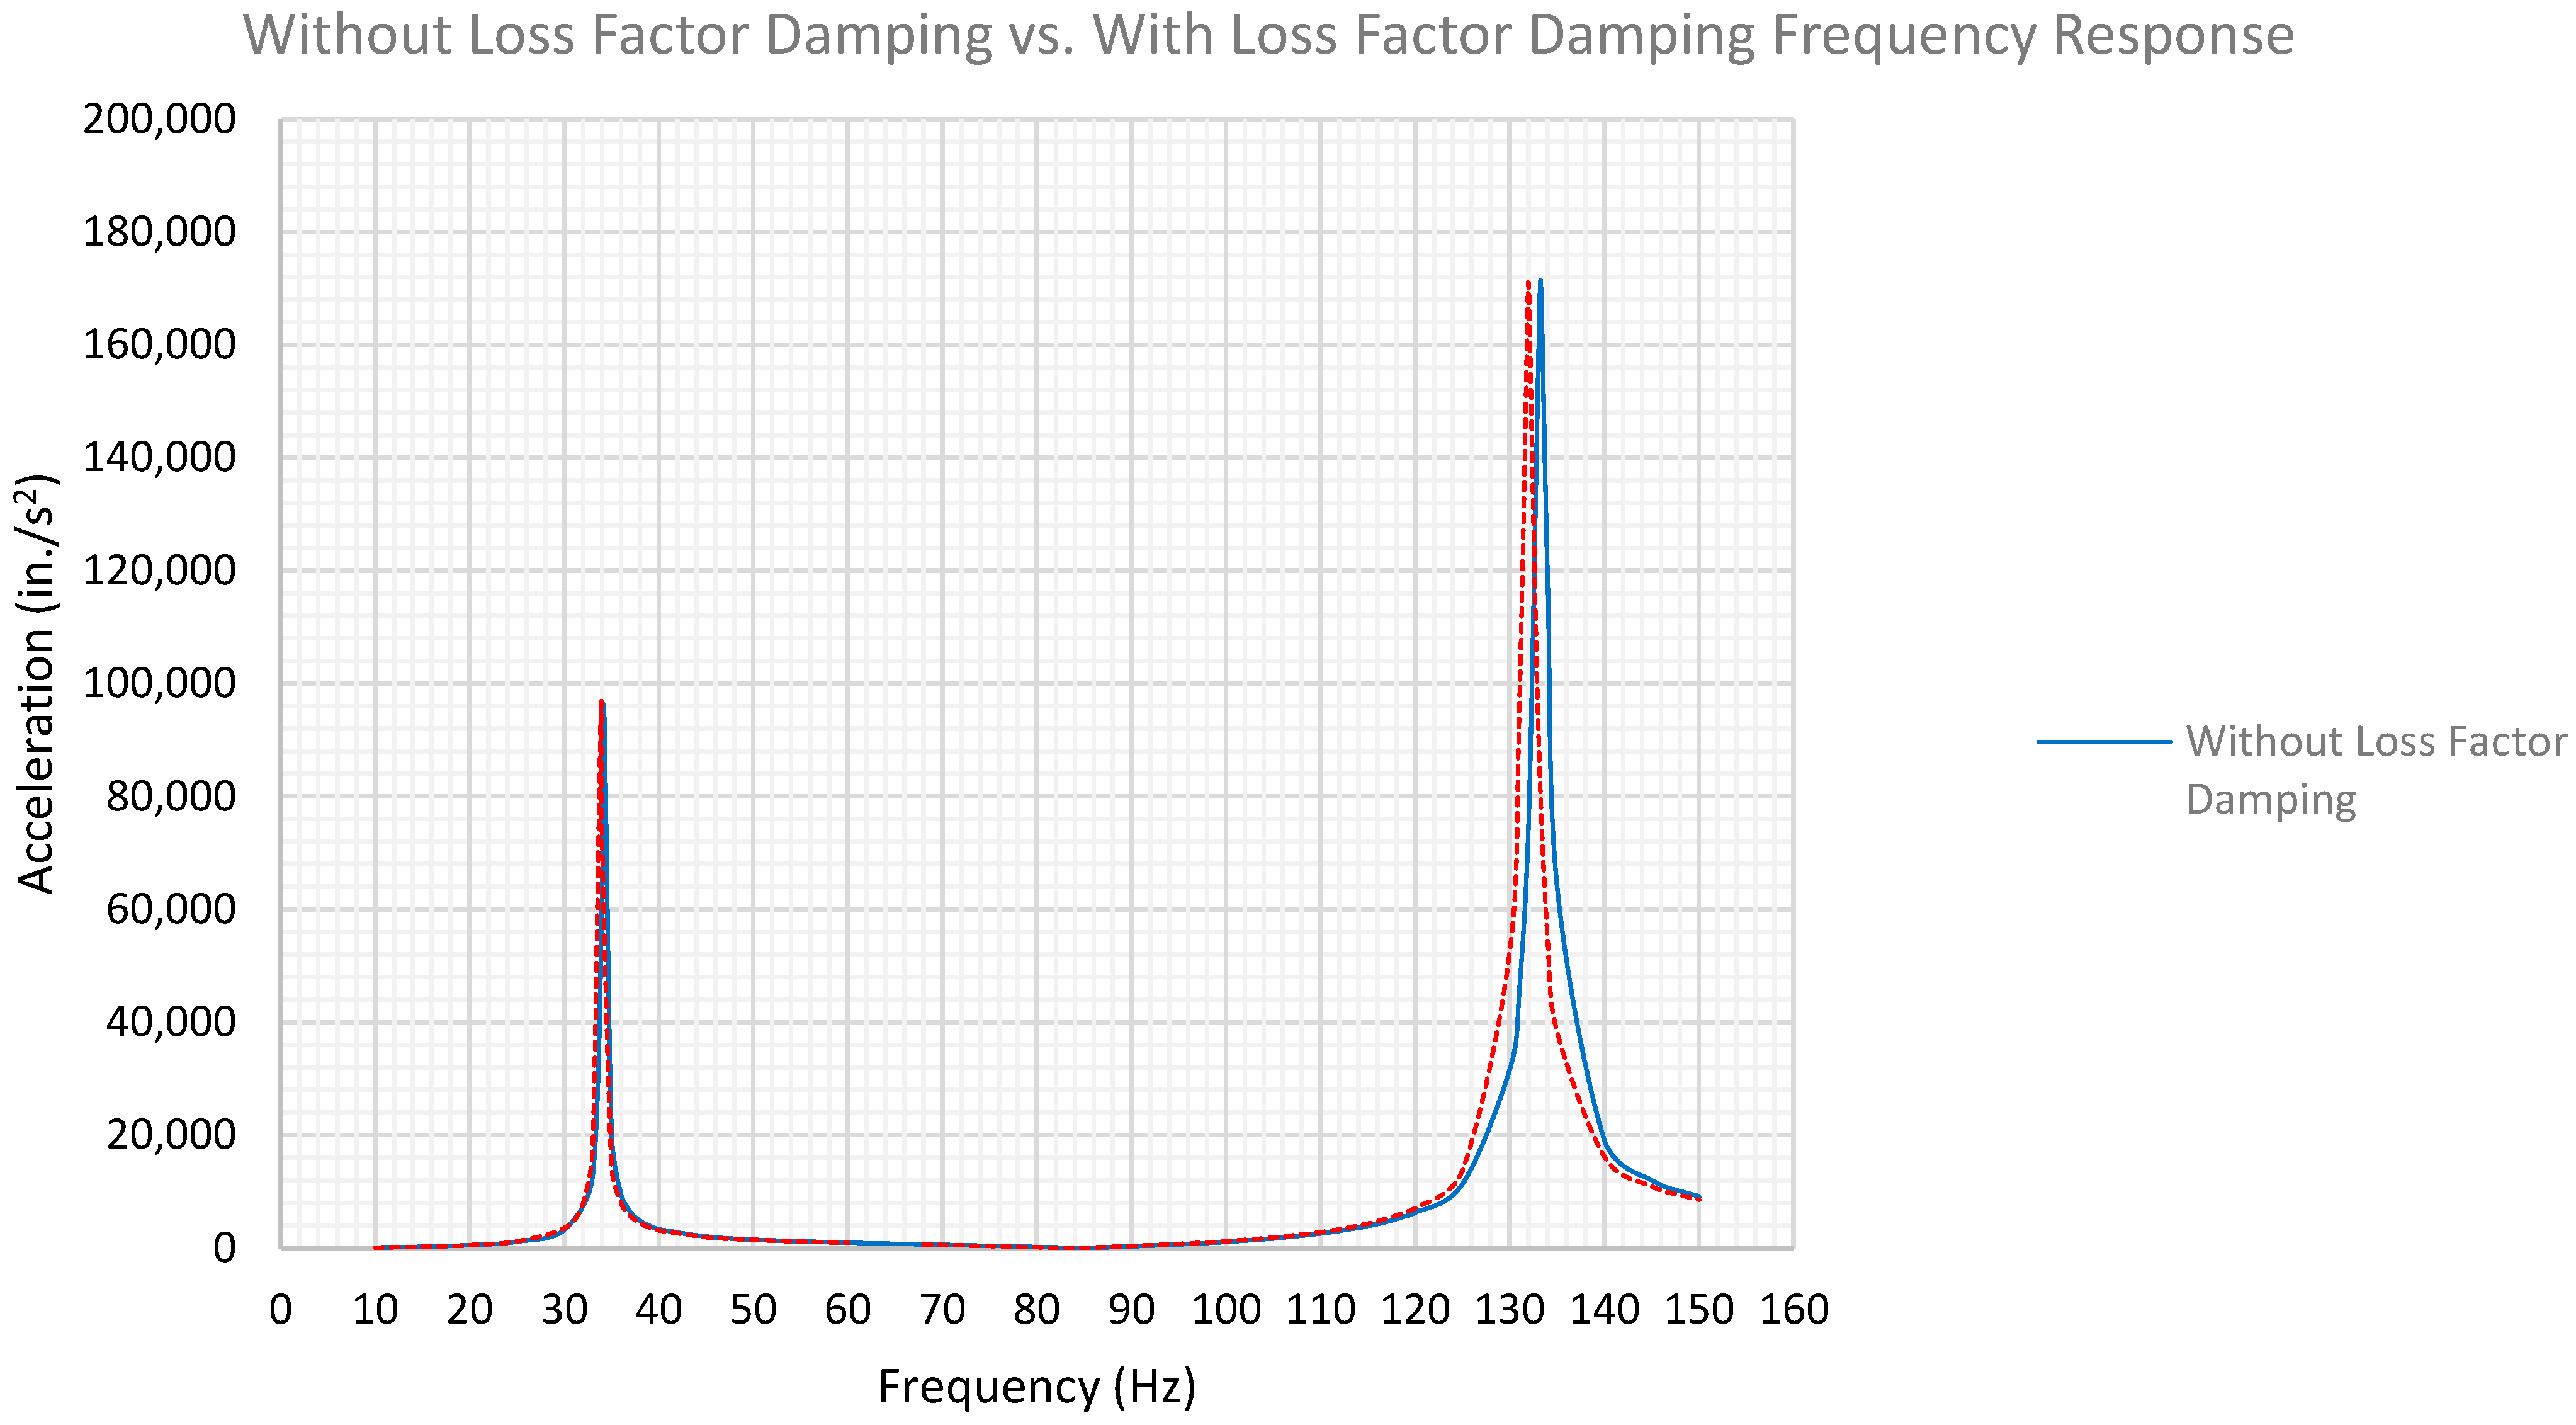
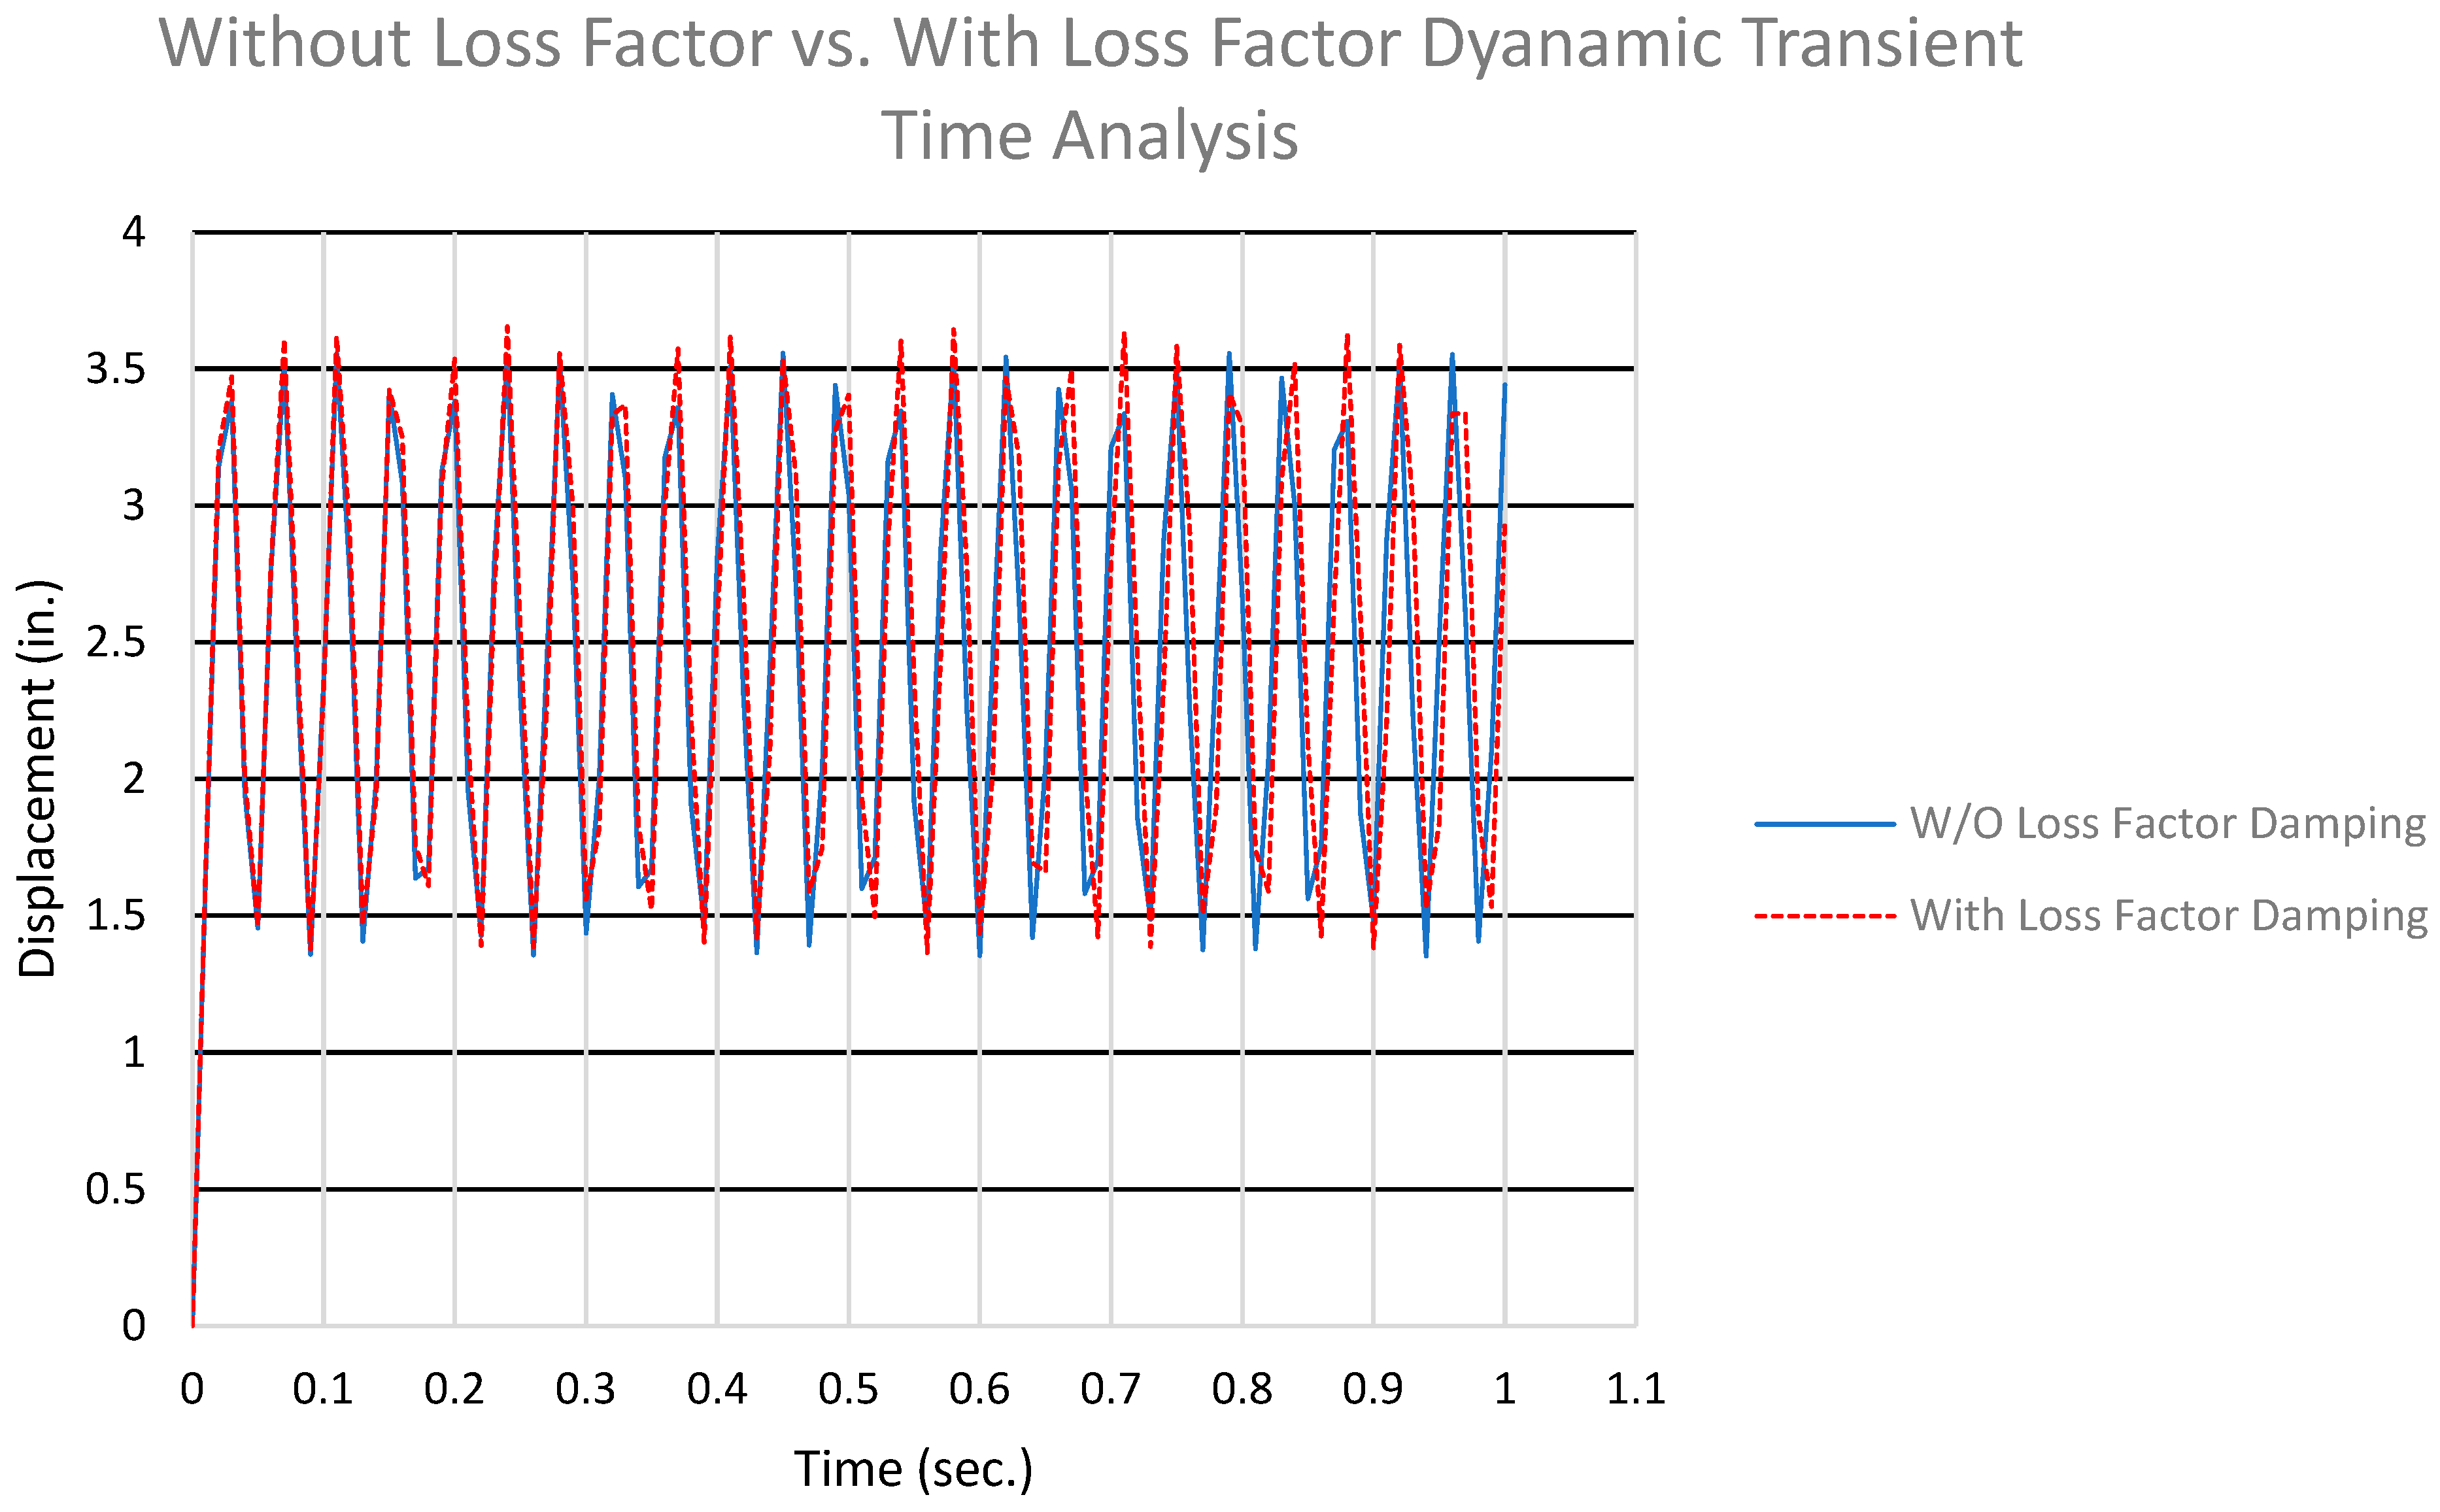
4. Frequency Response and Time Analysis for Loss Factor Damping

The dynamic frequency response analysis is performed with the original and reduced damping elastic modulus for a circular plate made out of aluminum. The dimensions of the circular plate should be noted as a radius of 12 inches and a thickness of 0.05 inches. The plate is fixed around the outer edge of the boundary. Refer to Figure 4 for the dimensional features of the plate and its FEA-representative mesh model.
To determine the frequency response of the plate, initially, the resonance frequencies of the plate had to be determined. Table 1 illustrates these resonance natural frequencies of the plate with and without the loss factor damping. Figure 5 and Figure 6 illustrate the first six modes of this circular plate with and without the loss factor damping. The circular plate’s physical properties used in this paper are the D = 24 inches (diameter), H = 0.05 inches (thickness) and mass density of 0.000254 lb/in3.
The first six modes of the resonance natural frequencies for the circular plate without the loss factor damping are shown as follows.
The first six modes of the resonance natural frequencies for the circular plate with the loss factor damping are shown as follows.
Figure 7, which follows, illustrates the frequency response analysis results for the circular plate using the FEA modeling. According to the results shown here and in Table 1, the plates without the loss factor damping have a displacement 2% lower than the plates without the loss factor damping. However, the resonance frequencies are also decayed and lower for the circular plates with the material loss factor damping at 1%. This plot only shows the first two resonance frequencies for illustrative purposes. If more resonance frequencies are requested from the FEA simulation, the same consistency in the frequency reductions would be apparent.
Figure 8, which follows, illustrates the frequency response acceleration analysis results for the circular plate using the FEA modeling. According to the results shown here and in Table 2, the plates without the loss factor damping have accelerations with a shift. However, the resonance frequencies are also decayed and lower for the circular plates with the material loss factor damping at 1%.
For the circular plate used in this paper (where the l = 24 inches, H = 0.05 inches and mass density is 0.000254 lb/in3), the C1 value of 6.877 would provide an accurate elastic modulus, E, of 10 × 106 psi (when the first resonance frequency of 34.19 Hz (Table 1) for plate without the loss factor damping is used). Note: C1, C2, C3, C4, C5 and C6 are 6.877, 14.319, 14.323, 23.479, 23.528, and 26.806, respectively.
Likewise, when the first resonance frequency of the circular plate with loss factor damping is used (33.84 Hz (Table 1)) in Equation (7), then the elastic modulus of the plate with loss factor damping is accurately determined. The elastic modulus, E, of the circular plate with loss factor damping is 9.79 × 10⁶ psi (consistent with Equation (13)). Refer to Table 3 for the calculated elastic modulus without and with loss factor damping.
For this specific numerical case, according to the frequency response shown in Figure 7, for fn = 34.19 Hz with a maximum displacement amplitude of 2.0608 in., hbw = (2.0608/21/2= 1.4572 in.) and f2 = 34.9 Hz, f1 = 34.1 Hz.
Thus, by Equation (10), the loss factor damping is determined as
η = 34.9 34.1 34.19 = 0.0233
Figure 9, which follows, illustrates the dynamic transient time analysis results for the circular plate. According to the results shown here, the plates with the loss factor damping have a displacement amplitude lower than the plates without the loss factor damping in general too. Notice that the system is undamped, as shown by the dynamics time history; however, there is a shift in the responses of the plate with the loss factor damping and the plate without the loss factor damping.

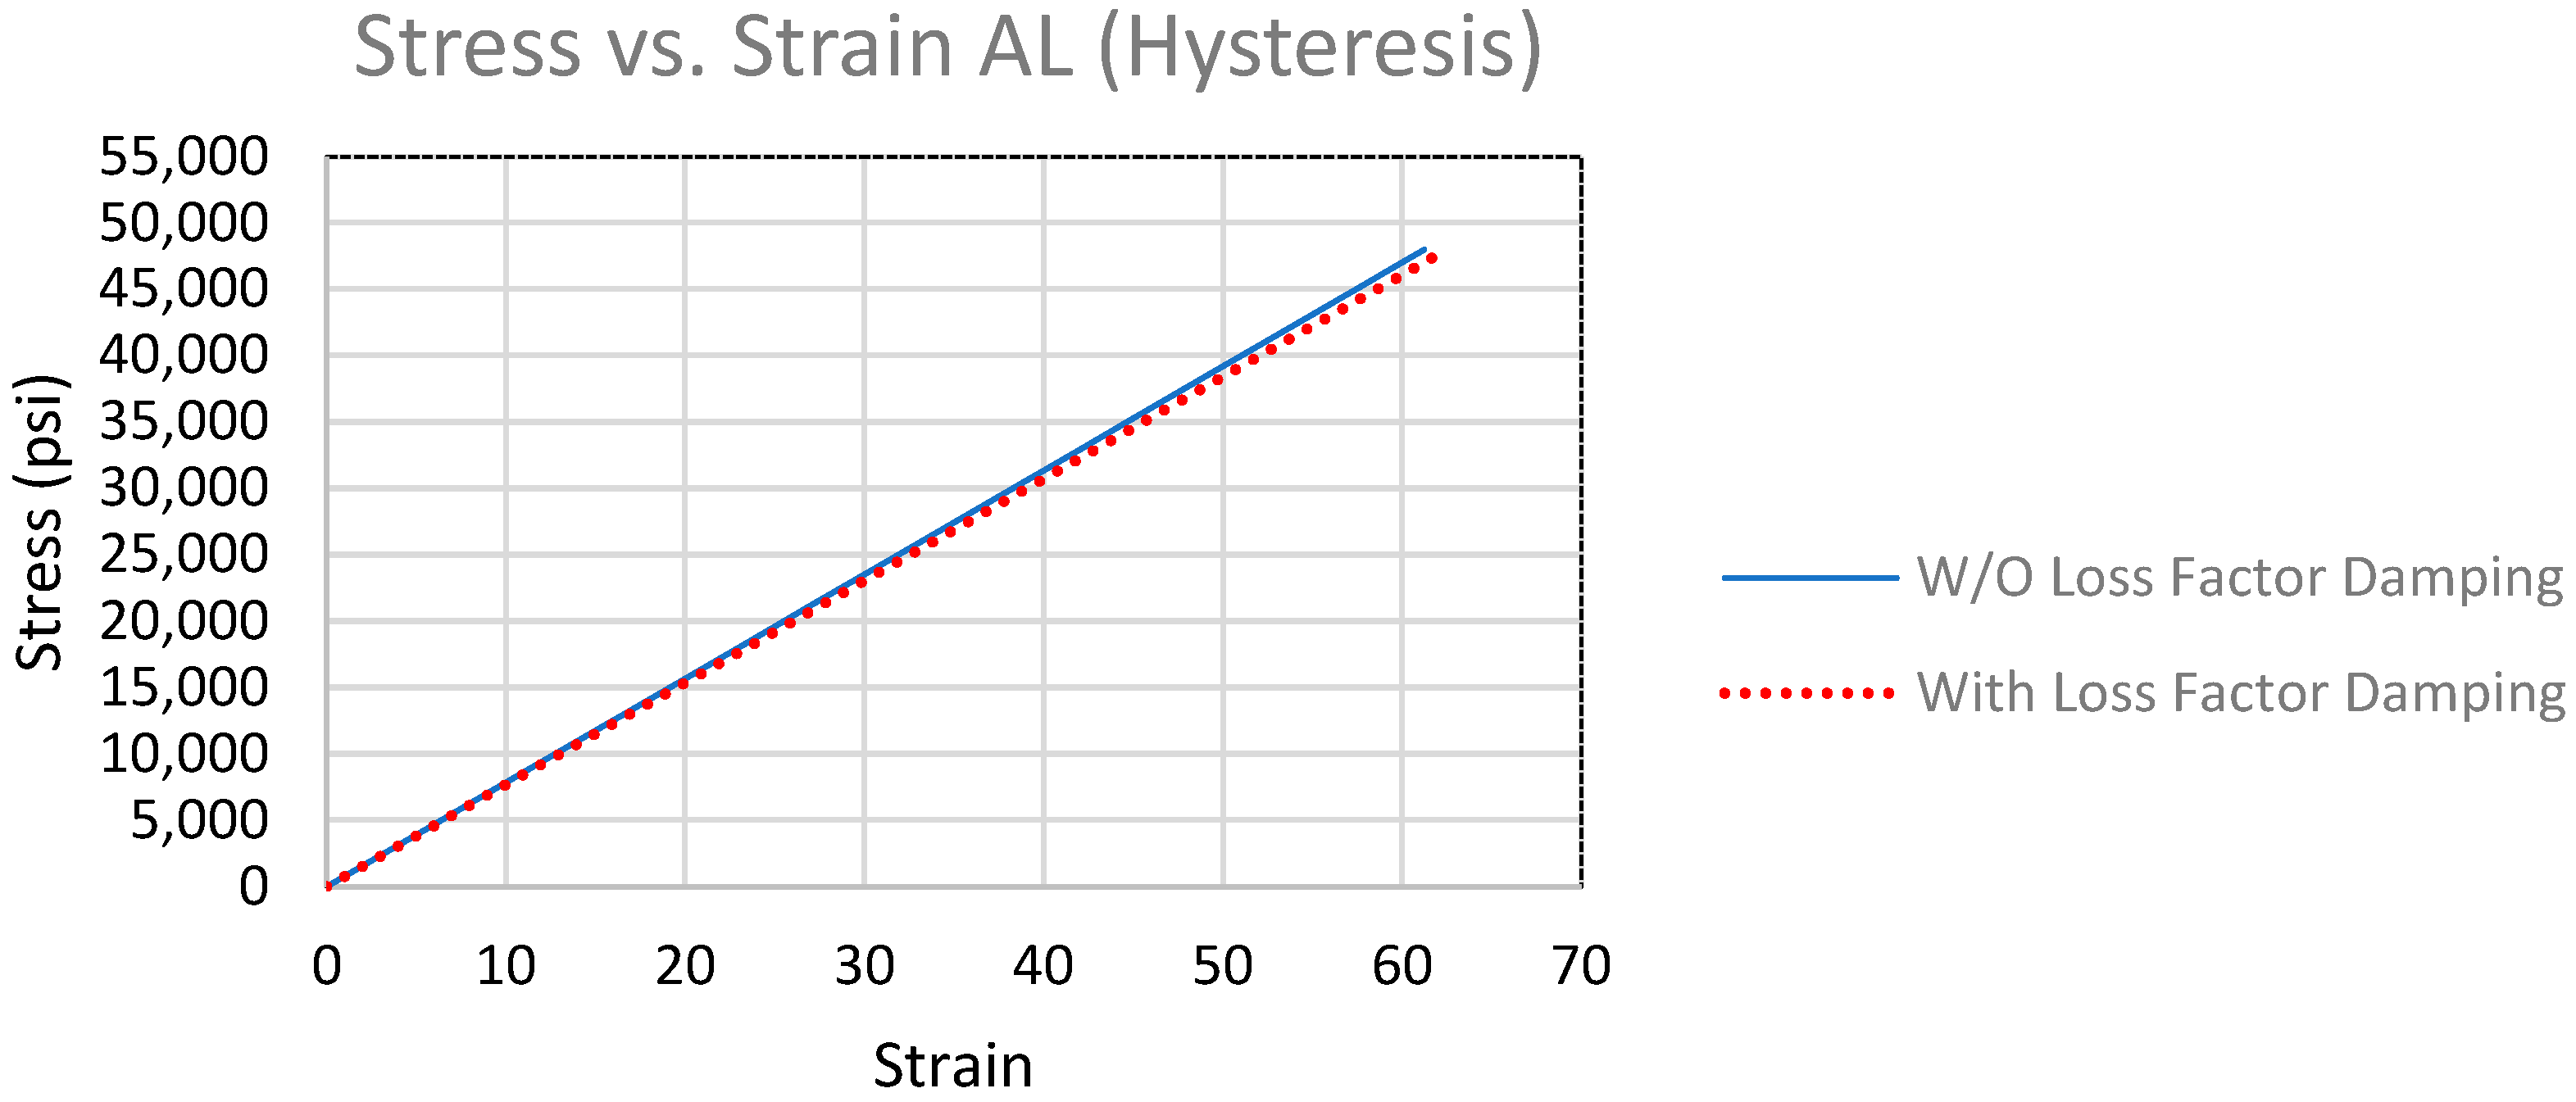
5. Fatigue Aspects of the Loss Factor Damping

When a material is subjected to a cyclic fatigue load, energy is dissipated inside the material in the form of heat due to structural material damping [29]. This increases the internal temperature of the material, which can be measured in many ways if needed. The increase in temperature can be correlated to the dissipation of energy to estimate the damping property of the material. In viscoelastic materials, the dissipation of energy due to damping during one loading cycle can be written as [30,31]
W d = π tan δ σ 2 E
Or by substitution of (Equation (6)) into (Equation (12)), one would have
W d = π η σ 2 E
where Wd and tan(δ) (also known as η ) are the dissipation of energy and loss factor damping, respectively, E is the elastic modulus of the material and σ is the stress amplitude defined by
σ = σ m a x σ m i n 2
where σmax and σmin represent the maximum and minimum stress, respectively, during the fatigue tension tests.
The heat energy dissipation, Wd, is defined in reference [29] and by manipulation of the heat transfer rate for a circular plate as it is given in reference [31], the following heat energy dissipation formulation can be derived for a circular plate configuration:
W d = ρ C d T d t + h H π D 2 4 T T a m b f
where t is the time, H is the plate thickness, ρ is the material density, C is the specific heat capacity, f is the frequency of the fatigue test, D is the diameter of the circular plate of the test specimen, Tamb is the ambient temperature, T is the measured specimen temperature and h is the natural convection heat transfer coefficient. The heat transfer coefficient h has been calculated by using the Nusselt number. Refer to reference [26] for the Nusselt number calculation methods.
The loss factor damping (η) can be evaluated by manipulation of Equations (16) and (18) as follows:
η = ρ C d T d t + h H π D 2 4 T T a m f π σ 2 E
Knowing that also η = E E by Equation (6), then the difference in the elastic modulus (E″) can be calculated as follows (when E = E′) by using the value calculated by Equation (19):
E = η E
Finally, the elastic modulus Ed due to loss factor damping (η) can be determined as
E d = E E
A MathCAD simulation was performed for an in situ case to validate the equations derived for the elastic modulus Ed due to loss factor damping (η), refer to Figure 10 for the analysis shown.

6. Conclusions

Vibration-based structural damage detection has been investigated in detail by others. The methods used mostly represent damage using either natural frequencies or mode shapes and the derived measures, such as the displacement mode shapes. Here, in this paper, a theoretical basis that was adapted from the ASTM E756-04 and other research and development work was developed. ASTM E756-04 is a complex experimental method that requires both experimental results and theoretical calculations. In the methods provided in this paper, the need for an experimental approach is eliminated.
In particular, an assumption of the static hysteresis of the aluminum material was depicted and presented as a numerical case, setting the data for the application of the frequency response and time analysis for the loss factor damping determination and Young’s modulus determination. A modal analysis was carried out to determine the resonance natural frequencies of the circular plate under the investigation. The frequency response analysis of the plate profile was carried out to determine the response displacements.
The consistency of the displacement amplitudes generated numerically and the expected theoretical means was established. Plots of the stress vs. strain curve with the original aluminum elastic modulus and the newly damped elastic modulus are illustrated in Figure 3 for comparison purposes. The 2% elastic modulus reduction shown by Equation (15) is consistent with a 2% displacement reduction without the material loss factor damping. According to the results shown in Table 1, the plates with the loss factor damping have a displacement 2% lower than the plates without the loss factor damping. This indicates that the numerical approach in this study is adequate and valid as a source for capturing the material loss factor damping. However, the resonance frequencies are also decayed and lower for the circular plates with the material loss factor damping at 1%. Validation of the elastic modulus for a circular plate per derivations that are adapted from the ASTM standards was developed and carried out successfully.
The fatigue aspects of the loss factor damping and how it correlates to the energy heat dissipation were established and the groundwork for further validation for experimental work was performed for validation of the experimental results for fatigue analysis.

Funding

This research received no external funding.

Institutional Review Board Statement

Not applicable.

Informed Consent Statement

Not applicable.

Data Availability Statement

The simulation data generated are available for examination and publication.

Conflicts of Interest

The author has no intellectual and financial conflicts of interest to disclose concerning the data and the decision to publish this paper in this journal.

Nomenclature

cviscous damping
Cspecific heat
Cncoefficient associated with mode n
ddiameter of the circular plate (2r)
Dstiffness of the plate
Eelastic modulus
Edelastic modulus due to loss factor damping
Estorage modulus
Edifference in elastic modulus
ffatigue frequency
fnresonance frequency, n mode
Gshear modulus
hcoefficient of heat transfer
Hplate thickness
kspring stiffness
lbeam length
mmass
rradius of the circular plate
vPoisson’s ratio
ttime
Ttemperature
Tambambient temperature
wddissipation energy
dloss angle
estrain
ρdensity
hloss factor damping
σstress
wnangular natural frequency, n-mode
zcoefficient of viscous damping factor

Appendix A

Data from other research work performed via computational methods from a study using COMSOL.
Figure A1. Harmonic strain history (Sonnerlind, Henrik, 2019).
Jeta 03 00009 g0a1
Image from the COMSOL blog post “Damping in Structural Dynamics: Theory and Sources” by Henrik Sönnerlind, published on 14 March 2019 at https://www.comsol.com/blogs/damping-in-structural-dynamics-theory-and-sources (accessed on 1 September 2024).
Table A1. Different material loss factor damping [20]. References for different materials.
MaterialLoss Factor
Aluminum0.0001–0.02
Concrete0.02–0.05
Copper0.001-0.05
Glass0.0001–0.005
Rubber0.05–2
Steel0.0001–0.01

References

  1. Carden, E.P.; Fanning, P. Vibration based condition monitoring: A review. Struct. Health Monit. 2004, 3, 355–377. [Google Scholar] [CrossRef]
  2. Yan, Y.J.; Cheng, L.; Wu, Z.Y.; Yam, L.H. Development in vibration-based structural damage detection technique. Mech. Syst. Signal Process. 2007, 21, 2198–2211. [Google Scholar] [CrossRef]
  3. Fan, W.; Qiao, P. Vibration-based damage identification methods: A review and comparative study. Struct. Health Monit. 2011, 10, 83–111. [Google Scholar] [CrossRef]
  4. Salawu, O.S. Detection of structural damage through changes in frequency: A review. Eng. Struct. 1997, 19, 718–723. [Google Scholar] [CrossRef]
  5. Sapri, R.C. Mechanical Vibrations: Measurement, Effects and Control; Nova Science Publishers, Inc.: New York, NY, USA, 2009; pp. 643–702, INBS 978 1-60692-037-4. [Google Scholar]
  6. Zou, Y.; Tong, L.; Steven, G.P. Vibration-based model dependent damage (delamination) identification and health monitoring for composite structures—A review. J. Sound Vib. 2000, 230, 357–378. [Google Scholar] [CrossRef]
  7. Chang, P.C.; Flatau, A.; Liu, S.C. Review paper: Health monitoring of civil structures. Int. J. Struct. Health Monit. 2003, 2, 257–267. [Google Scholar] [CrossRef]
  8. Montalvao, D.; Maia, N.M.M.; Ribeiro, A.M.R. A review of vibration-based structural health monitoring with special emphasis on composite materials. Shock Vib. Dig. 2006, 38, 295–326. [Google Scholar] [CrossRef]
  9. Pandey, A.K.; Biswas, M.; Samman, M.M. Damage detection from changes in curvature mode shapes. J. Sound Vib. 1991, 145, 321–332. [Google Scholar] [CrossRef]
  10. Zhang, J.; Jin, Z.; Teng, S.; Chen, G.; Bassir, D. Structural damage detection based on decision-level fusion with multi-vibration signals. Meas. Sci. Technol. 2022, 33, 105112. [Google Scholar] [CrossRef]
  11. Cao, M.; Xu, W.; Ostachowicz, W.; Su, Z. Damage identification for beams in noisy conditions based on Teager energy operator-wavelet transform modal curvature. J. Sound Vib. 2014, 333, 1543–1553. [Google Scholar] [CrossRef]
  12. Xu, W.; Cao, M.; Ostachowicz, W.; Radzieński, M.; Xia, N. Two-dimensional curvature mode shape method based on wavelets and Teager energy for damage detection in plates. J. Sound Vib. 2015, 347, 266–278. [Google Scholar] [CrossRef]
  13. Cao, M.; Radzieński, M.; Xu, W.; Ostachowicz, W. Identification of multiple damage in beams based on robust curvature mode shapes. Mech. Syst. Signal Process. 2014, 46, 468–480. [Google Scholar] [CrossRef]
  14. Cao, M.S.; Xu, W.; Ren, W.X.; Ostachowicz, W.; Sha, G.G.; Pan, L.X. A concept of complex-wavelet modal curvature for detecting multiple cracks in beams under noisy conditions. Mech. Syst. Signal Process. 2016, 76, 555–575. [Google Scholar] [CrossRef]
  15. Farrar, C.R.; Jauregui, D.A. Comparative study of damage identification algorithms applied to a bridge: I. Experiment. Smart Mater. Struct. 1998, 7, 704–719. [Google Scholar] [CrossRef]
  16. Baruch, M.; Ratan, S. Damage Detetction in Flexible Strctures. J. Sound Vibrtion 1993, 166, 21–30. [Google Scholar] [CrossRef]
  17. Dammika, A.J.; Kawarai, K.; Yamaguchi, H.; Matsumoto, Y.; Yoshioka, T. Experimental-analytical framework for damping change-based structural health monitoring of bridges. In Research Report of Department of Civil and Environmental Engineering; Saitama University: Saitama, Japan, 2015; Volume 41. [Google Scholar]
  18. Nashif, A.D.; Jones, D.I.; Henderson, J.P. Vibration Damping; Wiley: New York, NY, USA, 1985. [Google Scholar]
  19. Beards, C. Structural Vibration: Analysis and Damping; Arnold: London, UK, 1996. [Google Scholar]
  20. Jeary, A.P. Damping in structures. J. Wind Eng. Ind. Aerodyn. 2017, 72, 345–355. [Google Scholar] [CrossRef]
  21. Slavič, J.; Simonovski, I.; Boltežar, M. Damping identification using a continuous wavelet transform: Application to real data. J. Sound Vib. 2003, 262, 291–307. [Google Scholar] [CrossRef]
  22. Zhang, H.; Yang, J.; Xiao, L. Damping ratio identification using a continuous wavelet transform to vortex-induced motion of a Truss Spar. Ships Offshore Struct. 2014, 9, 596–604. [Google Scholar] [CrossRef]
  23. Schaller, C. Polymer Chemstry; Saint John’s University, LibreTexts: 2024. Available online: https://chem.libretexts.org/Bookshelves/Organic_Chemistry/Polymer_Chemistry_(Schaller) (accessed on 1 September 2024).
  24. Sonnerlind, H. Damping in Structural Dynamics: Theory and Sources; COMSOL: Stockholm, Sweden, 2019. [Google Scholar]
  25. Liu, X.; Feng, Q. Statistical energy analysis of tire/road noise. In Automotive Tire Noise and Vibrations; Butterworth-Heinemann Publishing: Oxford, UK, 2020. [Google Scholar]
  26. Pereira, R.; Arenas, J.P.; Zumelzu, E. Comparison of four test methods to measure damping properties of materials by using piezoelectric transducers. J. Mater. Des. 2011, 32, 2423–2428. [Google Scholar] [CrossRef]
  27. ASTM E756-04; Standard Test Method for Measuring Vibration-Damping Properties of Materials. American Society for Testing and Materials: West Conshohocken, PA, USA, 2004.
  28. Kelly, P.A. Mechanics. Lecture Notes: An Introduction to Solid Mechanics. 2024. Available online: http://homepages.engineering.auckland.ac.nz/~pkel015/SolidMechanicsBooks/index.html (accessed on 1 September 2024).
  29. Khoshmanesh, S.; Watson, S.J.; Zarouchas, D. The effect of the fatigue damage accumulation process on the damping and stiffness properties of adhesively bonded composite structures. J. Compos. Struct. 2022, 287, 115328. [Google Scholar] [CrossRef]
  30. Incropera, F.P.; DeWitt, D.P.; Bergman, T.L.; Lavine, A.S. Fundamentals of Heat and Mass Transfer; Wiley: New York, NY, USA, 1996; Volume 6. [Google Scholar]
  31. Radziemska, E.; Lewandowski, W.M. Experimental Investigations of Natural Convection from Circular Plates at Variable Inclination. J. Thermophys. Heat Transf. 2007, 21, 813–816. [Google Scholar] [CrossRef]
Figure 1. Stress–strain hysteresis for the steady–state harmonic vibration complete period [23].
Jeta 03 00009 g001
Figure 2. Vibration analysis process flow to prove the loss factor damping effects.
Jeta 03 00009 g002
Figure 3. Comparison plots of the stress vs. strain for aluminum material with and without loss factor damping (η).
Jeta 03 00009 g003
Figure 4. Circular plate model and FEA representative mesh model (fixed boundary).
Jeta 03 00009 g004
Figure 5. The resonance natural frequencies of the circular plate without the loss factor damping.
Jeta 03 00009 g005
Figure 6. The resonance natural frequencies of the circular plate with the loss factor damping.
Jeta 03 00009 g006
Figure 7. Frequency response displacements of the circular plate with and without the loss factor damping.
Jeta 03 00009 g007
Figure 8. Frequency response accelerations of the circular plate with and without the loss factor damping.
Jeta 03 00009 g008
Figure 9. Dynamic transient time analysis of the circular plate with and without the loss factor damping.
Jeta 03 00009 g009
Figure 10. MathCAD 15 simulation of the equation developed for the elastic modulus, Ed, due to loss factor damping.
Jeta 03 00009 g010
Table 1. The circular plate frequency resonance displacements.
ResonanceWithout Loss Factor DampingWith Loss Factor Damping
Frequency (Hz)Displacement (in.)Frequency (Hz)Displacement (in.)
134.192.060833.842.1028
271.190.002770.480.0028
371.220.002770.500.0028
4116.740.0085115.570.0087
5116.990.0087115.810.0089
6133.280.2438131.940.2488
Table 2. The circular plate resonance frequencies’ accelerations.
ResonanceWithout Loss Factor DampingWith Loss Factor Damping
Frequency (Hz)Accel
(in./sec2)
Frequency (Hz)Accel
(in./sec2)
134.1995,111.7233.8495,111.52
271.19553.9170.48553.91
371.22553.0970.5553.10
4116.744589.19115.574589.23
5116.994693.00115.814692.98
6133.28170,971.48131.94170,971.27
Table 3. The circular plate resonance frequencies with calculated elastic modulus.
ResonanceWithout Loss Factor DampingWith Loss Factor Damping
Frequency (Hz)Elastic Modulus (psi)Frequency (Hz)Elastic Modulus (psi)
134.1910,000,00033.849,799,000
271.1910,000,00070.489,800,000
371.2210,000,00070.509,800,000
4116.7410,000,000115.579,800,000
5116.9910,000,000115.819,799,000
6133.2810,000,000131.949,799,000
Disclaimer/Publisher’s Note: The statements, opinions and data contained in all publications are solely those of the individual author(s) and contributor(s) and not of MDPI and/or the editor(s). MDPI and/or the editor(s) disclaim responsibility for any injury to people or property resulting from any ideas, methods, instructions or products referred to in the content.

