

Experimental Evaluation of Dry and Contactless Cleaning Methods for the Production of Digital Vehicle Dashboards

 ,
,
Abstract
1. Introduction
2. Selection and Application of the Test Contaminants
3. Selecting the Measurement Technology
4. Experimental Setup
5. Design of Experiments (DoE)
6. Procedure
- (I)
- Damp wipingSince only 10 lightguides were available for the planned 30 experiments, they had to be cleaned before each new loop. For this purpose, the entire surface of the lightguides was wiped with a damp cleanroom cloth (product: Contec Prosat PS 911 BRP).
- (II)
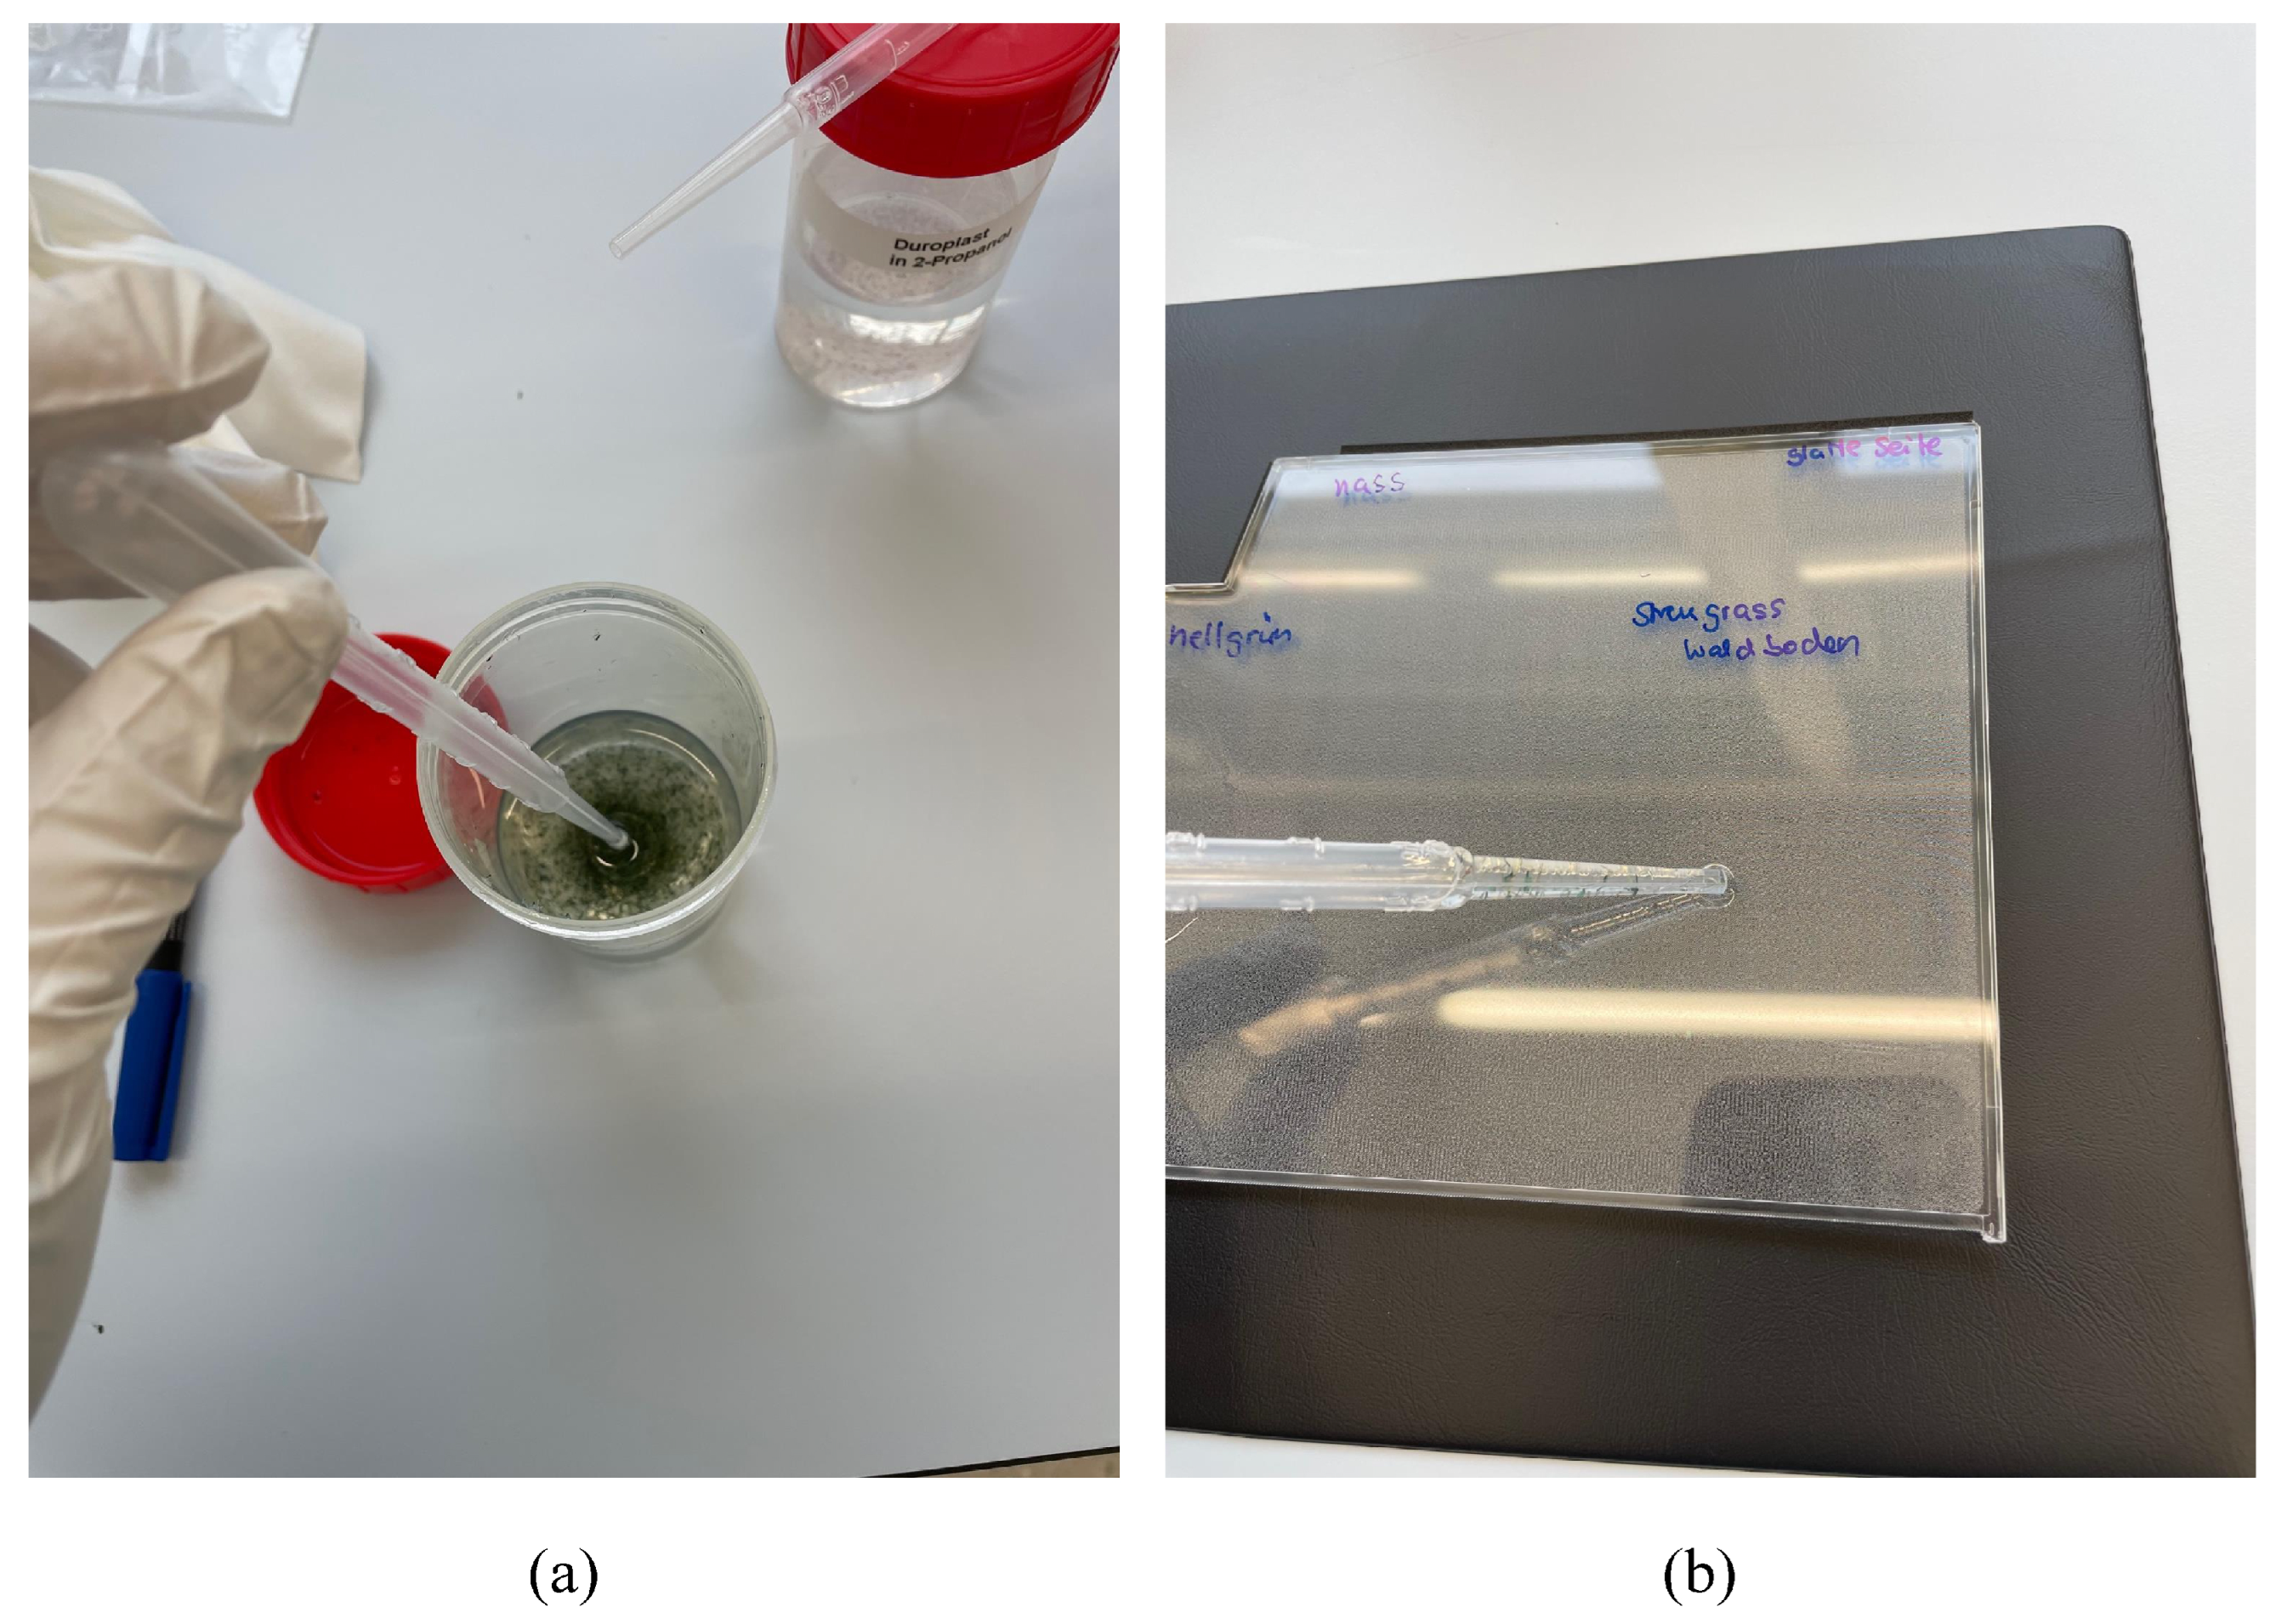
- Particle applicationThe respective test contamination was applied to the test areas, with there being four in total for each lightguide.
- (III)
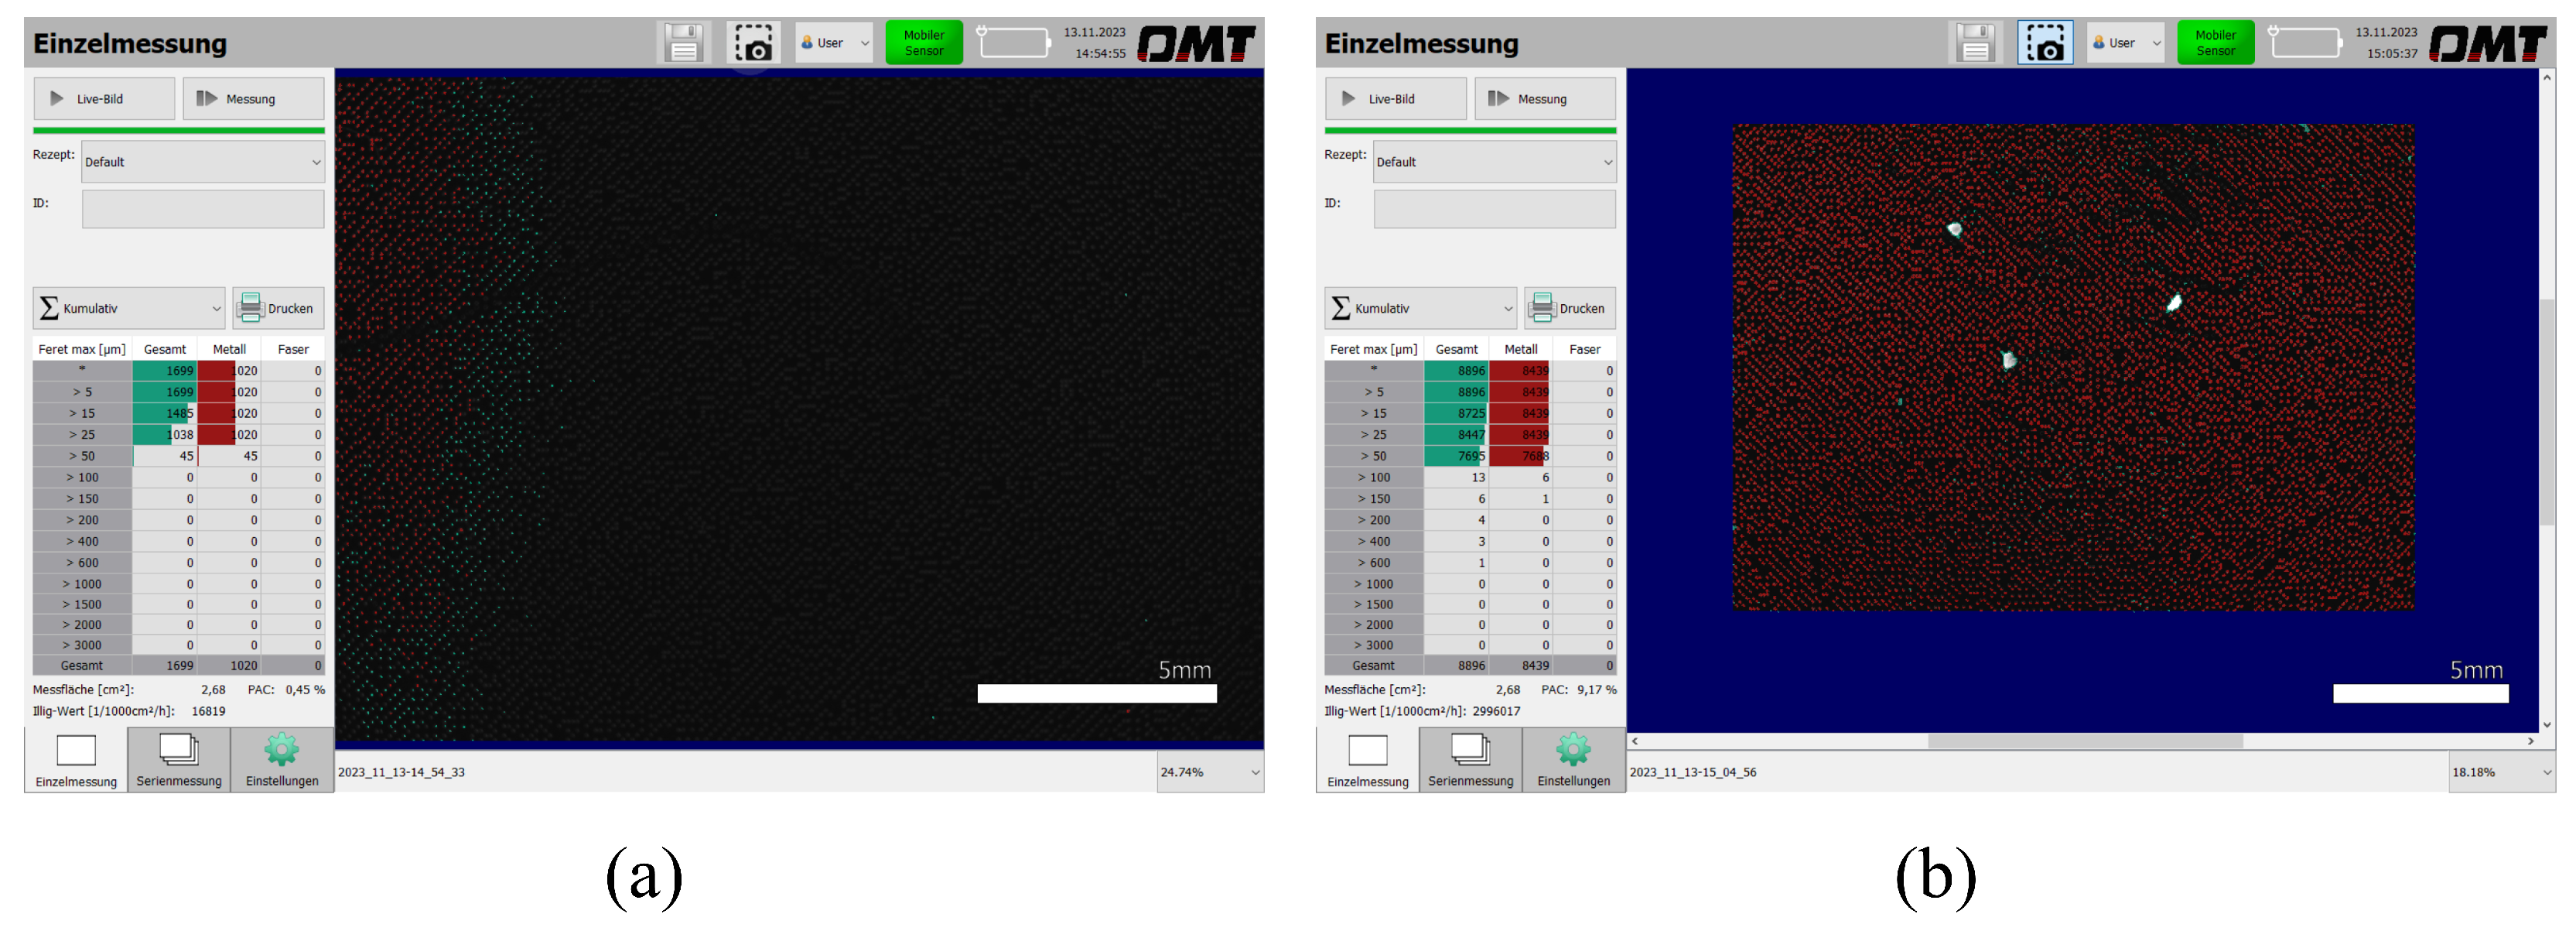
- Particle analysisAfter the contamination liquid evaporated, the measuring head of the PartSens 4.0 was placed on the four test areas one after the other to determine the quantity of test contamination applied (before cleaning).
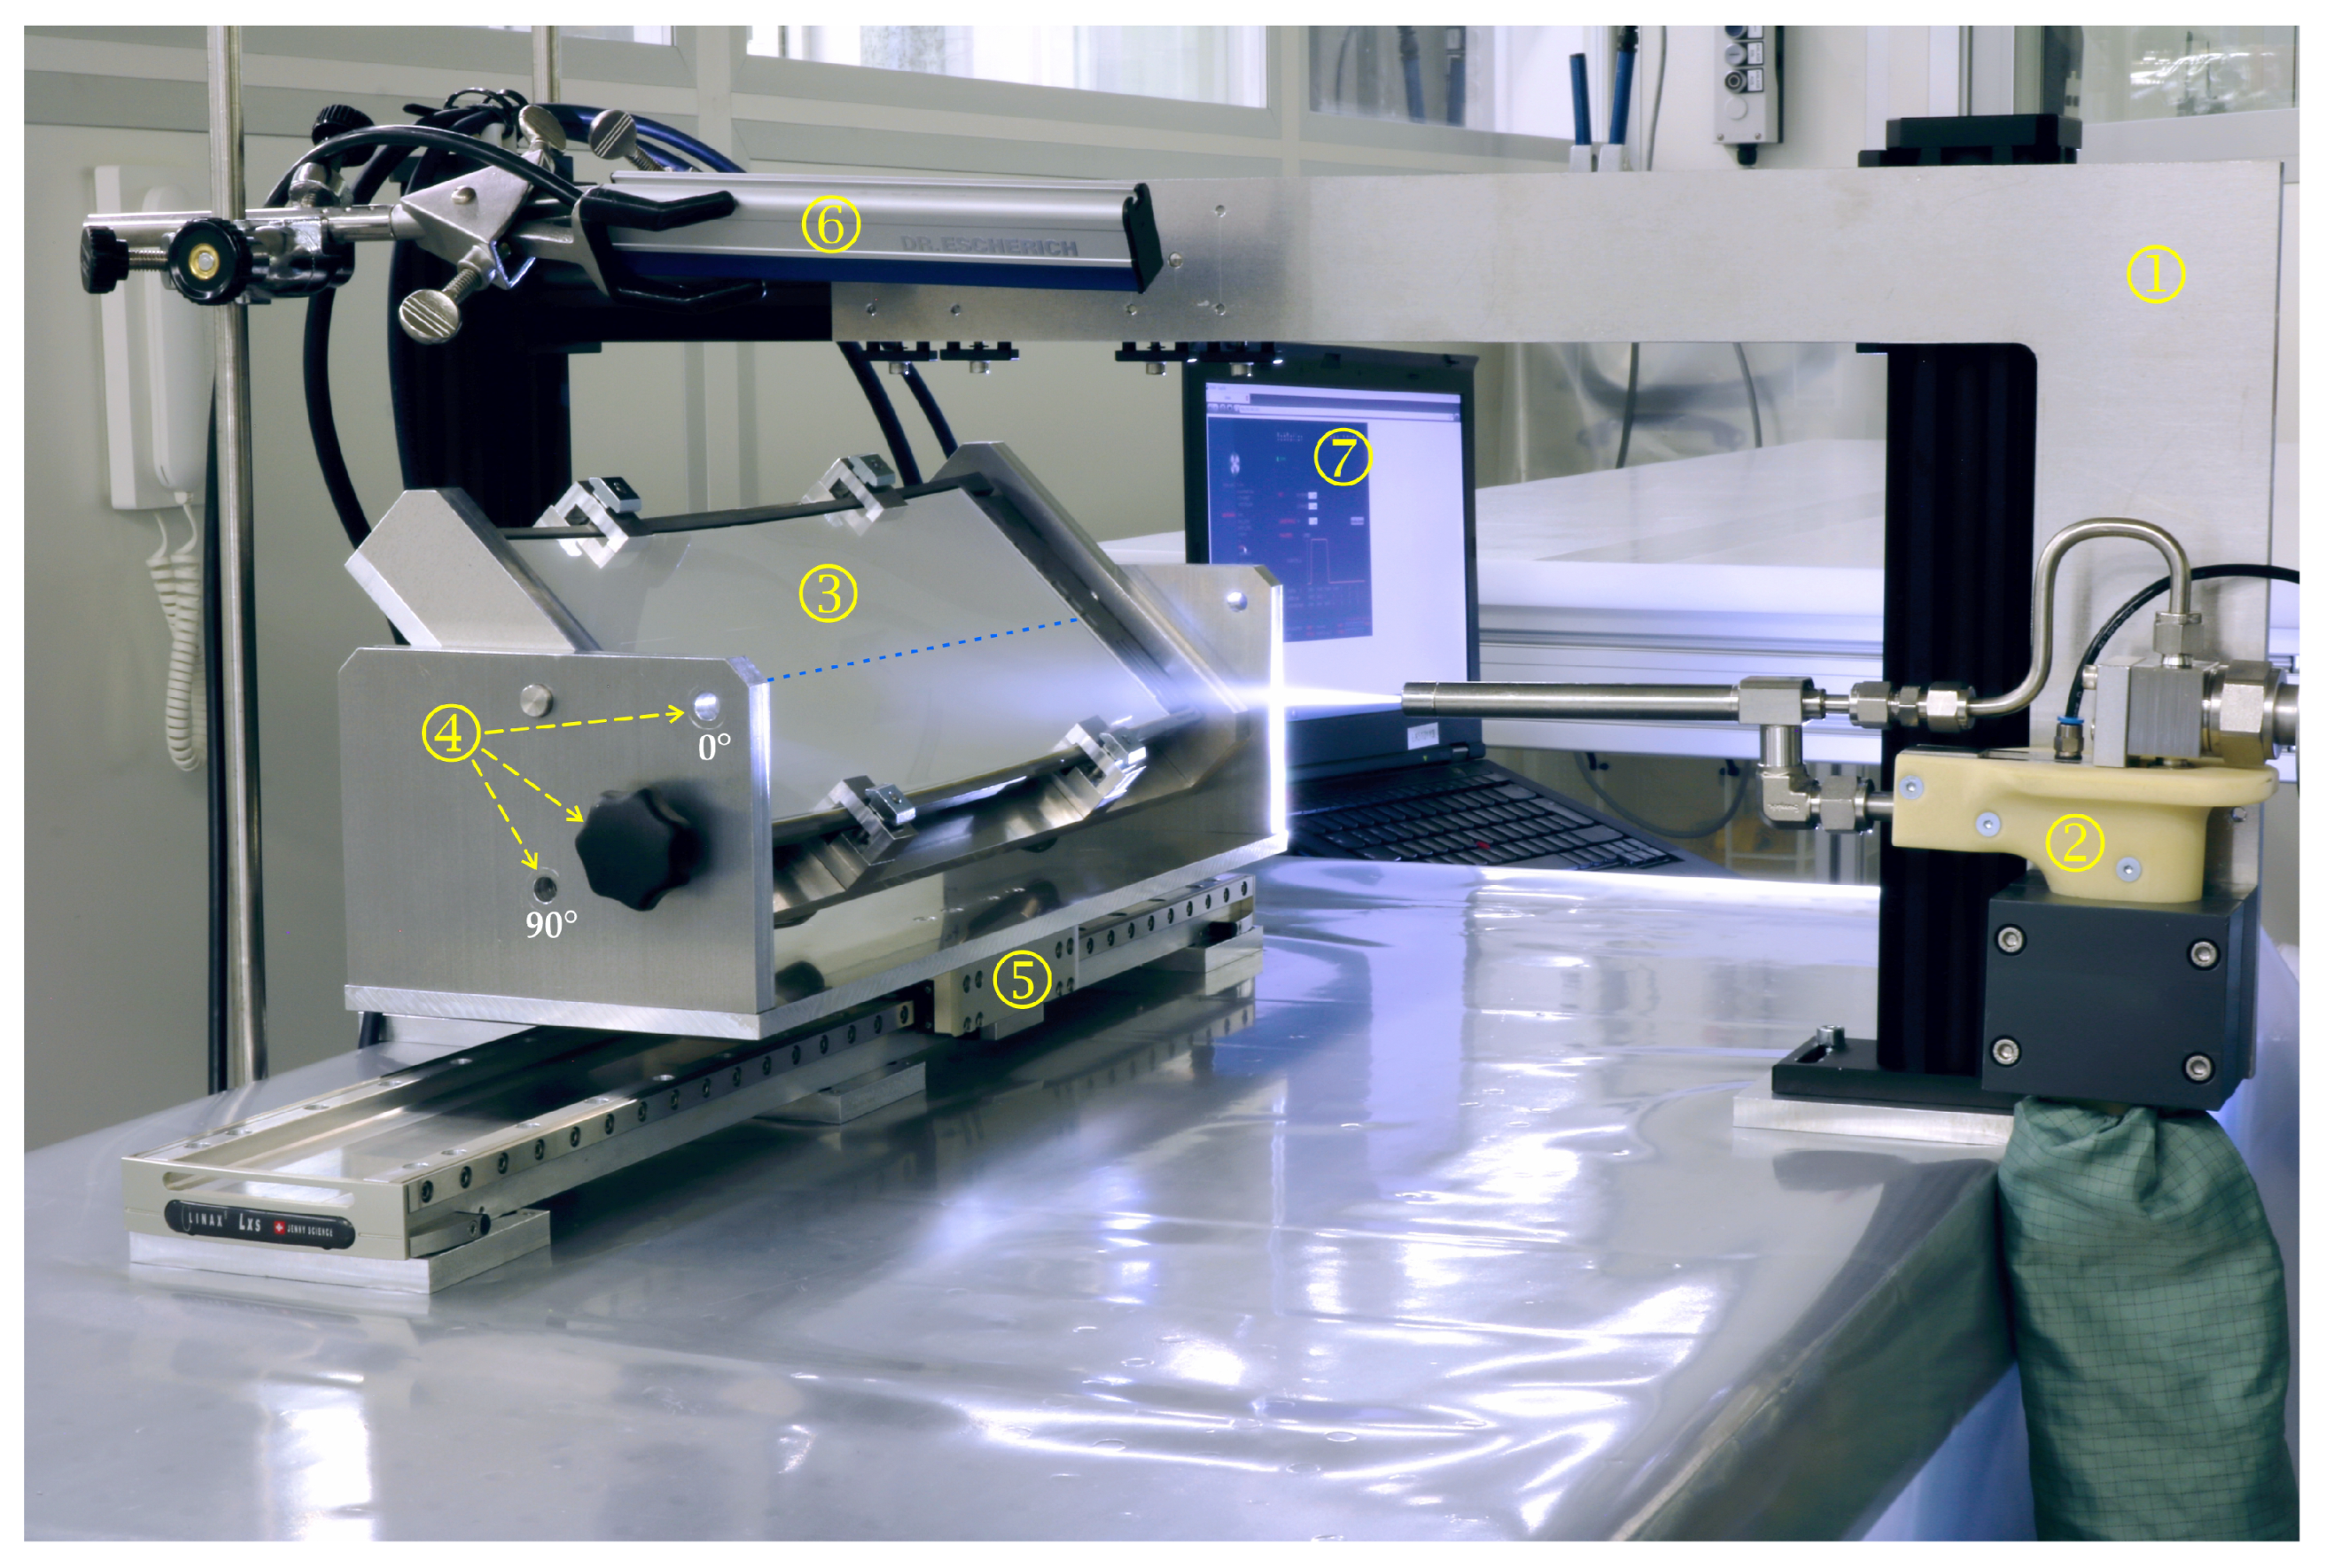
- (IV)
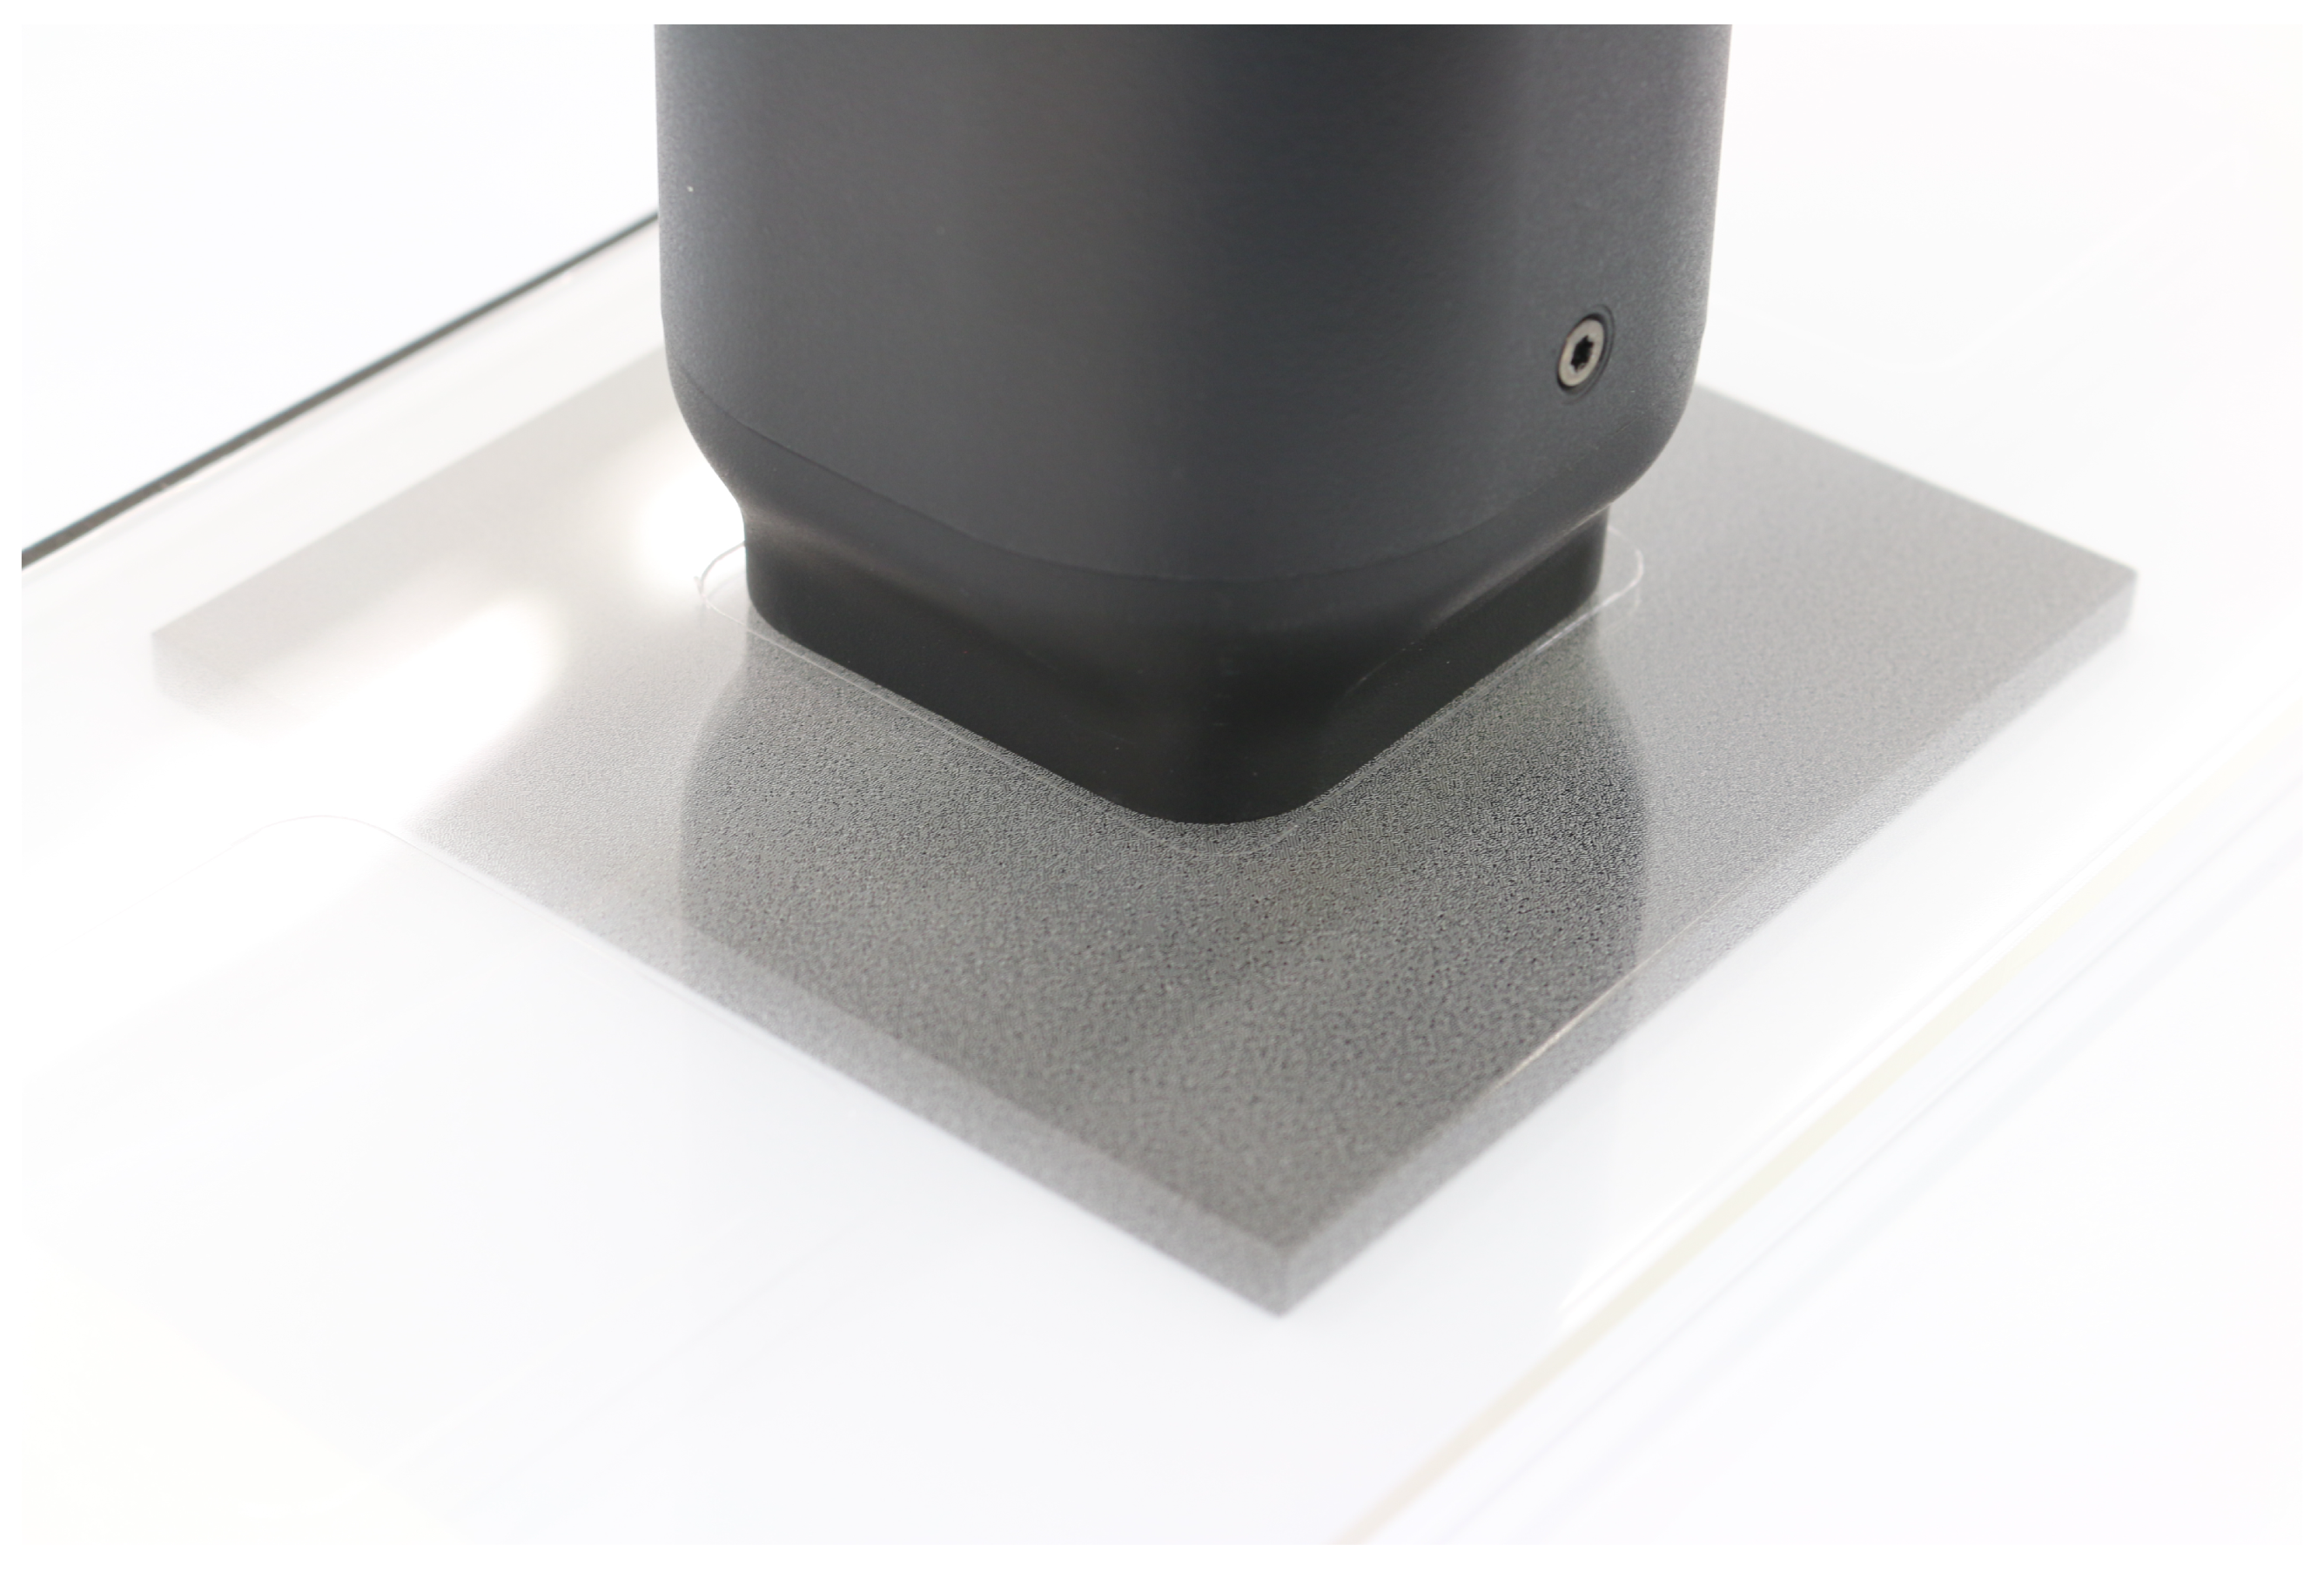
- CleaningAfter the lightguide was clamped in the test setup and the test parameters were set, the cleaning step was carried out. In doing so, the linear axis moved from its initial to its end position (see Figure 7).
- (V)
- Particle analysisAfter cleaning, the lightguide was removed from the test setup and—analogous to Step (III)—the quantity of residual test contamination on each test area was determined. The difference between the two quantities indicates the cleaning efficacy.
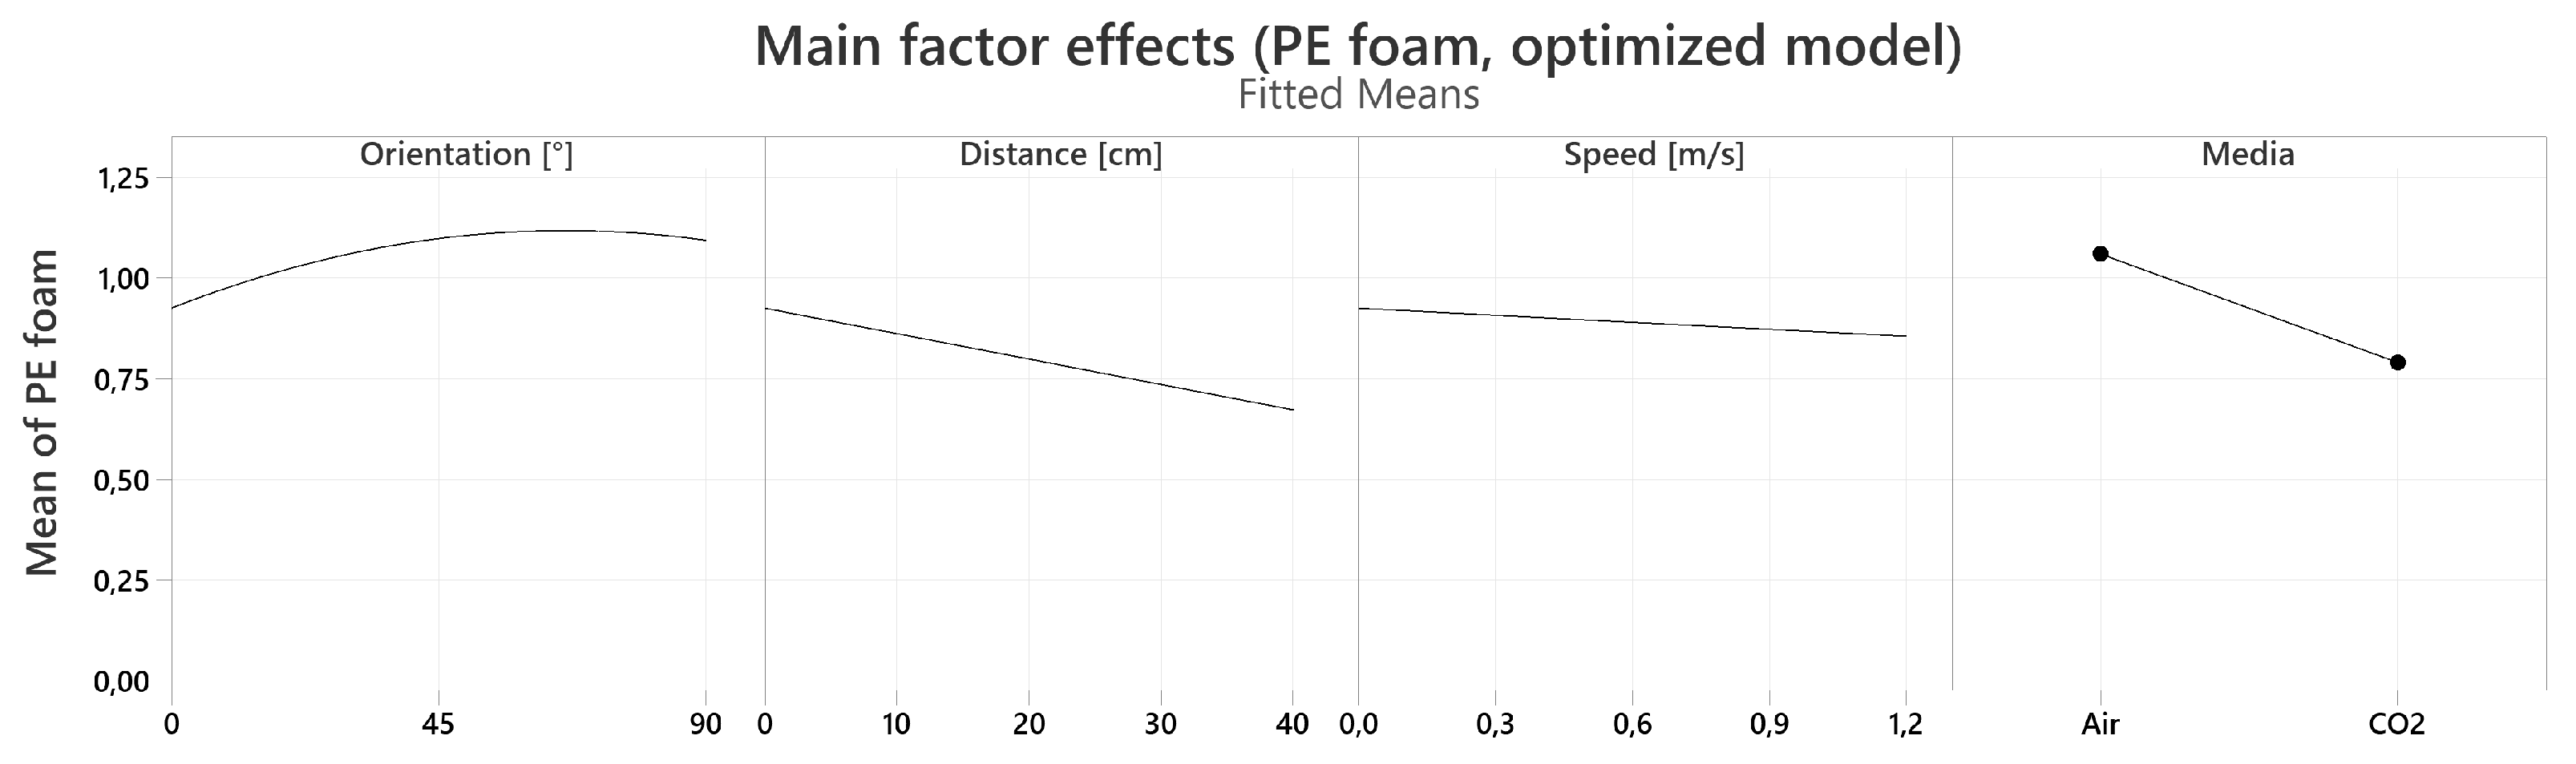
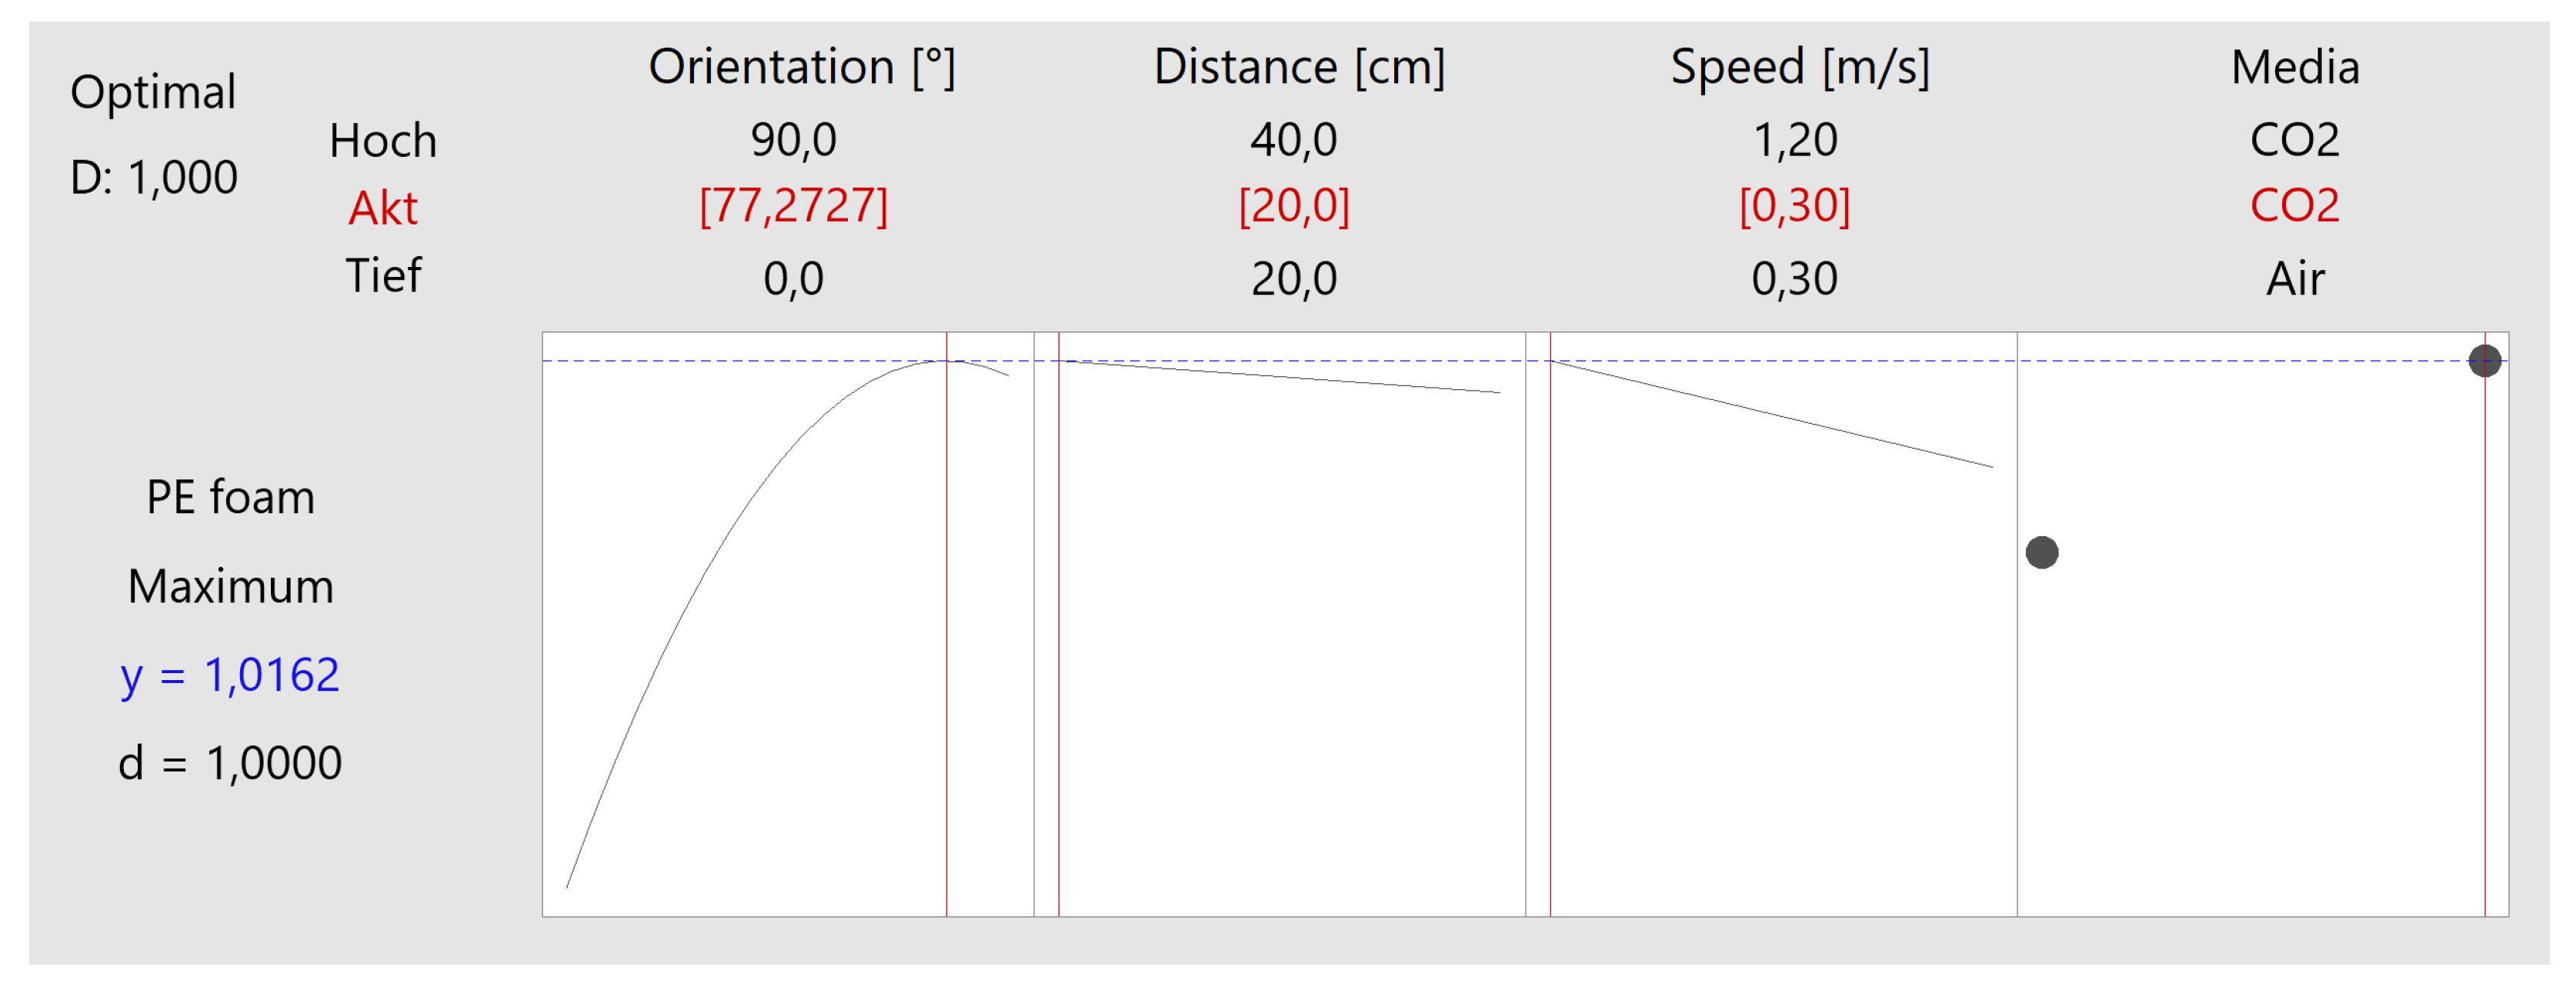
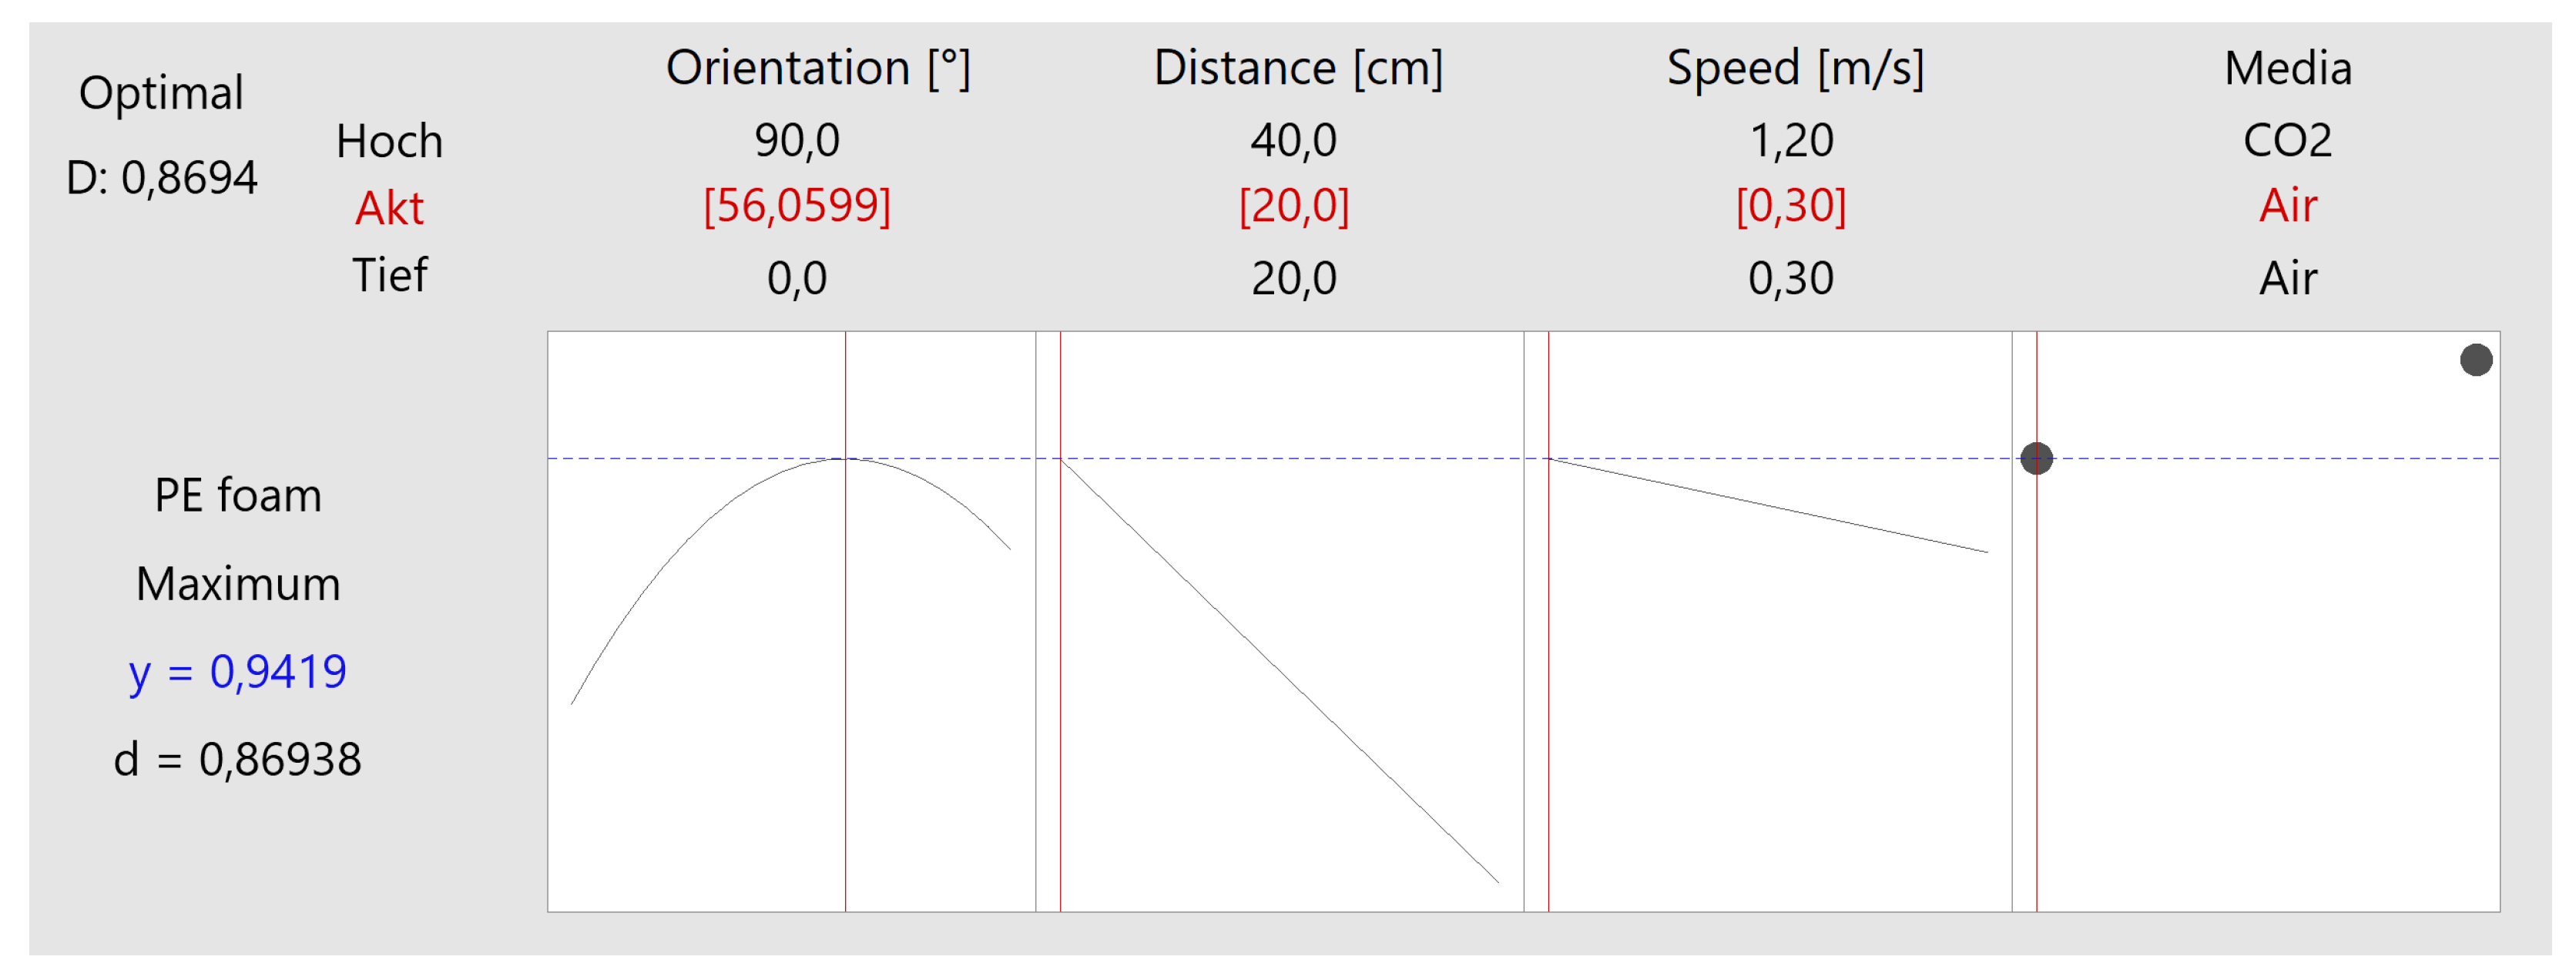
7. Discussion

- Orientation: 77.27°
- Distance: 20 cm
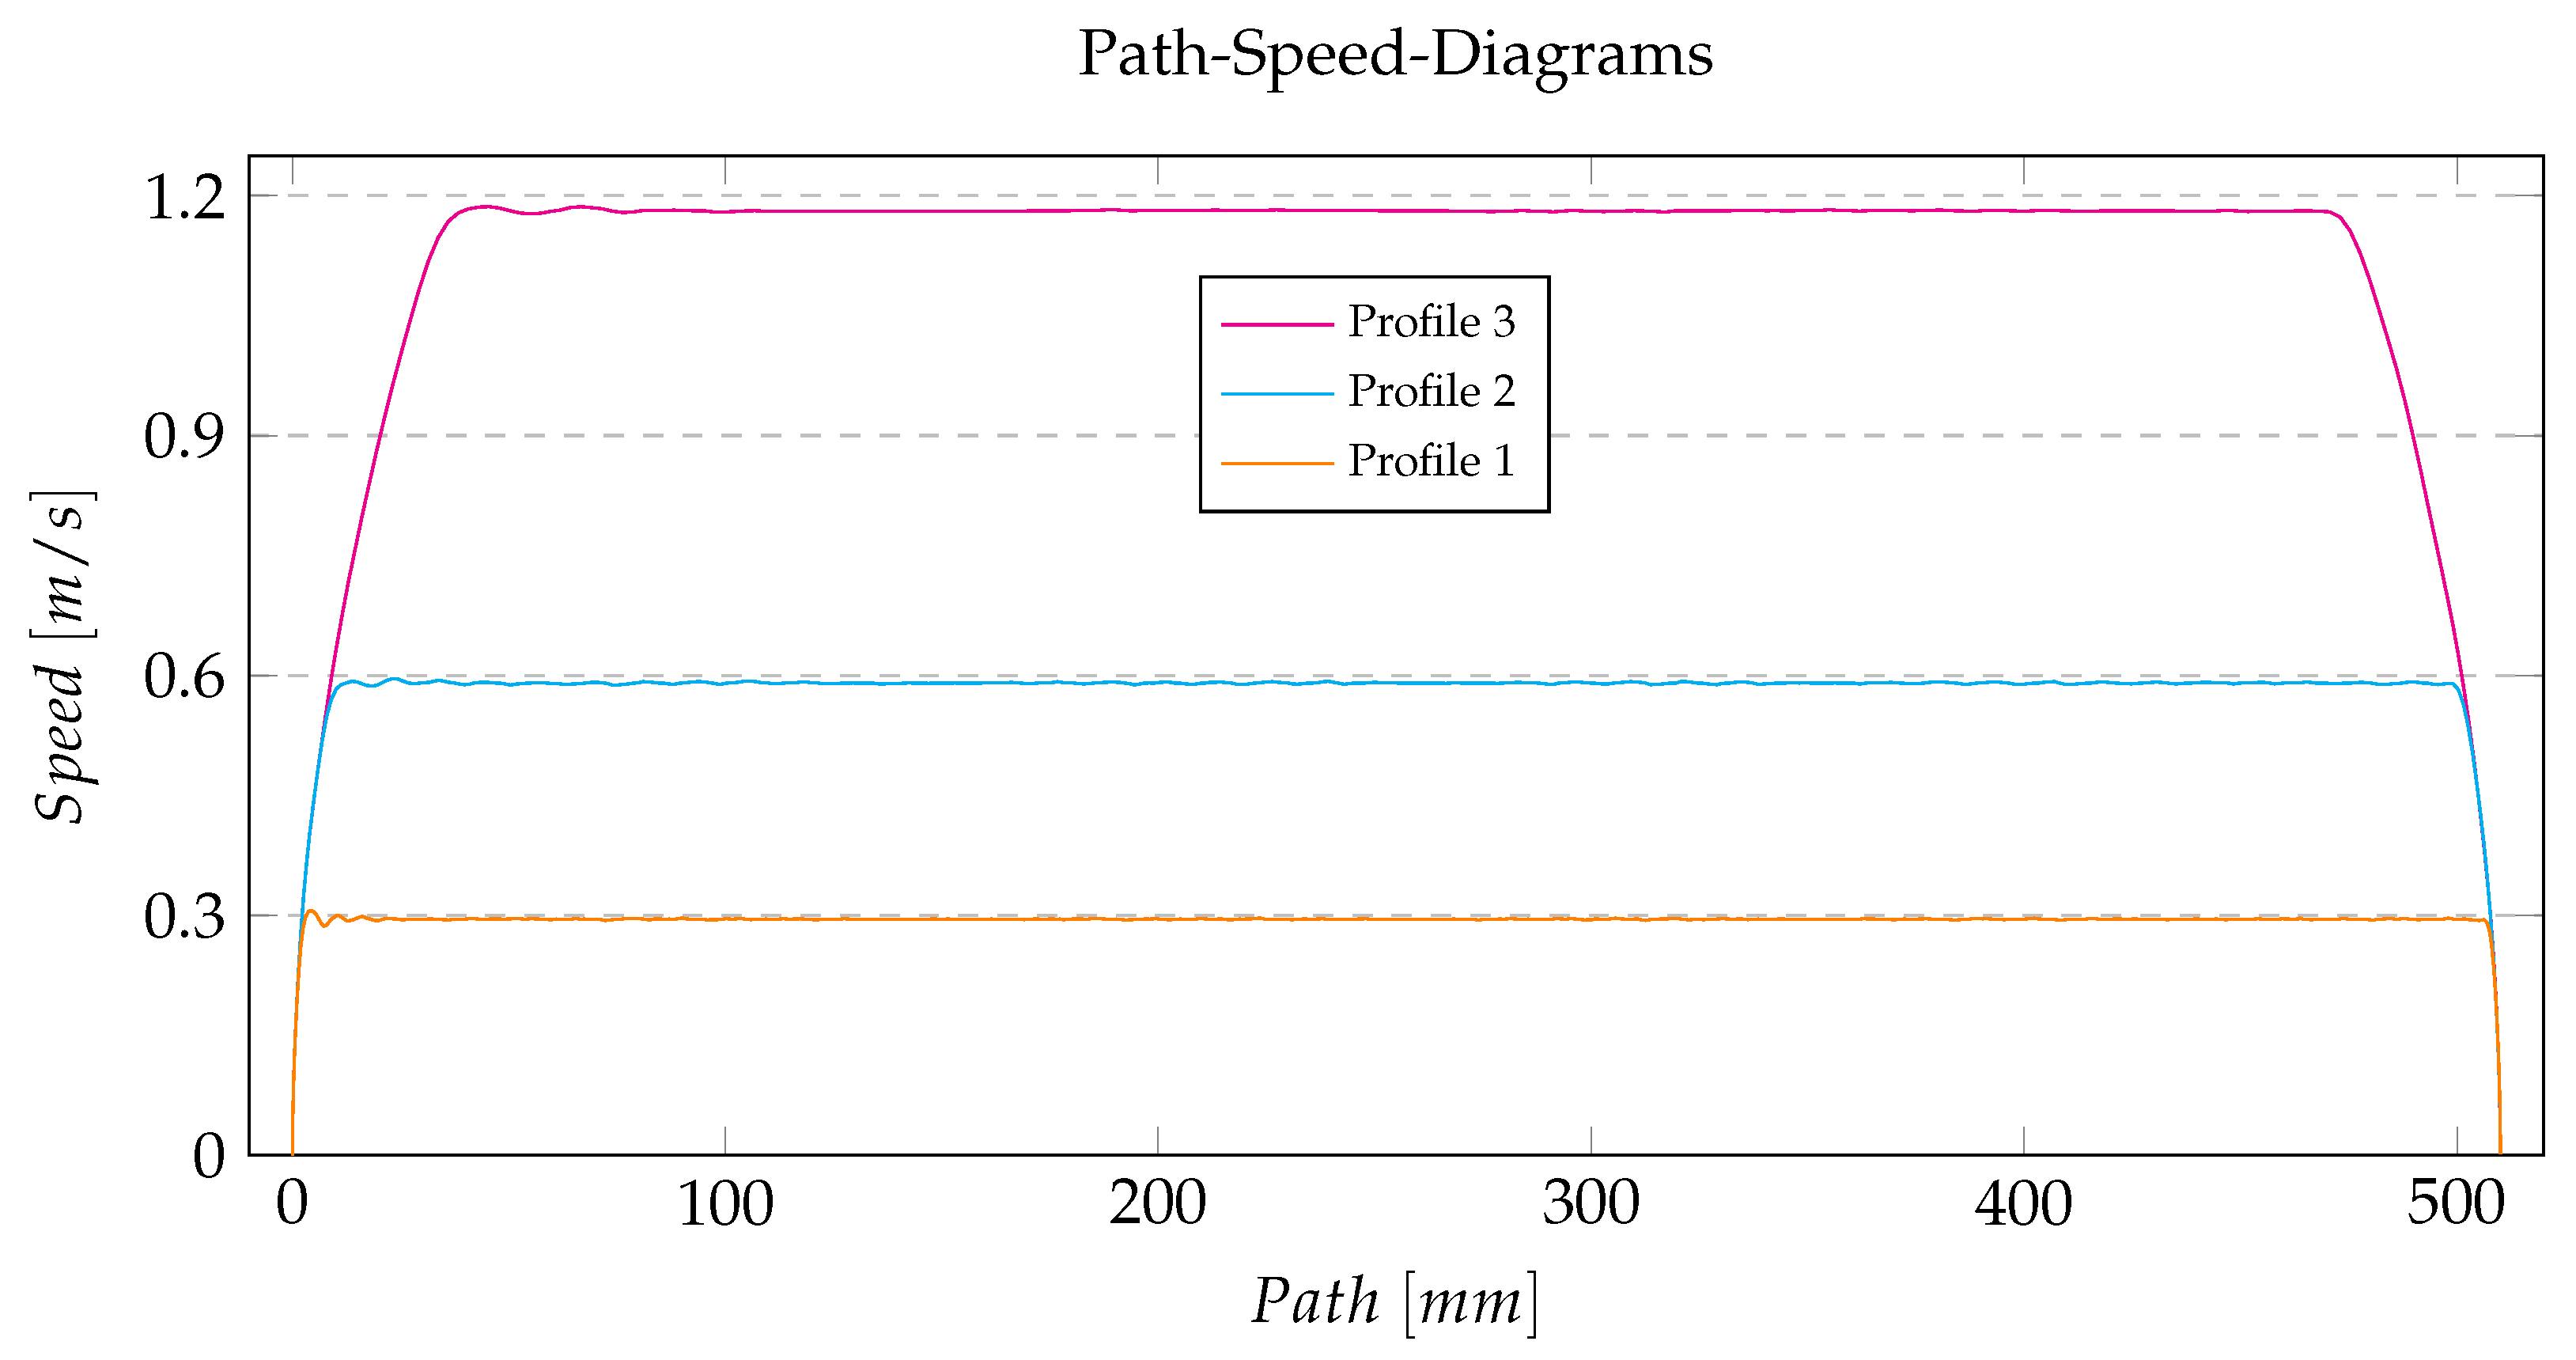
- Speed: 0.3 ms−1
8. Conclusions
- Select representative test contaminants.
- Select a suitable particle measurement instrument.
- Design and build the test rig.
- Experiments.
- Damp wiping of the substrate (lightguide).
- Particle application.
- Particle count (before cleaning).
- Cleaning with compressed air or CO2.
- Particle count (after cleaning).
Author Contributions
Funding
Institutional Review Board Statement
Informed Consent Statement
Data Availability Statement
Conflicts of Interest
Abbreviations
| ABS | Anti-lock braking system |
| AOI | Automatic optical inspection |
| BLU | Backlight unit |
| Cp | Potential process capability |
| CO2 | Carbon dioxide |
| DoE | Design of experiments |
| E/E | Electrical/electronic |
| EOL | End of line |
| FT-IR | Fourier transform infrared spectroscopy |
| LED | Light-emitting diode |
| LCD | Liquid crystal display |
| PE | Polyethylene |
| R2 | Coefficient of determination |
| STPA | System theoretical process analysis |
| xCDA | Extra clean dry air |
References
- Rochowicz, M.; Ernst, C. Technische Sauberkeit als messbares Qualitätsmerkmal. J. Oberfl. Techn. 2006, 46, 60–63. [Google Scholar] [CrossRef]
- Elo, L.; Pekkonen, J.; Rinkinen, J. Technical Cleanliness of Assembled Fluid Power Components. In Proceedings of the 8th FPNI Ph.D Symposium on Fluid Power, Lappeenranta, Finland, 11–13 June 2014; V001T01A011. [Google Scholar]
- Faber, J.; Brodzik, K.; Nycz, M. Understanding Technical Cleanliness: Importance, Assessment, Maintenance. Combust. Engines 2021, 186, 41–50. [Google Scholar] [CrossRef]
- Koevi, M.; Ji, J. Technical Cleanliness in Electronics Manufacturing. In Proceedings of the PCIM Asia 2020, International Exhibition and Conference for Power Electronics, Intelligent Motion, Renewable Energy and Energy Management, Shanghai, China, 16–18 November 2020. [Google Scholar]
- Grabow, J.; Klink, J.; Benger, R.; Hauer, I.; Beck, H.-P. Particle Contamination in Commercial Lithium-Ion Cells–Risk Assessment with Focus on Internal Short Circuits and Replication by Currently Discussed Trigger Methods. Batteries 2023, 9, 9. [Google Scholar] [CrossRef]
- Kong, L.; Hu, X.; Gui, G.; Su, Y. Computed Tomography Analysis of Li-Ion Battery Case Ruptures. Fire Technol. 2020, 56, 2565–2578. [Google Scholar] [CrossRef]
- Sun, P.; Huang, X.; Bisschop, R.; Niu, H. A Review of Battery Fires in Electric Vehicles. Fire Technol. 2020, 56, 1361–1410. [Google Scholar] [CrossRef]
- Pillau, F. BMW: Huge Recall and Profit Warning Due to Defective Conti Brakes. Heise. 2024. Available online: https://www.heise.de/en/news/BMW-Huge-recall-and-profit-warning-due-to-defective-Conti-brakes-9864793.html (accessed on 5 February 2025).
- Hermann, D.S. Automotive Displays–Trends, Opportunities and Challenges. In Proceedings of the 25th International Workshop on Active-Matrix Flatpanel Displays and Devices (AM-FPD), Kyoto, Japan, 3–6 July 2018; pp. 1–6. [Google Scholar]
- Chen, F.; Kuo, J. In-Vehicle Display Technology. In Advanced Driver Assistance Systems and Autonomous Vehicles; Li, Y., Shi, H., Eds.; Springer: Singapore, 2022; pp. 339–419. [Google Scholar]
- Kondo, Y. Technological Trends of LED Backlight Units. In LCD Backlights; Kobayashi, S., Mikoshiba, S., Lim, S., Eds.; Wiley: Chicester, UK, 2009; pp. 195–205. [Google Scholar]
- Boyd, G. LCD Backlights. In Handbook of Visual Display Technology; Chen, J., Cranton, W., Fihn, M., Eds.; Springer: Berlin/Heidelberg, Germany, 2014; pp. 1–14. [Google Scholar]
- Nam, T.; Lee, S.; Geum, S.; Kim, J.; Park, S. Paper No P11: BLU Inspection Machine. In Proceedings of the Society for Information Display (SID), EuroDisplay 2013, London, UK, 16–19 November 2013; pp. 41–45. [Google Scholar]
- Chen, S.; Zhang, H.; Xie, Y.; Yan, H. Analysis of Backlight White Spots on the TFT-LCD Screen and Improvement Countermeasures. Opt. Eng. 2021, 60, 085105. [Google Scholar] [CrossRef]
- VDA 19 Part 2:2011; Technical Cleanliness in Assembly. German Association of the Automotive Industry: Berlin, Germany, 2011.
- IEC 31010:2019; Risk Management—Risk Assessment Techniques. IEC: Geneva, Switzerland, 2019.
- ISO 26262-3:2018; Road Vehicles–Functional Safety—Part 3: Concept Phase. ISO: Geneva, Switzerland, 2018.
- Kong, X.; Luo, J.; Feng, X. Introduction. In Process Monitoring and Fault Diagnosis Based on Multivariable Statistical Analysis; Gao, L., Garg, A., Eds.; Springer: Singapore, 2024; pp. 1–8. [Google Scholar]
- Leveson, N.G. Engineering a Safer World: Systems Thinking Applied to Safety, 1st ed.; MIT Press: Cambridge, MA, USA, 2012; pp. 227–249, 263–271. [Google Scholar]
- Welker, R.W.; Nagarajan, R.; Newberg, C.E. Contamination and ESD Control in High Technology Manufacturing, 10th ed.; John Wiley & Sons Inc.: Hoboken, NJ, USA, 2006; pp. 1–3. [Google Scholar]
- IEC 61508-5:2010; Functional Safety of Electrical/Electronic/Programmable Electronic Safety-Related Systems—Part 5: Examples of Methods for the Determination of Safety Integrity Levels. ISO: Geneva, Switzerland, 2010.
- Brag, P.; Balogh, B.; Gordon, P. Contamination Control for Sensitive Products in the Era of Electrified Vehicles. In Proceedings of the 5th Conference on Production Systems and Logistics (CPSL) 2023-2, Stellenbosch, South Africa, 14–17 November 2023; pp. 680–690. [Google Scholar]
- Gotoh, K. High Speed Air Jet Removal of Particles from Solid Surfaces. In Particle Adhesion and Removal; Mittal, K.L., Jaiswal, R., Eds.; Scrivener Publishing: Salem, MA, USA, 2015; pp. 281–311. [Google Scholar]
- Kaller, S.; Rochowicz, M.; Steglich, D. CO2 Cleaning Technology for Cleaning Micro-/Nanostructured Inserts: The IMPRESS FP7 Project. In Proceedings of the 9th International Conference on Multi-Material Micro Manufacture, Vienna, Austria, 9–11 October 2012. [Google Scholar]
- Sherman, R. Carbon Dioxide Snow Cleaning Applications. In Developments in Surface Contamination and Cleaning, Volume 11; Kohli, R., Mittal, K.L., Eds.; Elsevier: Amsterdam, The Netherlands, 2018; pp. 97–116. [Google Scholar]
- Rodrigues, J.A.P.; Diniz, A.S.A.C.; Kazmerski, L.L. Evaluation of the Impacts of Various Cleaning Techniques on Photovoltaic Module Glass. In Proceedings of the IEEE 48th Photovoltaic Specialists Conference (PVSC), Fort Lauderdale, FL, USA, 20–25 June 2021; pp. 0958–0960. [Google Scholar]
- Jantzen, S.; Decarreaux, T.; Stein, M.; Kniel, K.; Dietzel, A. CO2 Snow Cleaning of Miniaturized Parts. Precis. Eng. 2018, 52, 122–129. [Google Scholar] [CrossRef]
- Hedderich, J.; Sachs, L. Applied Statistics–Methods Using R, 3rd ed.; Springer: Berlin/Heidelberg, Germany, 2024; pp. 362–364. [Google Scholar]
- Hogg, R.; Tanis, E.; Zimmerman, D. Probability and Statistical Inference, 10th ed.; Pearson: Harlow, UK, 2024; pp. 340–347. [Google Scholar]
- ISO 16232:2018; Road Vehicles—Cleanliness of Components and Systems. ISO: Geneva, Switzerland, 2018.
- Chwala, M.K. Cleanliness Verification and Defining Acceptable Cleanliness Levels. Surf. Eng. 2001, 17, 413–417. [Google Scholar] [CrossRef]
- Liebermann, A. Surface Cleaning Methods. In Contamination Control and Cleanrooms; Liebermann, A., Ed.; Springer: Boston, MA, USA, 2018; pp. 97–116. [Google Scholar]
- Methods for Assessing Surface Cleanliness. In Developments in Surface Contamination and Cleaning, Volume 12; Kohli, R., Mittal, K.L., Eds.; Elsevier: Amsterdam, The Netherlands, 2019; pp. 23–105. [Google Scholar]
- Scheffler, K.; Schué, A. Reliable Analysis of Residual Dirt Particles. JOT 2011, 4, 56–57. [Google Scholar] [CrossRef]
- Grimme, R. Particle Detector and Method for Detecting Particles. European Patent No. EP2295955B1, 26 May 2016. [Google Scholar]
- Chen, Y.L.; Ye, Z.T.; Lai, W.; Chiu, C.C.; Lin, K.W.; Han, P. Application of Mini-LEDs with Microlens Arrays and Quantum Dot Film as Extra-Thin, Large-Area, and High-Luminance Backlight. Nanomaterials 2022, 12, 1032. [Google Scholar] [CrossRef] [PubMed]
- Rhodes, M.J. Introduction to Particle Technology, 2nd ed.; John Wiley & Sons, Ltd.: Chichester, UK, 2013. [Google Scholar]
- ISO 14644-1:2015; Cleanrooms and Associated Controlled Environments—Part 1: Classification of Air Cleanliness by Particle Concentration. ISO: Geneva, Switzerland, 2015.
- ISO 8573–1:2010; Compressed Air—Part 1: Contaminants and Purity Classes. ISO: Geneva, Switzerland, 2010.
- Dean, A.; Voss, D.; Draguljić, D. Design and Analysis of Experiments, 2nd ed.; Springer International: Berlin/Heidelberg, Germany, 2017. [Google Scholar]
- Selvamuthu, D.; Das, D. Introduction to Probability, Statistical Methods, Design of Experiments and Statistical Quality Control, 2nd ed.; Springer: Singapore, 2024. [Google Scholar]
- Montgomery, D.C. Design and Analysis of Experiments, 10th ed.; John Wiley & Sons Inc.: New York, NY, USA, 2019. [Google Scholar]
- Beaudoin, S.; Jaiswal, P.; Harrison, A.; Laster, J.; Smith, K.; Sweat, M.; Thomas, M. Fundamental Forces in Particle Adhesion. In Particle Adhesion and Removal; Mittal, K.L., Jaiswal, R., Eds.; Scrivener Publishing LLC.: Salem, MA, USA, 2015; pp. 3–79. [Google Scholar]
- Rumpf, H. Particle Technology, 1st ed.; Springer: Dordrecht, The Netherlands, 2012. [Google Scholar]
- Gommel, U.; Kreck, G.; Lindner, R.; Vrublevskis, J. Investigation of Cleaning Technologies and Validation Procedures Appropriate to Needed Cleanliness for Instruments Used in the Search for Life. In Proceedings of the 63rd International Astronautical Congress (IAC), Naples, Italy, 1–5 October 2012; pp. 337–347. [Google Scholar]


| Factor | Type | Attributes |
|---|---|---|
| Orientation | Continuous | 0°/45°/90° |
| Distance | Continuous | 20 cm/30 cm/40 cm |
| Speed | Continuous | 0.3 ms−1/0.6 ms−1/1.2 ms−1 |
| Media | Category | xCDA/CO2 |
Disclaimer/Publisher’s Note: The statements, opinions and data contained in all publications are solely those of the individual author(s) and contributor(s) and not of MDPI and/or the editor(s). MDPI and/or the editor(s) disclaim responsibility for any injury to people or property resulting from any ideas, methods, instructions or products referred to in the content. |
© 2025 by the authors. Licensee MDPI, Basel, Switzerland. This article is an open access article distributed under the terms and conditions of the Creative Commons Attribution (CC BY) license (https://creativecommons.org/licenses/by/4.0/).
Share and Cite
Brag, P.; Holzapfel, Y.; Daumüller, M.; Grimme, R.; Mai, U.; Iseringhausen, T. Experimental Evaluation of Dry and Contactless Cleaning Methods for the Production of Digital Vehicle Dashboards. J. Exp. Theor. Anal. 2025, 3, 10. https://doi.org/10.3390/jeta3010010
Brag P, Holzapfel Y, Daumüller M, Grimme R, Mai U, Iseringhausen T. Experimental Evaluation of Dry and Contactless Cleaning Methods for the Production of Digital Vehicle Dashboards. Journal of Experimental and Theoretical Analyses. 2025; 3(1):10. https://doi.org/10.3390/jeta3010010
Chicago/Turabian StyleBrag, Patrick, Yvonne Holzapfel, Marcel Daumüller, Ralf Grimme, Uwe Mai, and Tobias Iseringhausen. 2025. "Experimental Evaluation of Dry and Contactless Cleaning Methods for the Production of Digital Vehicle Dashboards" Journal of Experimental and Theoretical Analyses 3, no. 1: 10. https://doi.org/10.3390/jeta3010010
APA StyleBrag, P., Holzapfel, Y., Daumüller, M., Grimme, R., Mai, U., & Iseringhausen, T. (2025). Experimental Evaluation of Dry and Contactless Cleaning Methods for the Production of Digital Vehicle Dashboards. Journal of Experimental and Theoretical Analyses, 3(1), 10. https://doi.org/10.3390/jeta3010010