Abstract
Surface-enhanced Raman spectroscopy was employed to measure lettuce seeds at five different germination stages. The experimental results show that 85% of the spectra of normally germinating seeds exhibited consistency in both peak positions and quantities at the same germination stage, while spectra from seeds that failed to germinate normally demonstrated significant differences compared to the normal ones. These data indicate that the surface-enhanced Raman spectrum of seeds could serve as an effective method for detecting seed germination rates.
1. Introduction
Raman spectroscopy is an inelastic light scattering technique. Its main principle is that the incident photon interacts with the sample to produce scattered photons of different wavelengths than the incident photons in the Raman scattering process [1]. Raman spectroscopy contains a wealth of information that can be applied for chemical identification [2], molecular structure characterization, the analysis of bonding effects, and determining the environment in which the sample is located, as well as the internal stress distribution. In recent years, Raman spectroscopy has become one of the main methods for molecular structure research due to its unique advantages, such as rapidity, high precision, and non-invasiveness [3,4,5]. Therefore, it is widely used in the fields of plant physiology [6], food safety [7], tumor detection [8], environmental detection, and pollution control. R Baranski et al. demonstrated the special potential of Raman spectroscopy for studying selected plant metabolites [9]. Ciallamay et al. reviewed the application of surface-enhanced Raman spectroscopy (SERS) in biological and biomedical detection schemes [10].
At the same time, the seed germination process is an important foundation for plant growth. Studying the germination stages of seeds will benefit the plant growth process [11,12]. Good seeds are key to agriculture, and seed quality measurement is the backbone of agricultural practice [13]. Currently, the main research focus is to obtain reference measurements to evaluate seed quality and further plan and forecast profitable crop yields [14,15,16,17]. Li et al. proposed a rapid and non-invasive method to measure the germination rate of hybrid rice seeds based on near-infrared reflectance spectroscopy [18]. Ambrose et al. combined partial least squares discriminant analysis with Raman and infrared spectroscopy and assessed the viability of maize seeds with an accuracy rate of 95% [19]. Recently, de Melo Bessa et al. (2024) demonstrated the application of organic–inorganic hybrid materials as coating membranes to enhance white rot control in garlic bulbils, thereby highlighting the potential of advanced materials in improving agricultural practices [20].
In this paper, we obtained the Raman spectra at each stage of seed germination through experiments and further analyzed the corresponding Raman spectral peaks in combination with physiological and biochemical changes during germination. Overall, we provide a new method for the rapid detection of seed germination rates.
2. Materials and Methods
The Raman spectrometer used in the experiment was LabRAM HR Evolution (HORIBA France SAS, Longjumeau, France), a confocal Raman spectrometer from HORIBA Science. During the experiment, a 633 nm light source, 50% laser power (about 2.5 mW), and a 50× magnification objective lens were used. The spectrometer was configured with a 600 lines per millimeter (l pm) grating, which ensured optimal spectral resolution within the targeted wavelength range. The data acquisition range was 500–1700 cm−1. Gold sol was used as a Raman spectroscopy measurement enhancement agent during the experiment. The selected seeds for this experiment were lettuce seeds purchased from Changfeng Seed Industry (Shanghai, China), and the germination rate was over 85%. Because the germination cycle of lettuce seeds is short—they sprout in about 24 h under normal conditions—the selection of the lettuce seeds allows for the rapid acquisition of samples at different stages. The term “white” here refers to seeds that have just broken through the seed coat.
The preparation of gold sol: Gold sol was prepared using the sodium citrate reduction method. Briefly, 1 g of chloroauric acid (HAuCl4) was dissolved in 99 mL of deionized water to form a 1% (w/v) solution. Separately, 1 g of sodium citrate was dissolved in 99 mL of deionized water to form a 1% (w/v) solution. The chloroauric acid solution was heated to boiling under microwave irradiation, and 0.8 mL of sodium citrate solution was added. The mixture was cooled to room temperature, yielding a wine-red gold sol indicative of gold nanoparticle formation.
- (a)
- The purchased oilseed rapeseed seeds were divided into 5 groups of 30 seeds each, numbered as seed 1, seed 2, seed 3, seed 4, and seed 5, respectively.
- (b)
- The five groups were placed in warm water at 25 °C, seed 1 for 0 h, seed 2 for 6 h, seed 3 for 12 h, seed 4 for 18 h, and seed 5 for 24 h.
- (c)
- After soaking, the seeds were manually shelled using tweezers and then finely mashed to achieve a uniform consistency. The processed seed material was then transferred into a centrifuge tube, where a gold sol was added and thoroughly mixed to form a homogeneous suspension. This suspension was subsequently pipetted onto a silicon wafer for Raman spectroscopy analysis.
- (d)
- Finally, Raman spectroscopy measurements were performed on the seeds with the five different soaking periods. Each group of 30 seeds was measured individually, with three measurements taken per seed. The data from the three measurements were averaged to obtain the mean spectra, resulting in 150 sets of experimental data. All raw Raman spectrum acquisitions were performed with LabSpec6 software (HORIBA France SAS, Longjumeau, France). To investigate the germination process of seeds, we monitored their morphological changes, including the rupture of the seed coat and the emergence of the radicle. Additionally, a microscope was employed to examine the detailed structures of seeds at various stages of germination. Seed germination is a complex physiological process characterized by significant biochemical transformations. Raman spectroscopy serves as a powerful tool to capture these changes by identifying key chemical constituents within seeds. Throughout the germination process, seeds undergo hydration, membrane repair, nutrient metabolism, and biomolecule synthesis, all of which can be effectively monitored through characteristic Raman spectral peaks.
3. Results and Discussions
Because the germination rate of the experimental sample seeds is greater than or equal to 85%, when measuring the seeds at these five stages, we obtained two different types of data at each stage: one for seeds that can germinate normally and the other for seeds that cannot germinate normally. The data with higher frequency of the same type can be considered the data of normally germinating seeds, and the other type is the seeds that cannot be normally germinated. These observations align with prior research on the effects of thiamethoxam on the photosynthetic apparatus of maize leaves, which documented substantial biochemical alterations [21].
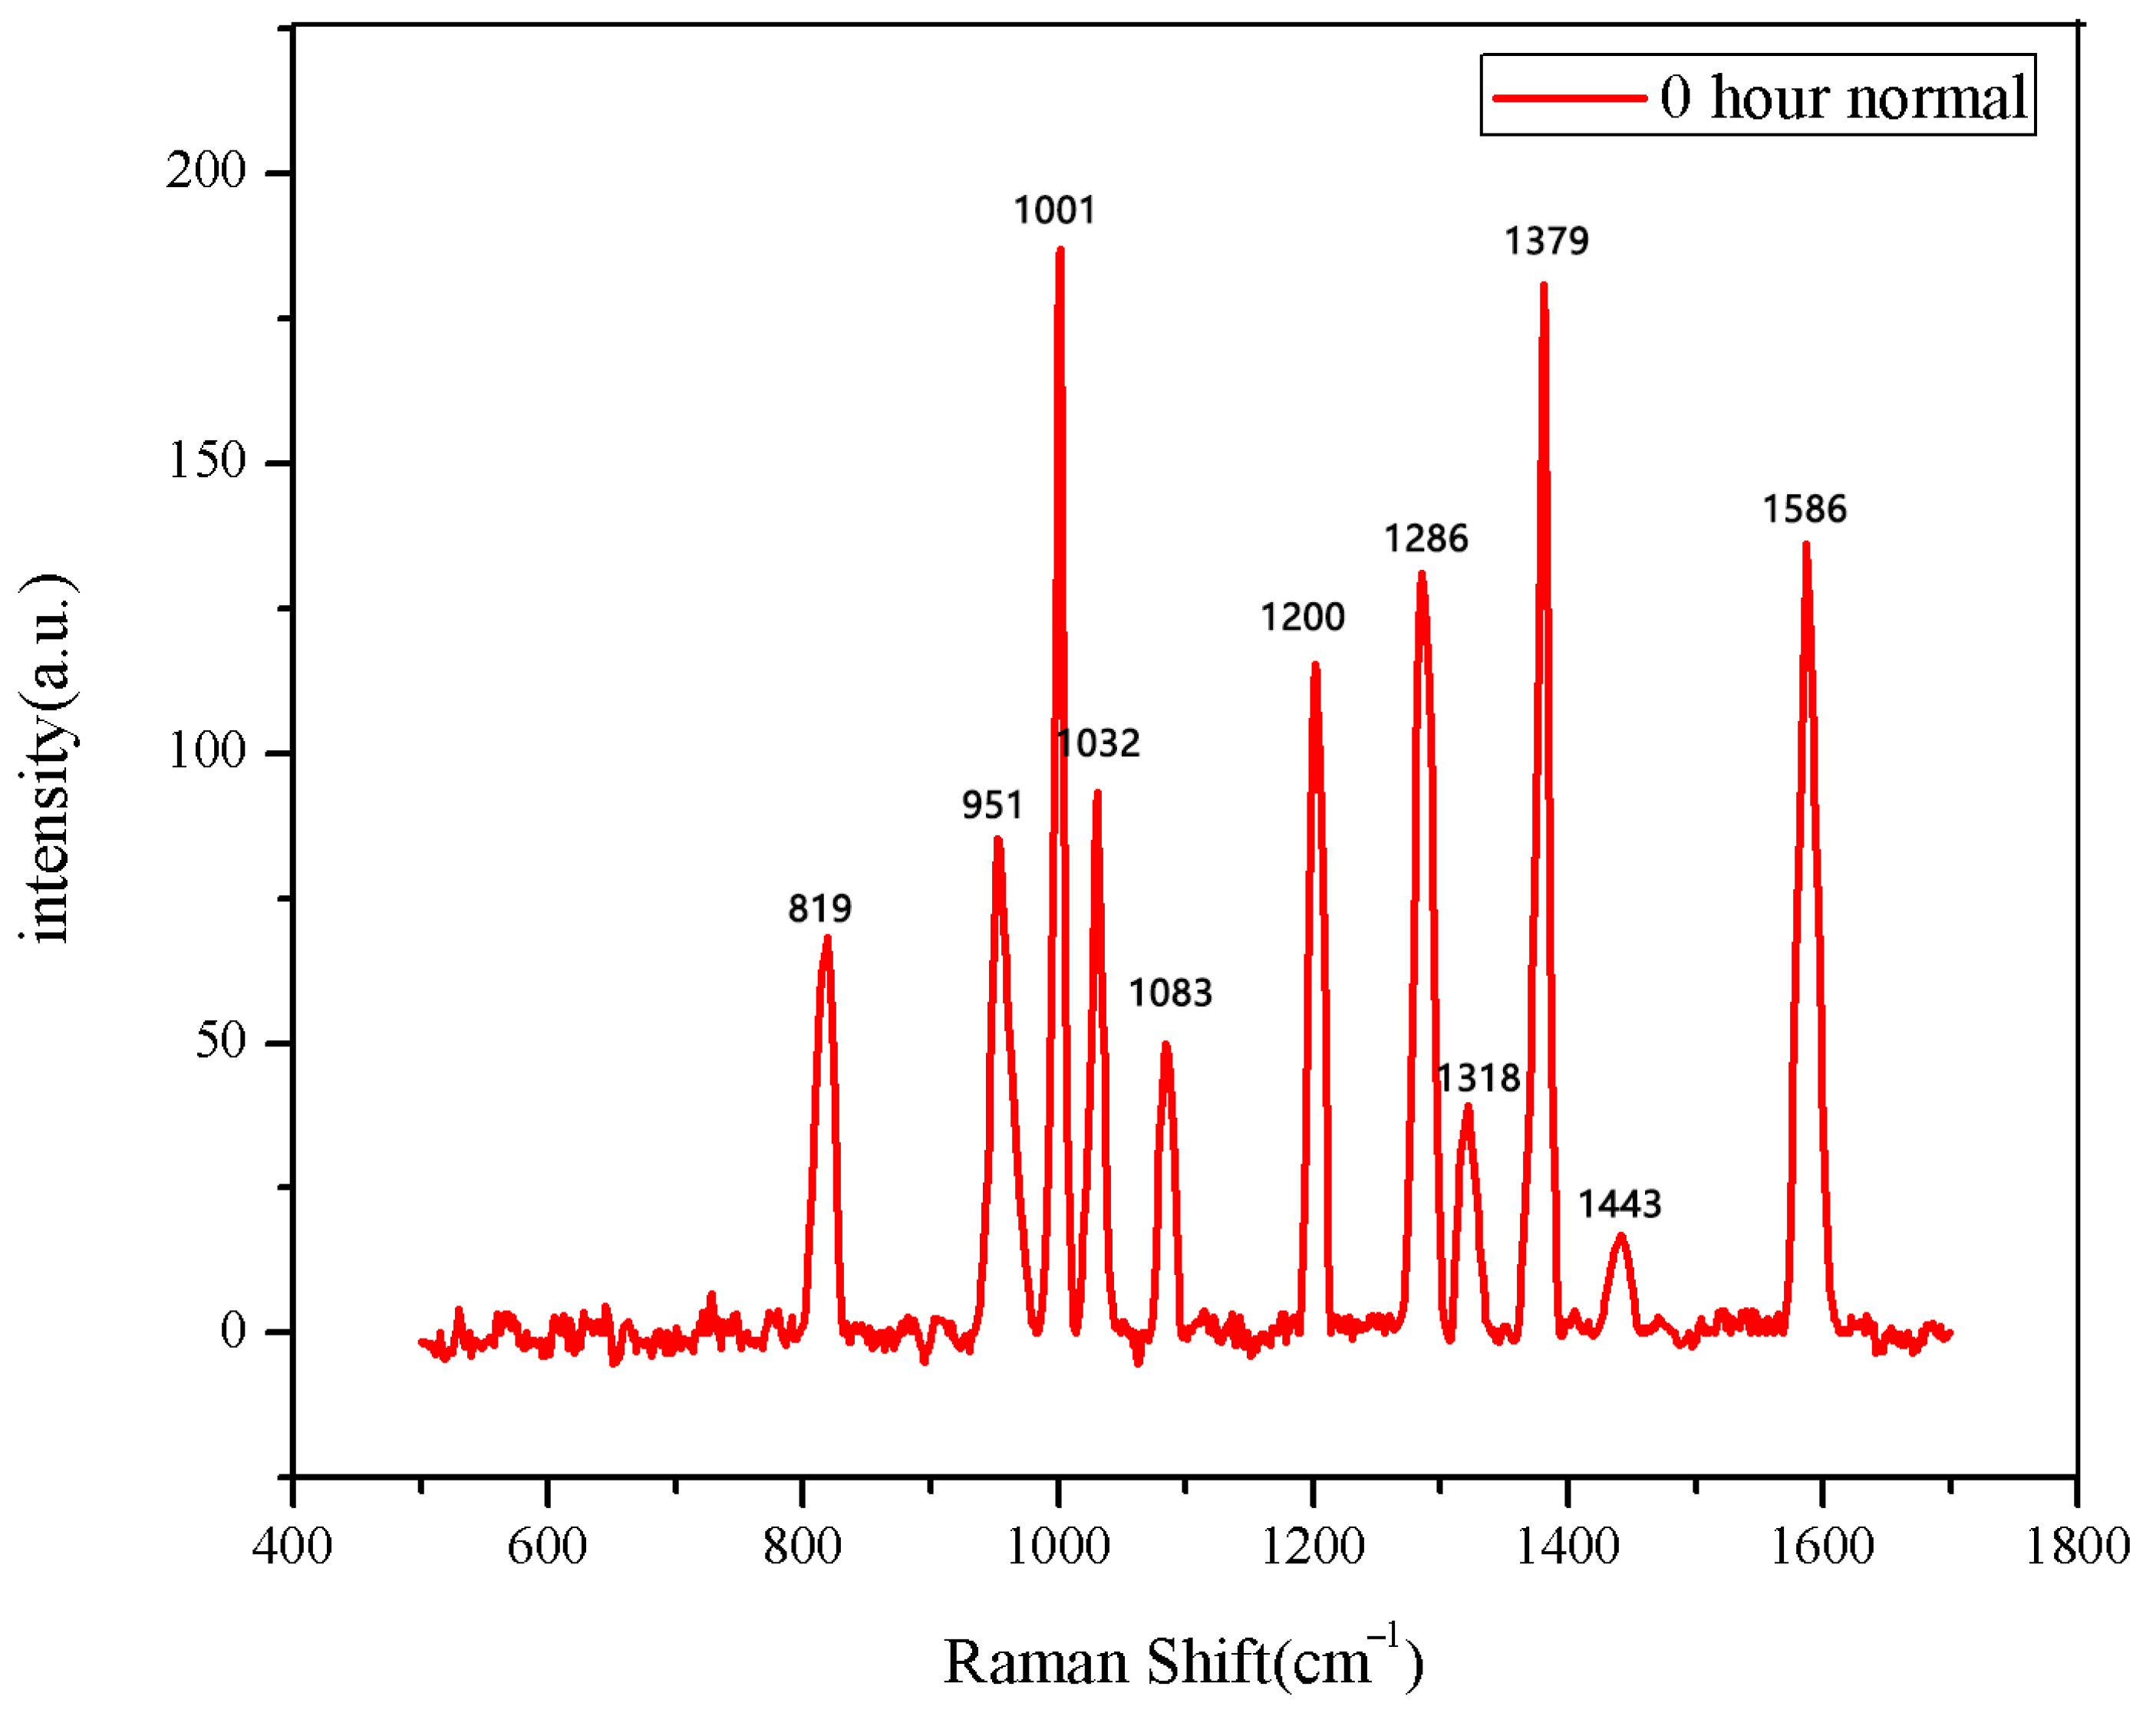
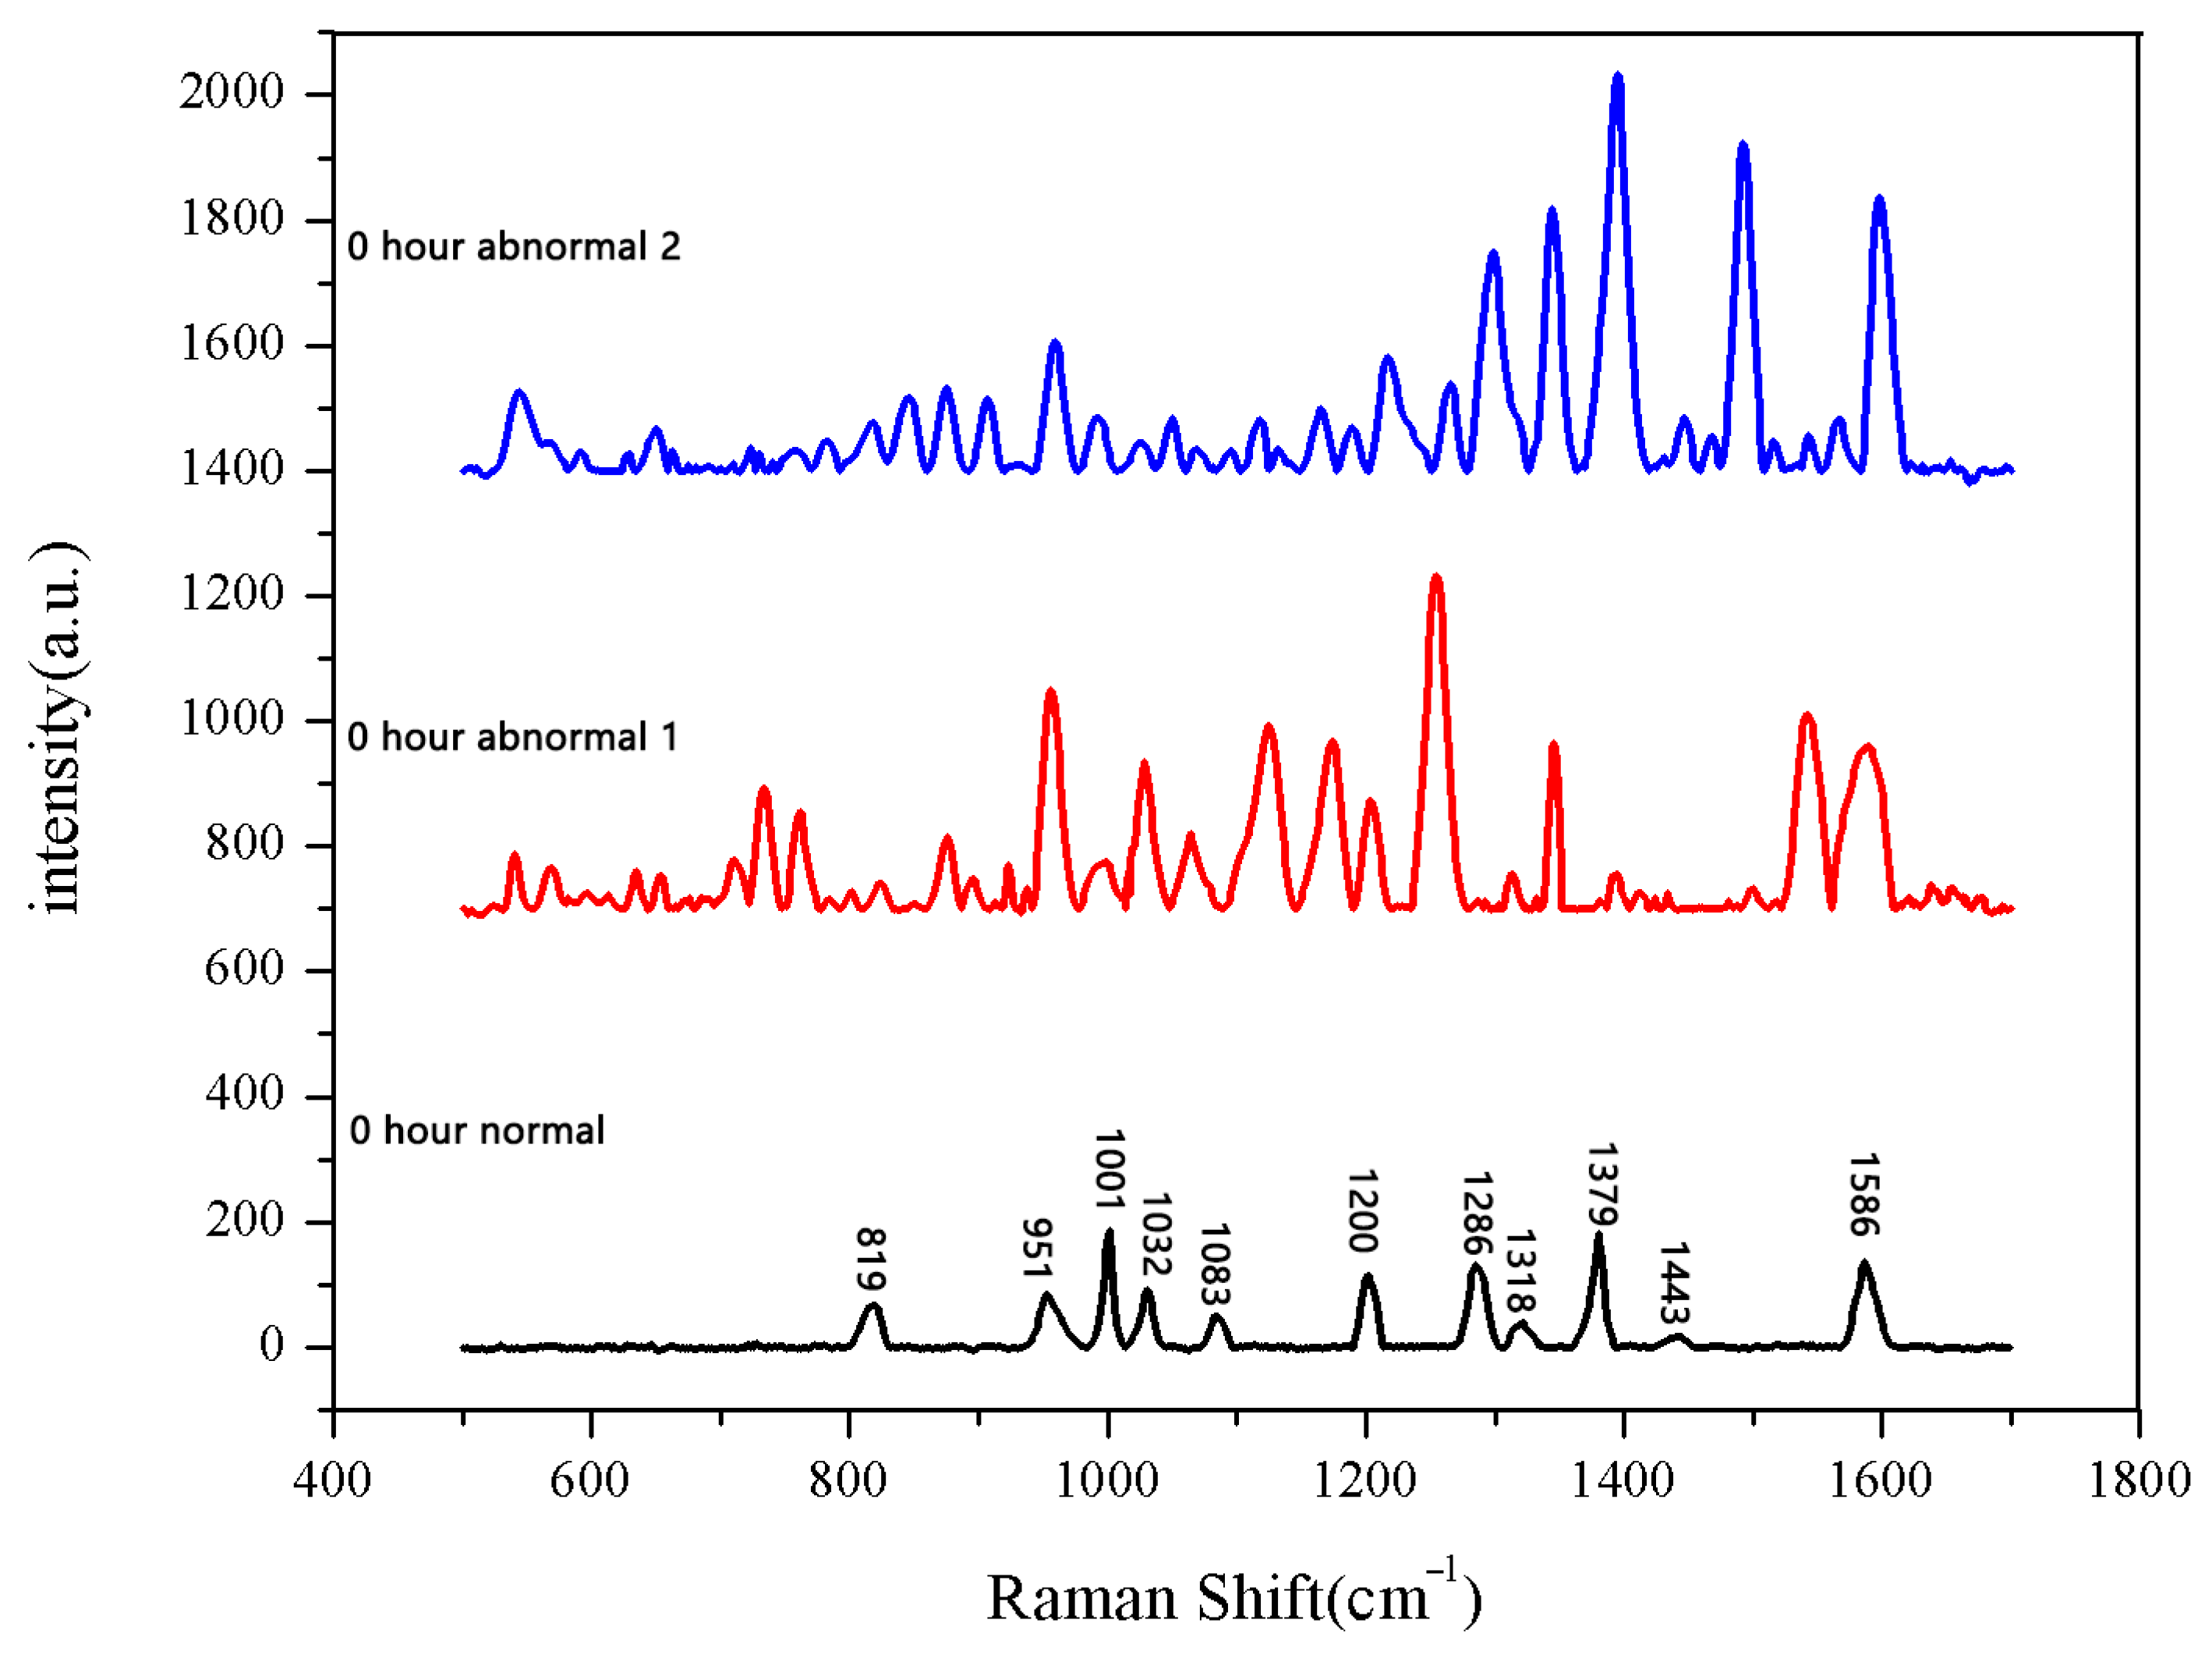
The 30 seeds soaked for 0 h were measured first. The data after three measurements were averaged into one spectral datum. After testing all 30 seeds, they were divided into two categories. A total of 28 sets of spectral data show the same number and peak positions, classified as normal seeds, while the two datasets in the second category showed different peak positions, classified as abnormal seeds. The average Raman spectrum of the normal seeds is shown in Figure 1. The data of the first type were then averaged to obtain the mean Raman spectrum of normal seeds after 0 h of soaking. The comparison between the normal group and the abnormal group is shown in Figure 2.

Figure 1.
The average Raman spectrum of normal seeds soaked for 0 h.

Figure 2.
Comparison between normal and non-normal groups soaked for 0 h.
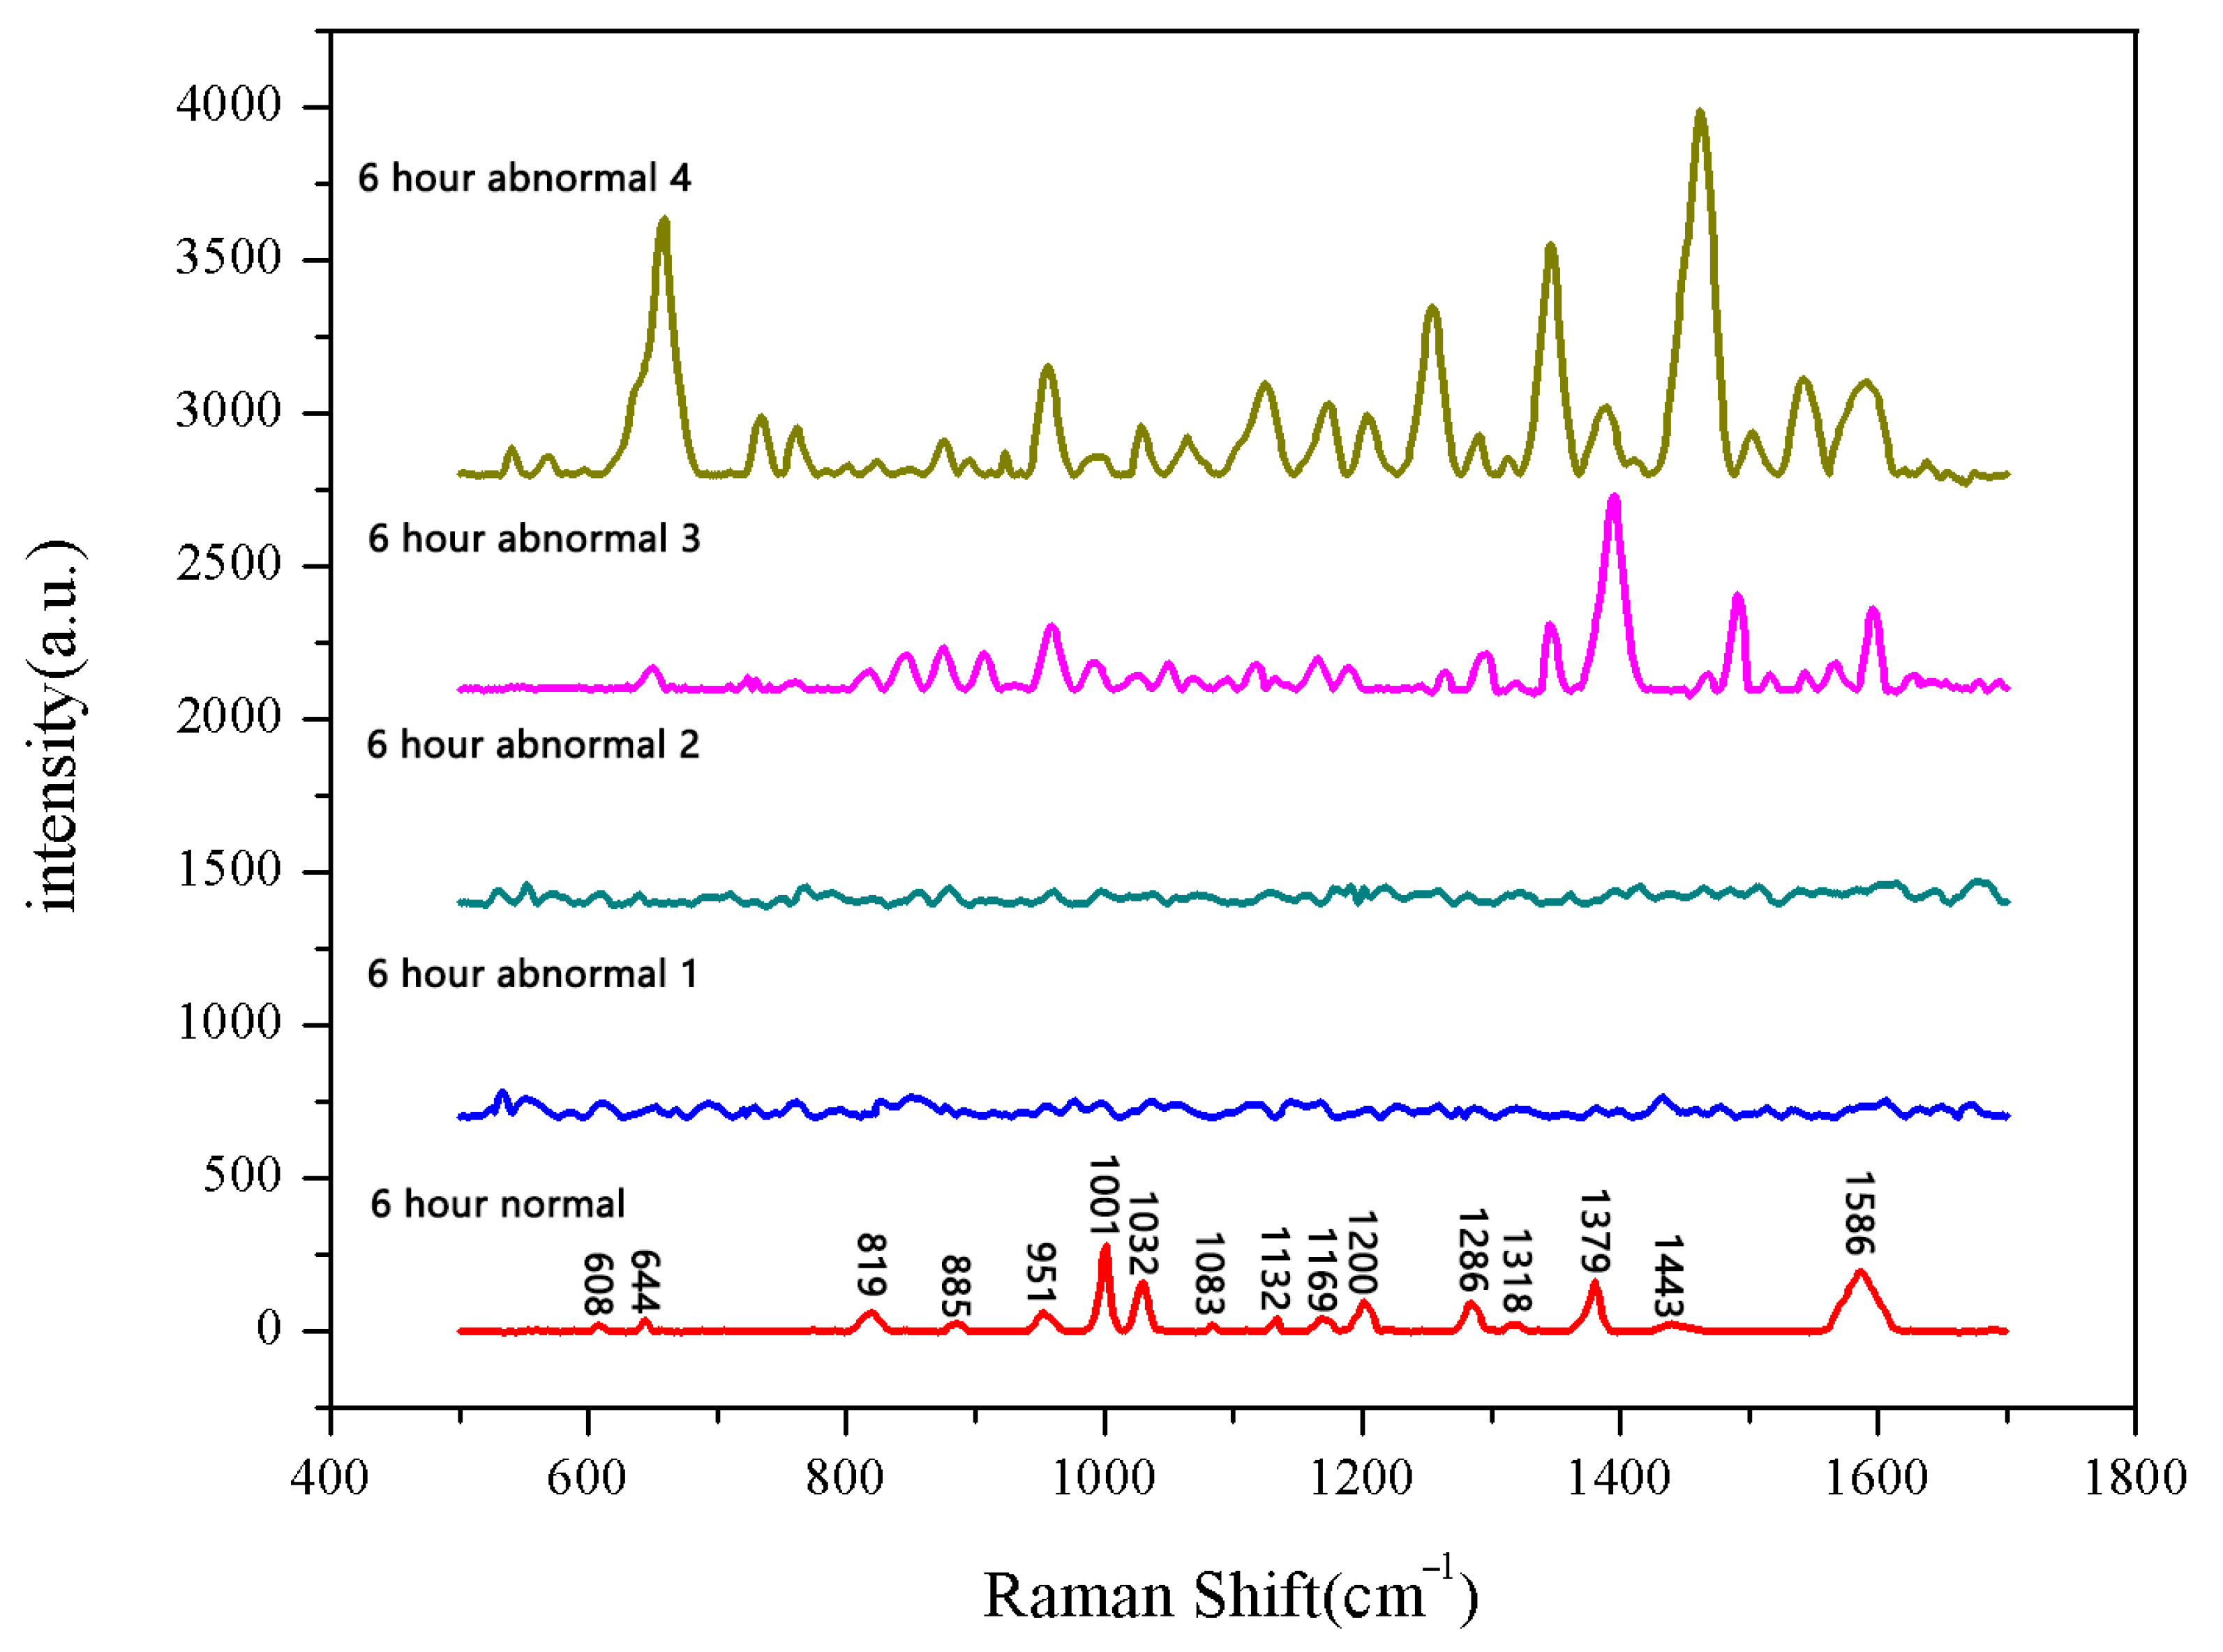
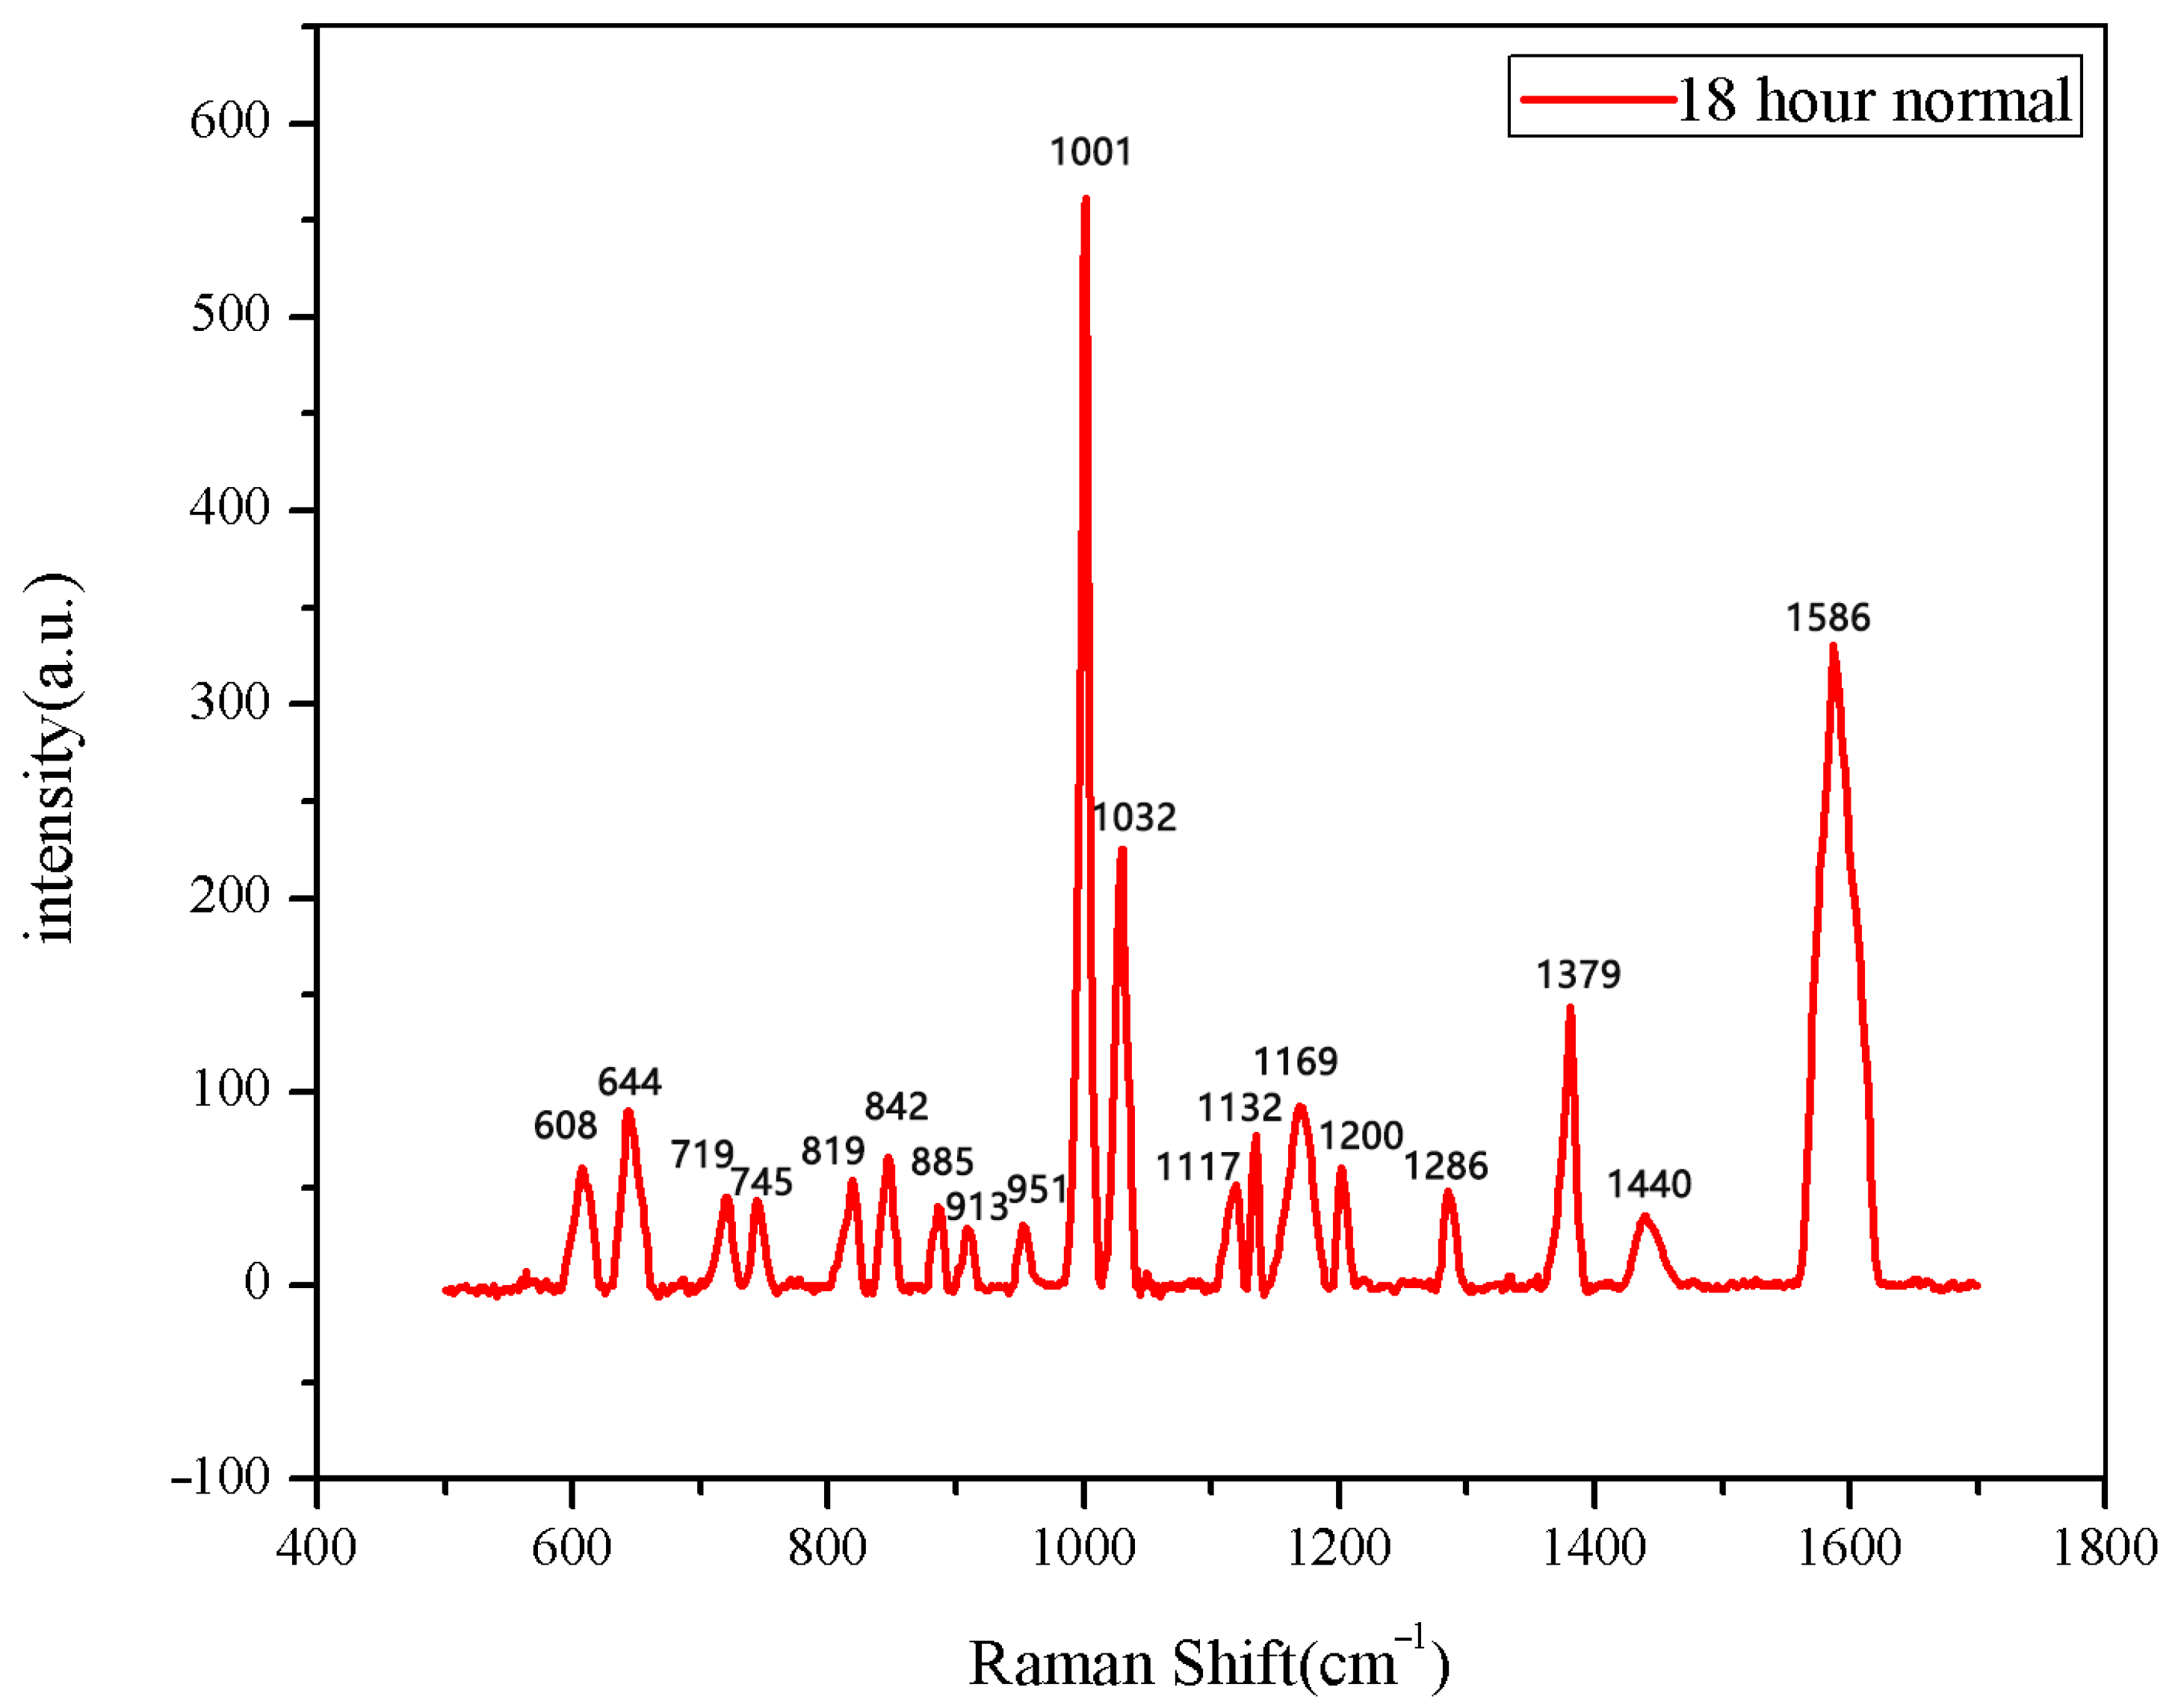
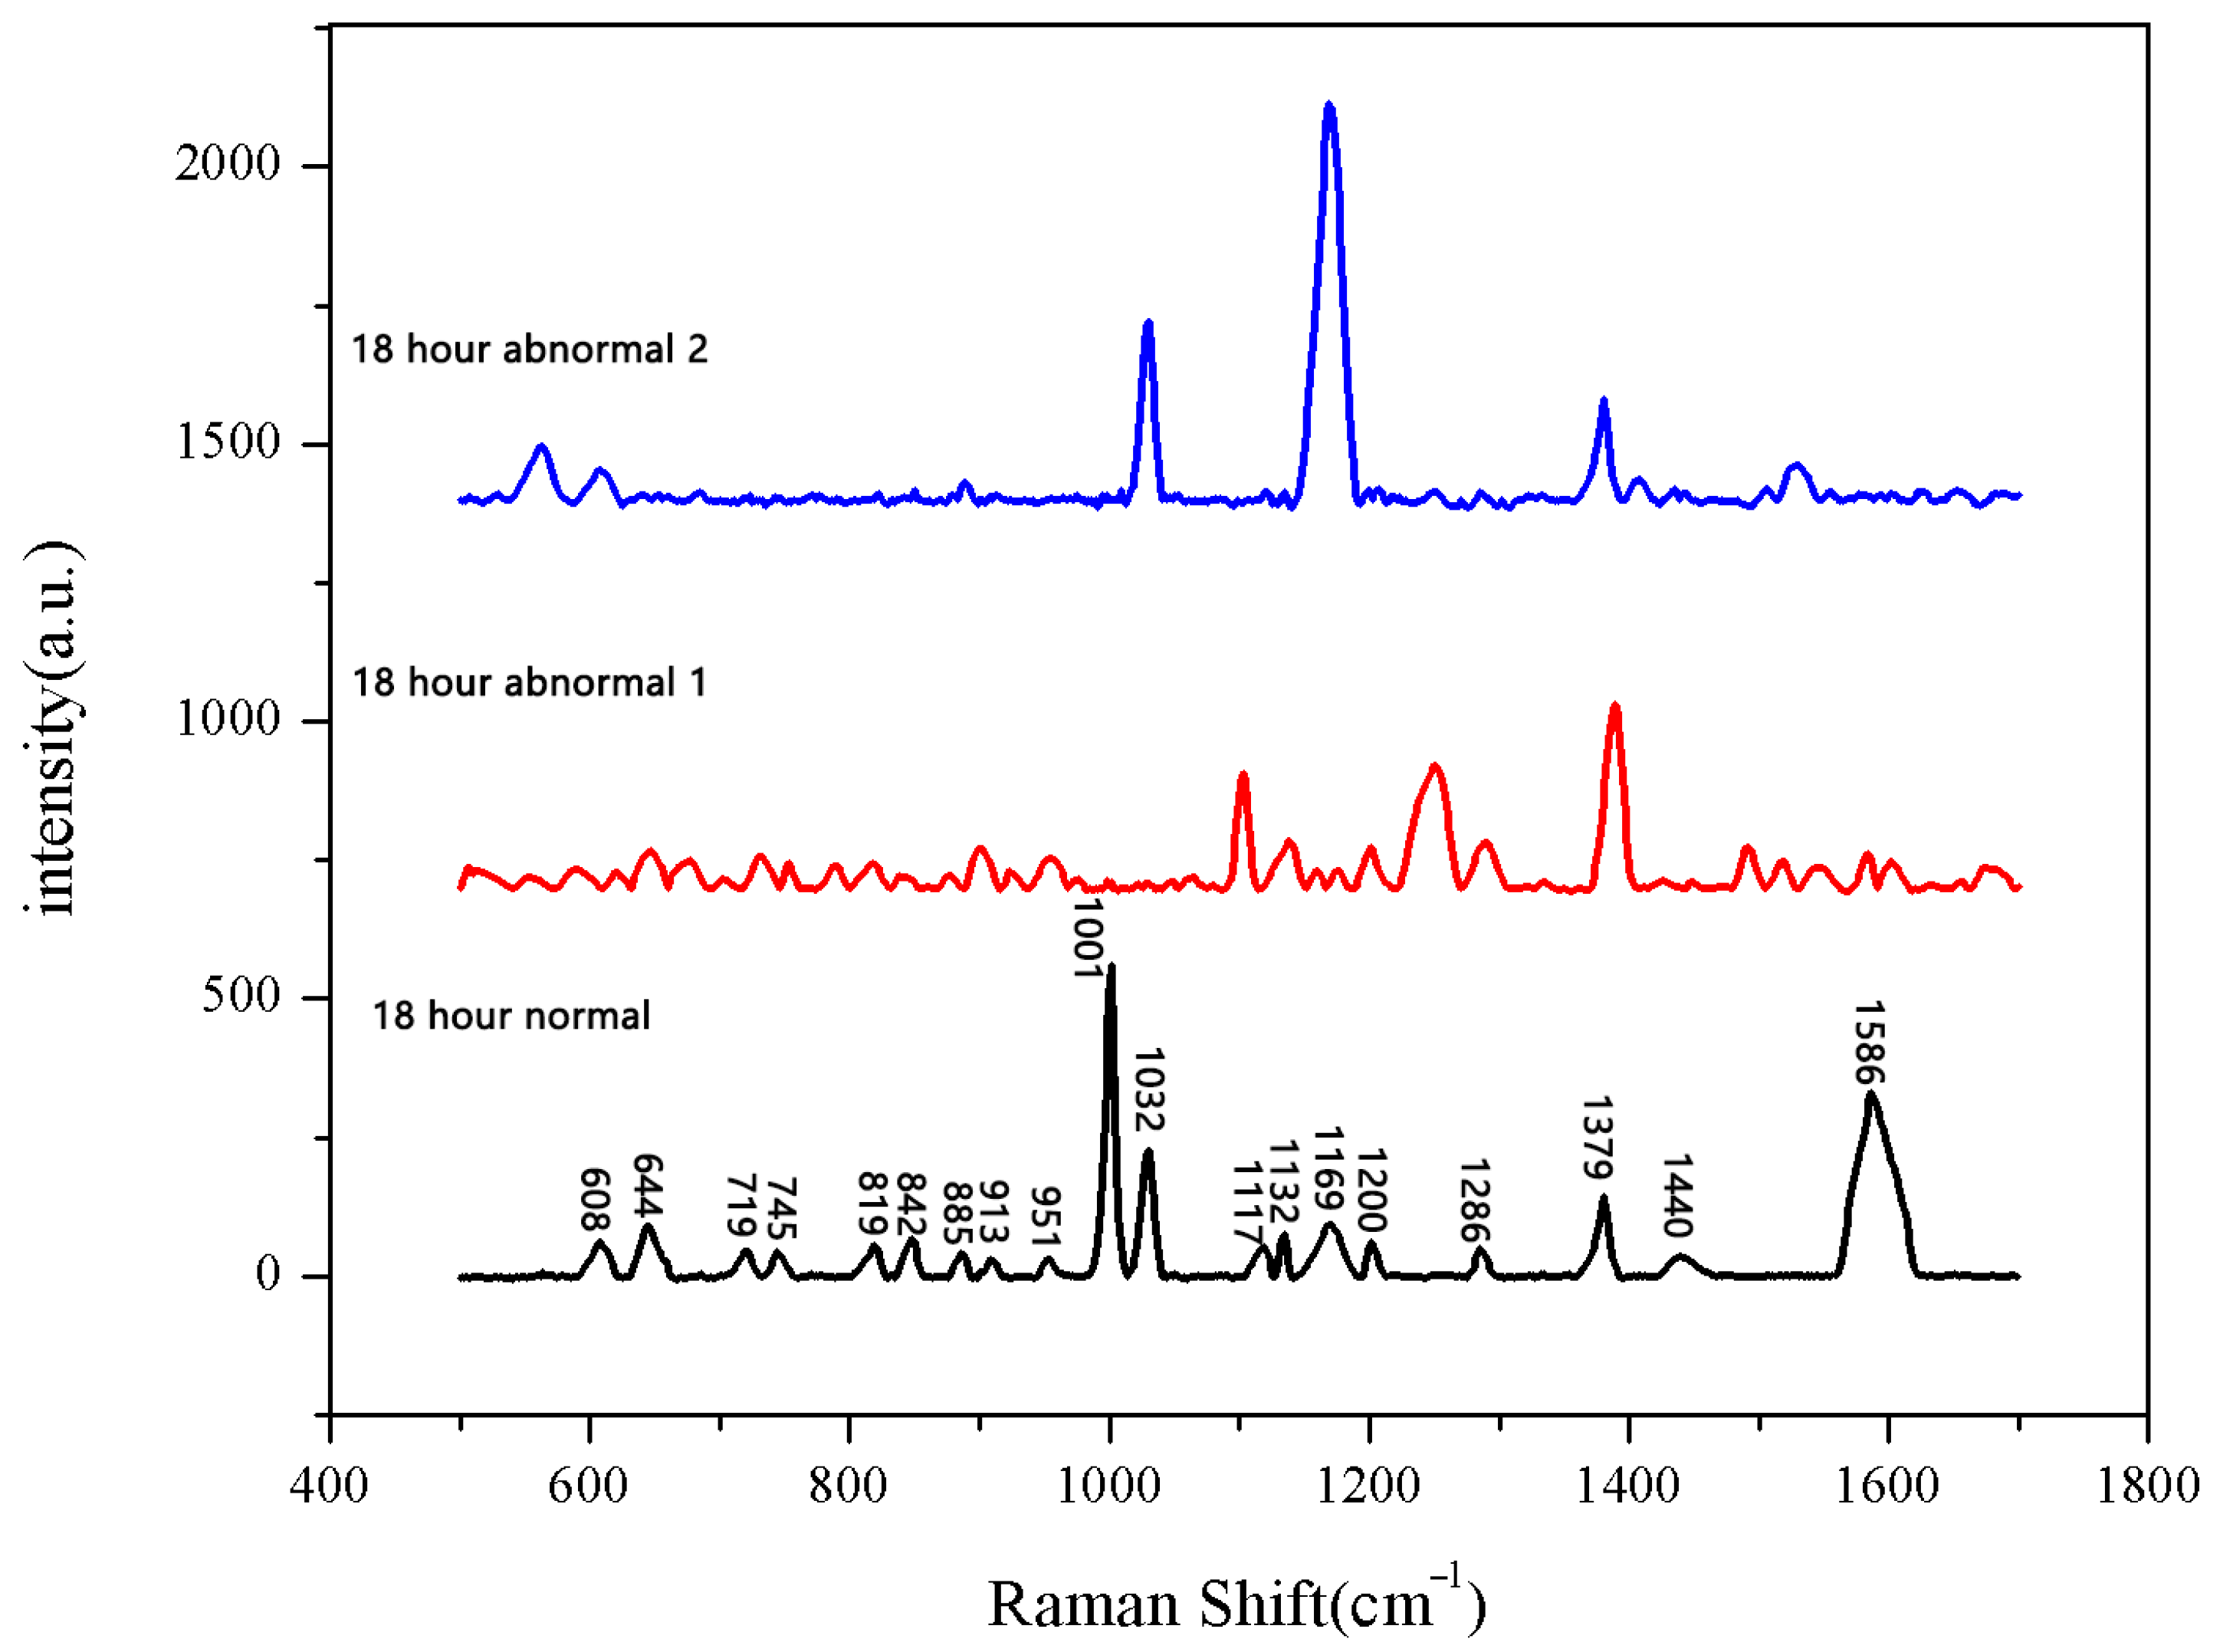
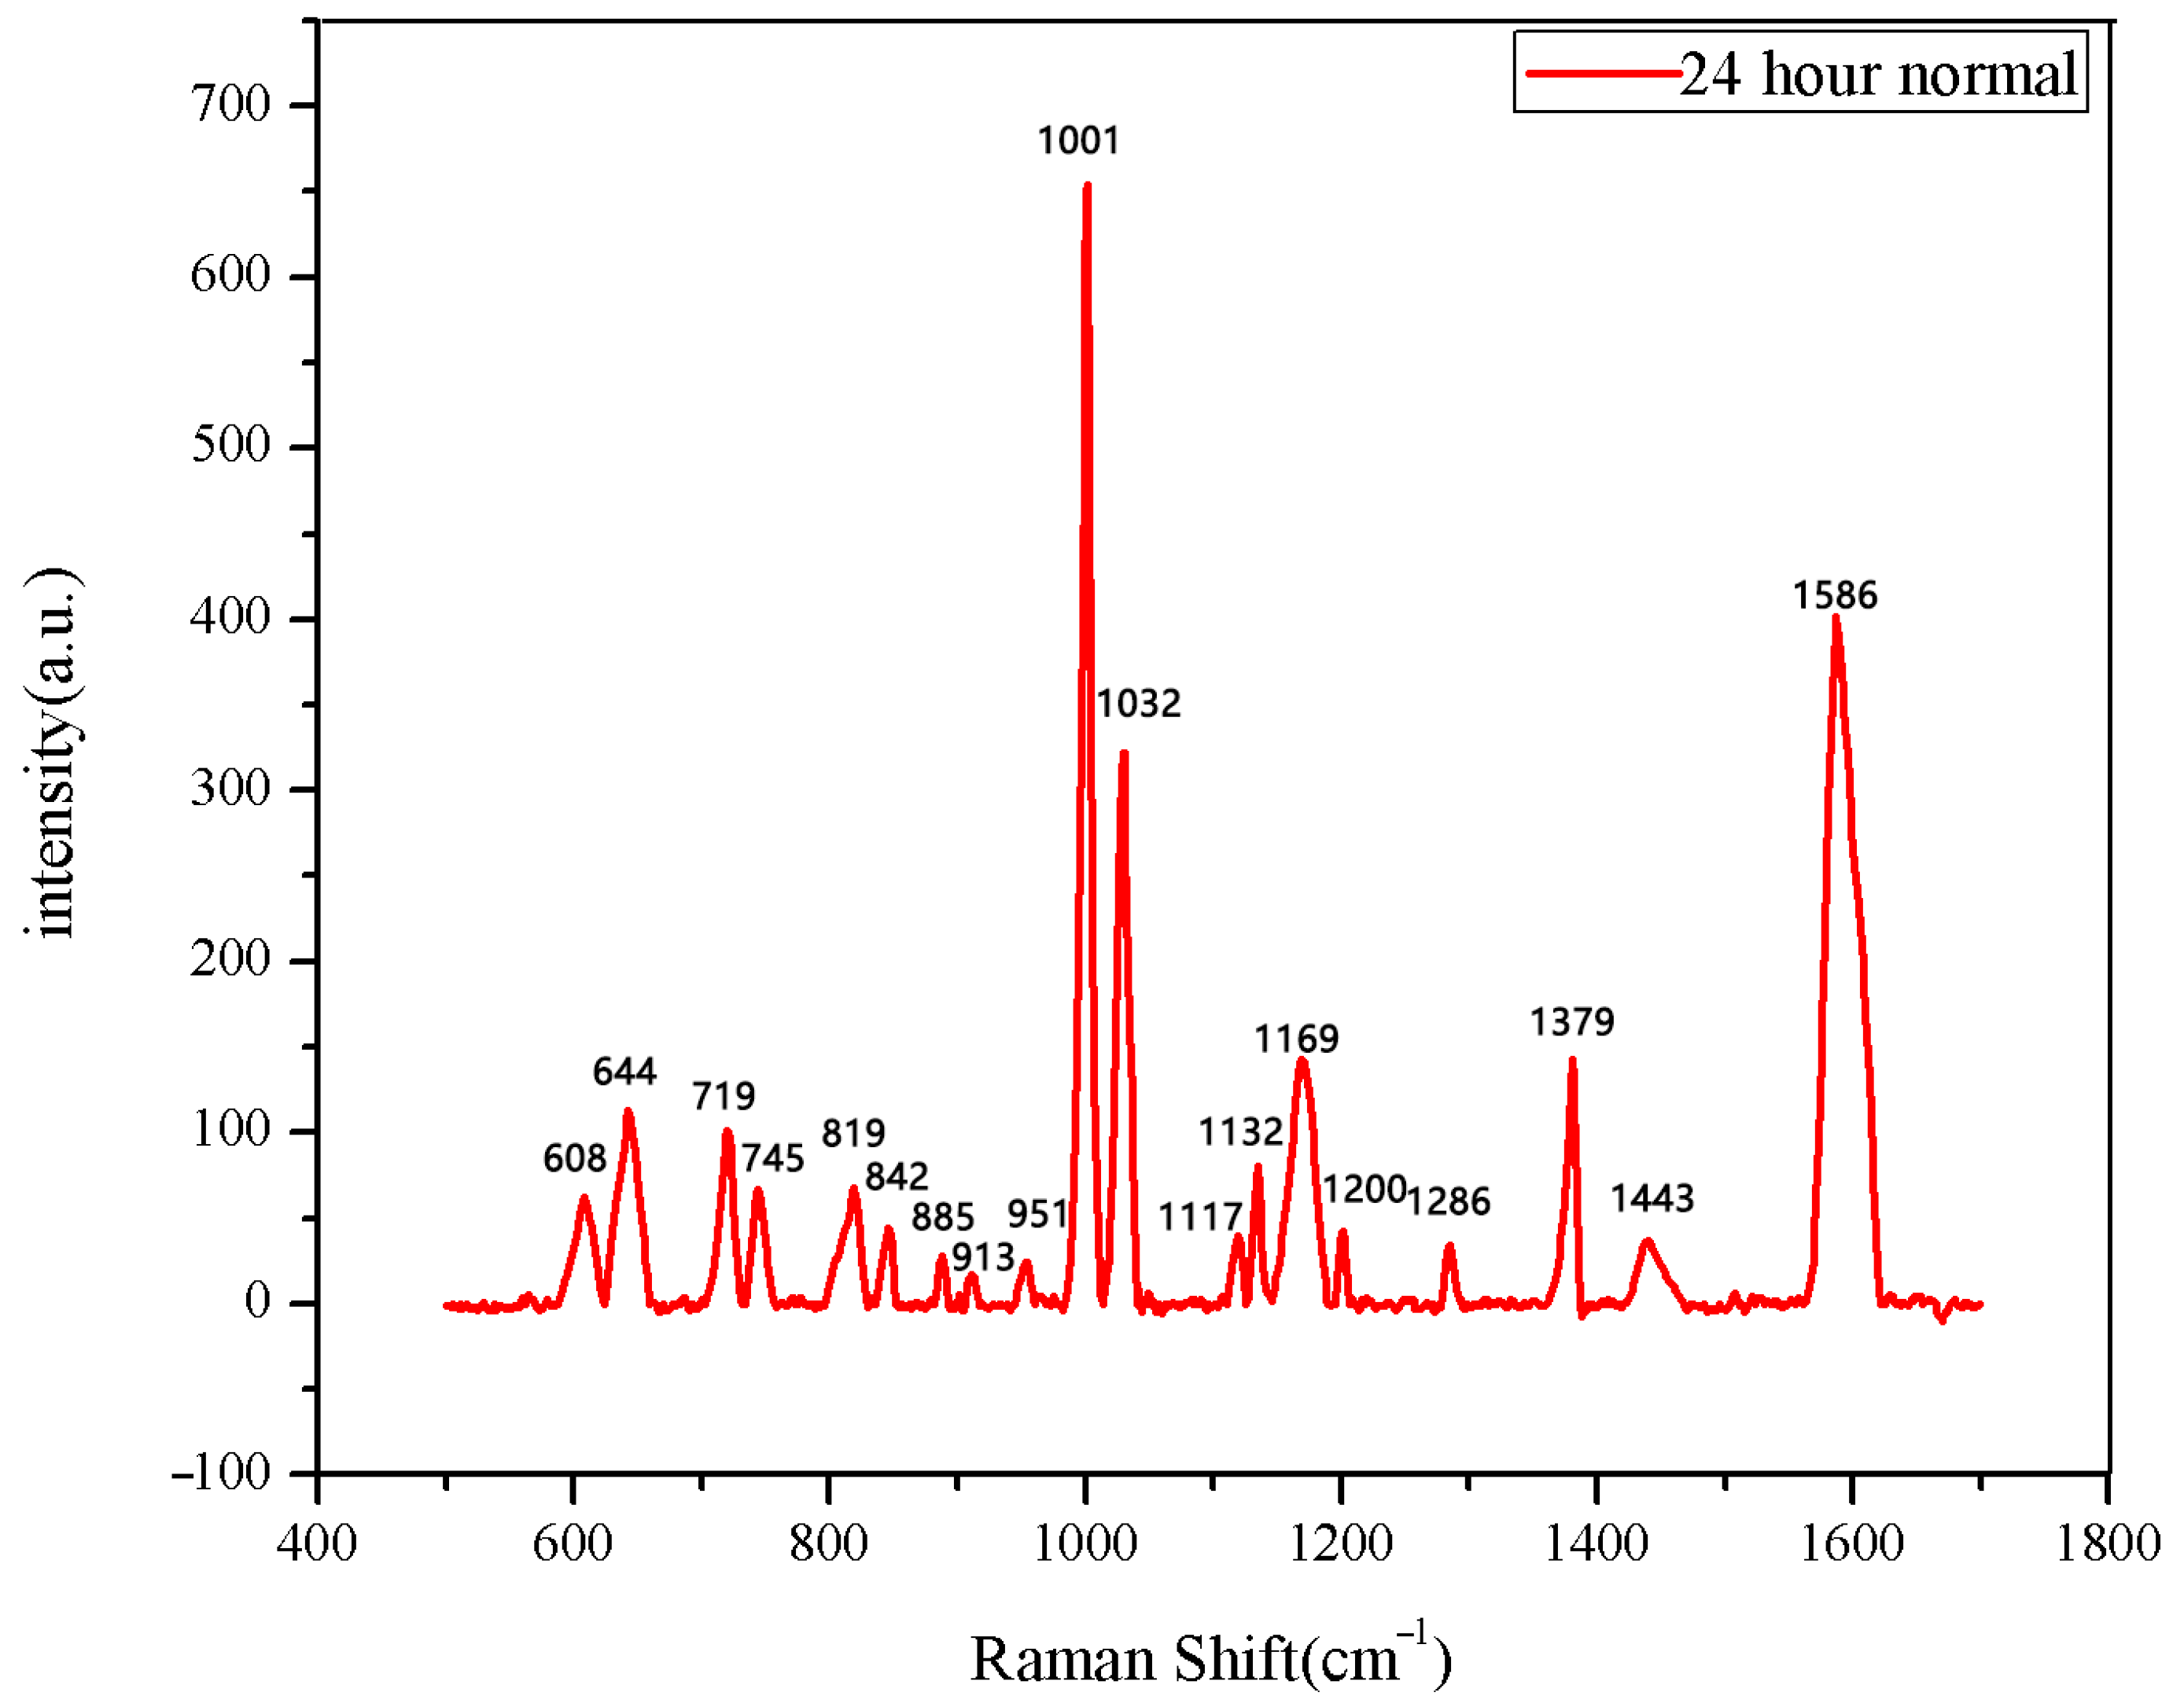
The same method was used to measure the seeds soaked for 6 h, 12 h, 18 h, and 24 h. The results are shown in Figure 3, Figure 4, Figure 5, Figure 6, Figure 7, Figure 8, Figure 9 and Figure 10. For the 6 h group, 26 datasets were classified as normal seeds and 4 as abnormal seeds; for the 12 h group, 26 datasets were normal and 4 were abnormal; and for the 18 h group, 28 datasets were normal and 2 were abnormal. The average Raman spectra of the normal seed groups for the 6 h, 12 h, 18 h, and 24 h soaking durations are shown in Figure 3, Figure 5, Figure 7, and Figure 9. The Raman spectra of the normal and abnormal groups are shown in Figure 4, Figure 6, Figure 8 and Figure 10.
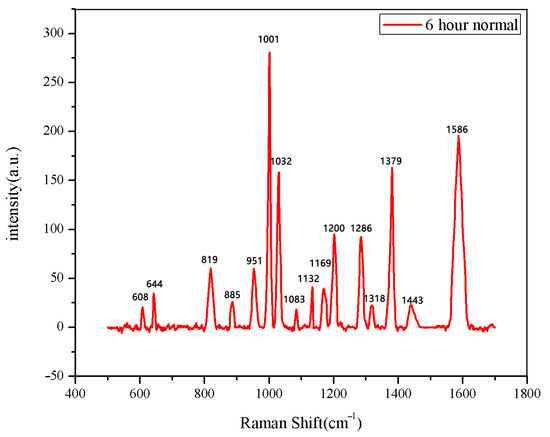
Figure 3.
The average Raman spectrum of normal seeds soaked for 6 h.
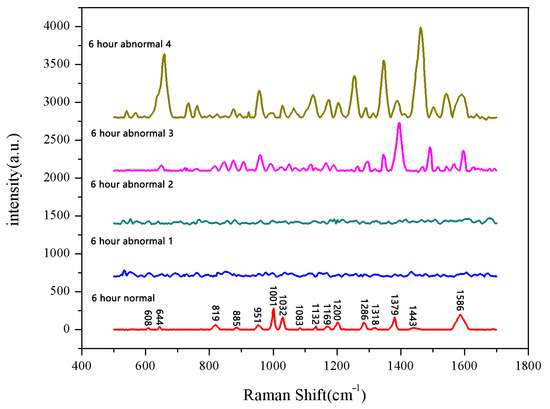
Figure 4.
Comparison between normal and non-normal groups soaked for 6 h.
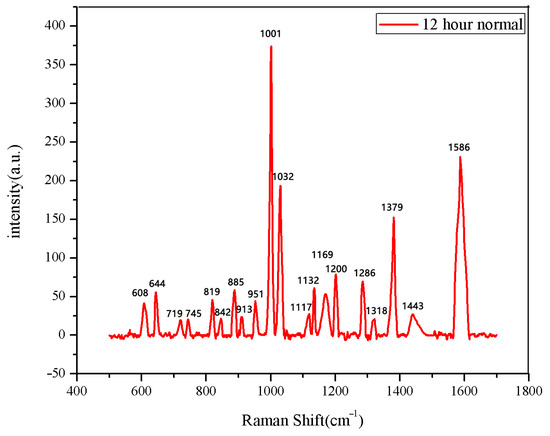
Figure 5.
The average Raman spectrum of normal seeds soaked for 12 h.
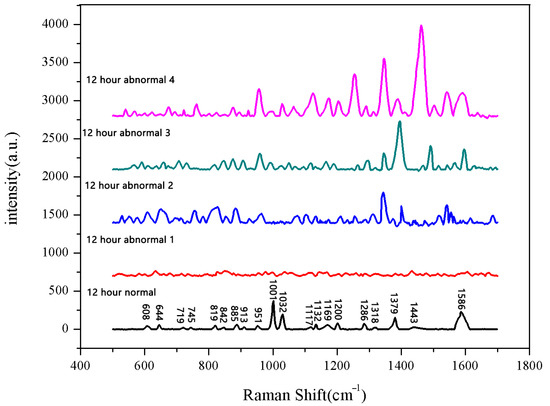
Figure 6.
Comparison of Raman spectra between normal and non-normal groups soaked for 12 h.

Figure 7.
The average Raman spectrum of normal seeds soaked for 18 h.
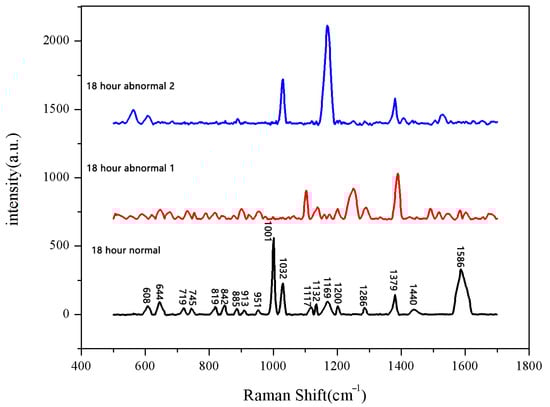
Figure 8.
Comparison of Raman spectra between normal and abnormal groups soaked for 18 h.
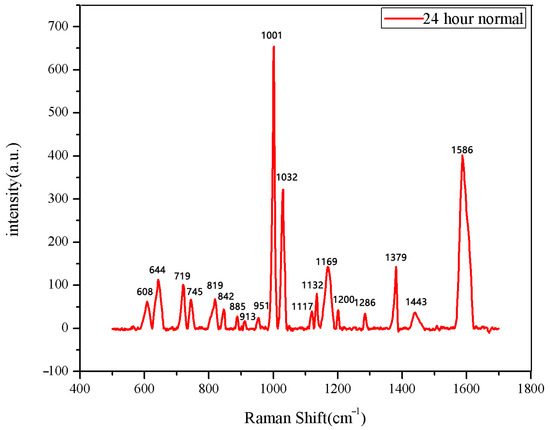
Figure 9.
The average Raman spectrum of normal seeds soaked for 24 h.
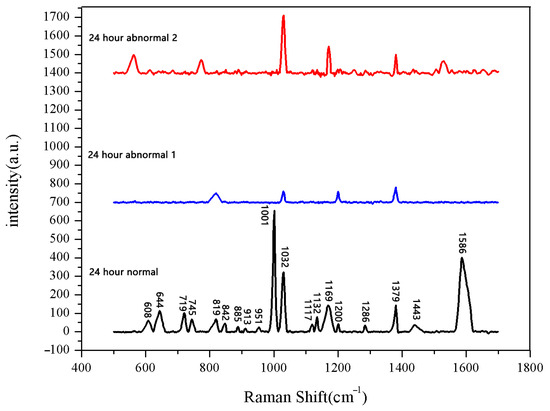
Figure 10.
Comparison of Raman spectra of sprouted seeds and unsprouted seeds after soaking for 24 h.
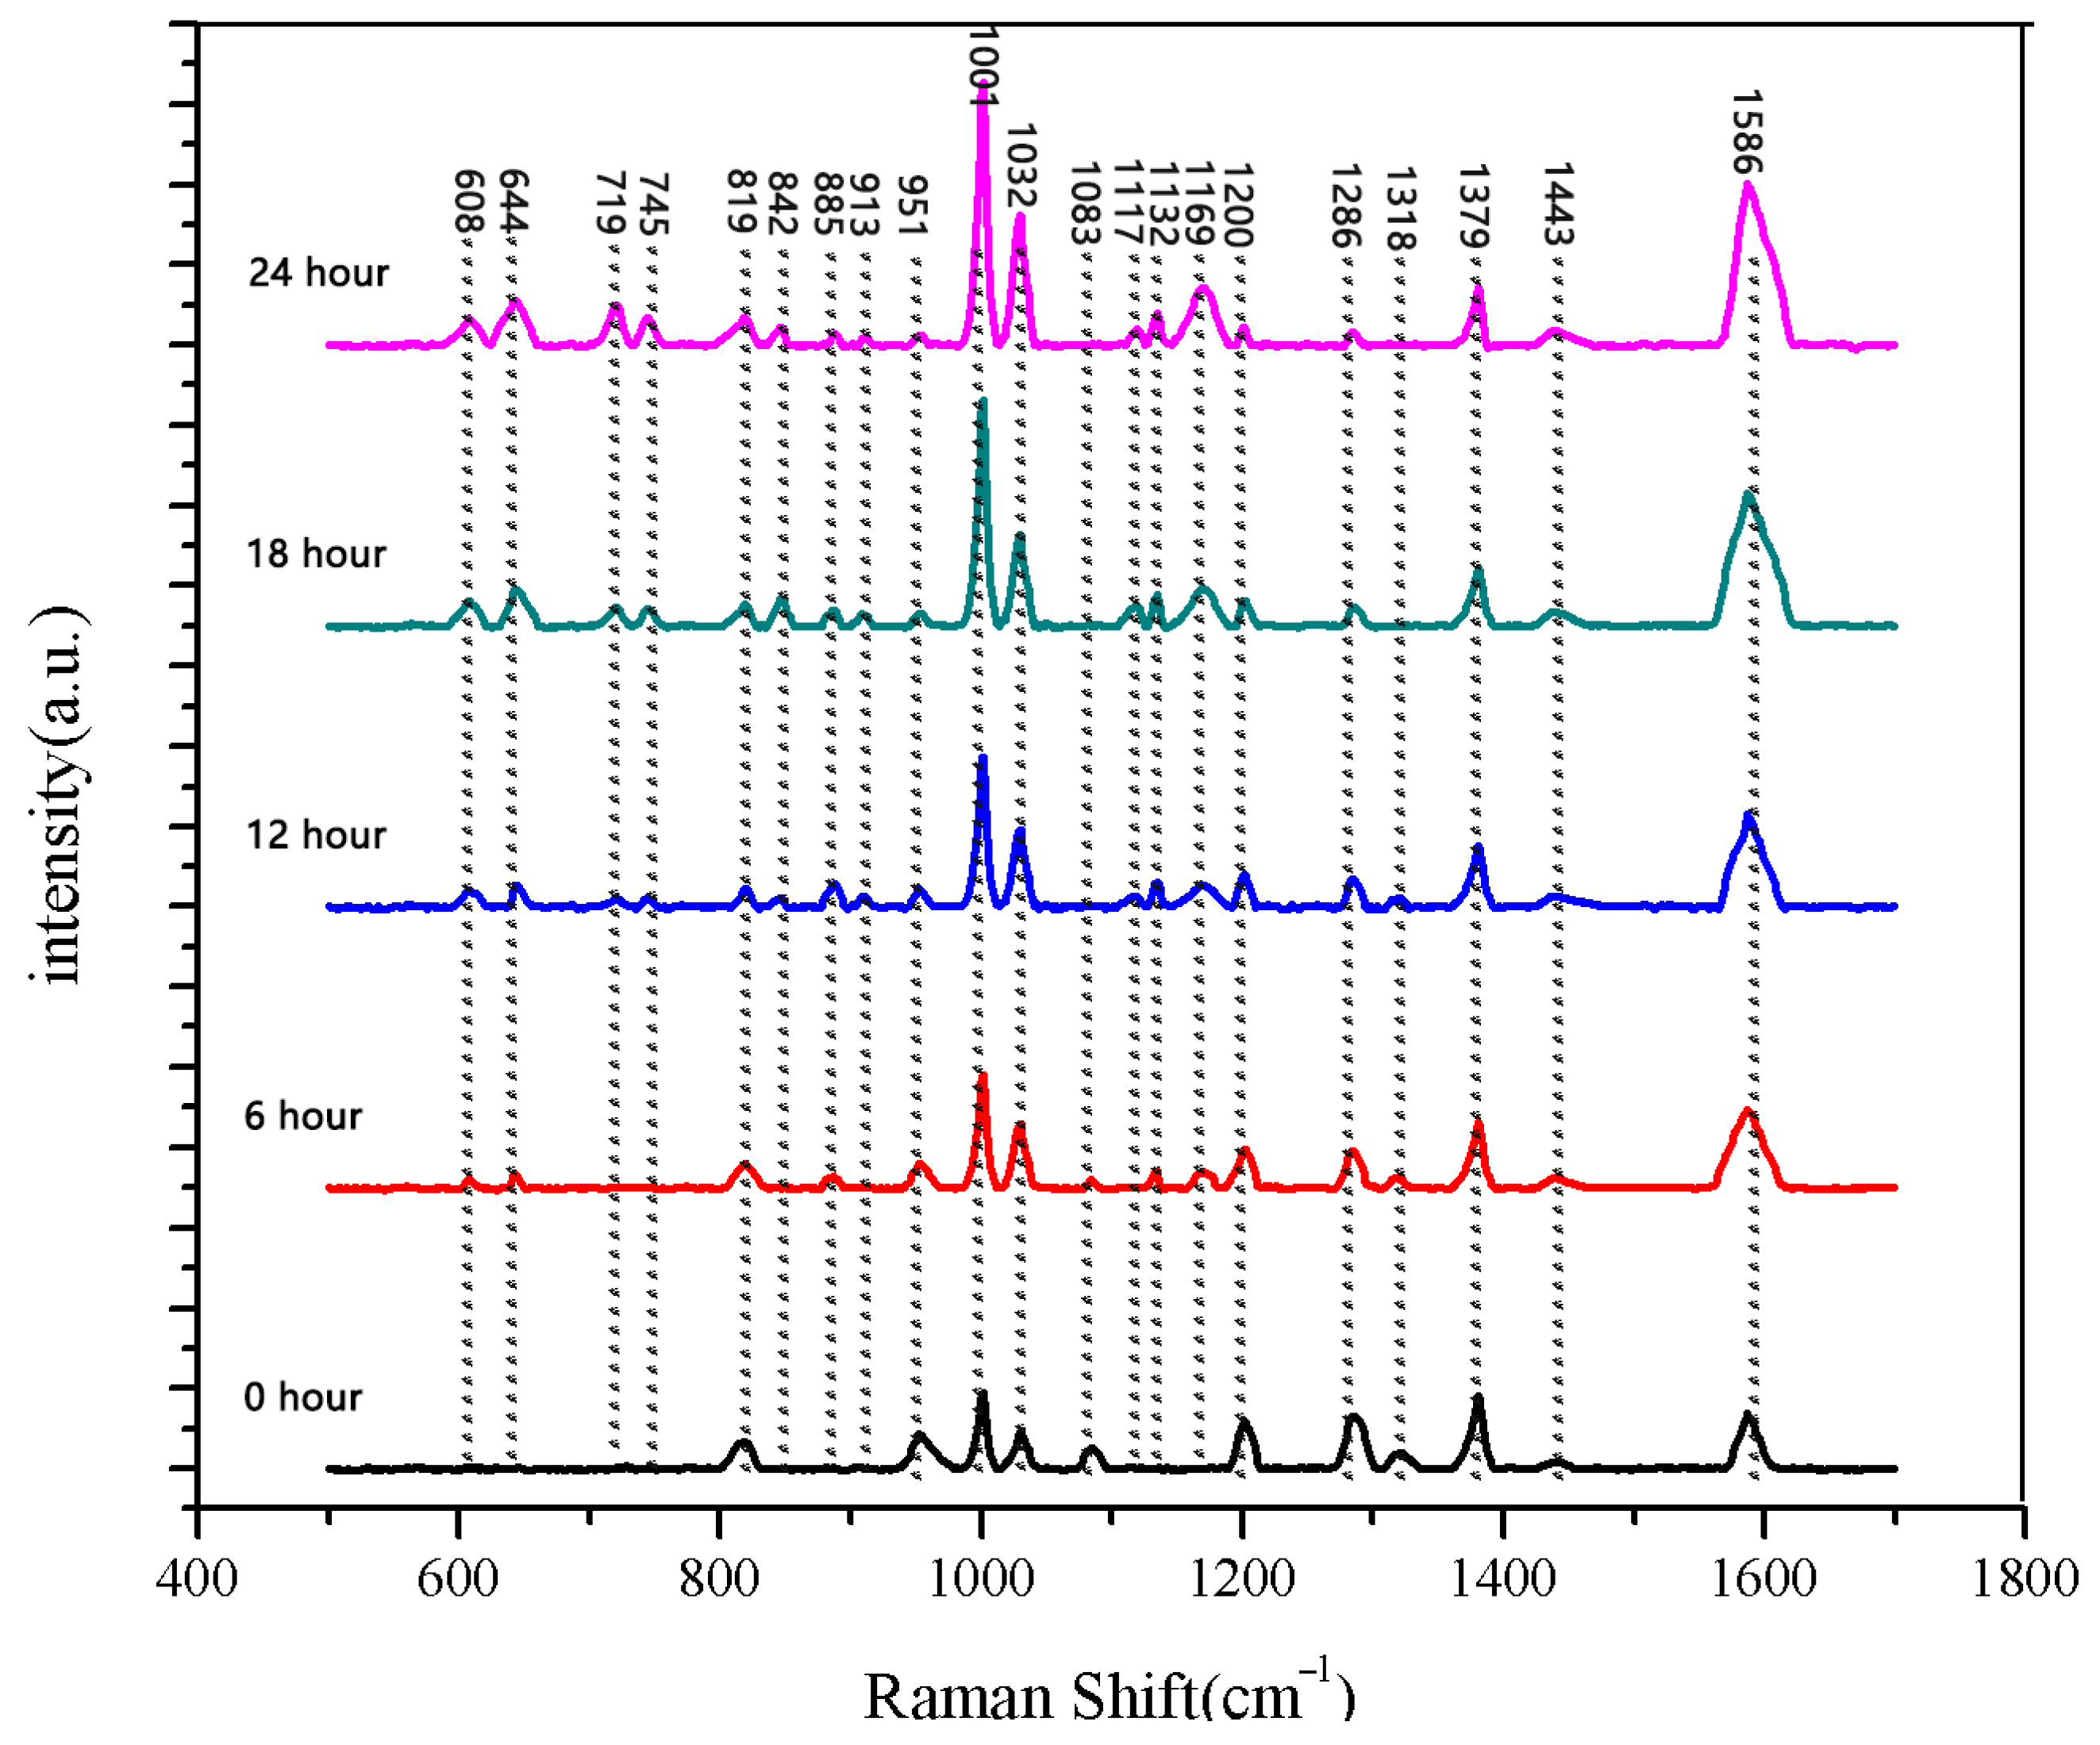
The seeds soaked for 24 h were measured. Among the 30 seeds, 28 seeds had sprouted, while the other 2 had not. We measured both the sprouted and unsprouted seeds. The Raman spectra of the sprouted seeds showed the same peak positions and numbers, whereas the spectra of the two unsprouted seeds were different from those of the sprouted seeds. We averaged the data of normal sprouted and unsprouted seeds. The comparison of Raman spectra between normal sprouted and unsprouted seeds is shown in Figure 10. The comparison of the average Raman spectra between the normal seeds from different soaking durations and the unsprouted seeds is shown in Figure 11.
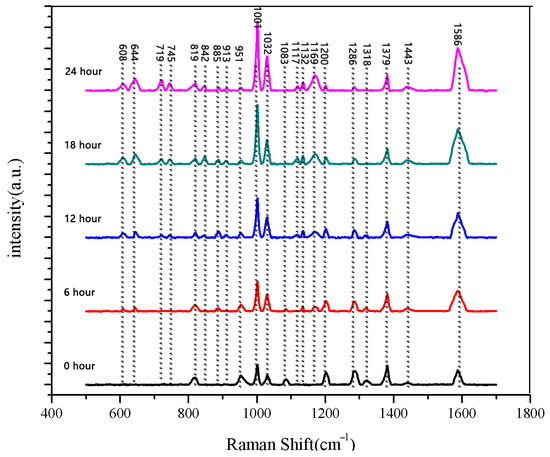
Figure 11.
Comparison of average Raman spectra of normal seeds at five different soaking stages.
4. Conclusions
The findings of this study underscore the potential of Raman spectroscopy as a robust and reliable tool for analyzing seed germination stages and detecting germination rates. The consistent spectral patterns observed in normal seeds, coupled with the significant differences identified in abnormal seeds, offer a solid foundation for rapid and non-invasive seed quality assessment. Future research endeavors should aim to broaden the spectrum of seed varieties subjected to testing and refine spectral analysis methodologies. Such advancements will further enhance the accuracy and applicability of Raman spectroscopy in seed quality evaluation, thereby contributing to more efficient and precise agricultural practices.
This study employed Raman spectroscopy to evaluate seed germination stages and detect germination rates. Normal seeds exhibited characteristic Raman bands (e.g., according to Table 1, 819 cm−1 for proteins, 1001 cm−1 and 1586 cm−1 for phenylalanine), which were either absent or significantly diminished in abnormal seeds. These observations suggest that the presence of specific amino acids and proteins is critical for successful germination, findings that are consistent with previous research on seed germination and Raman spectroscopy.

Table 1.
Tentative assignment table for seed SERS characteristic peaks (informed by the existing body of reference literature [1,6,9]).
In this study, surface-enhanced Raman spectroscopy (SERS) was used to provide a detailed analysis of biochemical markers. By identifying specific Raman bands associated with normal and abnormal germination, our approach enhances the precision of seed quality assessment.
These findings have significant implications for agricultural applications. Raman spectroscopy offers a rapid and non-invasive method for evaluating seed quality, which has the potential to increase crop yields and reduce costs. Future research should focus on expanding the range of seed varieties tested and refining spectral analysis methodologies to further improve the accuracy and applicability of this technique.
In conclusion, this study demonstrates the potential of Raman spectroscopy as a powerful tool for seed quality assessment and contributes to the growing body of literature on its agricultural applications.
Author Contributions
Conceptualization, J.T., S.L. and H.Z.; methodology, N.C., S.L. and Y.S.; software, H.Z.; validation, J.Z., H.W. and H.Z.; investigation, S.L. and H.Z.; resources, J.Z. and J.T.; writing—original draft preparation, J.Z. and H.W.; writing—review and editing, J.T. and N.C.; supervision, H.Z. and J.T.; project administration, S.L.; funding acquisition, Y.S. and N.C. All authors have read and agreed to the published version of the manuscript.
Funding
This work is supported by the National Natural Science Foundation of China (Project Nos: U24A20321 and 62175142).
Institutional Review Board Statement
Not applicable.
Informed Consent Statement
Not applicable.
Data Availability Statement
The data presented in this article will be made available by the authors on request.
Conflicts of Interest
The authors declare no conflict of interest.
References
- Lewis, E.N.; Qi, W.; Kidder, L.H.; Amin, S.; Kenyon, S.M.; Blake, S. Combined dynamic light scattering and Raman spectroscopy approach for characterizing the aggregation of therapeutic proteins. Molecules 2014, 19, 20888–20905. [Google Scholar] [CrossRef] [PubMed]
- Si, G.; Wang, Y.; Liu, X.; Sun, C.; Miao, J.; Li, Z. Detection of powder samples based on UV Raman—Fluorescence spectroscopy. Opt. Commun. 2024, 571, 130950. [Google Scholar] [CrossRef]
- Xu, M.L.; Gao, Y.; Han, X.X. Structure information analysis and relative content determination of protein and chitin from yellow mealworm larvae using Raman spectroscopy. Int. J. Biol. Macromol. 2024, 272, 132787. [Google Scholar] [CrossRef] [PubMed]
- Lin, M.; Guan, J.; Diop, M.A.; Zhao, X.; Ma, S.; Li, Y.; Chen, P. Unveiling ionic structure in the LiF-NdF3 molten salt system as determined by Raman spectroscopy and quantum chemical calculations. J. Mol. Liq. 2024, 400, 124602. [Google Scholar] [CrossRef]
- Fukue, H.; Nakatani, T.; Takabayashi, S.; Okano, T.; Kuroiwa, M.; Kunitsugu, S.; Oota, H.; Yonezawa, K. Raman spectroscopy analysis of the chemical structure of diamond-like carbon films deposited via high-frequency inclusion high-power impulse magnetron sputtering. Diam. Relat. Mater. 2024, 142, 110768. [Google Scholar] [CrossRef]
- Khan, U.M.; Sameen, A.; Decker, E.A.; Shabbir, M.A.; Hussain, S.; Latif, A.; Abdi, G.; Aadil, R.M. Implementation of plant extracts for cheddar-type cheese production in conjunction with FTIR and Raman spectroscopy comparison. Food Chem. 2024, 22, 101256. [Google Scholar] [CrossRef]
- Maurizi, L.; Iordachescu, L.; Kirstein, I.V.; Nielsen, A.H.; Vollertsen, J. Do drinking water plants retain microplastics? An exploratory study using Raman micro-spectroscopy. Heliyon 2023, 9, 2405–8440. [Google Scholar] [CrossRef]
- Esteves, B.; Pimenta, S.; Maciel, M.J.; Costa, M.; Baltazar, F.; Cerqueira, M.F.; Alpuim, P.; Silva, C.A.; Correia, J.H. Raman spectroscopy for classification of neoplastic and non-neoplastic CAM colon tumors. Heliyon 2024, 10, 2405–8440. [Google Scholar] [CrossRef]
- Baranska, M.; Roman, M.; Dobrowolski, J.C.; Schulz, H.; Baranski, R. Recent advances in Raman analysis of plants: Alkaloids, carotenoids, and polyacetylenes. Curr. Anal. Chem. 2013, 9, 108–127. [Google Scholar] [CrossRef]
- Cialla-May, D.; Zheng, X.S.; Weber, K.; Popp, J. Recent progress in surface-enhanced Raman spectroscopy for biological and biomedical applications: From cells to clinics. Chem. Soc. Rev. 2017, 46, 3945–3961. [Google Scholar] [CrossRef]
- Wang, X.; Wang, A.; Zhuang, M.; Ke, S.; Ning, M.; Zhou, Z. Impact of metabolites derived from Bacillus velezensis on the germination of tigernut seeds and the underlying molecular regulatory mechanism. Food Biosci. 2024, 62, 105169. [Google Scholar] [CrossRef]
- Mohajer, M.H.; Monfaredi, M.; Rahmani, M.; Martami, M.; Razaghiha, E.; Mirjalili, M.H.; Hamidi, A.; Ghomi, H.R. Impact of dielectric barrier discharge plasma and plasma-activated water on cotton seed germination and seedling growth. Heliyon 2024, 10, 2405–8440. [Google Scholar] [CrossRef] [PubMed]
- Sivachandiran, L.; Khacef, A. Enhanced seed germination and plant growth by atmospheric pressure cold air plasma: Combined effect of seed and water treatment. RSC Adv. 2017, 7, 1822–1832. [Google Scholar] [CrossRef]
- Ng, J.; Liao, I.Y.; Jelani, M.F.; Chen, Z.Y.; Wong, C.K.; Wong, W.C. Multiview-based method for high-throughput quality classification of germinated oil palm seeds. Comput. Electron. Agric. 2024, 218, 108684. [Google Scholar] [CrossRef]
- Rondan, W.; dos Reis, R.A.; Acuña, J.J.S.; Seabra, A.B.; Champi, A. Influence of multilayers Bernal and Rhombohedral graphene obtained by green chemistry on the acceleration in the germination process of tomato seeds. Diam. Relat. Mater. 2024, 145, 111077. [Google Scholar] [CrossRef]
- Survase, A.A.; Kanase, S.S. Novel microbial synthesis of rGO nanosheets for effective photocatalytic remediation of Acid Blue 113 dye, improved seed germination, antimicrobial and antioxidant applications. J. Mol. Struct. 2024, 1302, 137421. [Google Scholar] [CrossRef]
- Weishaar, C.E.; Phippen, W.B. Indigo (Indigo suffruticosa Mill.) seed germination to improve commercial viability. Ind. Crops Prod. 2024, 221, 119347. [Google Scholar] [CrossRef]
- Li, Y.N.; Jiang, D.; Liu, Y.Y.; Ding, W.M.; Ding, Q.S.; Zha, L.Y. Testing of germination rate of hybrid rice seeds based on near-infrared reflectance spectroscopy. Spectrosc. Spectr. Anal. 2014, 34, 1528. [Google Scholar]
- Ambrose, A.; Lohumi, S.; Lee, W.H.; Cho, B.K. Comparative nondestructive measurement of corn seed viability using Fourier transform near-infrared (FT-NIR) and Raman spectroscopy. Sens. Actuators B Chem. 2016, 224, 500–506. [Google Scholar] [CrossRef]
- de Melo Bessa, L.A.; Nazário, M.L.F.; Izumi, C.M.S.; Constantino, V.R.L.; Lourenço, V.; Lopes, E.A.; Mizubuti, E.S.G.; Tronto, J. Enhanced white rot control in garlic bulbil using organic–inorganic hybrid materials as coating membranes. Dalton Trans. 2024, 53, 7880–7889. [Google Scholar] [CrossRef]
- Todorenko, D.A.; Slatinskaya, O.V.; Hao, J.; Seifullina, N.K.; Radenović, Č.; Matorin, D.N.; Maksimov, G.V. Photosynthetic pigments and phytochemical activity of photosynthetic apparatus of maize (Zea mays L.) leaves under the effect of thiamethoxam. Agric. Biol. 2020, 55, 66–76. [Google Scholar] [CrossRef]


Disclaimer/Publisher’s Note: The statements, opinions and data contained in all publications are solely those of the individual author(s) and contributor(s) and not of MDPI and/or the editor(s). MDPI and/or the editor(s) disclaim responsibility for any injury to people or property resulting from any ideas, methods, instructions or products referred to in the content. |
© 2025 by the authors. Licensee MDPI, Basel, Switzerland. This article is an open access article distributed under the terms and conditions of the Creative Commons Attribution (CC BY) license (https://creativecommons.org/licenses/by/4.0/).