Abstract
We report the design, implementation and test of a Mid-Infrared spectrometer proof-of-concept that utilizes an uncooled micro-bolometer array, sensitive in the 3–14 µm spectral range, integrated in a conventional optical dispersive spectrometry setup. Such a spectrometer enables instantaneous measurements across this broad spectral range, comparable to that of a FTIR but with a more compact design and without moving parts. This makes it ideal for integration into portable, battery-powered devices such as handheld scanners. The Mid-IR range offers significant advantages over NIR-SWIR spectrometers, especially for organic compound analysis. A notable application for this instrument: plastic waste sorting—including black plastics—was tested with significant accuracy and effectiveness of plastic classification (on PP, PET and PE samples) with a very simple machine learning algorithm.
1. Introduction
The management of waste, such as plastics, is a major environmental challenge that demands a transformation of society, regulations, and industries. The European Union’s 2018 directive on waste management provides a regulatory framework for this transformation, establishing guidelines and strict rules for member states to comply, including ambitious targets for plastic recycling [1]. To achieve a circular economy through reduced waste, increased reuse, and enhanced recycling [2], advances and innovations in sorting technologies are required. These technologies should be affordable, accurate, and able to process large quantities of materials quickly. Optical methods such as infrared spectroscopy emerges as the most relevant method for this application, as it enables the classification of different plastics through the analysis of their chemical composition [3].
In this document we will introduce a new type of affordable and highly sensitive infrared image sensor well suited of infrared spectroscopy: a Broadband (BB) uncooled micro-bolometer array, sensitive in the 3–14 µm range named PICO640S BB (manufactured by Lynred, Veurey-Voroize, France), derived thermal imaging technologies. We propose a Proof-of-Concept (PoC) for a new type of infrared spectrometer that features clear advantages over the current state of the art. With applications that extends far beyond plastic sorting, which encompasses various chemical analysis applications for organic compounds, including agriculture, food processing, soil analysis, pharmacy, biology, gas analysis, textiles sorting, earth observation small-sat and more.
2. State of the Art
2.1. Mid-IR Spectrometry Applied to Organic Chemistry Analysis
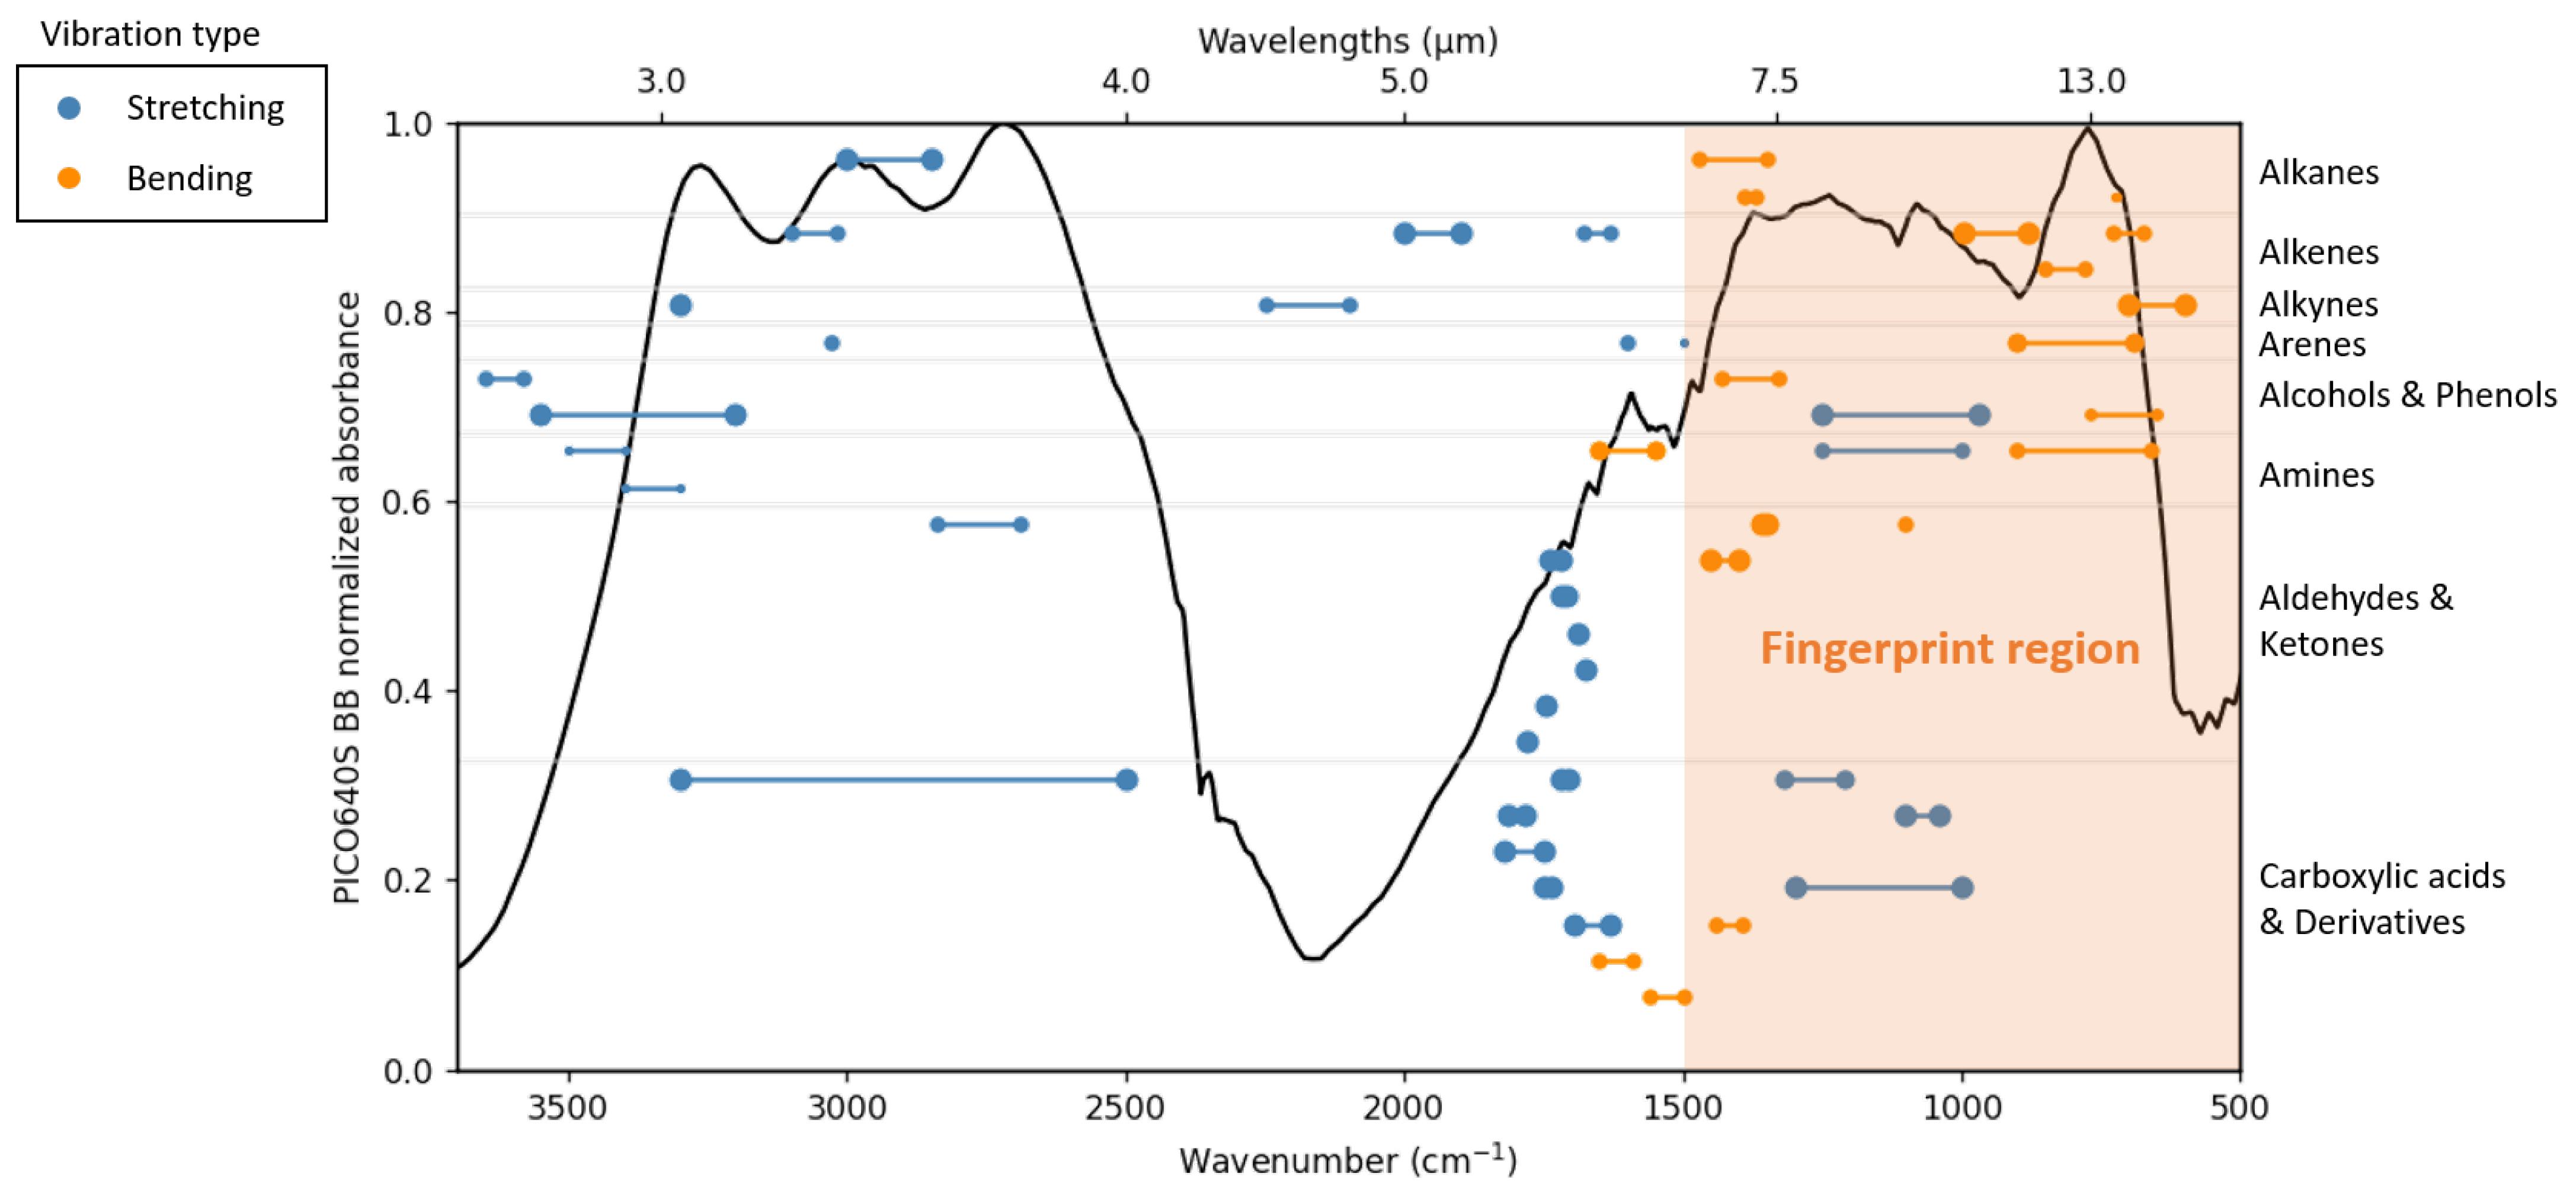
Mid-IR absorption spectroscopy is a versatile technique extensively employed for analyzing organic compounds, such as polymers. By detecting the absorption of infrared radiation by specific molecular bonds, it enables the identification and quantification of functional groups present in organic molecules. Figure 1 illustrates the absorption frequency ranges of various functional groups (adapted from [4]), overlaid with the spectral response curve of our BB micro-bolometer.
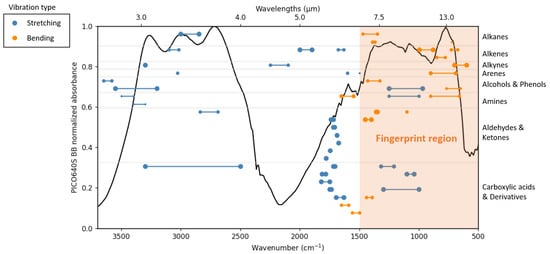
Figure 1.
Absorption frequencies of organic compounds, plotted with the BB micro-bolometer spectral response.
Organic compounds exhibit numerous spectral features in the Mid-IR range that align nicely with the sensitivity ranges of our 3–14 µm BB micro-bolometer. This band largely encompasses the ‘fingerprint region’: commonly defined as the 1500–500 cm−1 range, and characterized by highly distinctive absorption patterns. Capturing their spectrum over this broad spectral band yields high confidence in compound identification, including blends and additives.
2.2. Fourier-Transform Infrared (FTIR) Spectrometry
The Fourier-Transform Infrared (FTIR) spectrometer is the laboratory reference instrument for IR spectroscopy, covering the full Mid-IR range. It relies on a polychromatic Michelson interferometer design, which involves a moving mirror and a broadband source (typically a Globar thermal source). As the mirror travels, a mono-element infrared detector (typically a pyroelectric sensor, such as DTGS (Deuterated triglycine sulfate) or a photodiode such as HgCdTe) captures the resulting interferogram, which is then converted into a spectrum using the cosine inverse Fourier transform. The mirror’s step movement and the source’s brightness determine the spectral range (typically 2–20 µm), while the mirror’s travel distance defines the achievable spectral resolution [5].
One major drawback of FTIR spectroscopy is its inherent complexity, stemming from its optical design, notably the presence of a moving component (the mirror). The measurement by displacement of the mirror does not allow for instantaneous spectral measurement, making it unsuited for high-throughput spectral analysis applications, such as those required on sorting lines. Infrared spectroscopy outside the lab’ needs alternative methods to FTIR for field deployment [6].
2.3. Conventional Optical Dispersive Spectrometry
Current plastic sorting technologies rely heavily on conventional optical dispersive spectrometry. This technique involves a broad-band light source that illuminates the sample, causing certain spectral components to interact with it. The resulting spectral components are then separated angularly using a dispersive optical element (prism or diffraction grating), and focused onto a linear sensor. Each pixel corresponds to a narrow spectral band, allowing for the simultaneous measurement of multiple wavelengths. Such a spectrometer can provide a single, average spectrum of a sample, without spatial resolution. By upgrading this setup with an array sensor and suitable imaging optics, we can transform it into a push-broom Hyperspectral Imager (HSI), enabling the capture of both spectral and spatial data.
Most spectrometers for plastic sorting rely on InGaAs linear or array photo-detectors. The InGaAs diode is sensitive the 0.9–1.7 µm waveband, referred to as the Short-Wave Infrared (SWIR); or sometimes as the Near Infrared II (NIR-II), or the long-wave NIR. The SWIR spectroscopy technique has gained popularity due to its practical advantages, and notably the commercial availability of InGaAs sensors. Allowing for the classification of main plastic types with a level of accuracy that is sufficient for most use-cases, even though the analytical range is relatively narrow. These spectrometers can be found in various spectrometry systems, such as portable, handheld devices [7] or integrated into high-speed push-broom HSI cameras [8]. The latter are often mounted on conveyor belts, enabling rapid sorting of plastics at speeds of 3–5 m/s, with VGA (Video Graphics Array, 640 × 512 image format) cameras operating at framerates up to 600 Hz [9].
One of the main drawbacks of InGaAs-based spectroscopy is its inability to identify plastics colored with black carbon dye, due to the absorption of said dye in both the visible and the SWIR ranges. These plastics account for a significant proportion of high-value plastics, found in automotive parts or electronic product packaging for example. An industrial solution for sorting black plastics requires the use of infrared sensors operating in the Middle-Wave Infrared (MWIR) band (3–5 µm), based on InSb or HgCdTe photo-detectors arrays [10], cooled at cryogenic temperatures around 110 K. Such a solution enables high-speed and high-performances but drastically increases the complexity and cost of an MWIR HSI camera, as it requires the use of technologies typically reserved for high-end defense and space applications.
For optimal analysis and classification accuracy, it is essential to examine the spectral signatures across the full Mid-IR range. Indeed, research has consistently shown that the spectral features found across this broad infrared range (using laboratory FTIRs) is invaluable for accurate identification and characterization of plastics and microplastics, including those colored with black carbon dye [11,12,13].
Conventional dispersive spectroscopy in the Mid-IR range is getting more and more popular due to the recent availability of sensors such as uncooled linear pyroelectric sensors (e.g., ) [14]. Compared to pyroelectric sensors, micro-bolometers offer orders of magnitude higher sensitivity, making them an attractive option for Mid-IR spectroscopy applications. There are few reported instances of spectrometers utilizing micro-bolometer sensors, but limited to the standard Long-Wave Infrared (LWIR) band (8–14 µm) such as those described in references [15,16], which employ bolometers in Czerny-Turner (blazed grating and mirrors) and Dyson (concave grating and lens) spectrometer configurations, respectively.
The introduction of BB micro-bolometers is likely to play a role in the growth of this type of spectrometer. Such a spectrometer combines the wide Mid-IR sensitivity band of the FTIR, the benefits of conventional dispersive spectroscopy (simplicity and instantaneous measurements), and high sensitivity and affordability of micro-bolometers.
3. Materials and Methods
3.1. Broadband Micro-Bolometer Array
Uncooled micro-bolometer focal plane arrays (FPAs) are key components in thermal imaging systems and continue to benefit from sustained technological and industrial advancements to improve performance (e.g., thermal sensitivity) and reduce cost. These advancements are notably driven by ever growing civilian applications with high volumes, such as night-vision, thermography, and more recently: automotive.
A micro-bolometer pixel is a free standing micro-plate optimized to absorb thermal radiation in the LWIR band (Long Wave Infrared, 8–14 µm), with an optical cavity enhanced absorptive structure known to as a quarter-wave Fabry-Perot cavity. This results in an inhomogeneous spectral response, where absorbance is optimal in regions of constructive interference (fundamental resonance in LWIR and harmonic in MWIR) and with destructive interference around 4.6 µm, characterized by a non-zero dip in the response.
The sensor used in this study is based on Lynred’s state-of-the art thermal sensor PICO640S: a VGA (640 × 480) image sensor with the highly sensitive 17 µm pitch Vanadium Oxide (VOx) micro-bolometer design [17]. Conventional micro-bolometers FPAs, such as PICO640S, have a filtering window that cuts off wavelengths below 8 µm, primarily to limit the sensor’s sensitivity to the LWIR atmospheric transparency window. Here, we introduce the PICO640S BB, which features a broadband (3–14 µm), anti-reflective window, allowing the sensor to be sensitive in both the MWIR and LWIR ranges. This expanded spectrum opens up new applications for these sensors [18], such as optical gas imaging [19], high-temperature thermography [20], early fire detection, spectrometry and active multispectral imaging [21], new-space/small-sat, etc. Spectral response of PICO640S BB, compared with standard PICO640S, is plotted in Figure 2.
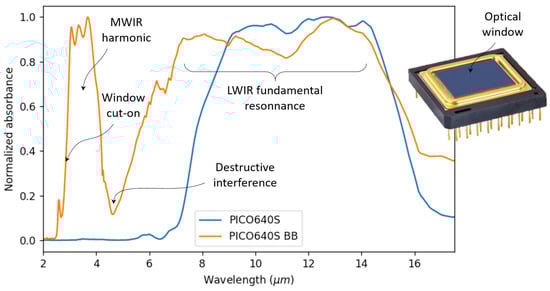
Figure 2.
Normalized spectral absorbance of the 17 µm VOx micro-bolomter with a standard LWIR window (PICO640S) and with the BB window (PICO640S BB), measured with a FTIR.
PICO640S BB has a typical Noise Equivalent Temperature Difference (NETD) measured around 20 mK (Scene temperatures 20–35 °C, aperture f/1.0, 30 Hz framerate, panchromatic) from a few tests samples. Noise Equivalent Power (NEP) is estimated at 4.5 pW, which is orders of magnitude better than typical pyroelectric sensors such as lithium tantalite ( about 1.1 nW at 120 Hz). This improvement in therms of NEP translates into an improvement on the signal to noise ratio, by a factor ×244.
For conventional, non-imaging, spectrometry, only a linear format is needed (640 pixels, here), as explained earlier. As for comparison, typical linear pyroelectric sensors have 128, 256 or 510 elements. A large number of pixels means improved spectral sampling in a conventional spectroscopy setup.
The VGA image format is well suited for push broom HSI. Note that PICO640S is able to operate at 120 Hz full-frame rate, which is compatible with moderate speed conveyor belts. There is little interest to overclock the sensor up to higher framerates, due to the micro-bolometer’s thermal time constant ms. This quantity characterizes the pixel’s response time to a fast temperature variation of the scene, resulting in a visual effect similar to a motion blur. This effect, inherent to thermal sensor technologies, makes such a sensor unsuited for high-speed conveyor belts applications (>1 m/s).
3.2. Optical Design of the Spectrometer
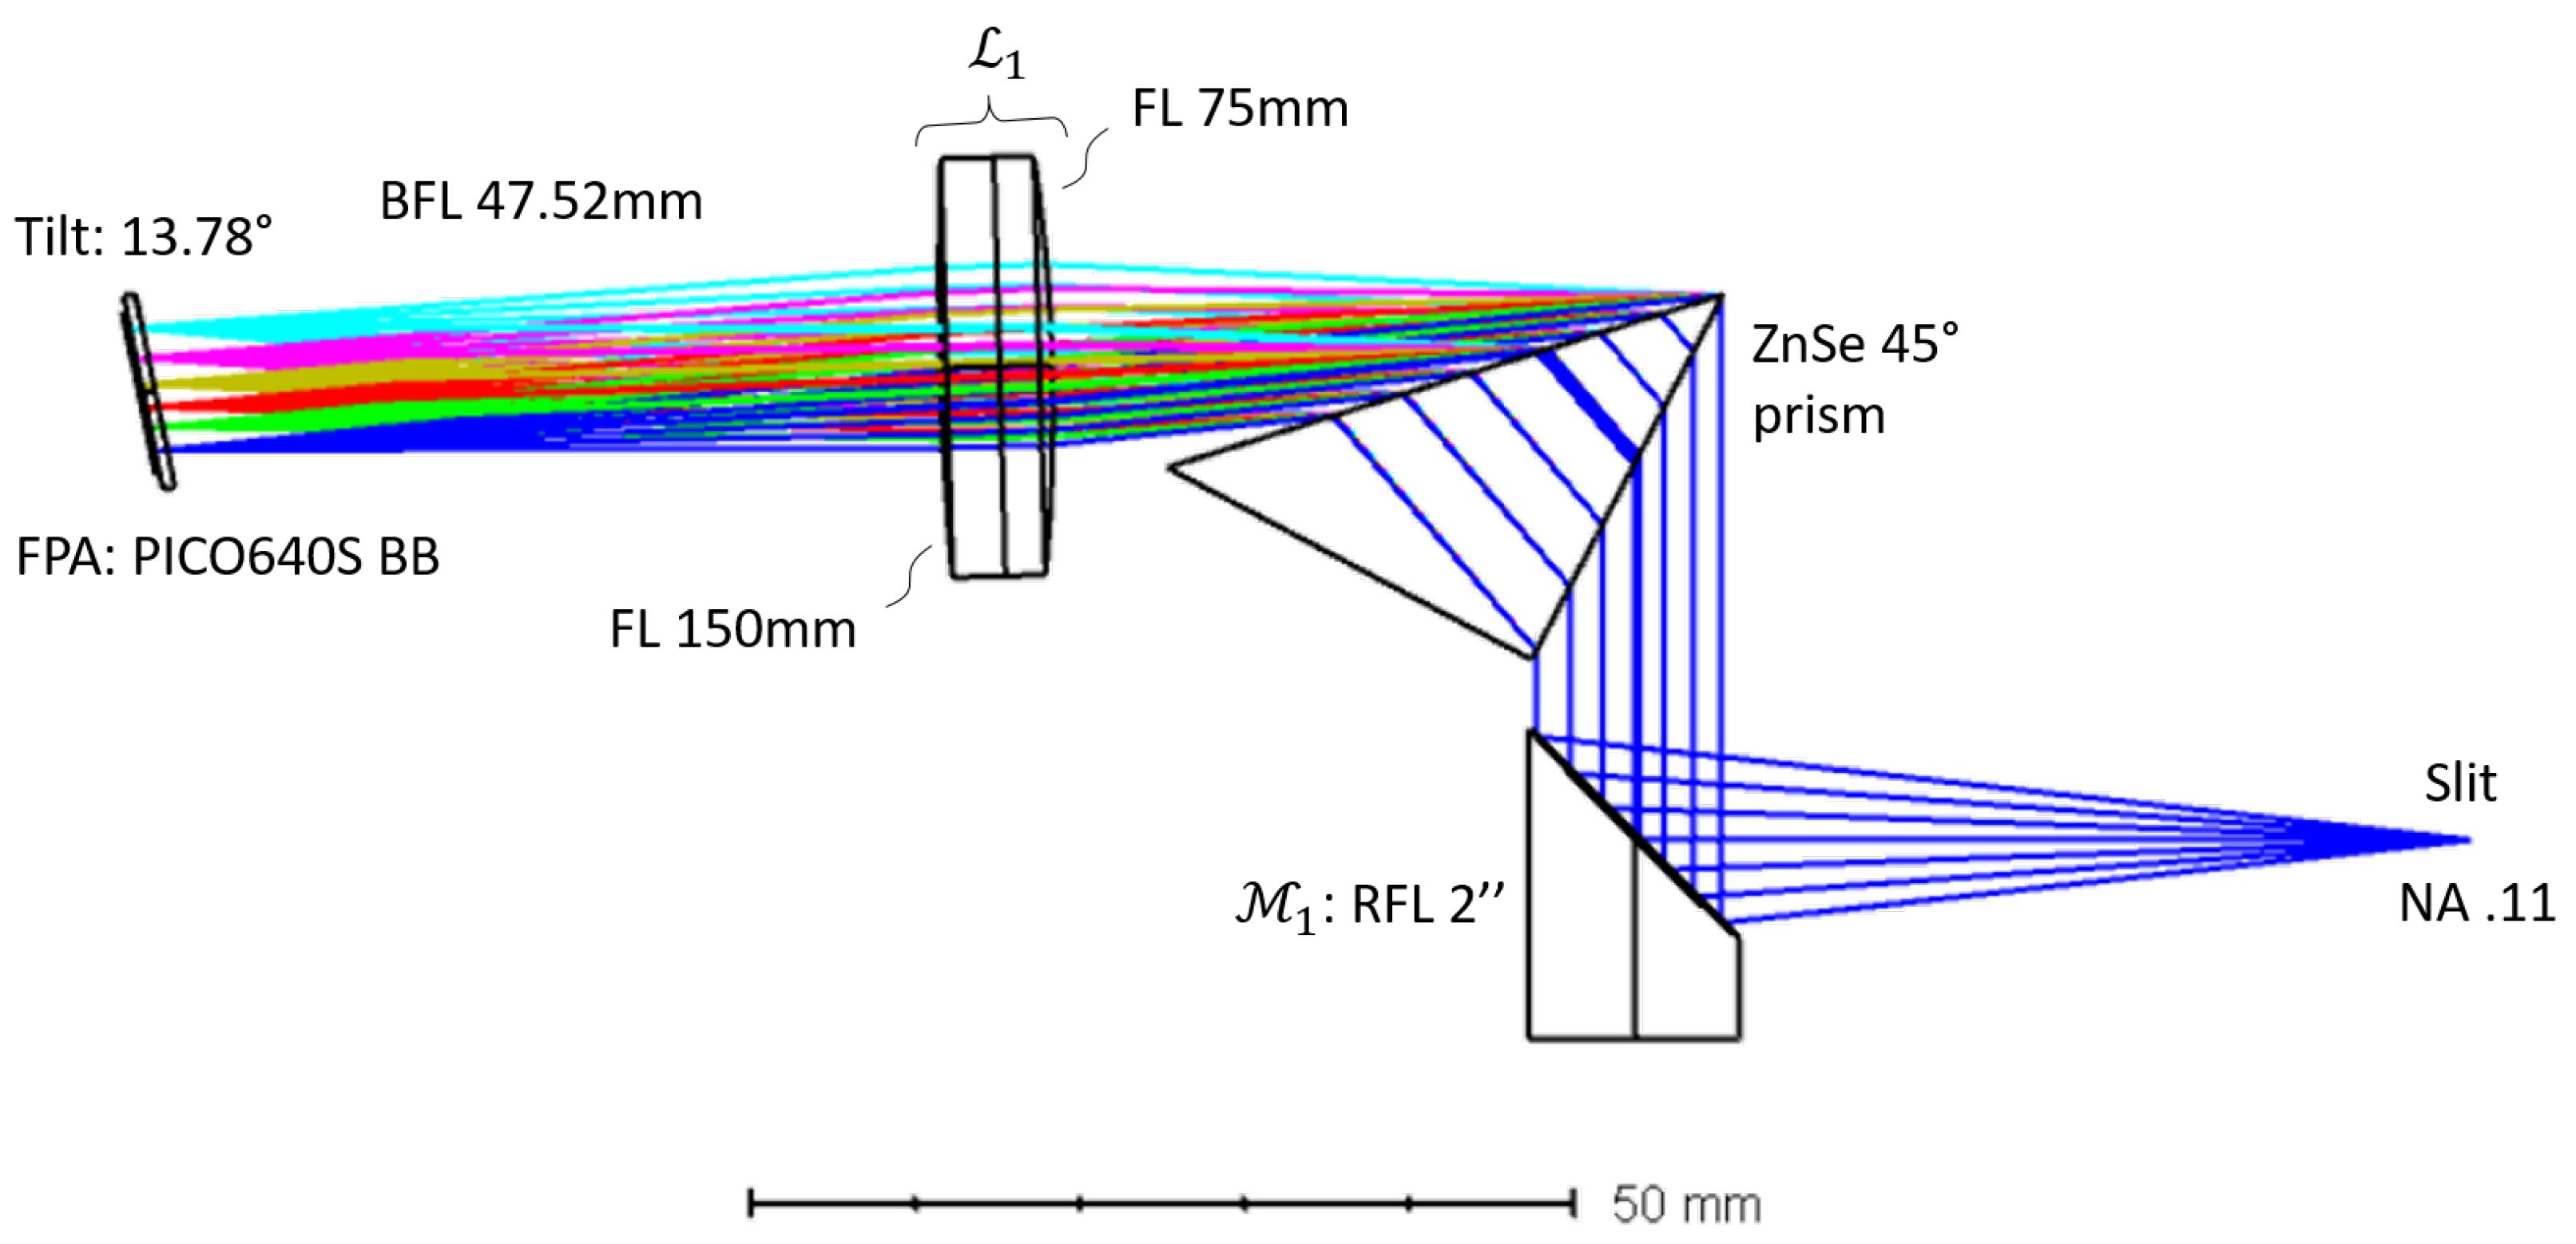
We consider wavelengths from m to m, this gives a spectral range of m. The optical setup is a conventional spectroscopic setup, illustrated in Figure 3 and designed using the Zemax Optic Studio 2023 R2 software. Our goal is to have a compact design, primarily to make it compatible with handheld application, but also to minimize the optical path length and mitigate the impact of atmospheric fluctuations (e.g., , ). For this prototype, we use only off-the-shelf optical components.
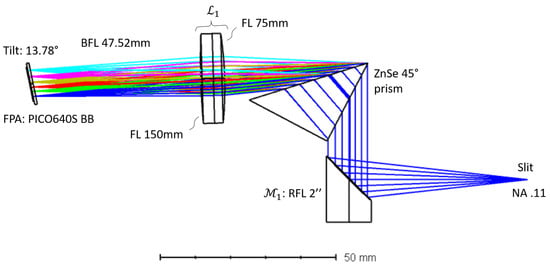
Figure 3.
Optical design of the spectrometer, layout from Zemax Optic Studio. Colors represents different wavelengths.
We analyze a polychromatic beam through a slit with a numerical aperture . This beam is collimated by a parabolic mirror with a reflective focal length = 2′′ (i.e., 50.8 mm), without chromatic effects, but with distortion and field curvature aberrations.
For chromatic dispersion, we have opted for a Zinc Selenide (ZnSe) prism, which exhibits transparency in the mid-IR range. Due to its high refractive index, an equilateral prism is not possible, as it would lead to total internal reflections. Instead, we use an right-angled ZnSe prism with a 45° angle (PS702, from Thorlabs, Newton, NJ, USA), in the unconventional configuration shown in Figure 3. The performances of the spectrometer would be improved, with a proper tailor-made dispersive element, such as a coated ZnSe Pellin-Broca-like prism; or a blazed/Littrow diffraction grating.
This wavelength-dependent angular dispersion is projected onto the FPA using the lens group : a combination of two ZnSe spherical plano-convex lenses (1′′ diameter, FL 75 mm and 150 mm, LA7028-E4 and LA7660-E4 from Thorlabs) with a 3–14 µm BB anti-reflection coating. We account for the chromatic longitudinal shift of this lens group through a 13.78° tilt of the FPA.
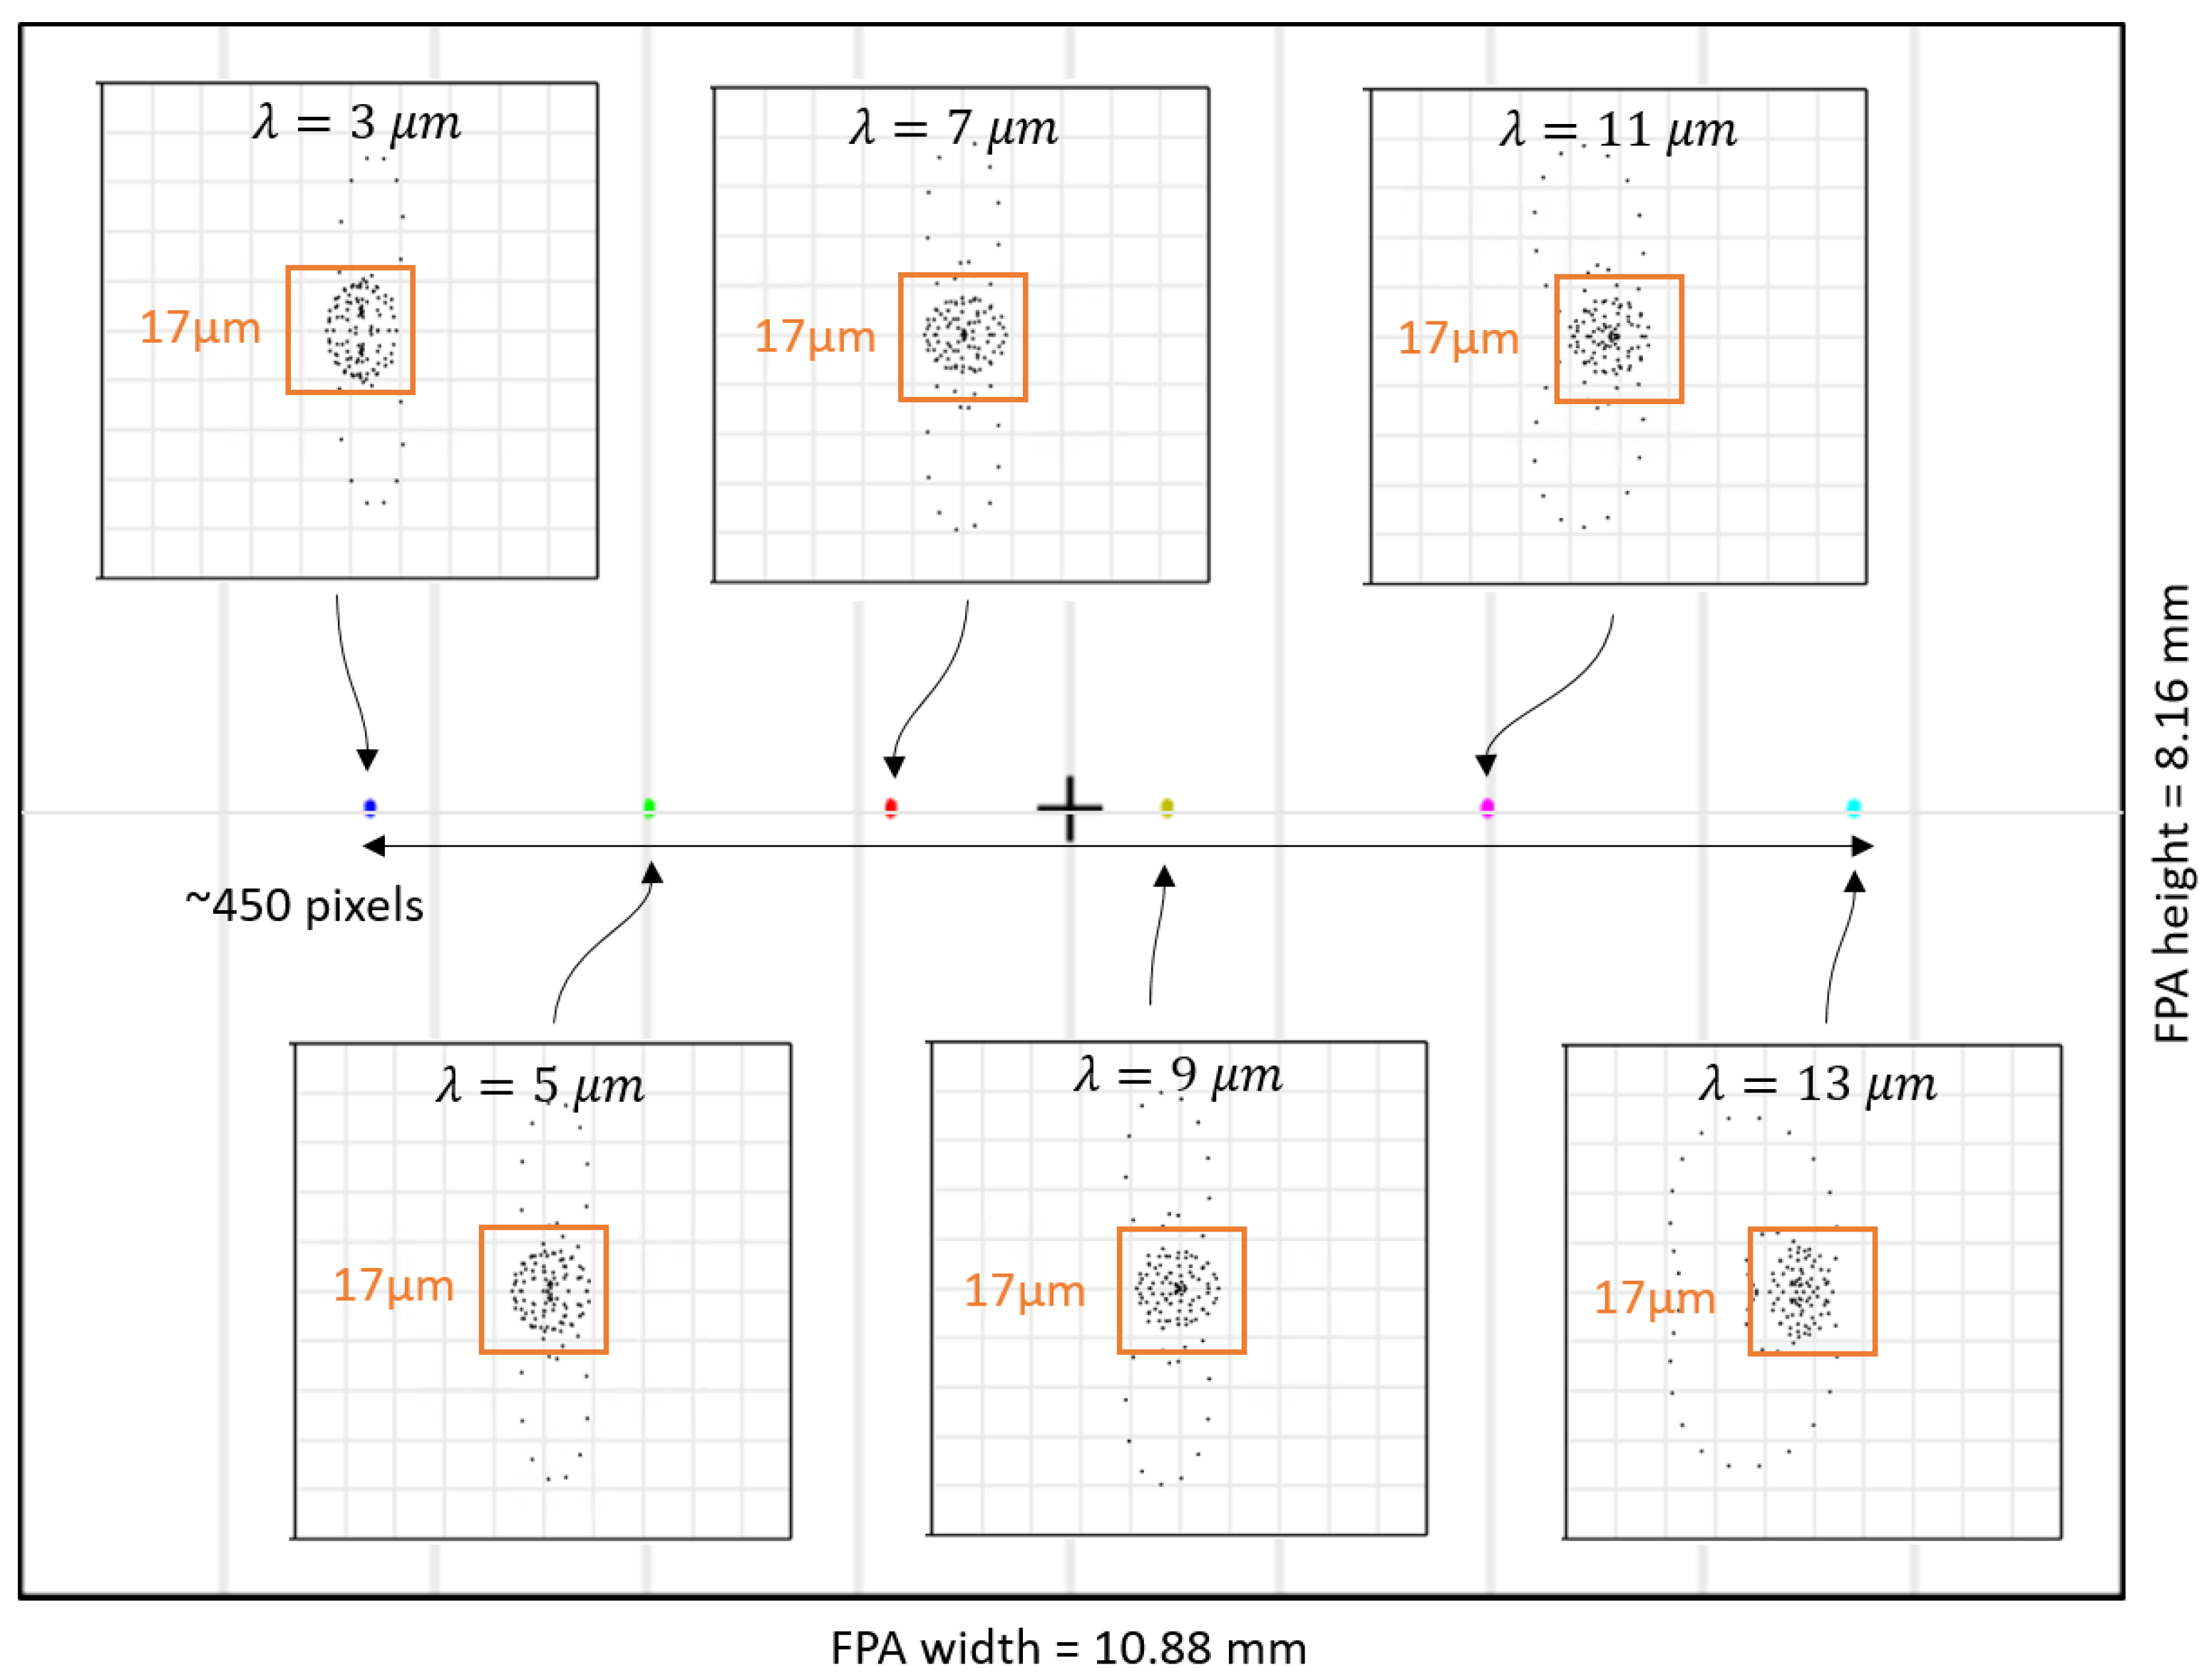
We show in Figure 4, the spot diagram, which gives the geometrical spreading of the optical spot on the FPA (represented by the black frame), sampled on six spectral components from 3 µm to 13 µm. We verify that the spots, associated with the sampled wavelengths, are properly aligned with a line on the FPA, = 450 pixels wide.
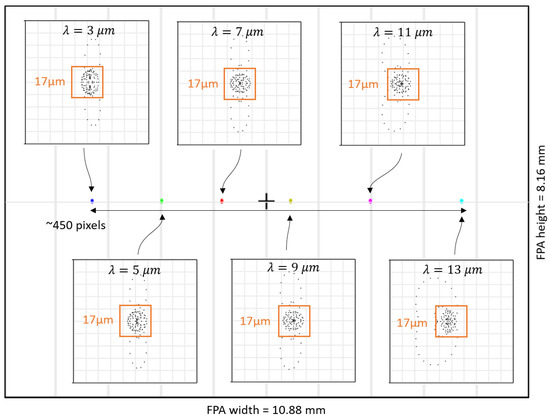
Figure 4.
Spot diagram on a line of the FPA (black frame) and zoomed views of each wavelengths at pixel level (orange box).
We show that spectral resolution is pixel limited in theory, as shown in the zoomed views, by the 17 µm pitch (orange box). We gives the theoretical spectral resolution in pixel limit:
In practice, spectral resolution will be limited by both the slit opening and misalignment.
3.3. Lighting
We opt for the efficient, compact and affordable thermal source HIS2000R-0WC (from Infrasolid GmbH, Berlin, Germany).This source consists of a high-emissivity (>0.9) radiating element made from NiCr nanowires at a temperature of 630 °C, that has a spectral emittance close to that of a black-body [22]. This radiating is free standing in the focal plane of a gold-plated Winston cone collimator and a retro-reflector. This non-imaging optical system enables directing the flux from the source more efficiently towards the sample.
The source is powered at 2.5 W (voltage 3.8 V, current 660 mA, continuous) and delivers an optical power of 830 mW. We use a Low-Dropout (LDO) regulator to stabilize the source (DCB.8.2500 from Infrasolid GmbH). The lighting block (source and regulator) has a total electrical power consumption of 3 W, making it compatible with battery-powered portable systems.
3.4. Optical Setup and Implementation
The spectrometer is assembled in an optical table, using off-the-shelf optical and mechanical components. Schematic of the full assembly is shown in Figure 5.
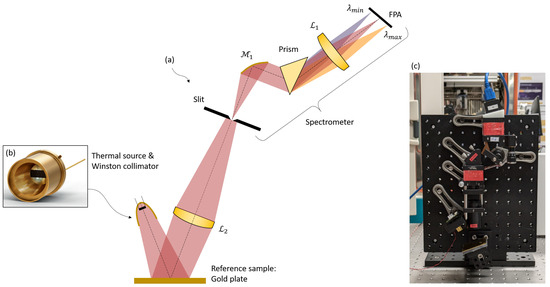
Figure 5.
(a) Schematic of the optical setup. (b) View of the HIS2000R-0WC thermal source. (c) Photography of the opto-mechanical assembly.
The assembly includes a spectrometer portion, which comprises the optical elements ranging from the adjustable slit to the PICO640S BB camera. It allows analysis of the spectrum of any polychromatic beam passing through the slit.
The rest of the system consists of the illumination block (radiative element and Winston cone collimator), which provides the beam to interact with a sample on the sample holder, and then projects the beam onto the slit using lens (, FL 50 mm, LA7656-E4 from Thorlabs) using a 2f/2f setup that conjugates the radiative element and the slit. The sample holder is simply a gold plate that acts as the reference sample, assumed 100% reflective.
The sample’s spectrum is measured in specular reflectance mode (with an incidence angle of approximately 13°), which is a relatively good method for the waste sorting application, in par with the conventional ATR (Attenuated Total Reflection) method [23].
The total length of the optical path in air is approximately 30 cm, which can lead to signal fluctuations due to inhomogeneities in the concentrations of interfering molecules (mainly and ). Ideally, one should seal the spectrometer and illumination system in with nitrogen-saturated atmosphere enclosures.
3.5. Camera Control and Image Processing
We use the PICO640S BB camera at 30 Hz framerate with the settings adapted to the scene dynamic, with with the reference sample and the source on. Raw camera frames are pre-processed using the following procedure:
- The offset image is recorded from 50 temporally averaged frames with the source masked (shutter closed). This calibration step is repeated every few minutes to compensate for thermal drift of the sensor.
- We detect the defective pixels map from local outliers from mean offset and noise map. Those pixels will be excluded from further calculations.
- Camera frames are corrected by subtraction of the offset image, and exclusion of defective pixels. This step is known to as single reference non-uniformity correction.
- We remove residual fixed column noise from top and bottom parts of the frame that are not illuminated.
- The spectrum image is obtained from the pre-processing 50 temporally averaged frames at 30 Hz framerate. This step is optional, a single frame can be used, for maximum acquisition speed.
VGA camera consumption and pre-processing pipe cost around 1–1.5 W of energy to operate.
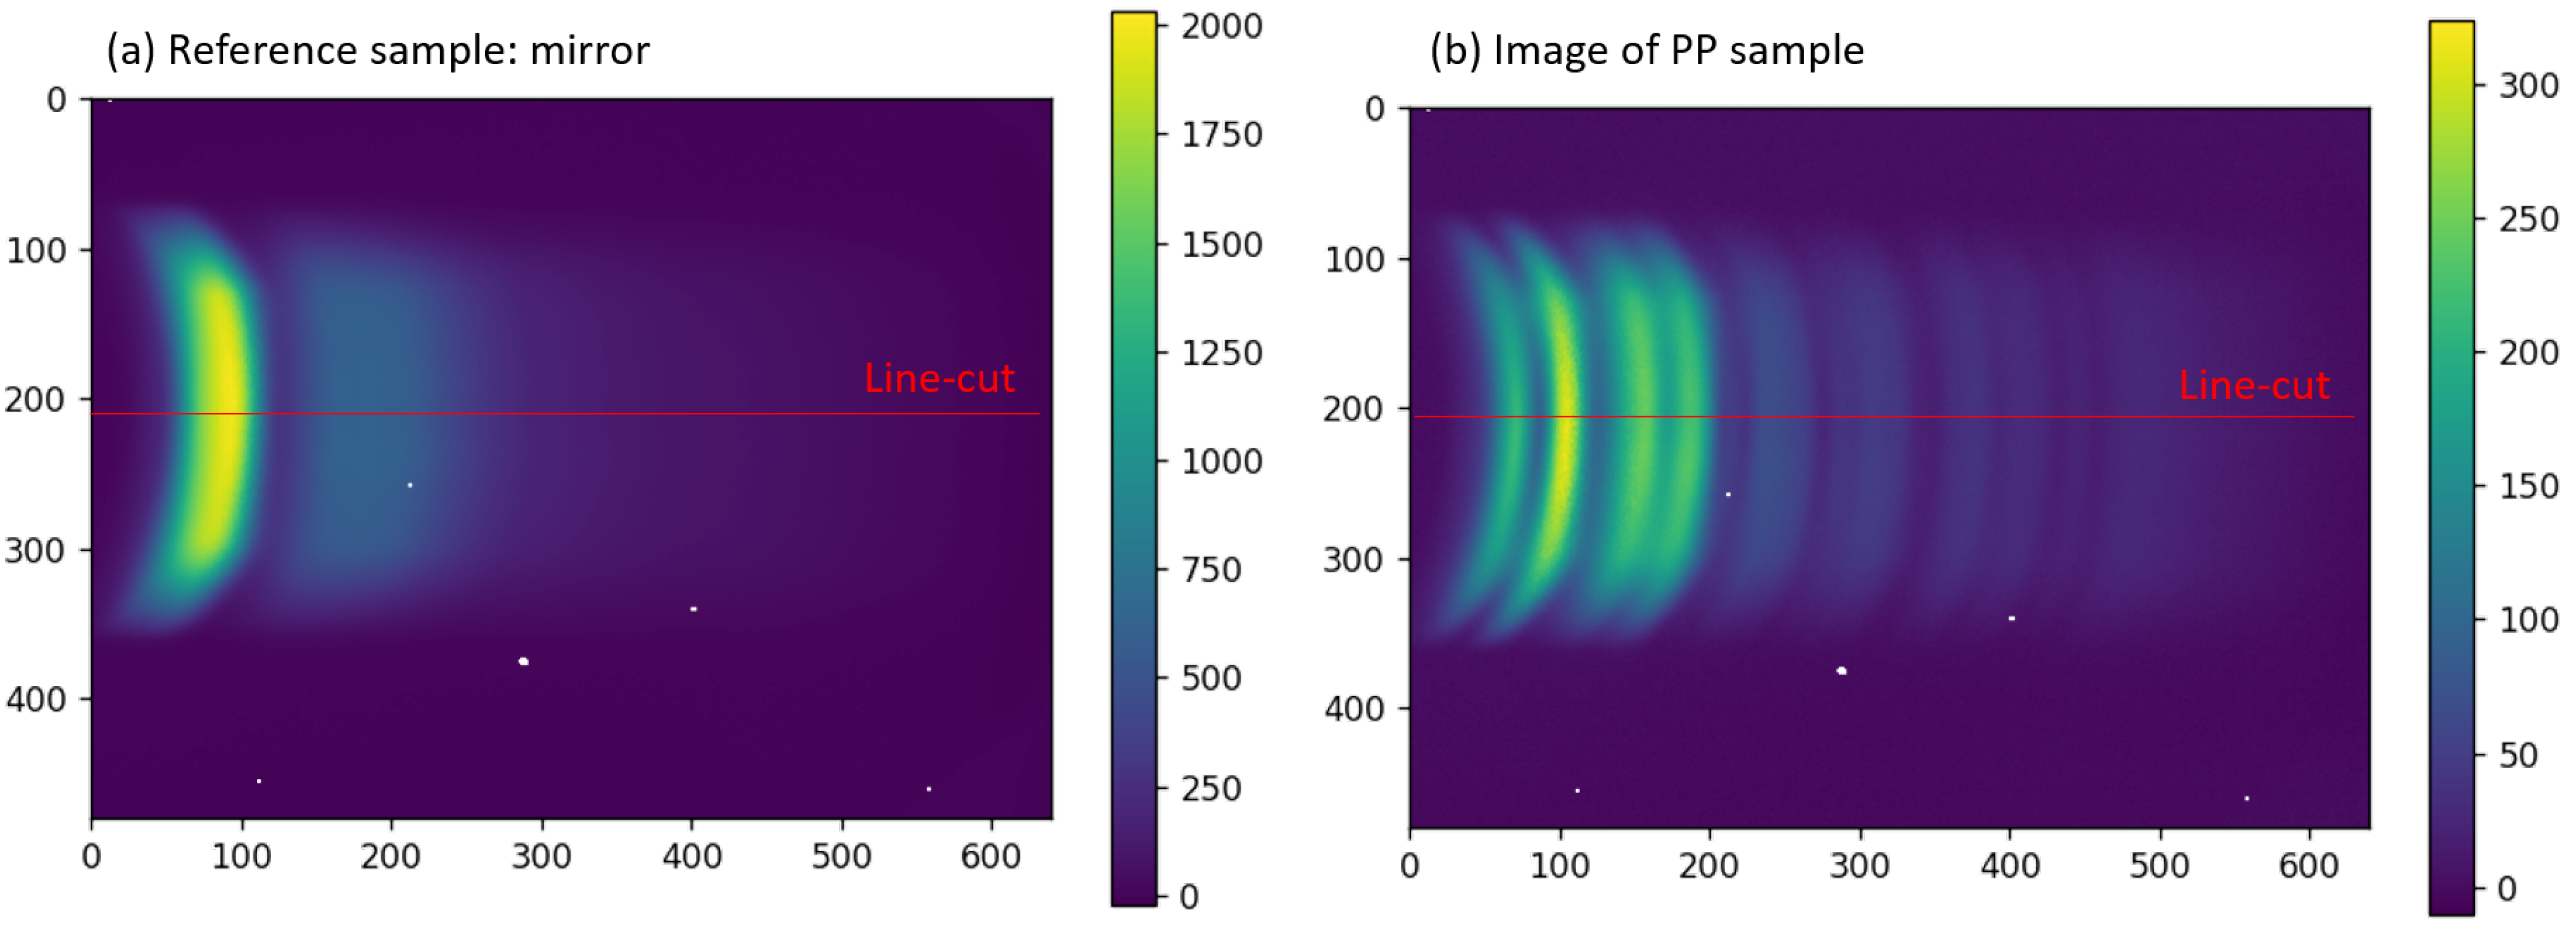
We show in Figure 6 examples of pre-processed images from the reference sample and a polypropylene (PP) sample.
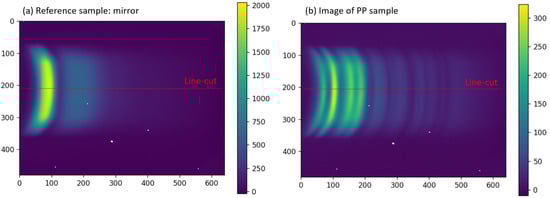
Figure 6.
Pre-processed images of (a) of the reference sample (mirror) and (b) a PP sample. Colorbar is given in digital 16bits units. Pixels displays in white are the excluded bad pixels.
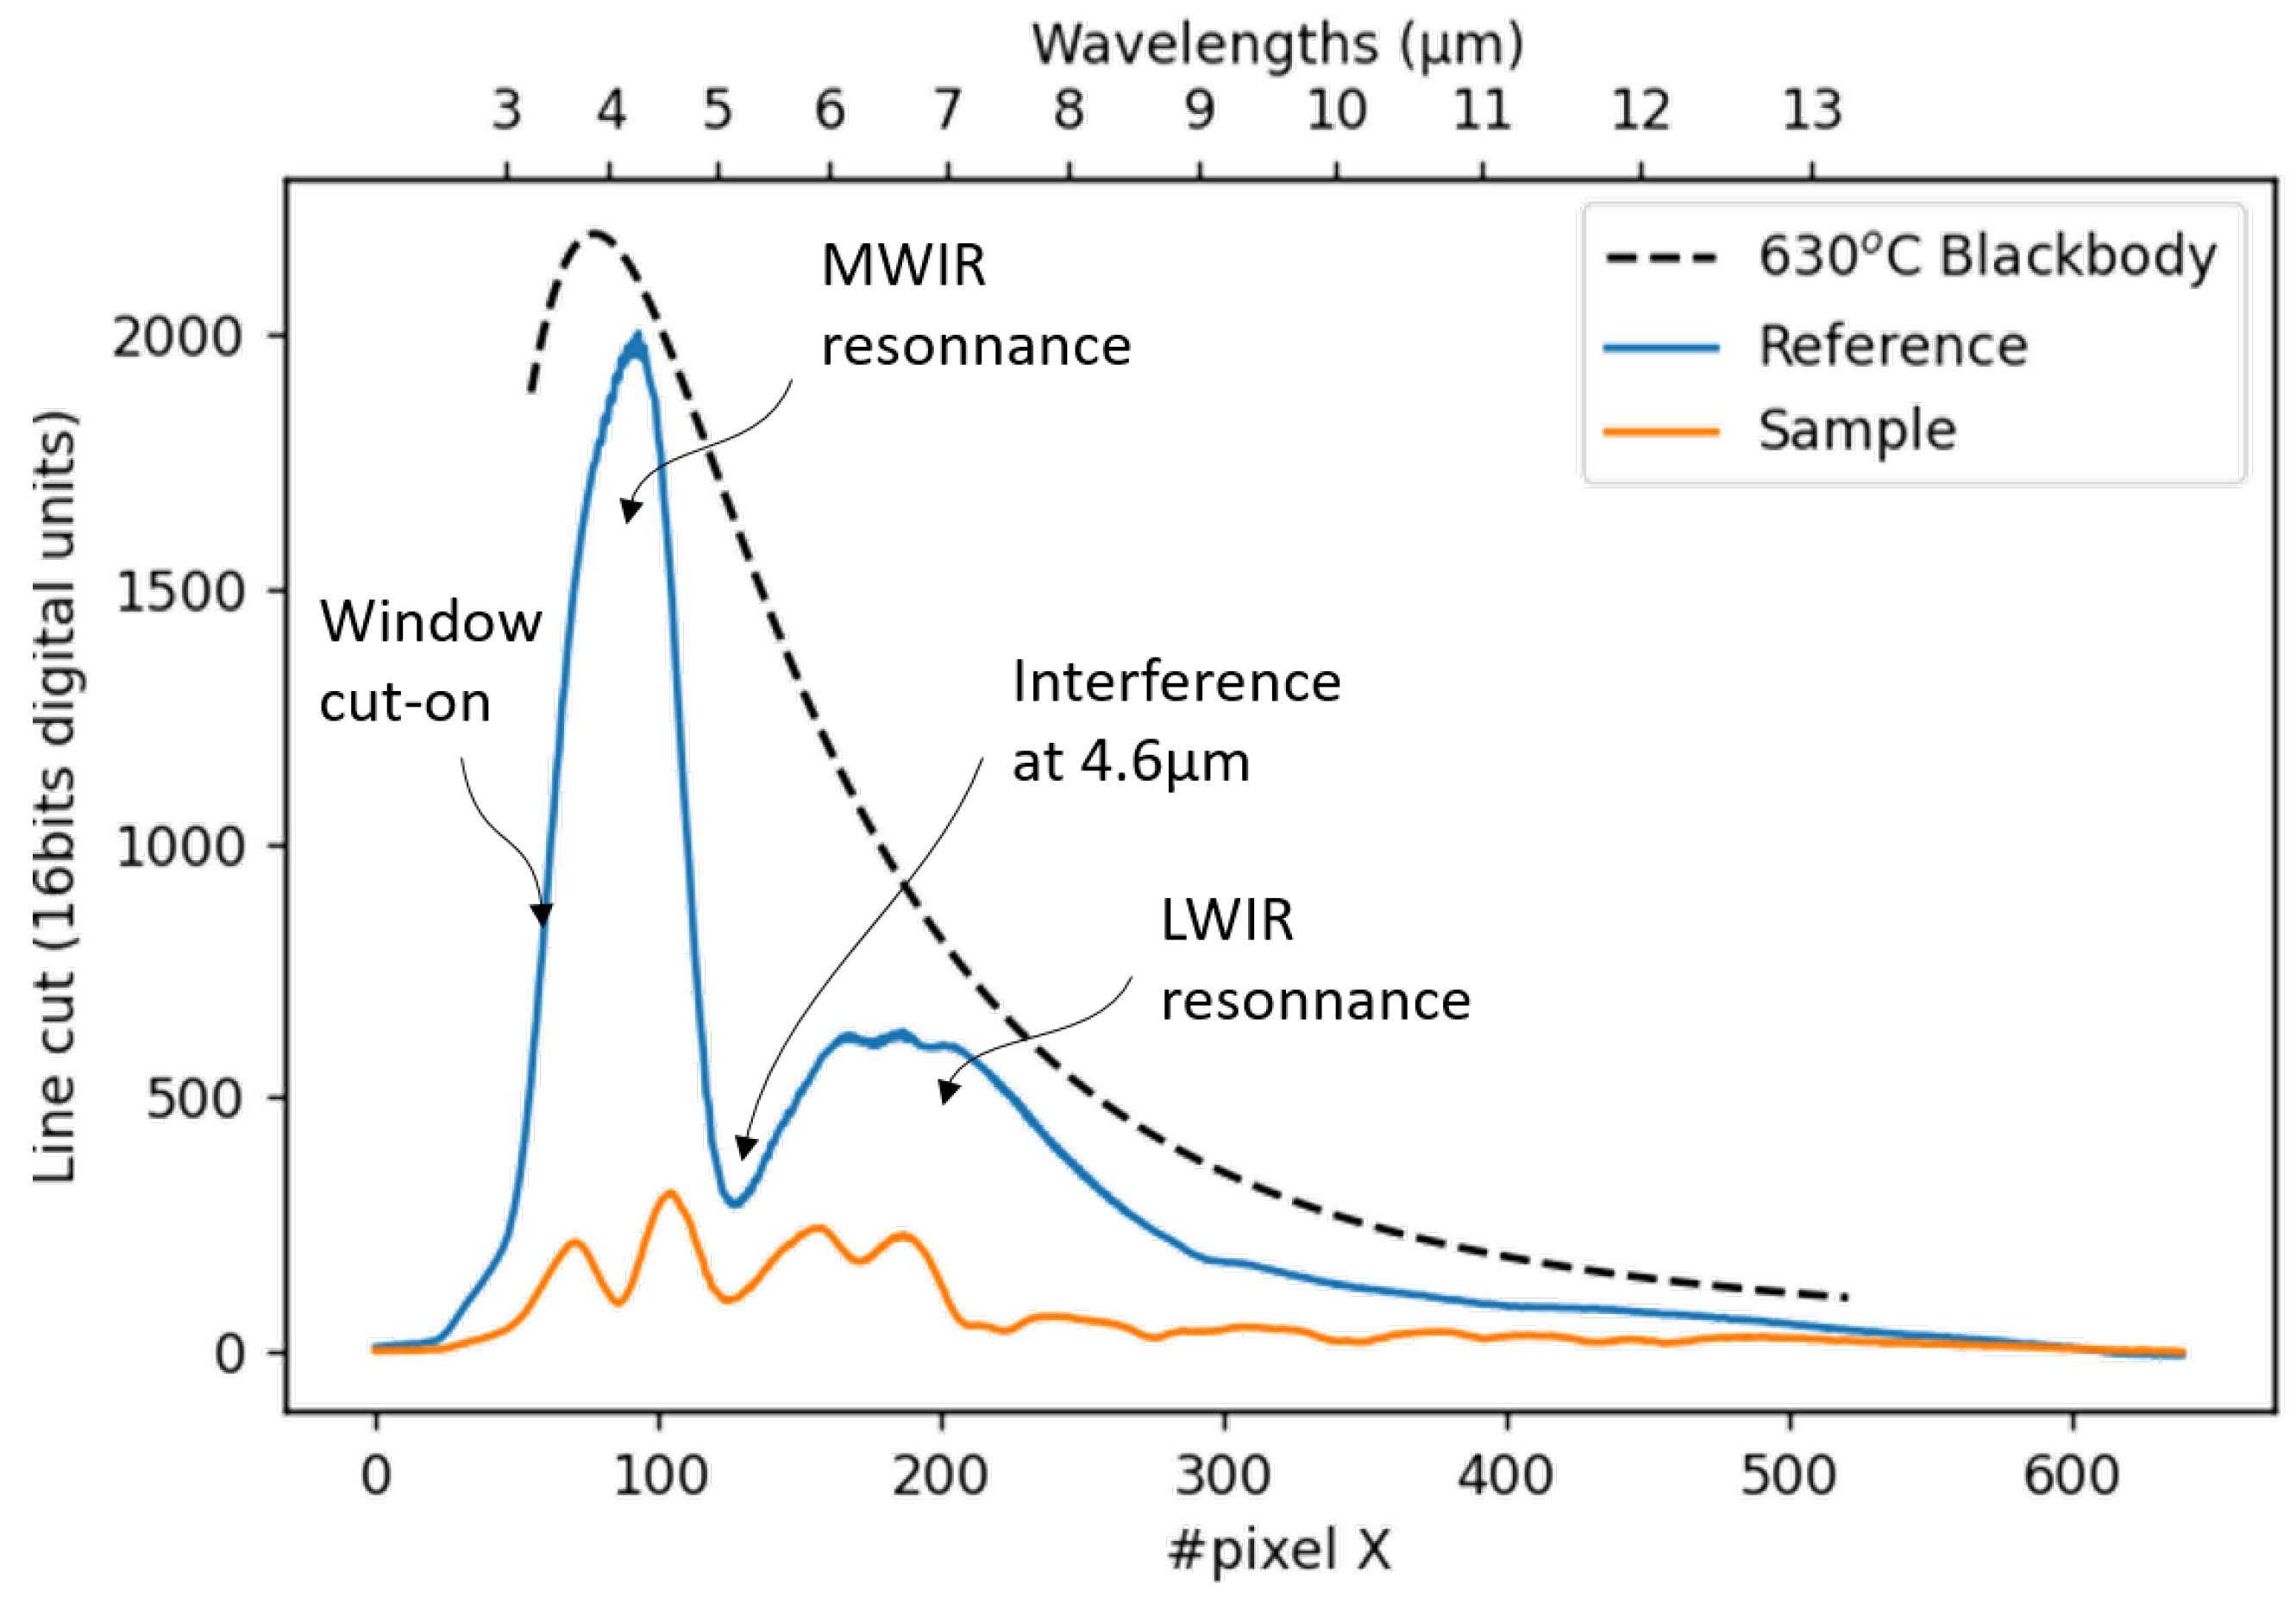
We extract a line profile of such images, with a vertical averaging of 11 pixels, around the red line, as displayed in Figure 6. Resulting curves are shown in Figure 7.
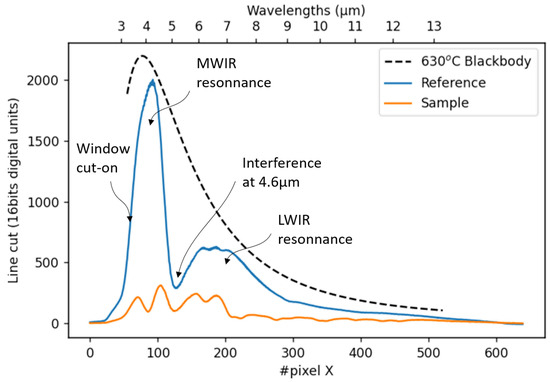
Figure 7.
Line-cut of the reference sample image and the PP sample image, compared with the 630 °C blackbody luminance curve (operating temperature of the thermal source).
This line cut represent the combined spectrum of the source luminance (intense in the MWIR range), the transmittance of the optical system, the sensor’s inhomogeneous response, and the sample reflectance spectrum. The reference line-profile is recorded with a gold mirror (which is assumed 100% reflective) is recorded every few minutes to account for the luminance drift of the source.
As expected, the reduced sensitivity of the sensor at the 4.6 µm interference is compensated by the high luminance of the thermal source. We extract the sample reflectance by dividing the sample line cut with that of the reference. Unless specified, all spectra are extracted from 50 temporally averaged frames at 30 Hz framerate, using the procedure described above without further post-processing.
The wavelength calibration, i.e., the relationship between the X position (in pixels) on the FPA and the wavelength, is performed using a known sample by matching known spectral features to measured ones. In our case, we apply a 2nd-order polynomial model.
4. Results
4.1. FTIR vs. BB-Bolometer
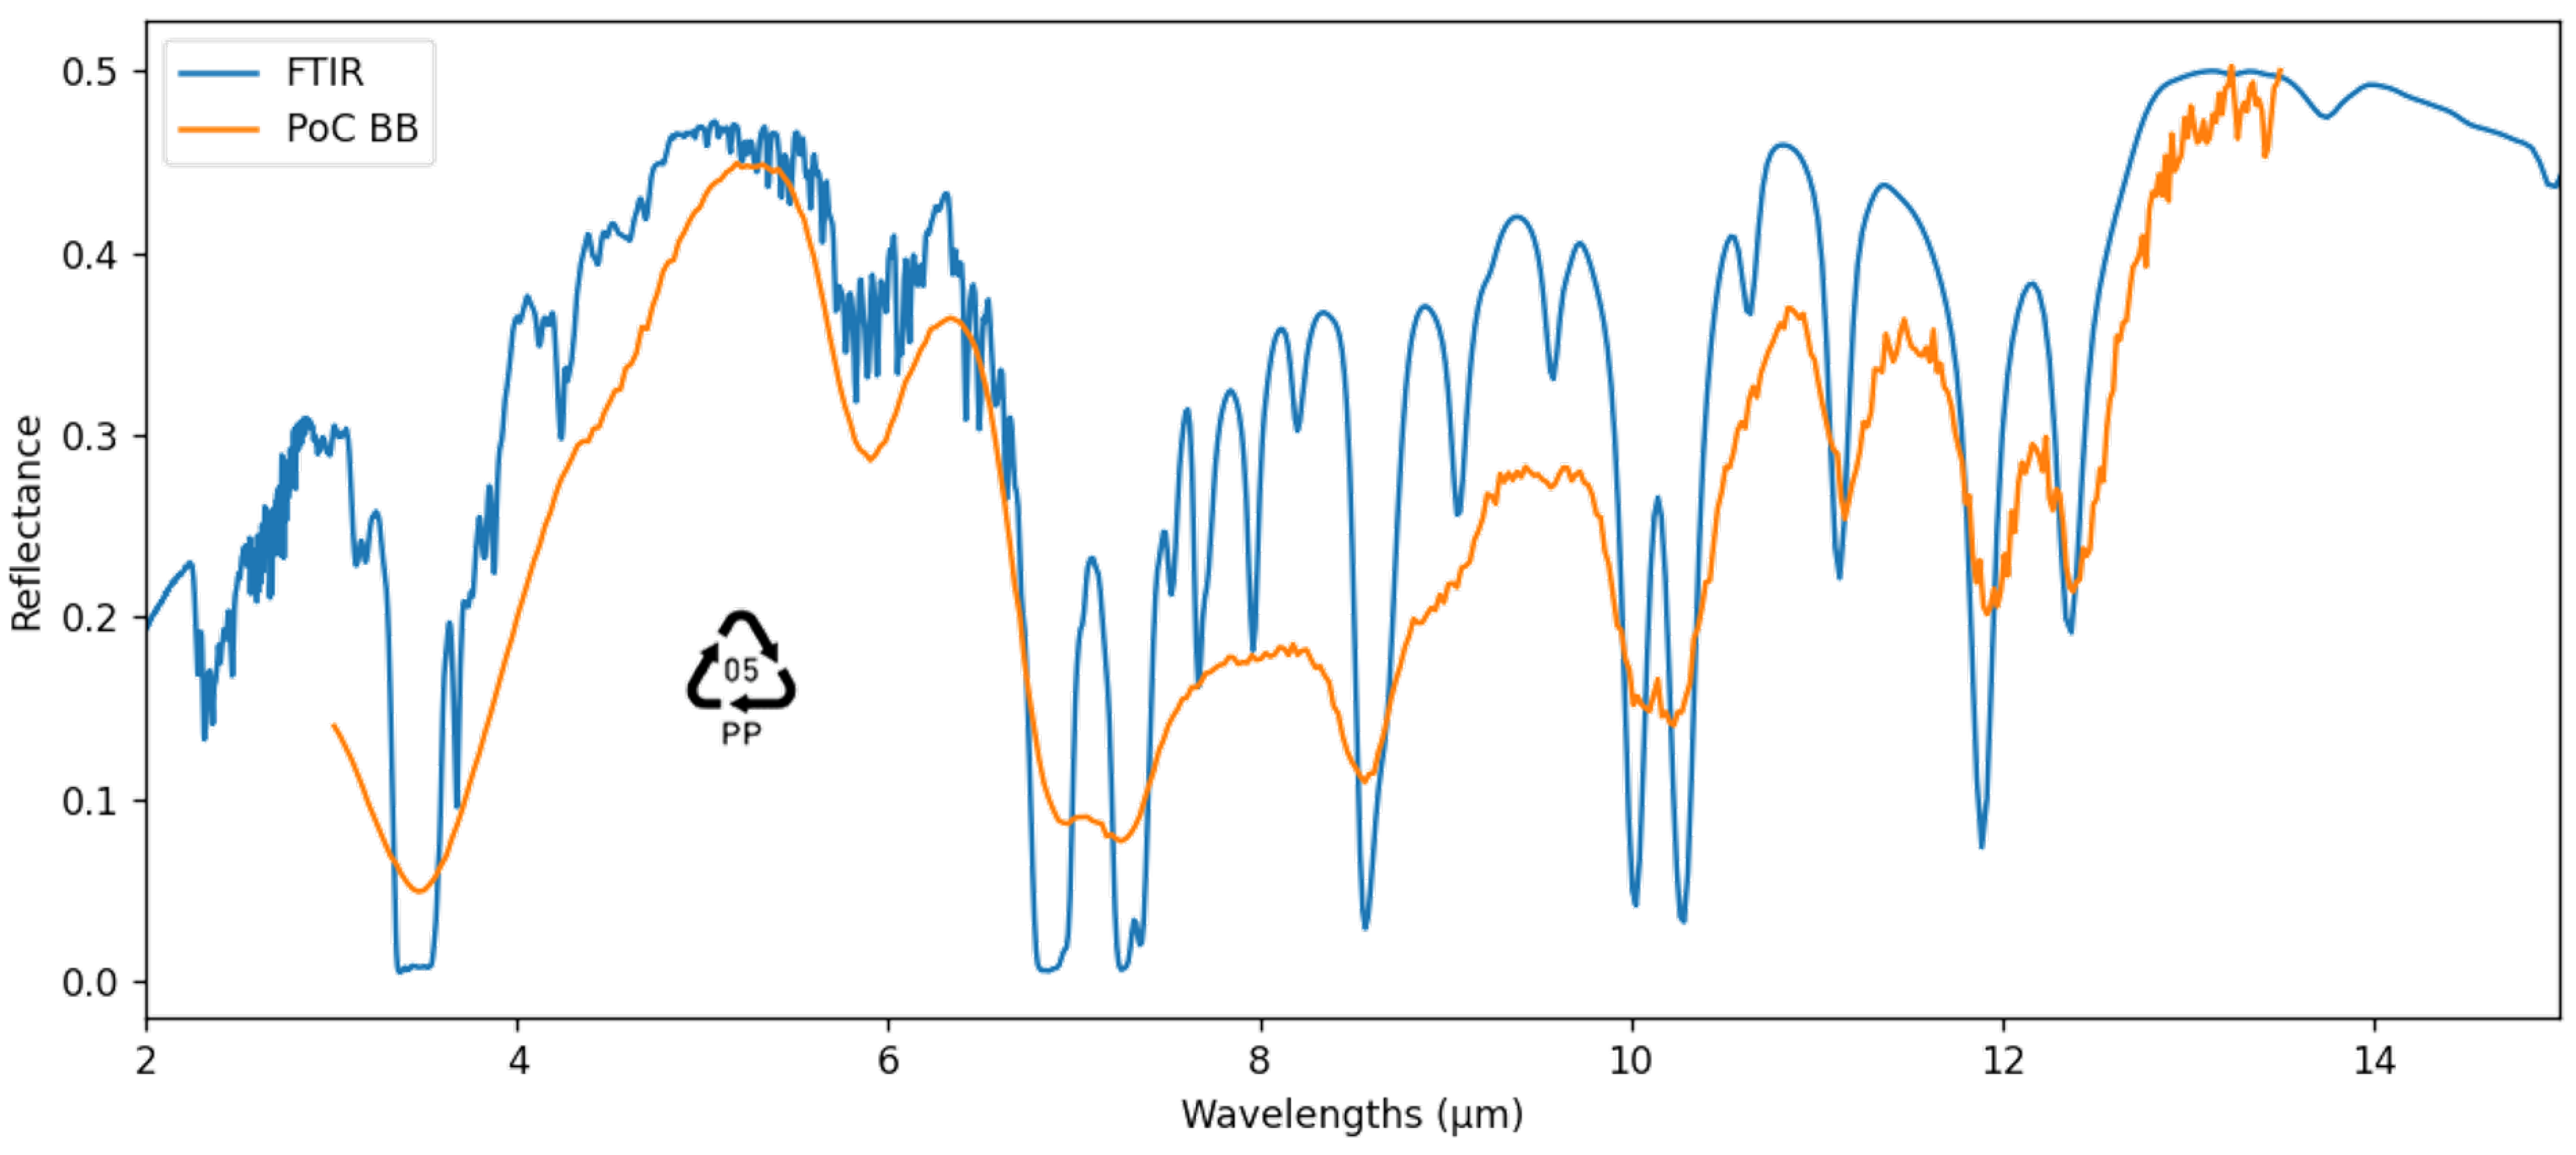
We compare the performances of our PoC spectrometer against a commercial laboratory FTIR instrument (IRTF Vertex 70 from Bruker, Billerica, MA, USA) on the same PP sample (see, Figure 8). The interaction modes are as close as possible: specular reflectance with an incidence angle of 13°.
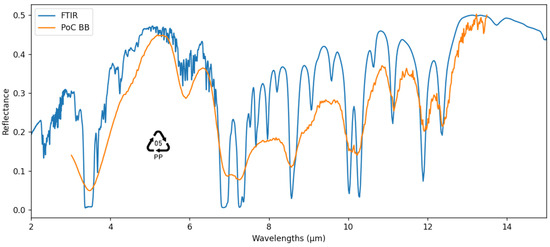
Figure 8.
Same PP sample measured with a commercial FTIR and our PoC BB spectrometer.
We correctly retrieve the spectral characteristics of the PP sample, with a degraded spectral resolution compared to the FTIR. We were unable to achieve the pixel-limited spectral resolution (22 nm) obtained in simulations, likely due to the slit opening and imperfect alignment. However, we highlight the important spectral range of the BB bolometer (3–13 µm), which covers a significant portion of the FTIR range (400–5000 cm−1, 2–25 µm); and which presents several notable advantages over the FTIR: Cost, compactness, absence of moving parts; Instantaneous measurement, against few seconds for FTIR. Note that the FTIR spectrum plotted Figure 8 was obtained using the following settings: 16 scans, 4 cm−1 resolution.
Beyond a simple comparative performance evaluation, we aim to assess the applicative value of such an instrument in the example of plastic waste sorting: this is what we will explore in the next sections.
4.2. Examples of Plastic Spectra
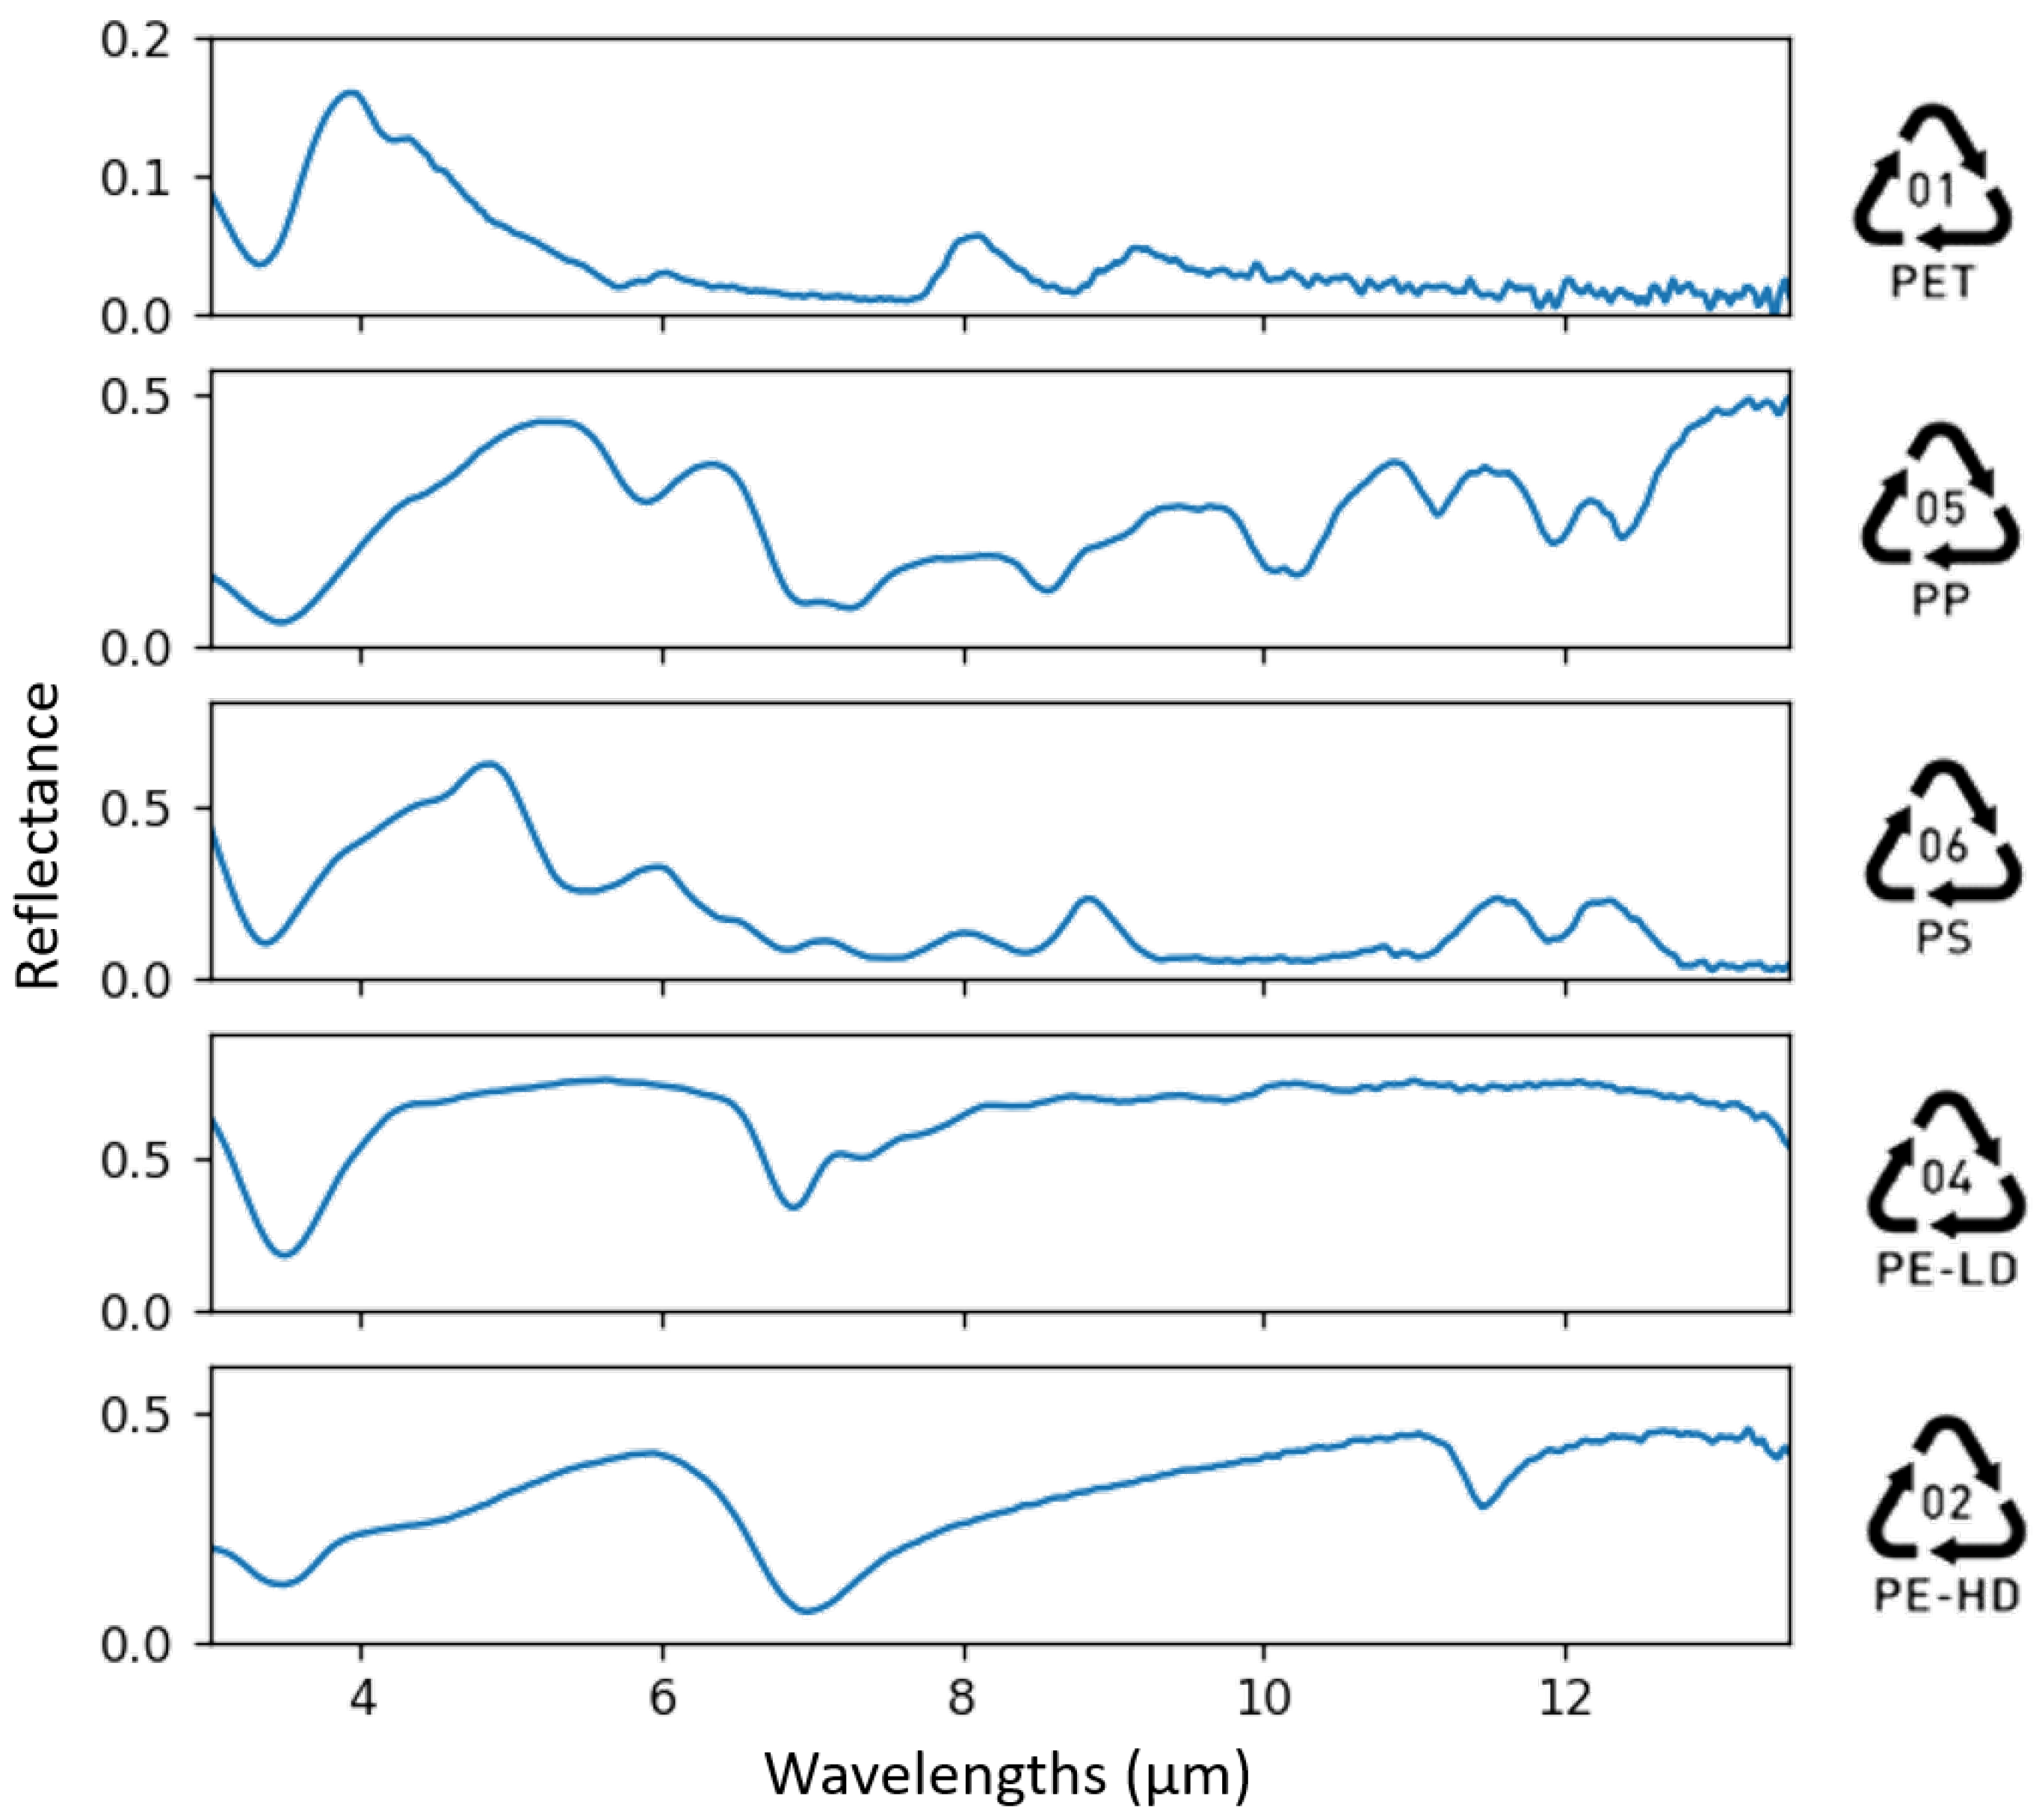
We are seeking to verify whether the spectrometer can differentiate between plastics of different types. We take measurements in reflectance mode on plastics waste, identified by the RIC (Resin Identification Code) codes printed on the packaging. In Figure 9, we compare spectra from PET (Polyethylene Terephthalate), PP, PS (Polystyrene), PE-LD (Polyethylene Low-Density) and PE-HD (Polyethylene High-Density). The samples are relatively thin, of thicknesses varying from 50 µm to 1 mm.
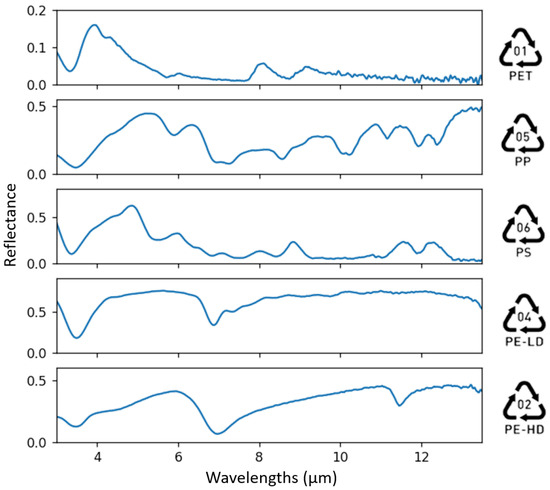
Figure 9.
Example spectra from five different plastics: PET, PP, PS, PE-LD and PE-HD.
We notice significant differences in the spectral characteristics of the various types of plastics tested, with a richness of distinct and well-defined spectral features. This is the advantage of using the Mid-IR band compared to the SWIR band.
PE-LD and PE-HD samples appear to show differences in terms of the prominence of the absorption peak at 7 µm and the presence of the 11.5 µm peak. The distinction between PE-LD and PE-HD is considered a particularly challenging use-case in SWIR spectroscopy [7]. However, with the Mid-IR band, it’s an easy use-case.
4.3. Black Plastics
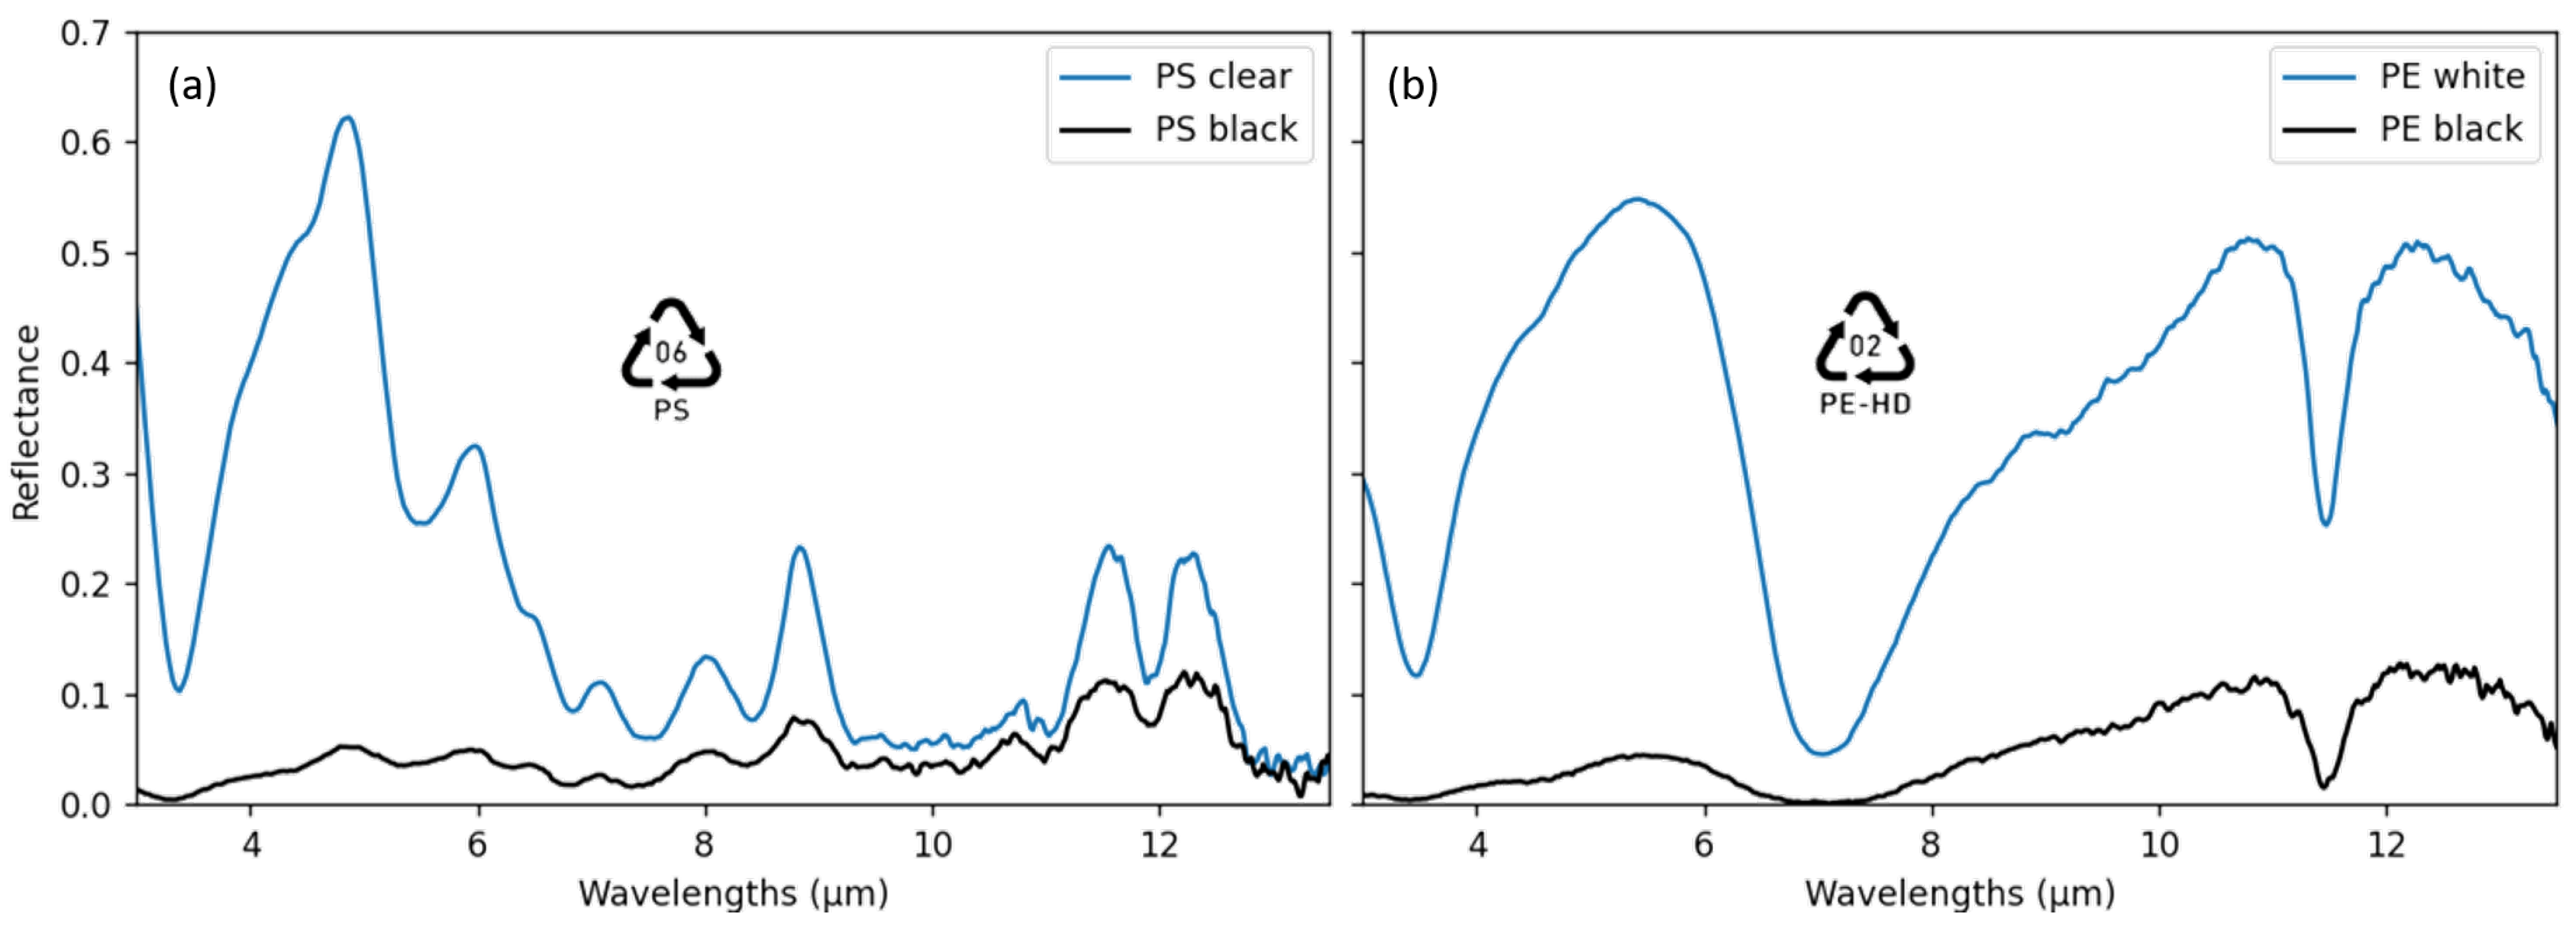
The presence of back carbon dye in a plastic prevents its analysis by NIR-SWIR spectroscopy due to its absorption that masks the spectral signatures. This is a real problem for sorting black plastics, often associated with ‘noble’, high-value polymers. Let’s see the influence of back carbon dye on the spectra measured using our BB spectrometer on samples of PS and PE compared with uncolored plastics (see, Figure 10).

Figure 10.
Effect of black carbon dye on (a) a PS spectrum and (b) PE spectrum.
We notice that the black carbon dye globally attenuates the spectrum, which reduces the signal to noise ratio, a bit more in MWIR than LWIR. Still, it preserves sufficient spectral information for its analysis. This makes our PoC suitable for sorting black plastics.
4.4. Spectral Analysis and Classification
In this section, we aim to evaluate the value of the PoC from an application perspective, through an example of spectroscopic analysis applied to plastic waste sorting. We study the sorting of three common classes of plastics: PP, PE and PET. This is just a PoC study; we are not seeking to develop an exhaustive classification model based on a large database and a sophisticated machine learning algorithm. Our small database of 40 samples is described in Appendix A.
We rely on the Principal Component Analysis (PCA) method to analyze our spectral database. We use the PCA implementation from the scikit-learn library, from reference [24]. All spectra are standardized (centered and scaled by unit of variance). This method allows us to decompose a spectrum into principal components, which contain the key spectral features that enable separation of different plastics classes. The principal spectral components are constructed to maximize inter-class variance. In our case, we use only three principal spectral components, which explains 88.83%, 4.49% and 3.67% of variance respectively, for a total of 97% of explained variance. We can represent a spectrum as a point in a 3D space, where the coordinates correspond to the scalar projection of said spectrum on each principal component, as shown in Figure 11.
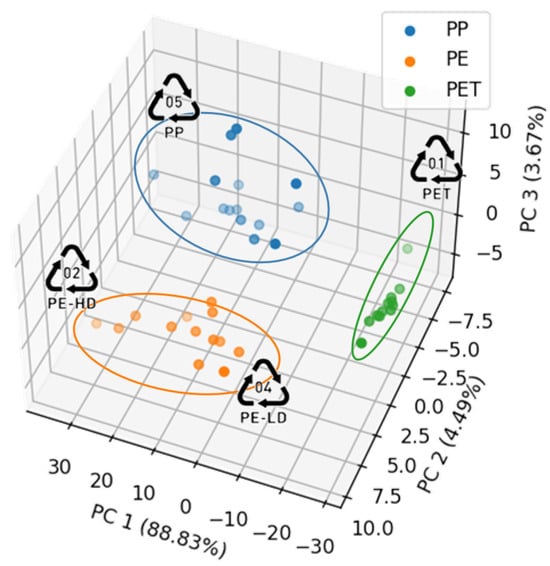
Figure 11.
PCA-3D projection of all 40 spectra of the dataset, showing proper intra-class clustering.
We verify that spectra from the same class cluster together in a specific region of the space and that different clusters are well-separated from one class to another. Furthermore, we notice that intra-class variances (related to the variances in samples chemical composition) are reflected in the positions of the PCA-3D projections. For example, the proportions of PE-HD vs. PE-LD in PE samples are captured along the axis of variance within the point cloud.
The idea behind a classification model is as follows: if we measure a new spectrum from an unknown plastic, it should likely fall within the cluster of the correct class. Therefore, we can build a classification model that associates a plastic class with its position in the PCA-3D space constructed earlier. We apply, for example, a classifier such as SVM (Support Vector Machine) which operates on this principle. The default linear SVM model [25] from scikit-learn, achieved 100% accuracy in predicting plastic types through cross-validation on our datatset. Due to the small dataset (40 samples), validation is performed on a single spectra, which is excluded from the calibration dataset (39 samples), and this process is repeated for every spectra (40 times).
5. Conclusions
We demonstrate a PoC of a new kind of spectrometer that utilizes an uncooled micro-bolometer FPA sensitive in the Mid-IR range 3–14 µm (PICO640S BB, manufactured by Lynred, France); in a typical dispersive setup alongside a Mid-IR illuminator, and a prism. This setup allows for spectral analysis of samples, which is particularly relevant for organic compound analysis. We focus on one specific application among many: plastic waste sorting.
Our PoC enables spectral reflectance measurements on plastic samples across a broad spectral range that is usually reserved for laboratory-grade instruments such as FTIR, while offering several key benefits including affordable, compact design, lack of moving parts, and instantaneous measurement. These benefits make it possible to integrate our system into a portable, battery-powered device, such as a handheld scanner, with low power consumption.
The Mid-IR range is characterized by great spectral features of organic compounds. It may represent a significant breakthrough over existing NIR-SWIR spectrometers used in sorting lines, by improving substantially the accuracy of classification models for plastic identification, chemical composition analysis and enabling the identification of black plastics; while remaining affordable and practical to use in the field.
The PICO640S BB, is a highly sensitive uncooled broadband infrared sensor, having a typical NEP of about 4.5 pW, which is 244 times lower than a typical lithium tantalite linear array sensor (1.1 mW NEP). In a similar spectrometry setup, this improvements in sensitivity translates in the same improvement in signal to noise ratio, while having a VGA (640 × 480) image format, that enables great spectral sampling (640 pixels), compared to typical linear pyroelectric sensors (128, 256 or 510 elements).
As this is a PoC, there is room for improvement: optimized illumination and custom-designed optical components and diffraction grating, could further improve both signal to noise ratio and spectral resolution. Also, the full array of the PICO640S BB sensor could generate hyperspectral images in a push-broom scanning setup, compatible with conveyor belts. The main drawback of this technology, compared with a photo-diodes array, is that the pixel has a thermal response time of about 12 ms. This generates an effect similar to a motion blur, making it unsuited for high speed conveyor belts (>1 m/s).
6. Patents
The concept reported in this manuscript is patented under the French patent application number FR2304616, Dispositif de mesure spectrométrique infrarouge d’un faisceau lumineux polychromatique et système de mesure spectrométrique associé, priority date 10 May 2023.
Author Contributions
Conceptualization, G.J.; methodology, G.J.; software, G.J.; validation, G.J. and X.B.; formal analysis, G.J.; investigation, G.J.; resources, G.J. and X.B.; data curation, G.J.; writing—original draft preparation, G.J.; writing—review and editing, G.J. and X.B.; visualization, G.J.; supervision, X.B.; project administration, G.J. and X.B.; funding acquisition, G.J. and X.B. All authors have read and agreed to the published version of the manuscript.
Funding
This research received funding from the BRIGHTER European project https://projectbrighter.eu/ (accessed on 26 March 2025). BRIGHTER has received funding from the Chips Joint Undertaking (Chips JU) under grant agreement No 101096985. The JU receives support from the European Union’s Horizon Europe research and innovation programme and France, Belgium, Portugal, Spain, Turkey.
Data Availability Statement
The spectral measurements will be made by the author on request.
Acknowledgments
The author wish to thank Remi Briche, Fleur Guittard and Alex Audouin for the development and validation of the broadband sensor and Xavier Lucquiault for his management of the BRIGHTER project; Eric Mallet and Emmanuelle Chazelle for their marketing support.
Conflicts of Interest
The author’s affiliation: Lynred is a commercial company that supplies the sensor used in this research. The funders had no role in the design of the study; in the collection, analyses, or interpretation of data; in the writing of the manuscript; or in the decision to publish the results.
Abbreviations
The following abbreviations are used in this manuscript:
| ATR | Attenuated Total Reflexion |
| BB | Broadband (3–14 µm) |
| DTGS | Deuterated Trigycine Sulfate |
| FL | Focal Length |
| FPA | Focal Plane Array |
| FTIR | Fourier Transform Infrared |
| HSI | Hyperspectral Imager |
| LDO | Low-Dropout |
| LWIR | Long Wave Infrared (8–14 µm) |
| MWIR | Middle Wave Infrared (3–5 µm) |
| NA | Numerical Aperture |
| NEP | Noise Equivalent Power, expressed in pW |
| NETD | Noise Equivalent Temperature Difference, expressed in mK |
| NIR II | Near Infrared II, confused with SWIR |
| PCA | Principal Component Analysis |
| PE, PE-LD, PE-HD | Polyethylene, PE-Low-Density, PE-High-Density |
| PET | Polyethylene Terephthalate |
| PoC | Proof of Concept |
| PP | Polypropylene |
| PS | Polystyrene |
| RFL | Reflective Focal Length |
| RIC | Resin Identification Code |
| SVM | Support Vector Machine |
| SWIR | Short Wave Infrared (0.9–1.7 µm) |
| VGA | Video Graphics Array, 640 × 512 or 640 × 480 image format |
| VOx | Vanadium Oxide |
Appendix A
We sought to collect a set of samples from the author’s trash with different textures, colors, and origins in order to maximize the intra-class variance. The sources of these samples are from various plastic waste such as food packaging, beverage containers, household cleaning products, personal care items, and more. We measured a small dataset of 40 reflectance spectra from three classes (PP, PE and PET). Each of the 40 separete samples was measured only once. Distribution of samples are given in Table A1:

Table A1.
Distribution of the samples.
Table A1.
Distribution of the samples.
| Class | Num. of Samples |
|---|---|
| PP | 15 |
| PE | 13 |
| PP | 12 |
In Figure A1, we provide plots of all samples used in our small dataset: (a) PE, (b) PP and (c) PET.
We observe a good repeatability of the spectral features for polymers of the same class, on a wide variety of thicknesses, texture, and color. Although, minor spectral differences can be related to impurities or additives in the samples.
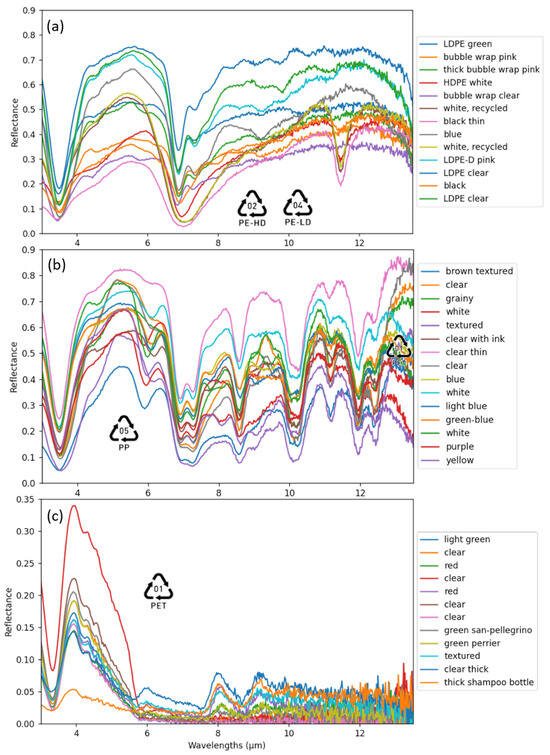
Figure A1.
Spectra of all samples of the dataset: (a) PE, (b) PP and (c) PET.
Figure A1.
Spectra of all samples of the dataset: (a) PE, (b) PP and (c) PET.
References
- Directive (EU) 2018/851 of the European Parliament and of the Council of 30 May 2018 Amending Directive 2008/98/EC on Waste. Available online: https://eur-lex.europa.eu/legal-content/EN/TXT/PDF/?uri=CELEX:32018L0851&from=EN (accessed on 26 March 2025).
- COM/2020/98 Final: Communication from the Commission to the European Parliament, the Council, the European Economic and Social Committee and the Committee of the Regions, A New Circular Economy Action Plan for a Cleaner and More Competitive Europe. 2020. Available online: https://eur-lex.europa.eu/legal-content/EN/TXT/?qid=1583933814386&uri=COM:2020:98:FIN (accessed on 26 March 2025).
- Ren Kai Neo, E.; Yeo, Z.; Sze Choong Low, J.; Goodship, V.; Debattista, K. A review on chemometric techniques with infrared, Raman and laser-induced breakdown spectroscopy for sorting plastic waste in the recycling industry. Resour. Conserv. Recycl. 2022, 180, 106217. [Google Scholar] [CrossRef]
- Reusch, W. Michigan State University: Infrared Spectroscopy. Available online: https://www2.chemistry.msu.edu/faculty/reusch/virttxtjml/spectrpy/infrared/infrared.htm (accessed on 26 March 2025).
- Griffiths, P.R.; De Haseth, J.A. Fourier Transform Infrared Spectrometry, 2nd ed.; John Wiley & Sons: Hoboken, NJ, USA, 2007. [Google Scholar]
- Asamoah, B.O.; Uurasjärvi, E.; Räty, J.; Koistinen, A.; Roussey, M.; Peiponen, K.E. Towards the Development of Portable and In Situ Optical Devices for Detection of Micro-and Nanoplastics in Water: A Review on the Current Status. Polymers 2021, 13, 730. [Google Scholar] [CrossRef] [PubMed]
- Rani, M.; Marchesi, C.; Federici, S.; Rovelli, G.; Alessandri, I.; Vassalini, I.; Serena, D.; Borgese, L.; Zacco, A.; Bilo, F.; et al. Miniaturized Near-Infrared (MicroNIR) Spectrometer in PlasticWaste Sorting. Materials 2019, 12, 2740. [Google Scholar] [CrossRef] [PubMed]
- Specim. Plastics Sorting with Specim FX Hyperspectral Cameras. Application Note. 2020. Available online: https://www.specim.com/plastics-sorting-with-specim-fx-cameras/ (accessed on 26 March 2025).
- Brun, C. Andor: High Speed SWIR Hyperspectral Imaging with C-RED 3, Application Note. 2021. Available online: https://andor.oxinst.com/learning/view/article/high-speed-swir-hyperspectral-imaging-with-c-red-3 (accessed on 26 March 2025).
- Tormala, M. Specim: Overcoming Black Plastic Recycling Challenge with MWIR Hyperspectral Imaging Technology. Application Note. 2024. Available online: https://www.specim.com/overcoming-black-plastic-recycling-challenge-with-mwir-hyperspectral-imaging-technology/ (accessed on 26 March 2025).
- Veerasingam, S.; Ranjani, M.; Venkatachalapathy, R.; Bagaev, A.; Mukhanov, V.; Litvinyuk, D.; Mugilarasan, M.; Gurumoorthi, K.; Guganathan, L.; Aboobacker, V.; et al. Contributions of Fourier transform infrared spectroscopy in microplastic pollution research: A review. Crit. Rev. Environ. Sci. Technol. 2020, 51, 2681–2743. [Google Scholar] [CrossRef]
- Rozenstein, O.; Puckrin, E.; Adamowski, J. Development of a new approach based on midwave infrared spectroscopy for post-consumer black plastic waste sorting in the recycling industry. Waste Manag. 2017, 68, 38–44. [Google Scholar] [CrossRef] [PubMed]
- Robertson, I. Perkin Elmer: The Advantages of Mid-IR Spectrometry for Polymer Recycling. Application Note. Available online: https://resources.perkinelmer.com/lab-solutions/resources/docs/app_mid-ir_polymer-recycling-011780_01.pdf (accessed on 26 March 2025).
- DIAS. IR Spectrometry with Linear Arrays PYROSENS. Application Note. Available online: https://www.dias-infrared.de/pdf/infrared_applicationnote_ir-spectroskopy_arrays_eng.pdf (accessed on 26 March 2025).
- Olbrycht, R.; Rzeszotarski, D. Hyperspectral LWIR measurements with imaging diffraction grating spectrometer and uncooled thermal camera. Meas. Autom. Monit. 2015, 61, 169–172. [Google Scholar]
- Johnson, W.R.; Hook, S.J.; Shoen, S.M. Microbolometer imaging spectrometer. Opt. Lett. 2012, 37, 803–805. [Google Scholar] [CrossRef] [PubMed]
- Guillaumont, M.; Altazin, S.; Alexi, C.; Tinnes, S.; Pistre, C.; Durand, A.; Dariel, A.; Rossini, F.; Laurent, C.; Freal, C.; et al. Recent thermoresistive material evolutions at LYNRED for improving uncooled microbolometer products thermal sensitivity. In Proceedings of the Infrared Technology and Applications XLVIII, Orlando, FL, USA, 3 April–13 June 2022. [Google Scholar] [CrossRef]
- Crastes, A.; Touvignon, A.; Bethoux-Garidel, S.; Tinnes, S. Uncooled infrared detector designed for Gas detection and High temperature measurements. In Proceedings of the New Components for Detection and Sensing, Nürnberg, Germany, 14–15 May 2013. [Google Scholar] [CrossRef]
- Olbrycht, R.; Kału˙za, M. Optical Gas Imaging with Uncooled Thermal Imaging Camera—Impact of Warm Filters and Elevated Background Temperature. IEEE Trans. Ind. Electron. 2020, 67, 9824–9832. [Google Scholar] [CrossRef]
- Optris. Basic Principles of Non-Contact Temperature Measurement. Available online: https://optris.com/support-service/brochures-whitepapers-technical-notes/ (accessed on 26 March 2025).
- Mathieu, G.; Dupoy, M.; Bonnet, S.; Rebuffel, V.; Coll, J.L.; Henry, M. MID infrared multispectral imaging for tumor tissue detection. In Proceedings of the Imaging, Manipulation, and Analysis of Biomolecules, Cells, and Tissues XIX, Online, 6–12 March 2021. [Google Scholar] [CrossRef]
- Infrasolid. Data Sheet HISpower HIS2000R-0WC TO-8 Thermal Infrared Emitter. Available online: https://www.infrasolid.com/data/doc/Products/HISpower/HIS2000R-0WC/Datasheet-HISpower-HIS2000R-0WC.pdf?c=20210412121903 (accessed on 26 March 2025).
- Peets, P.; Kaupmees, K.; Vahur, S.; Leito, I. Reflectance FT-IR spectroscopy as a viable option for textile fiber identification. Herit. Sci. 2019, 7, 93. [Google Scholar] [CrossRef]
- Halko, N.; Martinsson, P.G.; Tropp, J.A. Finding Structure with Randomness: Probabilistic Algorithms for Constructing Approximate Matrix Decompositions. SIAM Rev. 2011, 53, 217–288. [Google Scholar] [CrossRef]
- Cortes, C.; Vapnik, V. Support-vector networks. Mach. Learn. 1995, 20, 273–297. [Google Scholar] [CrossRef]


Disclaimer/Publisher’s Note: The statements, opinions and data contained in all publications are solely those of the individual author(s) and contributor(s) and not of MDPI and/or the editor(s). MDPI and/or the editor(s) disclaim responsibility for any injury to people or property resulting from any ideas, methods, instructions or products referred to in the content. |
© 2025 by the authors. Licensee MDPI, Basel, Switzerland. This article is an open access article distributed under the terms and conditions of the Creative Commons Attribution (CC BY) license (https://creativecommons.org/licenses/by/4.0/).