Article

The Presence of Excitons in Short Single-Stranded DNA Revealed by Absorption and Circular Dichroism Spectroscopy

by
Alessandra Picchiotti
1,2,3,*,
Amy L. Stevens
2,4,
Valentyn I. Prokhorenko
2 and
R. J. Dwayne Miller
5,*
1
Groningen Biomolecular Sciences and Biotechnology Institute GBB, Biochemistry Department, University of Groningen, Nijenborgh 4, 9747 AG Groningen, The Netherlands
2
Max Planck Institute for the Structure and Dynamics of Matter, CFEL (Bld. 99), Luruper Chaussee 149, 22761 Hamburg, Germany
3
Fakultät für Mathematik, Informatik und Naturwissenschaften, Institut für Nanostruktur-und Festkörperphysik, Hamburg University, HARBOR (Bld. 101), Luruper Chaussee 149, 22761 Hamburg, Germany
4
Department of Chemistry, University of Saskatchewan, Saskatoon, SK S7N 5C9, Canada
5
Departments of Chemistry and Physics, University of Toronto, Toronto, ON M5S 3H6, Canada
*
Authors to whom correspondence should be addressed.
Spectrosc. J. 2025, 3(2), 11; https://doi.org/10.3390/spectroscj3020011
Submission received: 29 September 2024 / Revised: 5 March 2025 / Accepted: 14 March 2025 / Published: 28 March 2025
(This article belongs to the Special Issue Feature Papers in Spectroscopy Journal)

Abstract

:
This paper presents a systematic absorption and circular dichroism spectroscopy study of short single strands of DNA, from 2 to 20 bases. They are composed of a sequence-specific nucleobase composition, either adenine (A), thymine (T), or AT repeats. The absorption spectra hypochromism and the circular dichroism one show butterfly-shaped spectra. Data analysis conducted on the spectra of these oligomers provides evidence for the formation of excitons and their delocalization length along the strand of DNA in relation to how many bases are involved in the excitonic coupling. In particular, the extent of this coupling is limited to adjacent nucleobases in the case of pure adenine strands but spans multiple nucleobases in the case of pure thymine strands. Predictably, AT repeats show a mixed behavior between the two.

1. Introduction

Unraveling the excitation dynamics of DNA is essential to understanding its biochemical functions and pathology, such as the influence of UV light on cancer formation [1]. It has been theorized that UV light induces the formation of excitons in DNA. These would be formed either on the hydrogen-bonded base pair and/or between adjacent bases along the DNA backbone [2,3,4]. It is thought that the appearance of excitons signals the presence of long-lived photoexcited states in DNA [5,6]. The slow decay of these excited states increases the chance that the excess energy will dissipate via higher-energy deactivation pathways, possibly resulting in photo-induced biological damage and conditions such as cancer. Although extensive effort has gone into investigations in this area [3,7,8,9], definitive exciton signatures in DNA have remained elusive and sometimes contested [9,10]. In contrast, single nucleobases are devoid of excitons and decay quickly and safely via non-radiative pathways [2,10]. Clearly, it is vital to recognize the spectroscopic signatures of excitons and to discern their role in the excited-state lifetimes in DNA.
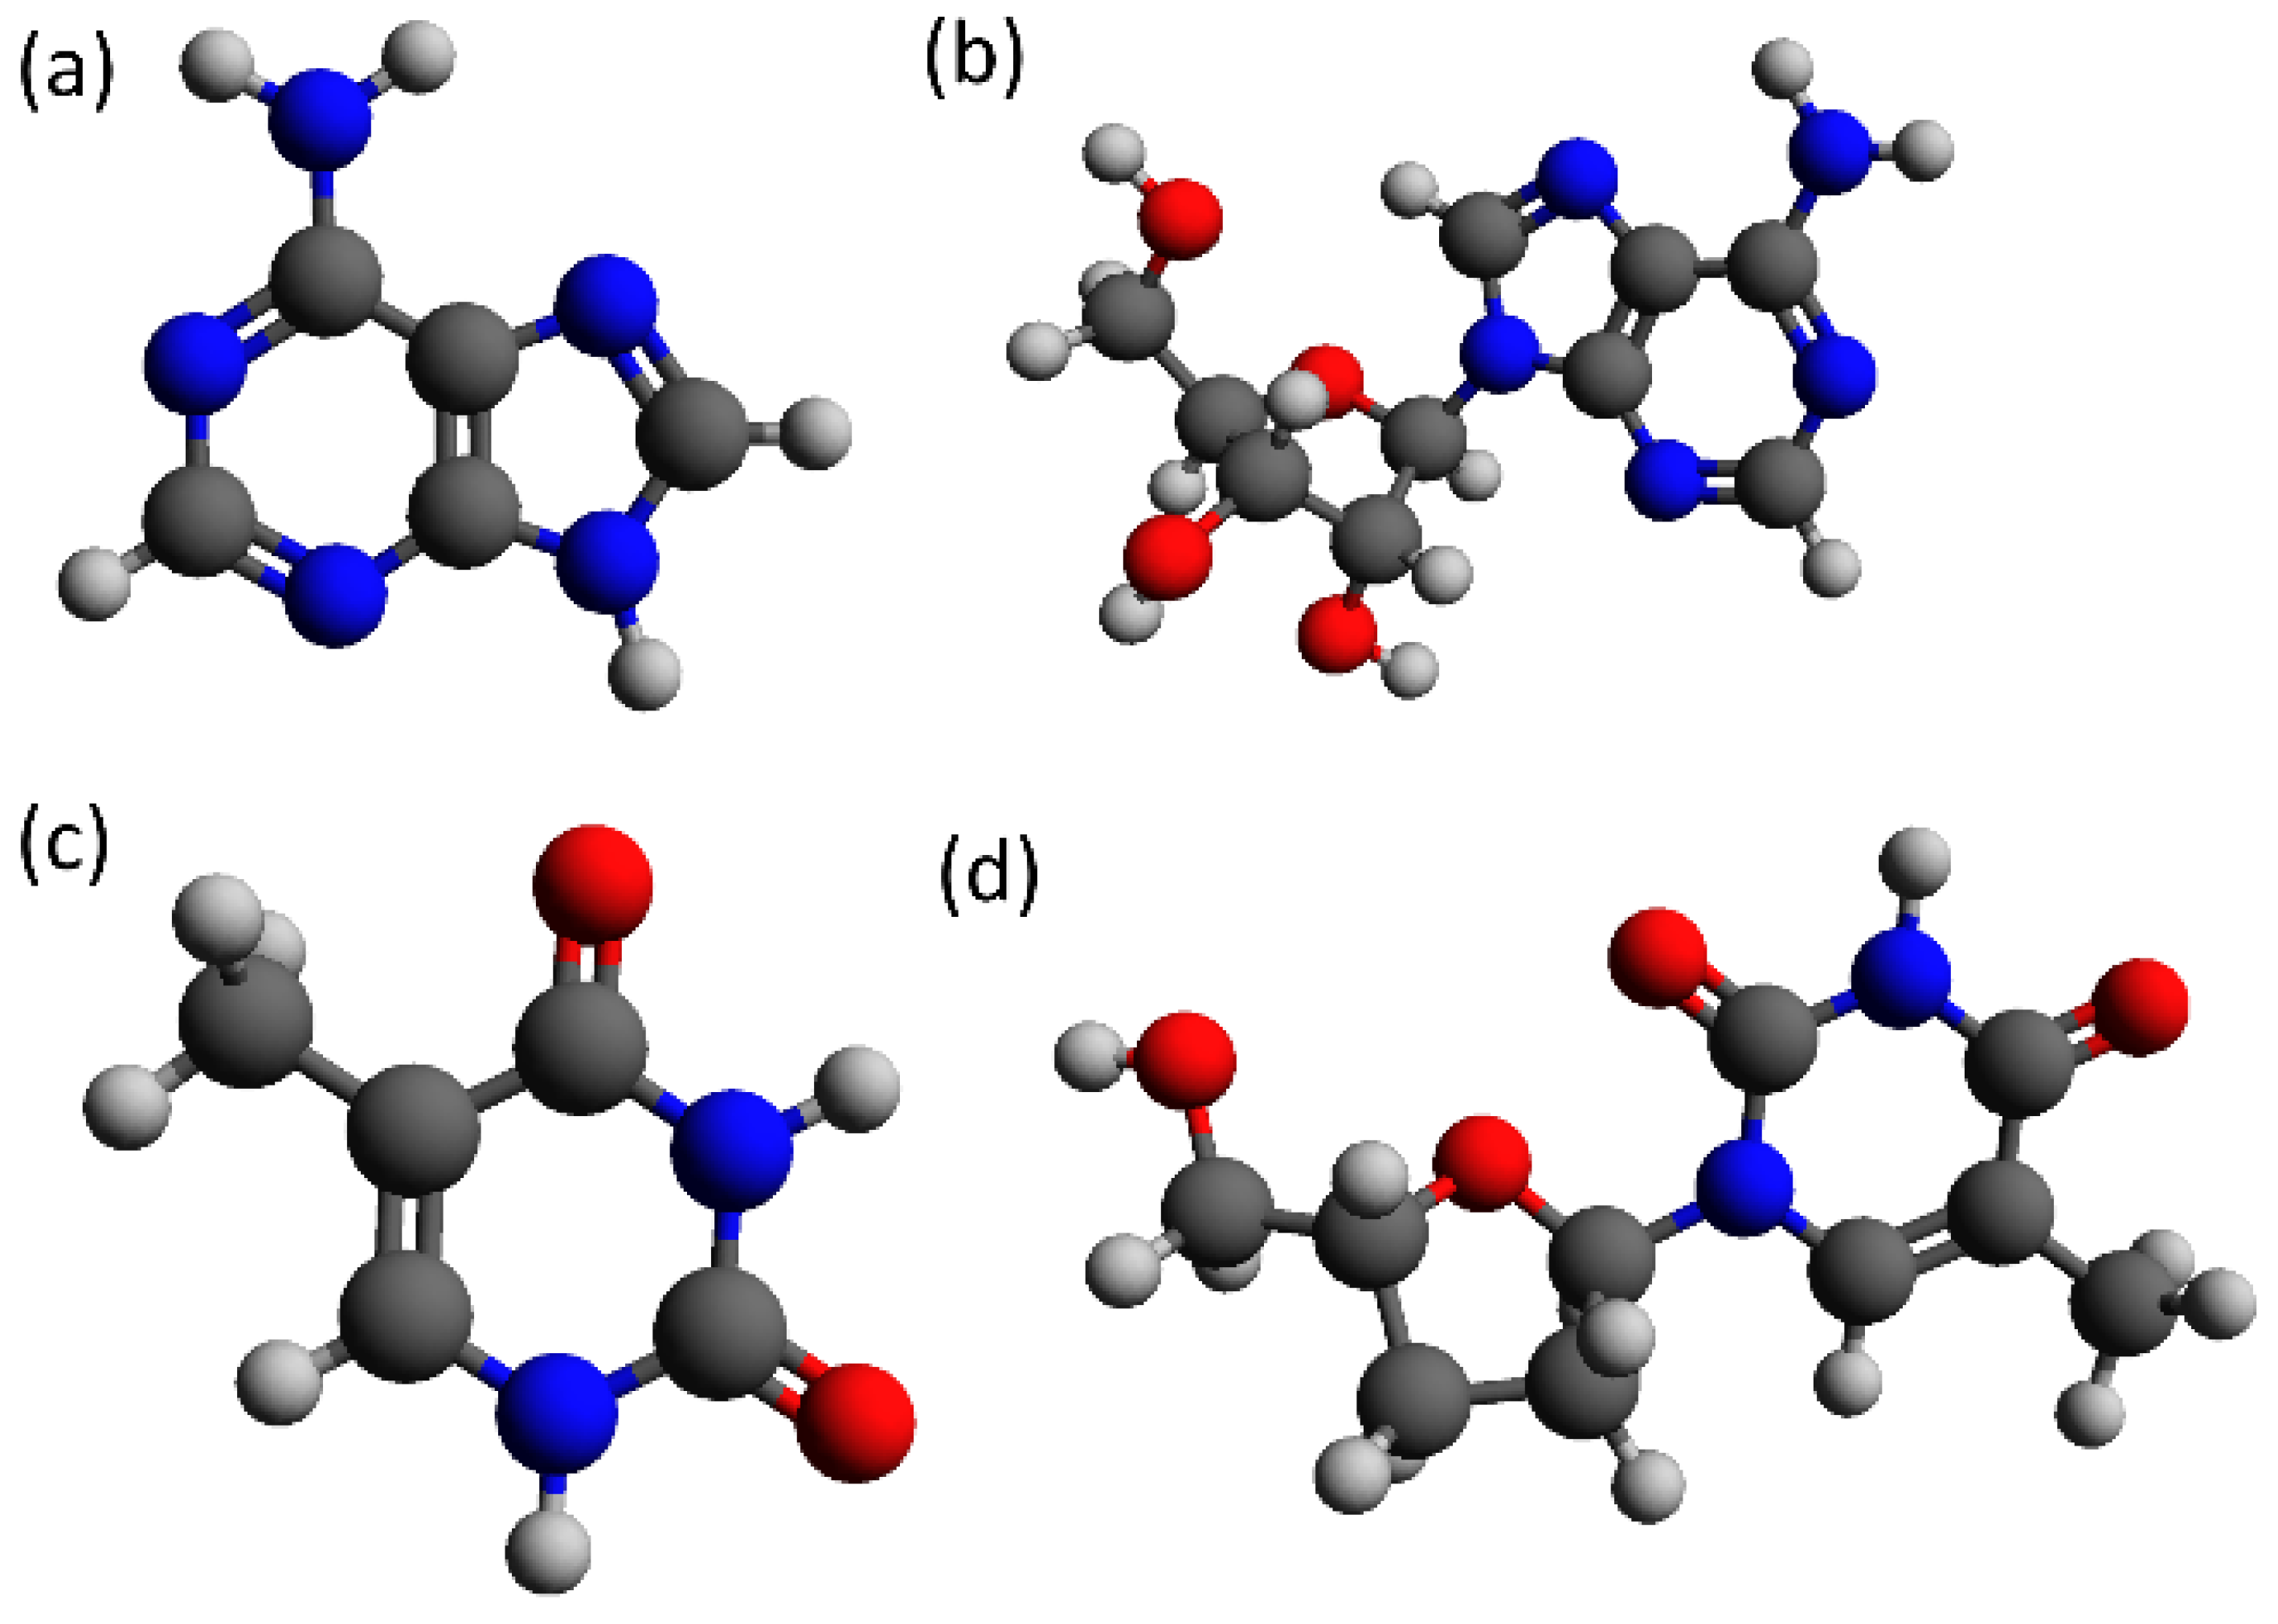
DNA is composed of repeating units of nucleobases: adenine (A), thymine (T), guanine (G), and cytosine (C). Figure 1 shows the skeletal structural formula of adenine and thymine composing the DNA strands employed in the present study, and their respective versions with sugar ribose and phosphate groups, as when included in a DNA strand. Normally, DNA is composed of two single strands of DNA (ssDNA) coiled together, forming a double-stranded DNA molecule (dsDNA), as, for example, in B-DNA. The two strands are stabilized by h-bonding between the parallel nucleobases of each ssDNA.
Non-linear spectroscopic tools, such as transient absorption (TA) and two-dimensional photon echo (PE) spectroscopic techniques, can identify exciton transfer pathways, as well as interactions between the DNA nucleobases. However, before performing such involved measurements, we must identify the DNA strands that show the strongest evidence of excitonic behavior. To simplify matters, we focus on detecting interactions between stacked nucleobases in single-stranded DNA (ssDNA), which are predominantly H-aggregate in character, and lack the contribution of the Watson–Crick hydrogen bond present in double-stranded DNA, so that we can isolate the contributions of the excitonic behavior along the backbone only, in a bottom-up approach. The techniques of investigation of the present study are absorption spectroscopy on the one hand, and circular dichroism spectroscopy (CD) on the other hand, at the UV range of wavelengths (around 260 nm), where nucleobases and ssDNA exhibit strong optical responses [11,12,13,14]. CD is a very sensitive technique to structural changes upon UV-light irradiation [15]. The transition dipole strength is analyzed and linked to the extent of the spatial delocalization of excitons using a data analysis technique based on dipole moment retrieval by multiple Gaussian fitting, as well as by the sum rules developed by Burin et al. [16].
Here, we selected two different families of homogeneous ssDNA referring to a single strand of DNA composed only of the same type of nucleobases, d(A)n and d(T)n where n is the number of nucleobases in the sequence. Moreover, we employ also the sequence of alternating adenines and thymines, d(AT)n. These two families are chosen to represent purines (adenosine-homo oligomers) and pyrimidines (thymine-homo oligomers) on the one hand, and the mixture of them (alternating sequence) on the other hand. We are limiting our investigation to this ssDNA to avoid base–pair interactions and simplify the model. These interactions would complicate the excitonic signature and the spectroscopic signal in general, while having single strands means that we have only excitons delocalized along the same strand of DNA due solely to the H-aggregation of nearby nucleobases. As regards length, the ssDNA is kept relatively small, 2 to 20 bases, to suppress the complexity of the system, and be able to simulate the absorption and circular dichroism spectra with limited computational resources. The dependence of the UV-absorption spectra of ssDNA upon its composition [17], due to bases interacting dissimilarly with each other, adds another layer of complication, which we started to tackle by studying very specific sequences of alternating adenines and thymines.
In the present work, we scrutinize DNA single strands for evidence and extent of excitonic signatures based upon a set of specific parameters, including length and nucleobase sequence. Our primary tools are absorption and circular dichroism spectroscopies, coupled with data analysis of the transition dipole strength, whose results are linked to the extent of the spatial delocalization of excitons. By comparing ssDNA molecules, we aim to find signatures of excitonic behavior. To our knowledge, this is the first time that short single strands of DNA with a well-defined sequence are systematically studied and where spectroscopic signatures are compared together utilizing this data analysis.

2. Materials and Methods

2.1. Experimental Methods

All the ssDNA strands were purchased from Jena Bioscience GmbH (Jena, Germany) [18] in the lyophilized form and used as received. Desalting and purification were performed by the vendor. The strands were re-suspended in a phosphate-based buffer [19], made from desalted and distilled water, and filtered with 0.2 µM polypropylene syringe filters. For each sample, the pH was neutral (approximately 7). The solute concentrations were adjusted so that the maximum absorbance, at 260 nm, was between 0.5 and 1 for each absorption and CD measurement. The absorption measurements were performed using a UV2600 spectrophotometer from Shimadzu Corp. CD spectra (Shimadzu, Duisburg, Germany), together with a second comparison set of absorption spectra, were acquired with a Chirascan-plus circular dichroism spectrometer from Applied Photophysics Limited (Applied Photophysics Limited, Skipton, United Kingdom). Each scan was performed with a resolution of 0.5 nm or 1 nm and an accumulation of 2 s. The spectra of the samples were measured in Hellma quartz cuvettes with path lengths of 0.1 cm and 1 cm to keep absorption comparable with each measurement.

2.2. Data Analysis Method

Optical density OD is related to a sample’s wavelength-dependent extinction coefficient ε(λ), measured in cm−1·M−1, via
O D λ = c l ε λ
where l is the path length (in cm), and c is the concentration of the solute in molar M. In turn, the extinction coefficient depends on the dipole strength D, defined as the square of the electric dipole transition moment µ, measured in Debye.
To be able to compare different sets of absorption and CD spectra with (slightly) different sample concentrations, it is necessary to perform a normalization through the following relationship:
x λ = x λ / O D λ 0
where [x(λ)] and x(λ) are, respectively, the normalized values of the optical density in case of absorption spectra and degrees of ellipticity in case of CD spectra. λ0 is the wavelength of the band around 260 nm with maximum value.
The magnitude of µ2 relates to the measured absorption spectrum by
D = μ 2 = 9.2 · 10 3 ε ν ν d ν
where ν is the wavenumber with units of cm−1. Hence, to retrieve µ2, we integrate globally across the absorption spectrum. To do this, the spectral peaks are fitted with Gaussian distributions. However, when multiple transitions occur too near to each other in the spectra, the peaks overlap partially. In this case, it is necessary to use multiple Gaussians to fit the spectral line with some starting guesses of the fitting parameters, to increase the quality and speed of the fitting. This is shown as an example for (dA)10 and (dT)10, respectively, in Figure A1 and Figure A2 in the Appendix A. The fitting starts from 210 nm due to the experimental limitations of the quartz cuvettes from the vendor Hellma.
CD provides information on the arrangement of subunits and on the direction of their transition dipole moments [13,19]. A dipole moment oriented in space interacts differently with a circularly polarized electromagnetic field, depending on whether it is left-(L) or right-(R) circularly polarized. Thus, light is absorbed differently in the case of different polarization, and we can define its difference as
Δ ε = ε L ε R
where ε L and ε R are the extinction coefficients, respectively, of the left- and right- circularly polarized light.
Within the frame of the Van Vleck theory, we can extract the exciton coupling from absorption and CD spectra, overcoming the effect of inhomogeneous broadening. Burin et al. [16,20] derived the sum rules for the absorption and CD spectra of polymer molecules by the Green function method and applied them to DNA hairpins. We used the same data analysis method for calculating the nearest neighbor and the second-to-nearest neighbor contributions of the exciton coupling of the samples in this study. Summarizing the results of Burin, we applied the following equation:
V 0 = 2 ln 10 n n 1 c d n r sin ϕ C D E E d E
where n is the number of monomers composing the polymer, nr is the refractive index, d is the distance between two monomers along the axes, ϕ the angle between their dipole moments, CD(E) is the energy dependent ellipticity angle in radians (the CD spectrum).

3. Results and Discussion

The absorption spectra of the single base deoxyadenosine triphosphate (dATP) and the ssDNA strands ((dA)n) on the left spectra of Figure 2 show a large band centered near 260 nm and an intense band near 215 nm, as has been reported in the literature [21,22,23]. The valley at around 230 nm is quite high for typical ssDNA absorption spectra, possibly due to the presence of impurities from the synthesis and purification process. The absorption peaks of the (dA)n strands are blue shifted by 3 to 4 nm compared with the peak of dATP. However, this blue shift does not linearly increase with the number of adenosines in the chain, and moreover, there is no broadening of the absorption peaks concomitant with increasing adenosine number, although there is a small shape change at approximately 285 nm. The blue shift is caused by a negative Coulomb coupling between neighboring chromophores in a tail-to-tail H-aggregates formation, as is the case for single-stranded DNA [24]. The exciton delocalized between the bases along the same strand, evidenced by the existence of a blue shift, was previously proposed by Hu et al. [2]; nevertheless, the shift does not increase as the number of nucleobases n grows. This either implies that this delocalization occurs only at a few sites, that competing phenomena, especially at room temperature, are at play (e.g., strong coupling to the bath, excimer formation, non-radiative decay, etc.), or a combination of the two.
At the same time, the CD spectra of (dA)n on the right plot of Figure 2 have a complicated structure, as previously reported by other groups [13,25,26,27]. Positive bands are present at 271 nm and at 218 nm, whereas negative bands occur at 250 nm and at 207 nm; alternating those bands with opposite signs, there are zero crossings at 260 nm and near 215 nm, whereas a positive shoulder appears at 230 nm. Therefore, we can recognize a clear negative Cotton effect, corresponding to the absorption peak at 257 nm. From the perspective of the secondary structure, it has been proven by Brahms et al. [28] that (dA)n is a “single-chain stacked-base helix”, based on their CD spectroscopy data. Likewise, our spectra show a broad positive band between 260 nm and 280 nm, preceded by a negative band between 240 nm and 260 nm, which is typical of a β-helix structure. After normalization at 260 nm against the absorption spectrum, when CD spectra of different (dA)n molecules are compared, the magnitude of the maxima at 270 nm and minima at 250 nm is, respectively, increasing and decreasing, as in Figure 2. A small deviation for dA2 is present in the CD spectrum, the origin of this discrepancy comes from impurities during the synthesis process of the oligomers.
Moving on to the thymine-based molecules, experimental absorption spectra of single chains of thymidines in Figure 3 are confirmed by other studies in the literature [15]. The spectrum of single-base dTTP (deoxythymidine triphosphate) exhibits a large peak centered at 268 nm. Relative to the absorption peak of the monomer, the (dT)n homo-oligomer spectral peaks are blue-shifted to approximately 266 nm, independently of the strand length. Another broad absorption band is present at around 206 nm but is not completely resolved due to the limit of our spectral window; hence, we will not discuss this further due to a lack of complete data. The aforementioned two absorption bands are connected via a deep valley at 235 nm. As was the case for the (dA)n homo-oligomers, the (dT)n strands do not show broadening when compared with each other or to the single base dTTP. Regardless of the lack of peak broadening and differently from the adenine case, the blue shift for multiple-base ssDNA suggests that there is an exciton delocalized between the bases along the strand, and overall, it behaves as an H-aggregate. Due to the constancy of the shift, this may occur only at a few sites. While one would expect to see further shifts with an increasing number of nucleic acids per strand, the broad nature of the absorption peak prevents us from identifying any extra shifts. By collecting spectra at lower temperatures, we would likely be able to reveal these extra shifts, which is planned in a follow-up paper.
The collected CD spectra are shown in Figure 3, and are in agreement with spectra from the literature [25,27]. The complicated structure of the CD spectra, for homo-oligomer strands composed of two or more thymidines, consists of four peaks of alternating sign; there are two negative peaks at 214 nm and 251 nm and two positive peaks at 223 nm and 278 nm. These are separated by nodal points at 220 nm, 231 nm, and 278 nm. We interpret this as a combination of two negative Cotton effects above and below 230 nm, corresponding to the absorption peaks centered at 266 nm and 208 nm respectively.
Spectral features show an increase in amplitude only, as the number of thymidines in the homo-oligomer strand increases above four. However, there is a 1 nm blue shift of the two red-most peaks between (dT)2 and (dT)4 onwards, and our extremely short strand (dT)2 appears to behave similarly to the short strands (n = 2, 3) presented in Holm et al. [25], with respect to this blue shift. The CD spectra indicate a β-helix secondary structure, similar to (dA)n, and in agreement with the literature [13].
As the last group of molecules presented in this paper, we move on to describe the absorption and CD spectra of (dAT)n repeats of DNA, shown in Figure 4, they are similar to what other groups obtained [29]. Here, one notices that the features recall both the spectra of (dA)n and (dT)n, as expected. The maximum of the main absorption band of (dAT)n is at 260 nm, with the lone exception of (dAT)10 (261 nm). As a comparison, the maximum absorption of (dA)n is 256.5 nm and of (dT)n is 266 nm. The absorption maximum of the A-T repeat strands is located exactly at the average of the constituting homo-oligomers: 261.25 ± 0.5 nm. Therefore, the contribution to the transition dipole strength is distributed equally toward the two nucleobases adenine and thymidine. One would expect similar behavior in the circular dichroism spectra, but the features are instead more mixed. For instance, the positive band at 280 nm has a completely different shape than the one of (dA)n, while it is analogous to the band of (dA)n. Moreover, the shoulder present at approximately 230 nm in (dA)n spectra is completely absent here and replaced with a (slightly positive) nodal point at 233 nm, a feature present in the spectra of (dT)n at 231 nm, where instead the nodal point is slightly negative. The difference on the y-scale is due to the influence, although reduced, of the shoulder of (dA)n.
The (dAT)n molecules have the characteristic of each being complementary of the other, meaning that if in the same ensemble of molecules there are two or more (dAT)4, as an example (but any length will work), then two different ssDNA molecules could match together and form double-stranded short oligos. Nevertheless, the melting temperature of (dAT)n molecules is above room temperature only for n > 6, and therefore, all the (dAT)n molecules in this study, with the exception of (dAT)10, can be safely assumed to be single-stranded. (dAT)10 merits special comment not only for the melting temperature being between 24.6 °C and 37.9 °C, depending on the simulation model [30,31,32], but also for the ability to form hairpins. (dAT)n, in general, are self-complementary and are known to form harpins at low concentrations of sodium ions [33], presenting a partial double-stranded structure. But, again, the shorter (dAT)n strands in this work have a much lower chance to form hairpins, since it requires at least 4 nucleobases to create a loop [34], automatically excluding any strand shorter than 10 nucleobases in the present work, so up to (dAT)6. More specifically, while (dAT)10 is long enough to create the hairpin, its melting temperature is lower, and therefore, hairpins are more likely to exist at room temperature. In fact, using the web-based software Mfold (version 3.5) [35], the melting temperature of (dAT)10 to form hairpins is 69.1 °C (see Figure A9 in Appendix A), well above room temperature, while the melting temperature for (dAT)5 is only 30.3 °C, which is not far from room temperature, causing a lower chance of forming hairpins. The completely different character of the CD spectrum below 220 nm of (dAT)10 as compared with shorter (dAT)n strands is indeed due to some of or all the nucleobases forming parallel hydrogen bonds with the complementary oligo respective bases [29]. Therefore, the secondary structure of (dAT)10 is mostly a hairpin.
As explained in the methods section, in addition to dipole strength the absorption spectra can reveal the presence of interactions between stacked bases in the ssDNA, from which excitons arise. When comparing single-nucleobase and multiple-nucleobase spectra, stacked-base interaction signals appear as absorption peak shifts and absorption band narrowing. The results of the fitting routine explained in the methods section are the peak wavelengths and dipole strength µ2 listed in Table 1. The molecular weights (MW) and extinction coefficients at 260 nm (ε260) are given by the manufacturer. All other values are extracted from the experimental absorption and circular dichroism spectra. We fitted the absorption spectra with three Gaussians (four in the case of (dAT)n), using the methodology described in the methods sections. The rationale behind the decision of which fitting function to use and how many curves to fit are described in the SI and are also based on literature results [36,37], and our own experimental results of 2D photon-echo spectroscopy of nucleobases [38] and on the same short-stranded DNA sequences as in the present paper (unpublished results). The fitting reveals two Gaussian underneath the 260 nm band, in accordance with literature for single nucleotides [36] and DNA single strands, and both are taken into consideration for calculating the transition dipole strengths. We calculated and plotted the transition dipole strengths (µ2, from Table 1) for the peaks at 257 nm to 274 nm and at 235 nm to 250 nm as a function of the number of nucleobases present in the strand of all the ssDNA studied; the result is shown in Figure 5. The three interpolating lines are first-order polynomials, with a coefficient of determination (R2) of 0.9934 ((dA)n), 0.9997 ((dT)n), and 0.9948 ((dAT)n). From these linear fits, we calculated the dependence of the transition dipole strength on the number of bases. The transition dipole strengths of (dT)n strands depend on the number of bases in DNA, as 12.3 D2 per base. This value is less than half than the one obtained for (dA)n, 21.83 D2, while the transition dipole strength-per-base for (dAT)n is between the two previous values: 18.64 D2. We can only speculatively assign the physical meaning behind this behavior to a different dipole moment interaction between neighboring nucleobases. The exact assignments can be performed only with the help of theoretical high-level simulations, which are extremely computationally expensive. It is clear that the transition dipole strength grows linearly with the number of nucleobases, and one could estimate the value of the transition dipole strength for any given ssDNA, knowing the sequence of the nucleobases in the strand and its length.
In CD spectra, evidence for excitons originating from stacked-based interactions is the Cotton, also called butterfly shape, spectral feature. This is a zero-crossing (nodal) point of the CD spectrum that corresponds to an absorption band. The full butterfly shape, made by two bands in the CD spectrum, correlates with two transition dipole moments of opposite signs that arise from excitonic electronic-level splitting. The Cotton effect can be understood as follows: DNA has its nucleobases disposed in a right-handed helix. At shorter wavelengths, near the nodal point, the dipole moments of interacting bases are almost parallel, creating a combined exciton state. Here, the right-hand circularly polarized light is most strongly absorbed. At longer wavelengths, the dipole moments are directed almost opposite of each other, therefore there is a strong absorption of left-hand (right-hand) circularly polarized light and hence the positive (negative) Cotton effect.
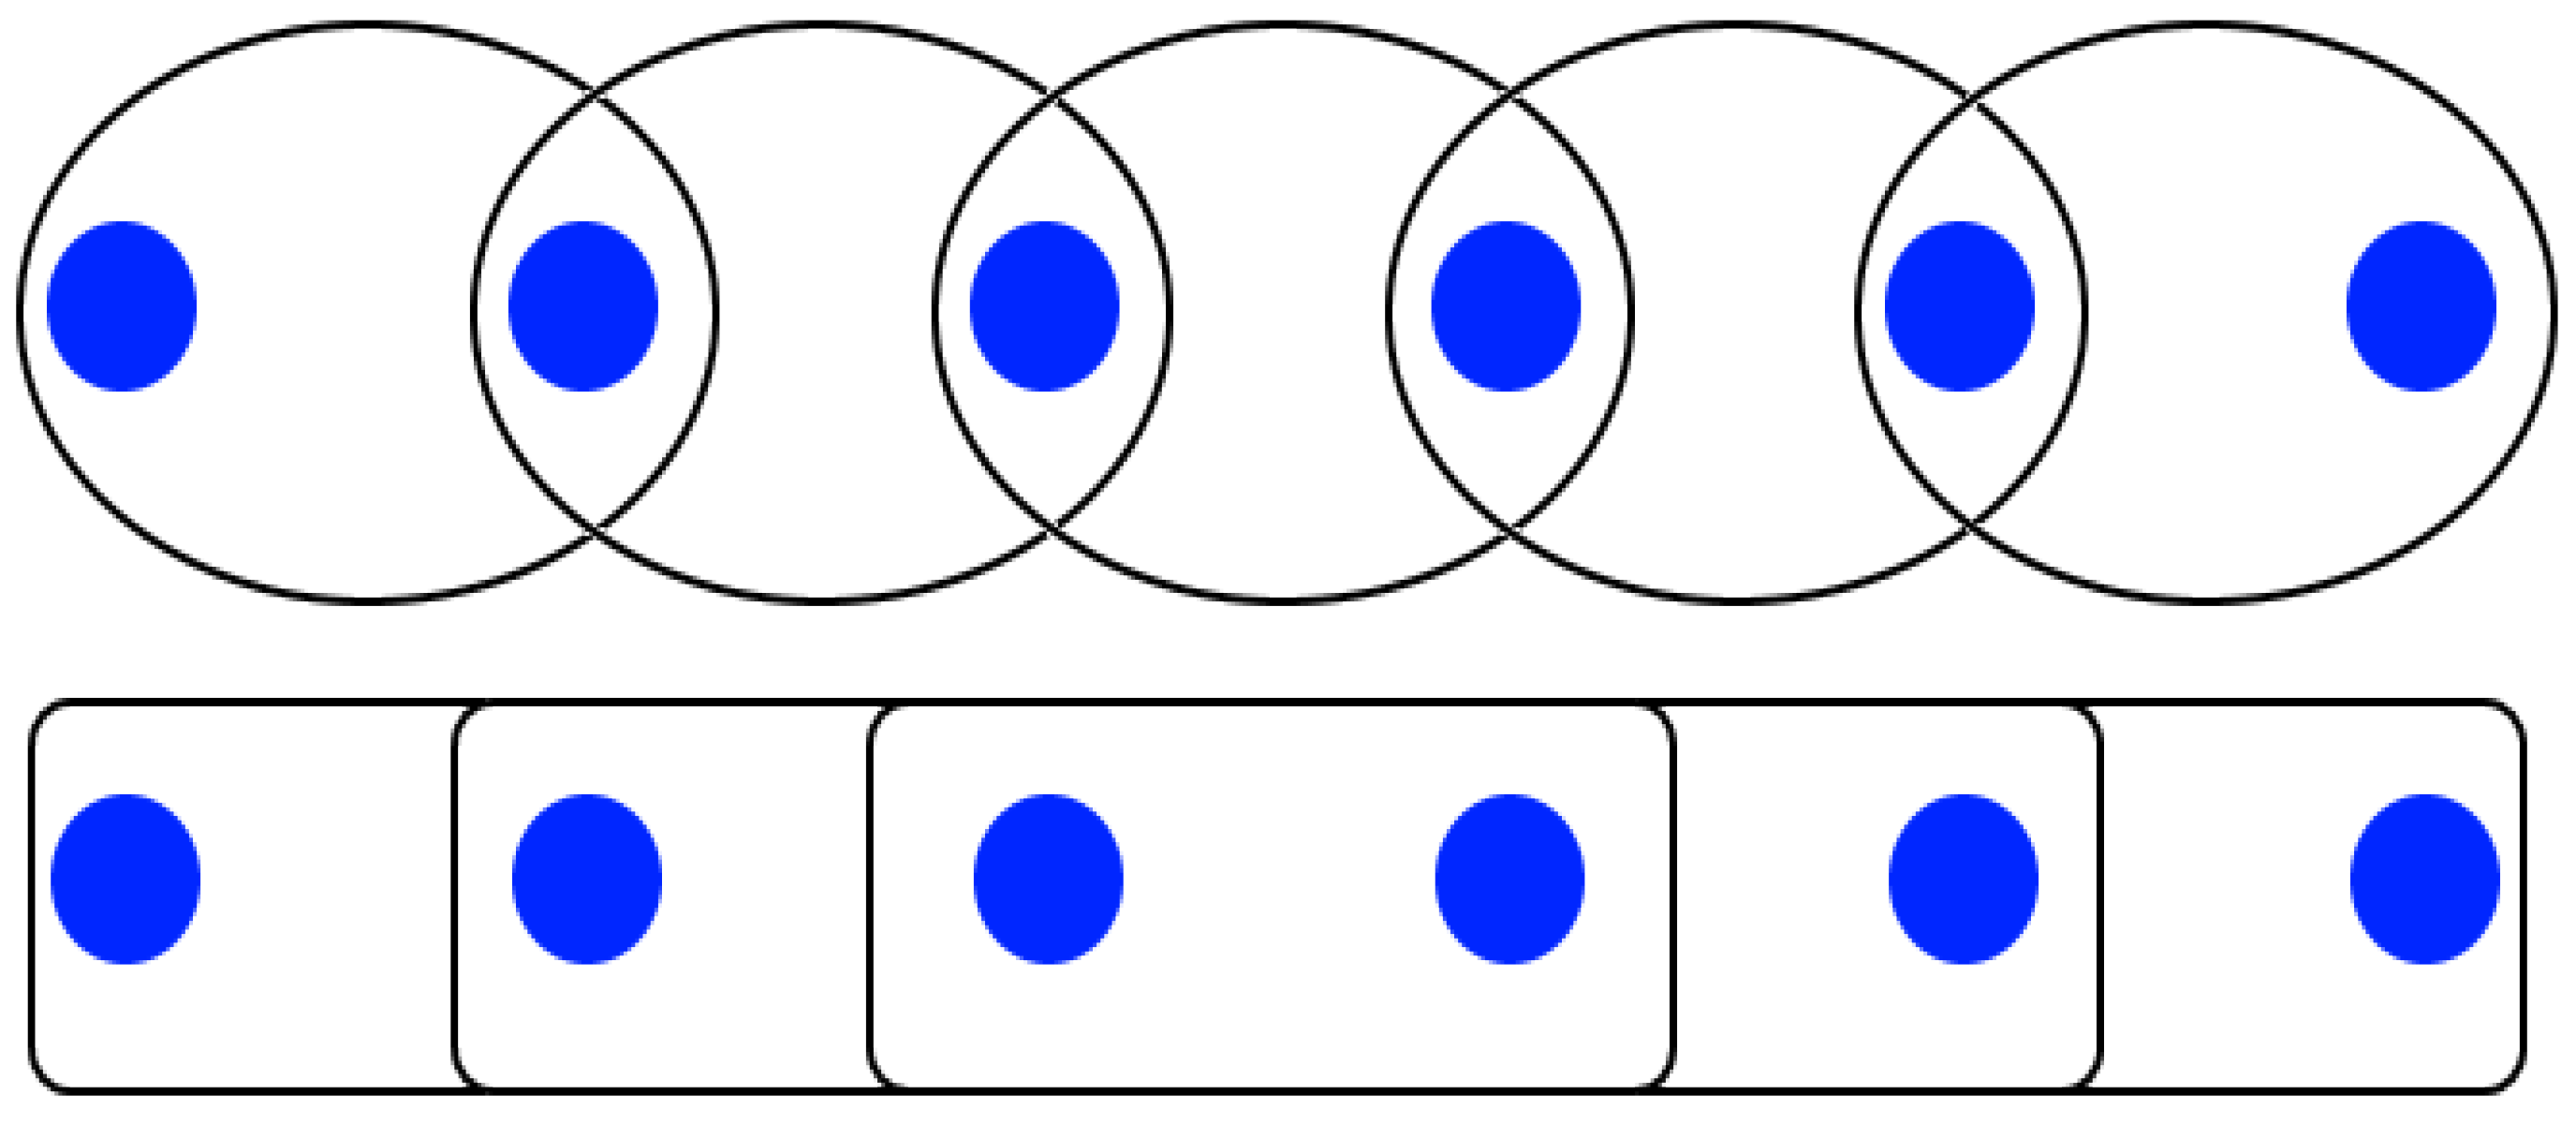
Furthermore, CD spectra can reveal the delocalization extent of excitons in oligomeric chains. If we assume that the basic element of the chain is a dimer, increasing the number of dimers leads to two possible kinds of behavior, as shown in the schematic of Figure 6. At the bottom, the basic elements ignore each other, so the contribution to the CD signal is just the product of the dimer signal with the number of dimers. At the top of Figure 6, the elements interact, and the CD signal is composed of the preceding non-interacting dimer signal together with the dimer interaction signal. To separate these two cases, the normalized peak values of the negative and positive bands of a butterfly-shaped are subtracted for different ssDNA lengths. In the first case, where excitons are localized solely among nearest neighbors, the relative strength of the CD signal does not increase as the number of bases per DNA strand increases. In the second case, where excitons are delocalized on more than one dimer, we expect an increased value with an increasing number of bases per strand. Qualitatively, as the slope steepness increases, so does the extent of the spatial delocalization.
The normalized CD spectra carry information on the type of interaction, regardless of whether it follows the top or the bottom situations depicted in Figure 6. The CD peaks, once the spectra are properly normalized, can be extracted and plotted versus the length of the strand (number of nucleobases composing the DNA), as shown in Figure A3 for (dA)n, Figure A4 for (dT)n, and Figure A5 for (dAT)n (both in the Appendix A). The values of these CD peaks (
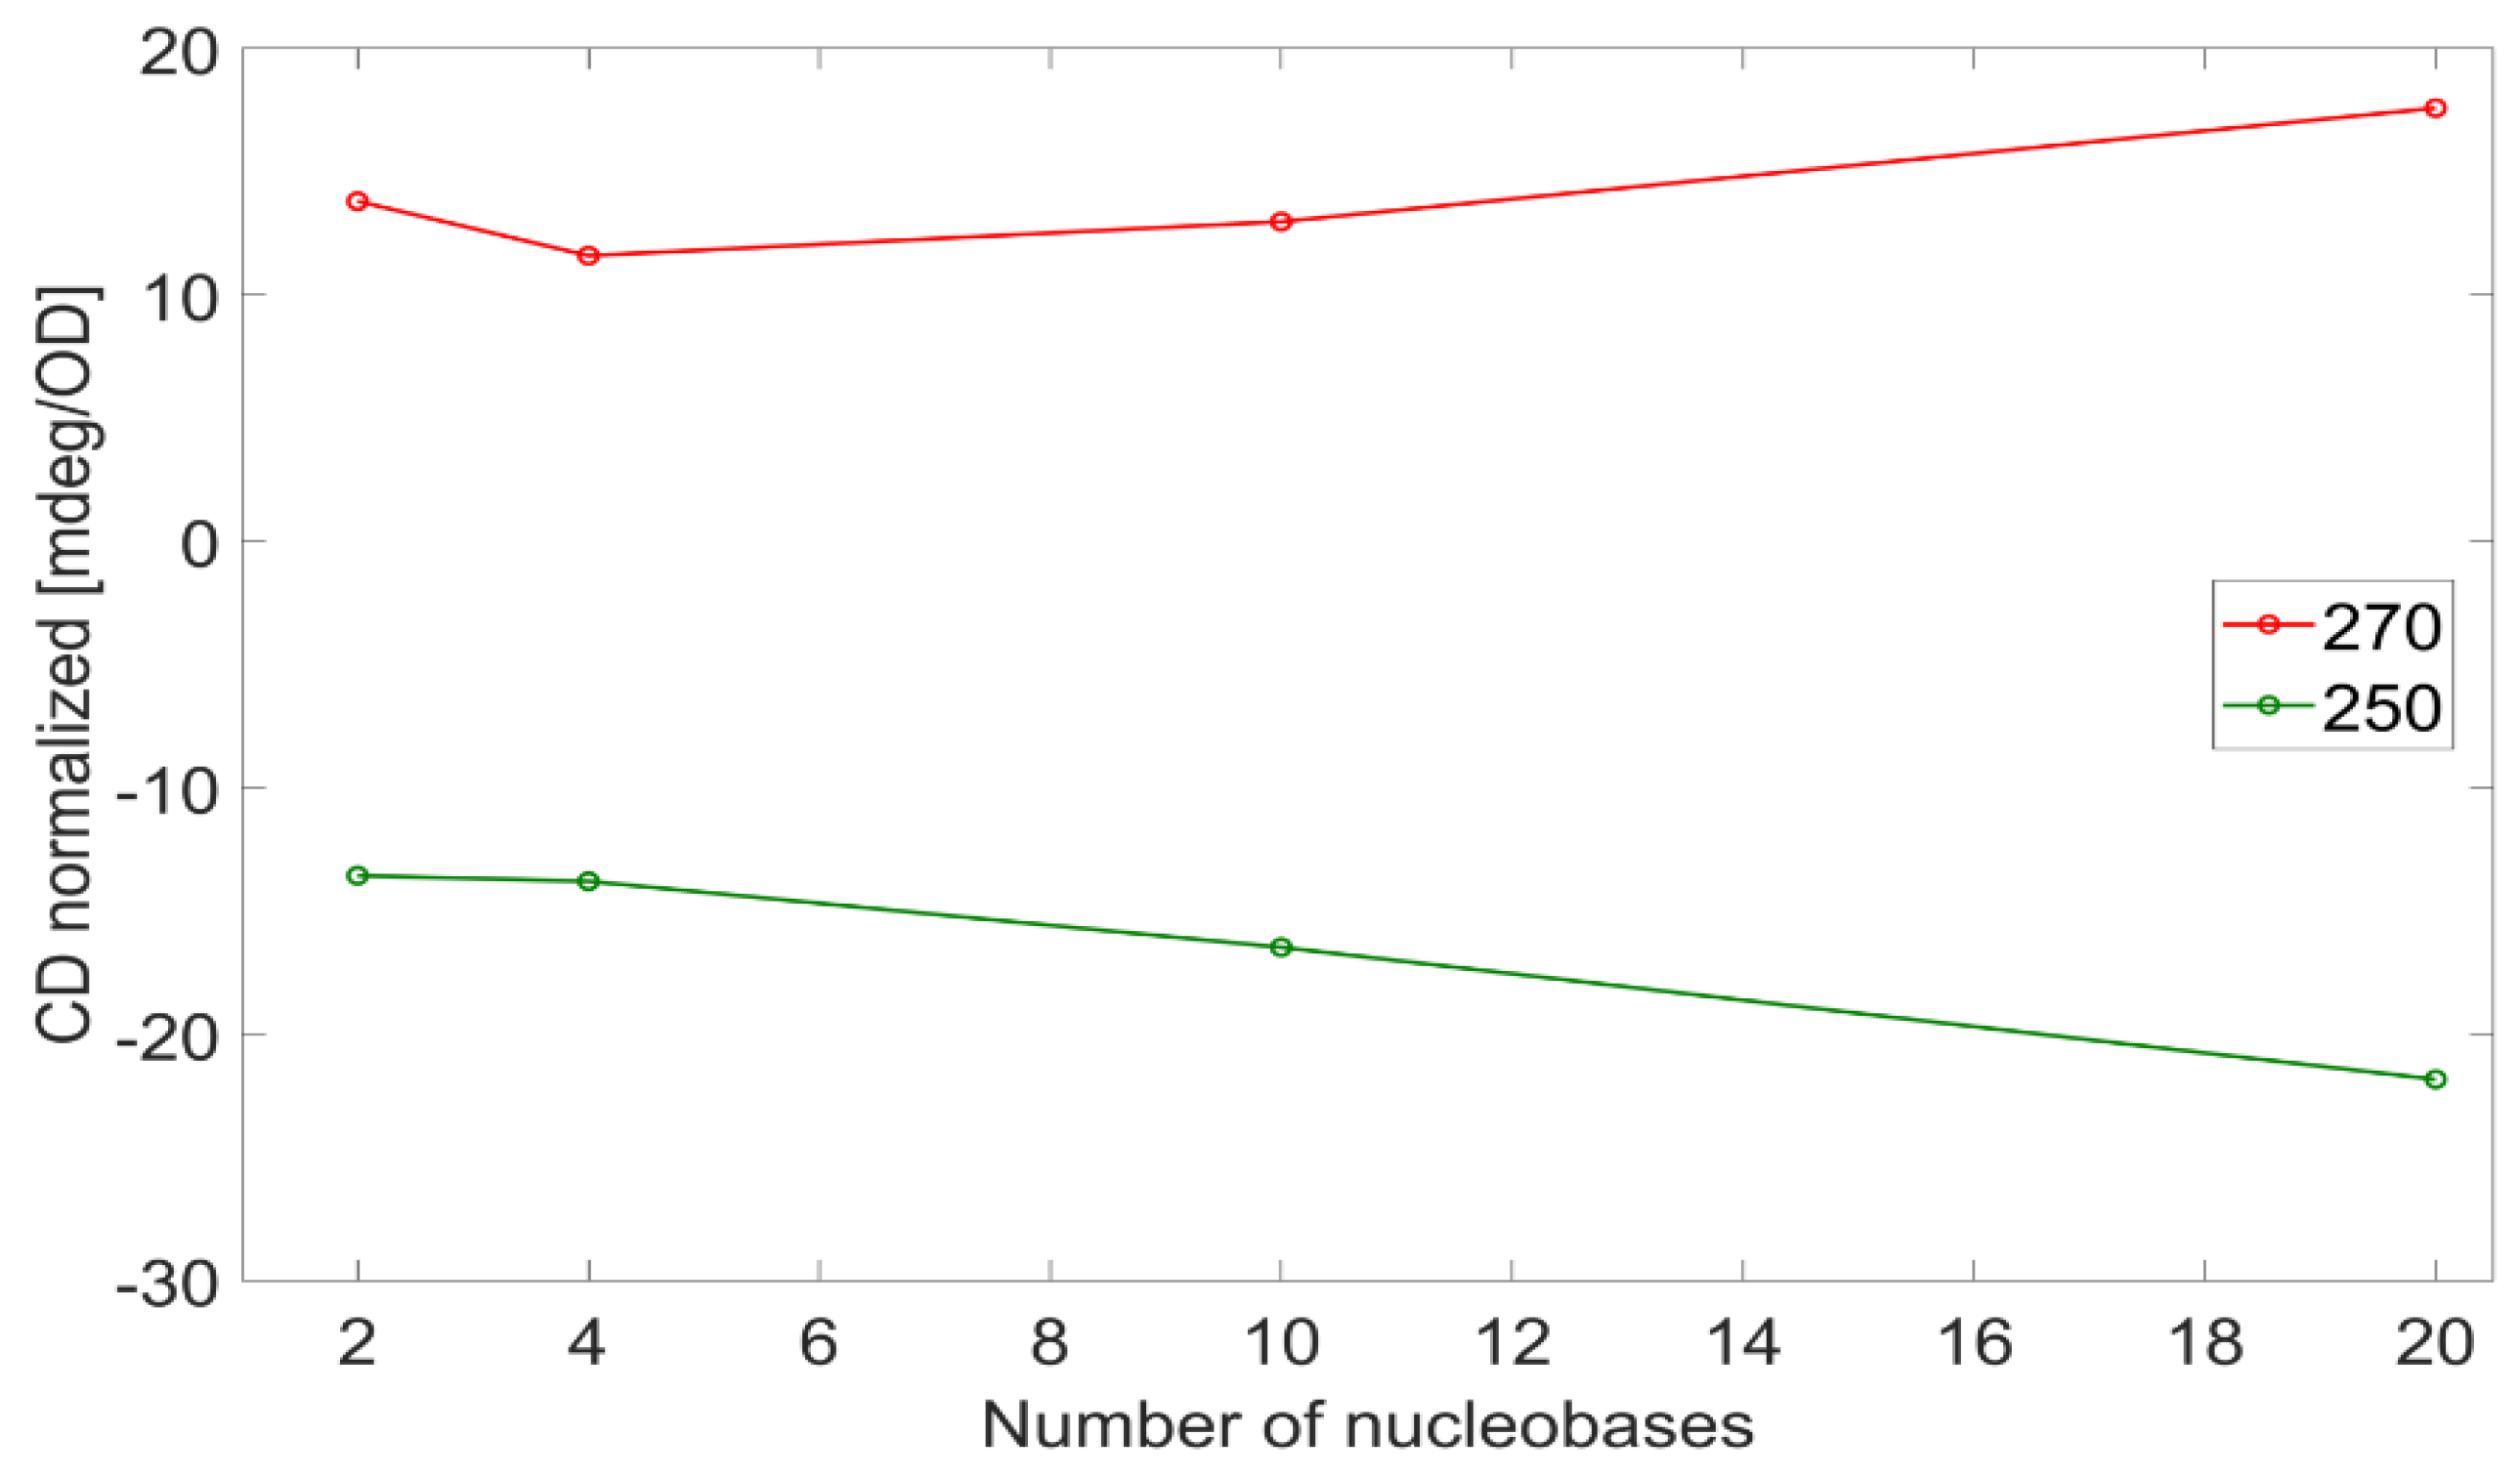
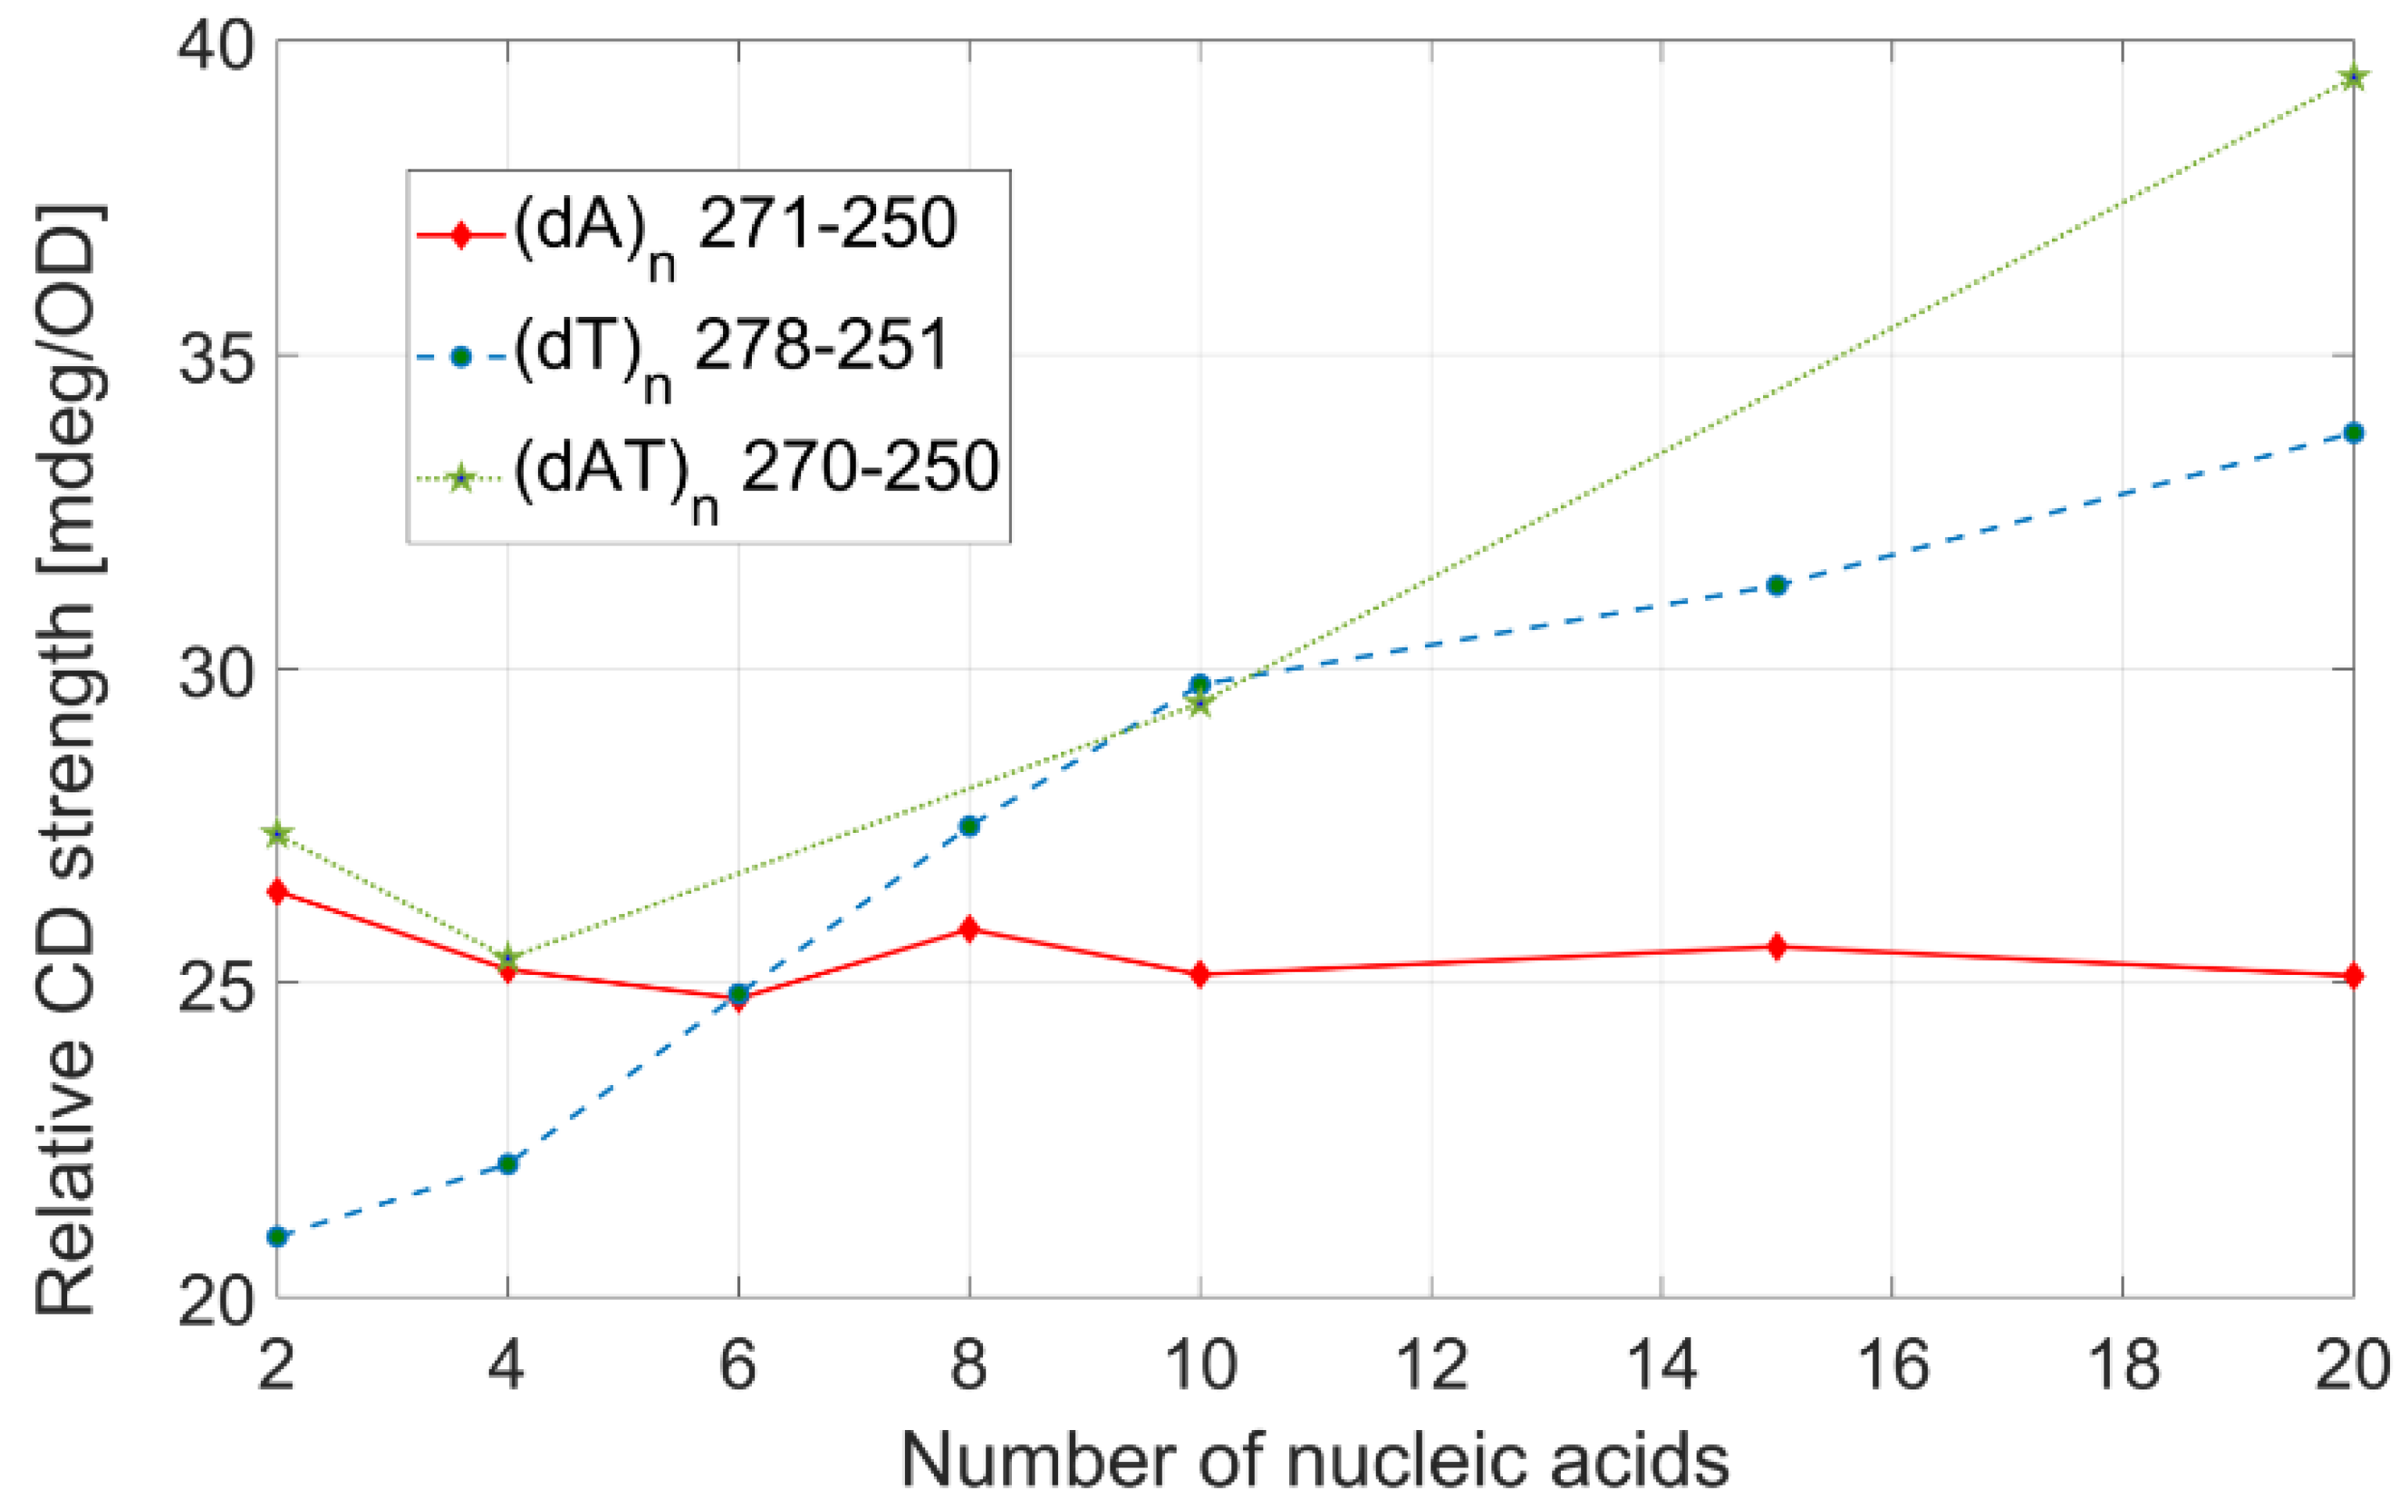
Table 1) can be treated to extract the exciton interaction strength when related peak couples are identified. The maxima at 270−278 nm and minima at 250−251 nm in the CD spectra fall both under the same broad absorption peak, and they arise from an exciton coupling. The differences in the absolute values of the related maxima and minima are shown in Figure 7, plotted versus the number of nucleobases per strand, (dA)n in red, (dT)n in blue, and (dAT)n in green. While both the CD peaks of adenosine and thymidine strands increase in magnitude when the strands increase in length, the trend is not the same: in the case of adenosine, it is constant, while the relative CD strength increases with the number of thymidines per strand and does not saturate. It is known that β-DNA has a helicity of 10.5 bases per turn; therefore, in this study, we covered both the situation where DNA is not fully twisted (n ≤ 10) and where it is (n > 10). In both ranges, the value of the difference between CD peaks is stationary (adenosine) or increases (thymidine); therefore, the trend does not depend on whether the DNA is fully or partially twisted. This suggests that the excitons delocalize more and more as the (dT)n becomes longer regardless of the completeness of the helix, as opposed to the excitons in (dA)n that stay localized in a few nucleobases. In other words, for adenosine strands, the closest bases are the main contributors to the base-base interaction strength, and the extent of the excitons is only among the nearest neighbors.
The sum rules for absorption and circular dichroism spectra derived by Burin et al. [16,20] can be used to express exciton coupling strength through the integral properties of the experimental spectra, as outlined in the methods section. These have been applied to the spectra of this study, and the resulting values are plotted in Figure 8. The values of the exciton coupling are similar to the values found for DNA hairpins by Burin et al. [16]. Considering that hairpins are double-stranded, the lower values of exciton coupling that we find are to be expected. In fact, the values in Burin et al. [16] for A-poly-T sequences (0.035 eV, 0.036 eV, 0.033 eV for n = 4, 6, 8) are 4% smaller for n = 6 and 20% smaller for n = 8 than our values. This is not surprising, considering that a double-stranded structure is more rigid than a single-stranded one, and its nucleobases are closer, therefore the electronic excitations are farther apart due to the stronger H- and J-shifts. The growing trend of thymine oligomers and the steady trend of adenine oligomers confirms our analysis (Figure 7); the exceptions are strands of 2 and 4 nucleic acids. This might be due to an underestimated difference in the Van Vleck theory between strands too short to complete even half of a chain twist (5 nucleic acids in B-type DNA). Using Burin’s method, the (dAT)n family holds steady, whereas using our method it grows; as previously mentioned, (dAT)n is a self-annealing repeat that has a high chance to become double-stranded when long enough, while it stays unfolded when short. Consequently, the exciton coupling for shorter and longer A-T values represent two different structures (single and hairpin double-stranded DNA, respectively).
A surprising difference exists between the results of Figure 7 and Figure 8 on the one hand and Figure 5 on the other, whereby the order of the three families is inverted: the values of the dipole strength of adenine homo-oligomers are the highest at any given number of nucleic acids, while the value of the exciton coupling is the lowest. Due to the dipolar nature of exciton coupling, the oscillation strength is greater for quantum states with larger transition dipole moments [39]. Therefore, the exciton coupling should scale with the dipole strength. Consequently, the previously mentioned difference might be simply due to a different geometry of the DNA, meaning that the nucleobases are not disposed in a parallel fashion or with a 36 angle between the nearby bases, as originally hypothesized.
The findings in the present work can be extended to any other sequence of DNA and RNA, given that the molecules remain single-stranded and of a similar secondary structure. We plan to repeat the same measurements by dissolving the ssDNA molecules in buffers with different compositions as the one used in this work to ensure the presence of only single-stranded DNA molecules in the samples, and in particular, we will add DMSO (Dimethyl sulfoxide) to the phosphate-based buffer. DMSO is commonly used in biotechnology for intentional denaturation of DNA, that is the forcing of double-stranded DNA to separate and remain single-stranded. The data analysis cannot be immediately replicated, as the presence of ions and cations and other molecules like DMSO modifies both the absorption and circular dichroism and both the first and secondary structure of DNA in a more complicated way than just denaturation of oligomers [40,41,42]. Unluckily, to the knowledge of the authors, there is no systematic study of the absorption and circular dichroism of short strands of DNA with well-known lengths and sequences where DMSO was employed and the signals characterized.

4. Conclusions

In this study, we collected and analyzed the absorption and circular dichroism spectra at room temperature of short single strands of DNA (also called oligomers) in a phosphate-based neutral buffer, with a well-defined length and sequence. The absorption peaks show a shift of a few nanometers, and the circular dichroism spectra show an evident Cotton effect for all the studied oligomers, though the expected narrowing of the absorption peaks is absent, probably due to strong solvent interaction and other overlapping phenomena.
The Gaussian decomposition fitting of the absorption peaks reveals a linear relationship between the number of nucleobases present in the single-stranded DNA and its dipole strengths. This allows for the prediction of the transition dipole strength values of strands with a different number of bases in an empirical fashion, bypassing any approximation necessary in the typical modeling techniques. Further analysis of absorption and CD spectra, through the use of normalization and peak intensity comparison, and of integrating equations from the Van Vleck theory, uncovers a non-trivial dependence of the delocalization extent of excitons on the length of the oligomeric chain, and the exact sequence. In the present work, we proved experimentally that excitons delocalize only amongst nearest neighbors in adenosine-only ssDNA molecules, while thymidine-only ssDNA and the ones formed by (dAT) repeats exhibit excitons that delocalize in a growing range of neighbors as strand length increases.
Furthermore, we compared our data with the one published by Burin et al. [16], using the same data analysis based on the Green function method. While the results generally agree with the samples in the study, there are two exceptions. Firstly, all three families of ssDNA studied here present outliers in the molecules with two and four nucleobases, while this is not observed when using our treatment. Secondly, the order of the strength of the excitonic coupling calculated using Burin’s method and our method is reversed in our study as compared with the dipole strength order. The difference is to be ascribed to the presence of both J-aggregates and H-aggregates in the molecules [16,39], while in our work we employ only ssDNA molecules, with the potential exception of (dAT)10, which is long enough to form hairpin structures at room temperature.
In conclusion, by employing the linear spectroscopic methods of absorption and circular dichroism spectroscopies, we demonstrated that (1) it is possible to determine the presence, intensity, and extent of excitonic behavior, (2) DNA single strands show evidence of excitonic behavior, and both the strength and the extent of excitons in ssDNA strongly depend on the composition of the strands, specifically on the nucleobases bordering any other given nucleobase (the DNA sequence) and consequently of its secondary structure. These findings can be extended to any other length and sequence of DNA and RNA, given that the molecules remain single-stranded and of a similar secondary structure. This can be generally achieved by the addition of DMSO to the buffers, although no studies at the present moment characterize the absorption and circular dichroism of short single strands of DNA by sequence and length in the presence of solvents other than phosphate-only based ones.

Author Contributions

Conceptualization, V.I.P., R.J.D.M. and A.P.; methodology, A.P., V.I.P. and A.L.S.; software and data analysis, A.P.; validation, A.P., V.I.P. and A.L.S.; formal analysis, A.P.; investigation and experiments, A.P. and A.L.S.; writing—original draft preparation, A.P. and A.L.S.; writing—review and editing, all authors; project administration, V.I.P. and R.J.D.M.; supervision and funding acquisition, R.J.D.M. All authors have read and agreed to the published version of the manuscript.

Funding

This research received no external funding.

Institutional Review Board Statement

Not applicable.

Informed Consent Statement

Not applicable.

Data Availability Statement

Dataset available on request from the authors.

Acknowledgments

We would like to thank Michal Kochman for helpful discussions and Alexandr D. Burilkov for critical reading of the manuscript.

Conflicts of Interest

The authors declare no conflicts of interest.

Appendix A

Figure A1. An example of an absorption spectrum fit using three Gaussians for (dA)10. Only the first two peaks from the left were used for the calculation of the dipole moments, since the rightmost one, in yellow, cannot be fully resolved due to limitations of the cuvette and the spectrometers.
Spectroscj 03 00011 g0a1
Figure A2. An example of an absorption spectrum fit using three Gaussians for (dT)10. Only the first two peaks from the left were used for the calculation of the dipole moments, since the rightmost one, in yellow, cannot be fully resolved due to limitations of the cuvette and the spectrometers.
Spectroscj 03 00011 g0a2
Figure A3. Maxima and minima of the normalized CD spectra of (dA)n are shown as a function of the number n of adenosines composing the single strand for peaks at 218 nm (blue line), 271 nm (red line), 250 nm (black line), and 206 nm (red line).
Spectroscj 03 00011 g0a3
Figure A4. Normalized CD maxima and minima, at specific wavelengths, of (dT)n are shown as a function of the number (n) of thymidines composing the single strand. The chosen wavelengths correspond to peaks at 223 nm (blue line), 278 nm (red line), 214 nm (black line), and 251 nm (red line).
Spectroscj 03 00011 g0a4
Figure A5. Fraction of double-stranded (folded) (dAT)10 (green dashed curve) and single-stranded (unfolded) (dAT)10 (red full line), with varying temperature. The melting temperature is marked with a vertical dotted black line at 69.1 °C.
Spectroscj 03 00011 g0a5
Figure A6. Normalized CD maxima and minima, at specific wavelengths, of (dAT)n are shown as a function of the number n of nucleobases composing the single strand. The chosen wavelengths correspond to peaks at 220 nm (blue line), 270 nm (red line), 205 nm (black line), and 250 nm (green line).
Spectroscj 03 00011 g0a6
To find the best PDF fit for the absorption spectra, we employed different fitting functions and concluded that the Gaussian fitting function is marginally better than Voigt and decisively better than Lorentzian. Our decision was guided by both the integral of the residuals from fitted data (see Figure A7, Figure A8, Figure A9 and Figure A10) and the results presented in the literature [36]. Moreover, a previous publication by some of the authors shows that two Gaussians are a good fit with respect to simulations and modeling performed by Pola et al. [37].
Intuitively, the majority of the effects on the broadening of an electronic band of large molecules like DNA oligos and DNA single strands is predominantly inhomogeneous broadening, caused by a variety of phenomena, which include temperature dependence. In general, inhomogeneous broadening is mathematically described by a Gaussian line shape. Homogenous broadening is instead described by a Lorentzian line shape. Normally, both broadenings are present, and conventionally a Voigt one is used. Nevertheless, in the specific cases of this work, the Lorentzian part is minimal or absent, and we have discarded it for simplicity of fitting and data analysis.
Figure A7. Integrals of the residuals of the fits with different pdf: Gaussian functions (blue), Voigt functions (red), and Lorentzian functions (yellow) for ssDNA (dA)2. On the x-axis is the number of components utilized (the number of curves used for fitting for the full width of the spectrum).
Spectroscj 03 00011 g0a7
Figure A8. Integrals of the residuals of the fits with different pdf: Gaussian functions (blue), Voigt functions (red), and Lorentzian functions (yellow) for ssDNA (dA)10. On the x-axis is the number of components utilized (the number of curves used for fitting for the full width of the spectrum).
Spectroscj 03 00011 g0a8
Figure A9. Integrals of the residuals of the fits with different pdf: Gaussian functions (blue), Voigt functions (red), and Lorentzian functions (yellow), for ssDNA (dT)2. On the x-axis is the number of components utilized (the number of curves used for fitting for the full width of the spectrum).
Spectroscj 03 00011 g0a9
Figure A10. Integrals of the residuals of the fits with different pdf: Gaussian functions (blue), Voigt functions (red), and Lorentzian functions (yellow) for ssDNA (dT)10. On the x-axis is the number of components utilized (the number of curves used for fitting for the full width of the spectrum).
Spectroscj 03 00011 g0a10

References

  1. Pfeifer, G.P.; You, Y.-H.; Besaratinia, A. Mutations induced by ultraviolet light. Mutat. Res. 2005, 571, 19–31. [Google Scholar] [PubMed]
  2. Hu, L.; Zhao, Y.; Wang, F.; Chen, G.; Ma, C.; Kwok, W.M.; Phillips, D.L. Are adenine strands helical H-aggregates? J. Phys. Chem. B 2007, 111, 11812–11816. [Google Scholar] [CrossRef] [PubMed]
  3. Buchvarov, I.; Wang, Q.; Raytchev, M.; Trifonov, A.; Fiebig, T. Electronic energy delocalization and dissipation in single- and double-stranded DNA. Proc. Natl. Acad. Sci. USA 2007, 104, 4794–4797. [Google Scholar] [PubMed]
  4. Conwell, E.M.; McLaughlin, P.M.; Bloch, S.M. Charge-Transfer Excitons in DNA. J. Phys. Chem. B 2008, 112, 2268–2272. [Google Scholar]
  5. Crespo-Hernández, C.E.; Kohler, B. Influence of Secondary Structure on Electronic Energy Relaxation in Adenine Homopolymers. J. Phys. Chem. B 2004, 108, 11182–11188. [Google Scholar]
  6. Ritze, H.-H.; Hobza, P.; Nachtigallova, D. Electronic coupling in the excited electronic state of stacked DNA base homodimers. Phys. Chem. Chem. Phys. 2007, 9, 1672. [Google Scholar] [CrossRef]
  7. Bouvier, B.; Dognon, J.P.; Lavery, R.; Markovitsi, D.; Millié, P.; Onidas, D.; Zakrzewska, K. Influence of Conformational Dynamics on the Exciton States of DNA Oligomers. J. Phys. Chem. B 2003, 107, 13512–13522. [Google Scholar]
  8. Onidas, D.; Gustavsson, T.; Lazzarotto, E.; Markovitsi, D. Fluorescence of the DNA double helices (dAdT)n.(dAdT)n studied by femtosecond spectroscopy. Phys. Chem. Chem. Phys. PCCP 2007, 9, 5143–5148. [Google Scholar]
  9. Su, C.; Middleton, C.T.; Kohler, B. Base-Stacking Disorder and Excited-State Dynamics in Single-Stranded Adenine Homo-oligonucleotides. J. Phys. Chem. B 2012, 116, 10266–10274. [Google Scholar]
  10. Middleton, C.T.; de La Harpe, K.; Su, C.; Law, Y.K.; Crespo-Hernández, C.E.; Kohler, B. DNA excited-state dynamics: From single bases to the double helix. Annu. Rev. Phys. Chem. 2009, 60, 217–239. [Google Scholar]
  11. Voet, D.; Gratzer, W.B.; Cox, R.A.; Doty, P. Absorption spectra of nucleotides, polynucleotides, and nucleic acids in the far ultraviolet. Biopolymers 1963, 1, 193–208. [Google Scholar] [CrossRef]
  12. Tataurov, A.V.; You, Y.; Owczarzy, R. Predicting ultraviolet spectrum of single stranded and double stranded deoxyribonucleic acids. Biophys. Chem. 2008, 133, 66–70. [Google Scholar] [CrossRef] [PubMed]
  13. Gray, D.M.; Ratliff RL, L.; Vaughan, M.R. Circular dichroism spectroscopy of DNA. Methods Enzymol. 1992, 211, 389–406. [Google Scholar]
  14. Cantor, C.R.; Warshaw, M.M.; Shapiro, H. Oligonucleotide interactions. 3. Circular dichroism studies of the conformation of deoxyoligonucleotides. Biopolymers 1970, 9, 1059–1077. [Google Scholar] [CrossRef]
  15. Baggesen, L.M.; Hoffmann, S.V.; Nielsen, S.B. On the Formation of Thymine Photodimers in Thymine Single Strands and Calf Thymus DNA. Photochem. Photobiol. 2013, 1, 99–106. [Google Scholar] [CrossRef]
  16. Burin, A.L.; Armbruster, M.E.; Hariharan, M.; Lewis, F.D. Sum rules and determination of exciton coupling using absorption and circular dichroism spectra of biological polymers. Proc. Natl. Acad. Sci. USA 2009, 106, 989–994. [Google Scholar] [CrossRef]
  17. Pechenaya, V.I.I. Hypochromism of polynucleotides in the nearest neighbour approximation. Chem. Phys. Lett. 1975, 34, 585–587. [Google Scholar] [CrossRef]
  18. Jena Bioscience GmbH. Available online: http://www.jenabioscience.com/ (accessed on 24 March 2025).
  19. Gustavsson, T.; Markovitsi, D. Fundamentals of the Intrinsic DNA Fluorescence. Acc. Chem. Res. 2021, 54, 1226–1235. [Google Scholar] [CrossRef]
  20. Balamurugan, D.; Lewis, F.D.; Burin, A.L. Circular dichroism spectra of DNA hairpins studied by the Green function method. J. Phys. Chem. B 2007, 111, 3982–3989. [Google Scholar] [CrossRef]
  21. Kadhane, U.R.; Holm AI, S.; Hoffmann, S.V.; Nielsen, S.B. Strong coupling between adenine nucleobases in DNA single strands revealed by circular dichroism using synchrotron radiation. Phys. Rev. E 2008, 77, 21901. [Google Scholar] [CrossRef]
  22. Crespo-Hernández, C.E.; Cohen, B.; Kohler, B. Base stacking controls excited-state dynamics in A·T DNA. Nature 2005, 436, 1141–1144. [Google Scholar] [PubMed]
  23. Kwok, W.-M.; Ma, C.; Phillips, D.L. Femtosecond time- and wavelength-resolved fluorescence and absorption spectroscopic study of the excited states of adenosine and an adenine oligomer. J. Am. Chem. Soc. 2006, 128, 11894–11905. [Google Scholar] [PubMed]
  24. Mishra, A.; Behera, R.K.; Behera, P.K.; Mishra, B.K.; Behera, G.B. Cyanines during the 1990s: A Review. Chem. Rev. 2000, 100, 1973–2012. [Google Scholar] [PubMed]
  25. Holm AI, S.; Nielsen, L.M.; Hoffmann, S.V.; Nielsen, S.B. Vacuum-ultraviolet circular dichroism spectroscopy of DNA: A valuable tool to elucidate topology and electronic coupling in DNA. Phys. Chem. Chem. Phys. PCCP 2010, 12, 9581–9596. [Google Scholar] [PubMed]
  26. Olsthoorn CS, M.; Bostelaar, L.J.; Rooij JF, M.; Boom, J.H.; Altona, C. Circular Dichroism Study of Stacking Properties of Oligodeoxyadenylates and Polydeoxyadenylate. A Three-State Conformational Model. Eur. J. Biochem. 1981, 115, 309–321. [Google Scholar] [CrossRef]
  27. Greve, J.; Maestre, M.F.; Levin, A. Circular dichroism of adenine and thymine containing synthetic polynucleotides. Biopolymers 1977, 16, 1489–1504. [Google Scholar]
  28. Brahms, J.; Michelson, A.M.; Van Holde, K.E. Adenylate oligomers in single- and double-strand conformation. J. Mol. Biol. 1966, 15, 467–488. [Google Scholar] [CrossRef]
  29. Nielsen, L.M.; Hoffmann, S.V.; Brøndsted Nielsen, S. Vacuum-ultraviolet circular dichroism reveals DNA duplex formation between short strands of adenine and thymine. Phys. Chem. Chem. Phys. PCCP 2012, 14, 15054–15059. [Google Scholar]
  30. Mamiatis, T.; Fritsch, E.F.; Sambrook, J.; Engel, J. Molecular Cloning–A Laboratory Manual; Cold Spring Harbor Laboratory: New York, NY, USA, 1982; Volume 545, p. 42. [Google Scholar]
  31. Panjkovich, A.; Melo, F. Comparison of different melting temperature calculation methods for short DNA sequences. Bioinformatics 2005, 21, 711–722. [Google Scholar]
  32. Panjkovich, A.; Norambuena, T.; Melo, F. dnaMATE: A consensus melting temperature prediction server for short DNA sequences. Nucleic Acids Res. 2005, 33, W570–W572. [Google Scholar] [CrossRef]
  33. Scheffler, I.E.; Elson, E.L.; Baldwin, R.L. Helix Formation by dAT oligomers. J. Mol. Biol. 1968, 36, 291–304. [Google Scholar] [CrossRef] [PubMed]
  34. Upadhyaya, A.; Kumar, S. Effect of loop sequence on unzipping of short DNA hairpins. Phys. Rev. E 2021, 103, 062411. [Google Scholar] [CrossRef] [PubMed]
  35. Zuker, M. Mfold web server for nucleic acid folding and hybridization prediction. Nucleic Acids Res. 2003, 31, 3406–3415. [Google Scholar] [CrossRef]
  36. Chou, P.-J.; Johnson, W.C. Base inclinations in natural and synthetic DNAs. J. Am. Chem. Soc. 1993, 115, 1205–1214. [Google Scholar] [CrossRef]
  37. Pola, M.; Kochman, M.A.; Picchiotti, A.; Prokhorenko, V.I.; Miller, R.D.; Thorwart, M. Linear photoabsorption spectra and vertical excitation energies of microsolvated DNA nucleobases in aqueous solution. J. Theor. Comput. Chem. 2017, 16, 1750028. [Google Scholar] [CrossRef]
  38. Prokhorenko, V.I.; Picchiotti, A.; Pola, M.; Dijkstra, A.G.; Miller, R.J.D. New Insights into the Photophysics of DNA Nucleobases. J. Phys. Chem. Lett. 2016, 7, 4445–4450. [Google Scholar]
  39. Burin, A.L.; Dickman, J.A.; Uskov, D.B.; Hebbard CF, F.; Schatz, G.C. Optical absorption spectra and monomer interaction in polymers: Investigation of exciton coupling in DNA hairpins. J. Chem. Phys. 2008, 129, 091102. [Google Scholar] [CrossRef]
  40. Kim, I.; Kang, M.; Woo, H.Y.; Oh, J.-W.; Kyhm, K. Solvent-modified ultrafast decay dynamics in conjugated polymer/dye labeled single stranded DNA. In Proceedings of the 2nd International Conference on Nano-Bio Sensing, Imaging, and Spectroscopy (NBSIS 2015), Jeju, Republic of Korea, 25–27 February 2015; Kim, D., Kim, M.-G., Park, S.-H., Eds.; SPIE: Washington, DC, USA, 2015; Volume 95230. [Google Scholar] [CrossRef]
  41. Dai, T.; Xu, M.; Wang, Y.; Yang, G. The Initial Transition Mechanism of DNA Denaturation. SSRN Electron. J. 2021. [Google Scholar] [CrossRef]
  42. Xu, M.; Dai, T.; Wang, Y.; Yang, G. The incipient denaturation mechanism of DNA. RSC Adv. 2022, 12, 23356–23365. [Google Scholar]
Figure 1. Skeletal structural formula of (a) adenine, (b) deoxyadenosine, (c) thymine, and (d) deoxythymidine. Light gray: hydrogen atoms, red: oxygen atoms, dark gray: carbon atoms, and blue: nitrogen atoms.
Spectroscj 03 00011 g001
Figure 2. Normalized at the peak near 260 nm absorption (left) and circular dichroism spectra (right) of (dA)n in 10 mM phosphate buffer, where n is the number of adenosines composing the strand. Absorption and CD spectra of dATP (deoxyadenosine triphosphate) are also included for comparison. The scans were performed at room temperature and at neutral pH.
Spectroscj 03 00011 g002
Figure 3. Peak-normalized absorption (left) and circular dichroism spectra (right) of (dT)n in 10 mM phosphate buffer, where n is the number of bases composing the strand, from 2 to 20. Absorption and CD spectra of dTTP (deoxythymidine triphosphate) are included for comparison. The scans were performed at room temperature and at neutral pH.
Spectroscj 03 00011 g003
Figure 4. Peak-normalized absorption (left) and circular dichroism spectra (right) of (dAT)n in 10 mM phosphate buffer, where n is the number of the couple (AT) composing the strand, from 1 to 10, or a total of 2 to 20 bases. The scans were performed at room temperature and at neutral pH.
Spectroscj 03 00011 g004
Figure 5. Dipole strength of (dA)n, (dT)n, and (dAT)n as a function of the number of nucleobases per ssDNA: adenosines in red circles, thymines in blue diamonds, and green stars for (dAT)n. The symbols correspond to values extracted from experimental data (sum of values from the first and second Gaussian fits) given in Table 1, whereas the line is a linear fit to the data.
Spectroscj 03 00011 g005
Figure 6. Cartoon showing on top the interaction of the monomers (blue dots) only with nearest neighbors and on bottom the interaction of the monomers with also next-to-nearest neighbors. The filled circles represent the monomers.
Spectroscj 03 00011 g006
Figure 7. Concentration-normalized CD values at the first exciton peak subtracted from those at the second exciton peak as a function of the number of adenosines or thymidines in the single-stranded DNA. The employed peaks are noted in the legend (in nm). The y-axis is also referred to in the text as the relative strength of the CD peaks.
Spectroscj 03 00011 g007
Figure 8. Exciton coupling calculated using the equations in the methods section and the experimental absorption and CD spectra of the single-stranded DNA sequences of this study. Red circles are reserved for adenosine, blue diamonds for thymidine homo-oligomers, and green stars for (dAT)n.
Spectroscj 03 00011 g008
Table 1. Various parameters and values for the family (dA)n and (dT)n. The molecular weights (MW) and extinction coefficients at 260 nm (ε260) are given by the manufacturer [18], whereas pH is measured before each experiment. The absorption peak wavelengths (λpeak in nm) are extracted from fits to the experimental absorption spectra, while the sample concentrations (c in μM) and dipole strengths (µ2 in units of Debye squared D2) are calculated from these same spectra. See the text for details of the data extraction and data analysis techniques used.
First GaussianSecond Gaussian
MWε260pHcλpeakμ2λpeakμ2
[g/mol][L/(mol·m)]±0.05[mM]±0.5 nm[D2]±0.5 nm[D2]
dATP61115,1006.8498.7263.37.87249.68.84
(dA)256431,0007.09230.1260.224.04236.826.00
(dA)4119161,0007.05131.2261.040.55240.348.14
(dA)6181792,0007.1194.3258.790.33235.550.03
(dA)82444122,0007.0958.9258.6117.61235.372.72
(dA)103070153,0007.2255.6257.1175.58233.758.36
(dA)154636230,0007.0830.1257.0265.29234.159.07
(dA)206202306,0007.1034.0256.9350.02234.471.27
dTTP60296006.96186.5274.15.13258.48.24
(dT)254619,0006.97469.7272.69.72257.515.87
(dT)4115537,0007.04191.8272.718.71257.630.84
(dT)6176356,0007.11138.8272.528.04257.546.76
(dT)8237274,0007.09104.7272.636.30257.863.91
(dT)10298093,0007.1981.8272.844.68257.879.31
(dT)154501140,0007.0887.5272.765.71257.8116.84
(dT)206022186,0007.1240.5272.588.17257.6157.38
(dAT)55525,0006.98277.3262.722.86233.520.09
(dAT)2117349,0007.13120.2262.646.26238.127.3
(dAT)53025123,0007.0055.4262.8119.16235.482.51
(dAT)106112246,0007.0126.1266.5187.54246.9177.15
Disclaimer/Publisher’s Note: The statements, opinions and data contained in all publications are solely those of the individual author(s) and contributor(s) and not of MDPI and/or the editor(s). MDPI and/or the editor(s) disclaim responsibility for any injury to people or property resulting from any ideas, methods, instructions or products referred to in the content.

