
Relationship Between Visual Marketing Elements and Consumer Satisfaction


Abstract
1. Introduction
2. Literature Review and Hypothesis Development
2.1. Online Shopping Platforms
2.2. Visual Marketing
2.3. Hypothesis Development
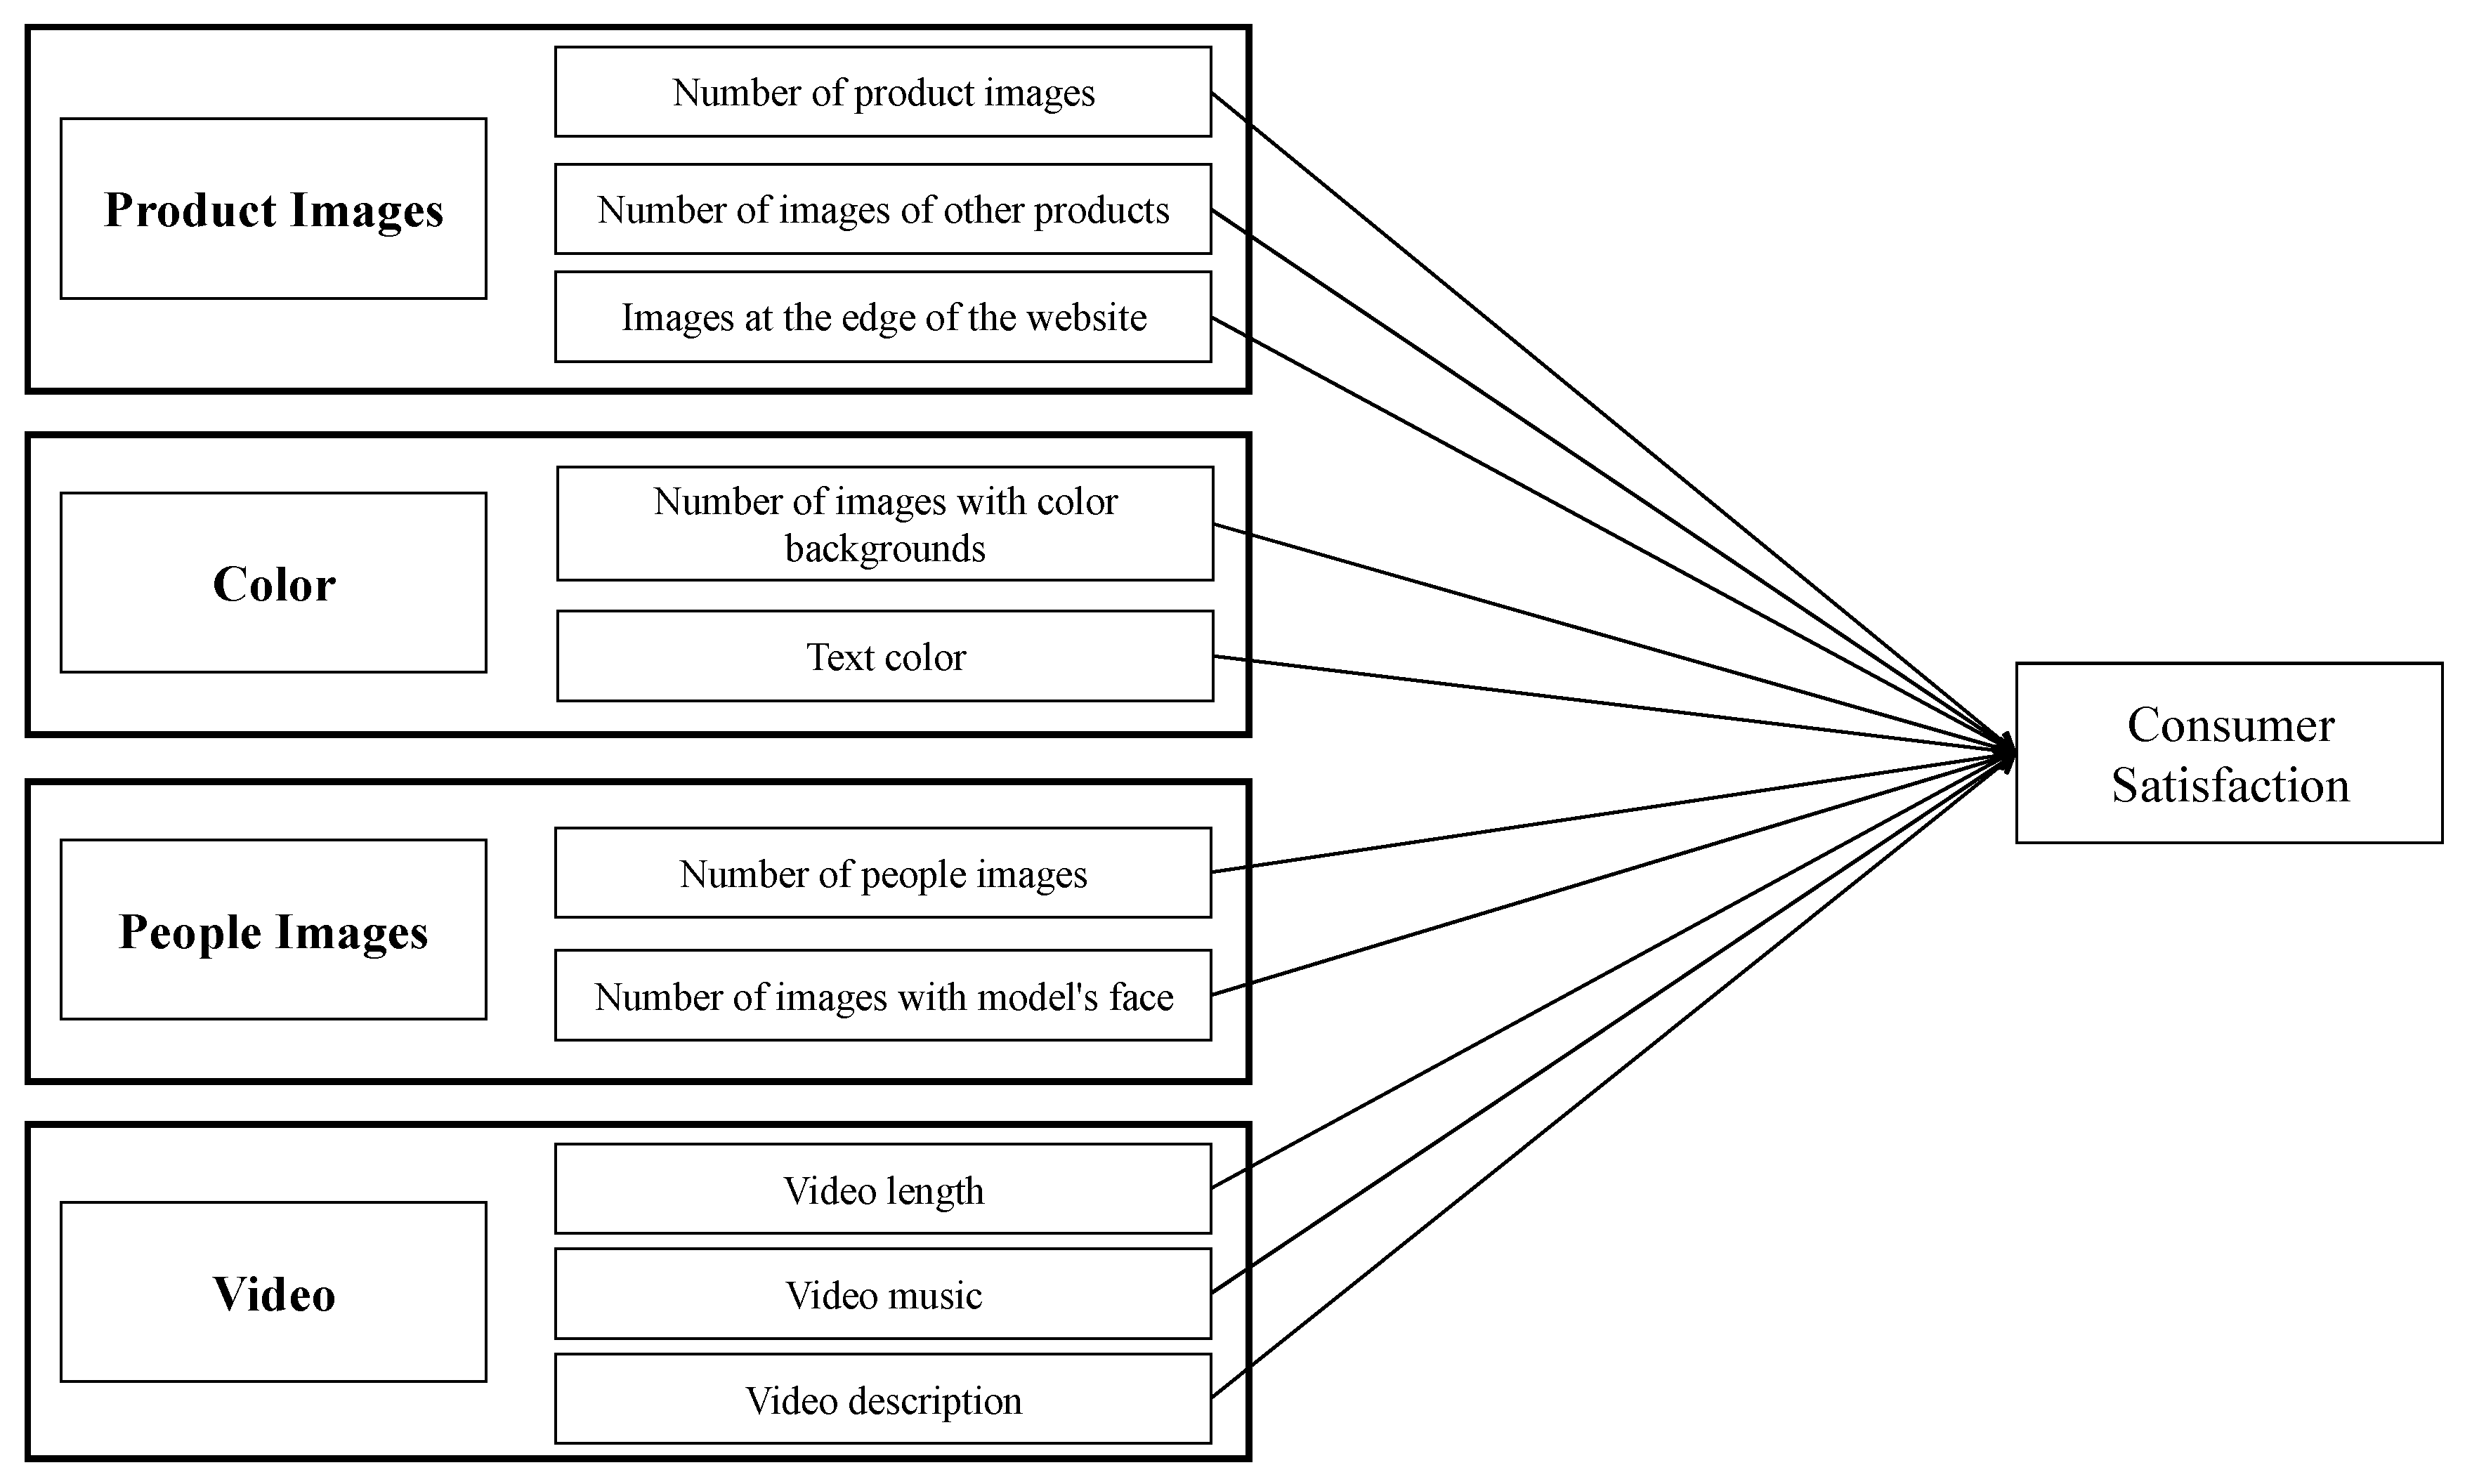
2.3.1. Visual Marketing Element 1: Image Elements
2.3.2. Visual Marketing Element 2: Color Elements
2.3.3. Visual Marketing Element 3: Human Images
2.3.4. Visual Marketing Element 4: Video
3. Research Methodology
3.1. Data Collection
3.2. Dependent Variable
3.3. Explanatory Variables
3.3.1. Visual Marketing Element 1: Images
- Number of product images: This is the number of product photos displayed. This variable is collected by counting the number of photos related to the product on the product page. This variable is referred to as “”.
- Number of other product images: This variable is the number of photos displayed for other products in the same category. This variable is collected by counting the number of photos related to other products. This variable is referred to as “”.
- Images at the edge of the website: This variable concerns whether product images are placed at the edges of the web page. It is used as a dummy variable, with “0” when no images are placed at the edges of the website and “1” when images are placed at the edges. This variable is referred to as “”.
3.3.2. Visual Marketing Element 2: Color
- Proportion of images with multicolored backgrounds: This variable is the proportion of images with multicolored backgrounds. This variable is collected by calculating the proportion of multicolored images out of all product images. This variable is referred to as “”.
- Text color: This variable is the number of font colors used on the website. This variable is collected by counting the types of font colors on the website. This variable is referred to as “”.
3.3.3. Visual Marketing Element 3: Human Images
- Number of human images: This variable is the number of human images (fashion models or food tasting models) displayed on the website. This variable is collected by counting the number of human images on the website. This variable is referred to as “”.
- Proportion of images with visible human faces: This variable is the proportion of photos where human faces are clearly visible on the website. This variable is collected by calculating the proportion of photos where human faces are clearly visible out of all human images. This variable is referred to as “”.
3.3.4. Visual Marketing Element 4: Videos
- Video length: This variable is the duration in seconds of videos displayed on the website. This variable is collected by counting the seconds of videos on the website. The logarithm of this value is used in calculations. This variable is referred to as “”.
- Video music: This variable concerns whether music is added to product videos on the website. It is used as a dummy variable, with “0” when no music is added to the video and “1” when music is added. This variable is referred to as “”.
- Video explanation: This variable concerns whether explanatory text is added to product videos on the website. It is used as a dummy variable, with “0” when no explanation is added to the video and “1” when an explanation is added. This variable is referred to as “”.
3.4. Control Variables
- Number of comments: This should be collected as it may be related to the inherent value of the product. This variable is collected as the number of comments for the product and calculated using logarithms. This variable is referred to as “”.
- Price of each product: Considering that the value of a product may affect consumers’ first impressions, this should be collected as the product price. This variable is collected as the non-discounted price of the product and calculated using logarithms. This variable is referred to as “”.
- Number of store reviews: The number of store reviews is an important factor affecting consumer trust and purchase intention, and needs to be controlled to accurately evaluate the effect of visual marketing elements. This variable is collected as the number of reviews for the store selling the product and calculated using logarithms. This variable is referred to as “”.
- Store score: The overall evaluation of a store may affect the perceived quality of individual products and potentially influence the effect of visual marketing elements. This variable is collected as the score of the store selling the product and calculated using Z-scores. This variable is referred to as “”.
3.5. Analysis Model
4. Results
5. Discussion
5.1. Interpretation of Results
5.2. Theoretical Contributions
5.3. Practical Contributions
5.4. Limitations and Future Research
6. Conclusions
Author Contributions
Funding
Institutional Review Board Statement
Informed Consent Statement
Data Availability Statement
Conflicts of Interest
Appendix A. Analysis of Variance Results for Product Category Differences

| Sum of Squares | Mean Square | F-Statistic (4, 1495) | p-Value | |
|---|---|---|---|---|
| Consumer Satisfaction | 6.90 | 1.726 | 30.27 | <0.001 |
| PicNum | 12,706 | 3177 | 32.8 | <0.001 |
| PicOther | 61,697 | 15,424 | 23.02 | <0.001 |
| PicWeb | 6.0 | 1.506 | 6.704 | <0.001 |
| ColMulti | 46,074 | 11,519 | 61.51 | <0.001 |
| ColWord | 232 | 57.98 | 23.1 | <0.001 |
| HINum | 338 | 84.40 | 33.35 | <0.001 |
| HIFaceNum | 6111 | 1527.8 | 8.345 | <0.001 |
| VideoLenth | 46,402 | 11,601 | 202.5 | <0.001 |
| VideoMusic | 29.2 | 7.312 | 33.46 | <0.001 |
| VideoExplain | 30.2 | 7.539 | 35.03 | <0.001 |
References
- Inoue, Y.; Hashimoto, M. Changes in consumer dynamics on general e-commerce platforms during the COVID-19 pandemic: An exploratory study of the Japanese market. Heliyon 2022, 8, e08867. [Google Scholar] [CrossRef] [PubMed]
- Liu, J.; Li, Z.; Hu, X. A Study of the Impact of Mobile Payment on the Enhancement of Consumption Structure and Pattern of Chinese Rural Households. Agriculture 2023, 13, 2082. [Google Scholar] [CrossRef]
- Cai, S.; Xu, Y. Designing not just for pleasure: Effects of web site aesthetics on consumer shopping value. Int. J. Electron. Commer. 2011, 15, 159–188. [Google Scholar] [CrossRef]
- Wu, W.Y.; Lee, C.L.; Fu, C.S.; Wang, H.C. How can online store layout design and atmosphere influence consumer shopping intention on a website? Int. J. Retail. Distrib. Manag. 2013, 42, 4–24. [Google Scholar] [CrossRef]
- Mummalaneni, V. An empirical investigation of web site characteristics, consumer emotional states and online shopping behaviors. J. Bus. Res. 2005, 58, 526–532. [Google Scholar] [CrossRef]
- Cebi, S. A quality evaluation model for the design quality of online shopping websites. Electron. Commer. Res. Appl. 2013, 12, 124–135. [Google Scholar] [CrossRef]
- Park, J.; Lennon, S.J. Brand Name and Promotion in Online Shopping Contexts. J. Fash. Mark. Manag. 2009, 13, 149–160. [Google Scholar] [CrossRef]
- Eroglu, S.A.; Machleit, K.A.; Davis, L.M. Atmospheric qualities of online retailing: A conceptual model and implications. J. Bus. Res. 2001, 54, 177–184. [Google Scholar] [CrossRef]
- Hu, X.; Liu, J. Research on e-commerce visual marketing analysis based on internet big data. J. Phys. Conf. Ser. 2021, 1865, 042094. [Google Scholar] [CrossRef]
- Bashirzadeh, Y.; Mai, R.; Faure, C. How rich is too rich? Visual design elements in digital marketing communications. Int. J. Res. Mark. 2022, 39, 58–76. [Google Scholar] [CrossRef]
- Marwan, A.; Harkim, H.; Sugiharto, B. The Impact of Visual Marketing on Purchasing Behavior in E-Commerce: A Case Study in The Fashion Industry. Gold. Ratio Data Summ. 2024, 4, 1022–1031. [Google Scholar] [CrossRef]
- Cyr, D.; Head, M.; Ivanov, A. Design aesthetics leading to m-loyalty in mobile commerce. Inf. Manag. 2006, 43, 950–963. [Google Scholar] [CrossRef]
- Labrecque, L.I.; Milne, G.R. Exciting red and competent blue: The importance of color in marketing. J. Acad. Mark. Sci. 2012, 40, 711–727. [Google Scholar] [CrossRef]
- Lavie, T.; Tractinsky, N. Assessing dimensions of perceived visual aesthetics of web sites. Int. J. Hum. Comput. Stud. 2004, 60, 269–298. [Google Scholar] [CrossRef]
- Kim, J.; Lennon, S.J. The Effects of Visual and Verbal Information on Attitudes and Purchase Intentions in Internet Shopping. Psychol. Mark. 2008, 25, 146–178. [Google Scholar] [CrossRef]
- Cyr, D.; Head, M.; Larios, H. Colour appeal in website design within and across cultures: A multi-method evaluation. Int. J. Hum. Comput. Stud. 2010, 68, 1–21. [Google Scholar] [CrossRef]
- Sridhar, S.; Srinivasan, R. Social influence effects in online product ratings. J. Mark. 2012, 76, 70–88. [Google Scholar] [CrossRef]
- Garrett, J.J. The Elements of User Experience: User-Centered Design for the Web and Beyond; New Riders Press: Indianapolis, IN, USA, 2010. [Google Scholar]
- Gehrt, K.C.; Rajan, M.N.; Shainesh, G.; Czerwinski, D.; O’Brien, M. Emergence of online shopping in India: Shopping orientation segments. Int. J. Retail Distrib. Manag. 2012, 40, 742–758. [Google Scholar] [CrossRef]
- Hong, W.; Thong, J.Y.L.; Tam, K.Y. The effects of information format and shopping task on consumers’ online shopping behavior: A cognitive fit perspective. J. Manag. Inf. Syst. 2004, 21, 149–184. [Google Scholar] [CrossRef]
- Dani, N.J. A study on consumers’ attitude towards online shopping. Int. J. Res. Manag. Bus. Stud. 2017, 4, 42–46. [Google Scholar]
- Pieters, R.; Wedel, M. Attention Capture and Transfer in Advertising: Brand, Pictorial, and Text-Size Effects. J. Mark. 2004, 68, 36–50. [Google Scholar] [CrossRef]
- Hassanein, K.; Head, M. Manipulating perceived social presence through the web interface and its impact on attitude towards online shopping. Int. J. Hum. Comput. Stud. 2007, 65, 689–708. [Google Scholar] [CrossRef]
- Li, H.; Daugherty, T.; Biocca, F. Impact of 3-D advertising on product knowledge, brand attitude, and purchase intention: The mediating role of presence. J. Advert. 2002, 31, 43–57. [Google Scholar] [CrossRef]
- Zwass, V. Electronic commerce: Structures and issues. Int. J. Electron. Commer. 1996, 1, 3–23. [Google Scholar]
- Laudon, K.C.; Traver, C.G. E-Commerce 2016: Business, Technology, Society; Pearson: New York, NY, USA, 2016. [Google Scholar]
- Kim, J.; Peterson, R.A. A meta-analysis of online trust relationships in e-commerce. J. Interact. Mark. 2017, 38, 44–54. [Google Scholar] [CrossRef]
- Zhang, M.; Qin, F.; Wang, G.A.; Luo, C. The impact of live video streaming on online purchase intention. Serv. Ind. J. 2019, 40, 656–681. [Google Scholar] [CrossRef]
- Nielsen, J. Designing Web Usability: The Practice of Simplicity; New Riders Publishing: Indianapolis, IN, USA, 2000. [Google Scholar]
- Rosen, D.E.; Purinton, E. Website design: Viewing the web as a cognitive landscape. J. Bus. Res. 2004, 57, 787–794. [Google Scholar] [CrossRef]
- Szymanski, D.M.; Hise, R.T. E-satisfaction: An initial examination. J. Retail. 2000, 76, 309–322. [Google Scholar] [CrossRef]
- Wedel, M.; Pieters, R. Visual Marketing: From Attention to Action; Psychology Press: East Sussex, UK, 2012. [Google Scholar]
- Khachatryan, H.; Rihn, A.; Behe, B.; Hall, C.; Campbell, B.; Dennis, J.; Yue, C. Visual attention, buying impulsiveness, and consumer behavior. Mark. Lett. 2018, 29, 23–35. [Google Scholar] [CrossRef]
- Blanco, C.F.; Sarasa, R.G.; Sanclemente, C.O. Effects of visual and textual information in online product presentations: Looking for the best combination in website design. Eur. J. Inf. Syst. 2010, 19, 668–686. [Google Scholar] [CrossRef]
- Greenberg, E. Branding by Design: The Power of Visual Communication. Des. Manag. J. 2012, 7, 5–14. [Google Scholar]
- Schmitt, B. Experiential Marketing: How to Get Customers to Sense, Feel, Think, Act, and Relate to Your Company and Brands; Free Press: Los Angeles, CA, USA, 1999. [Google Scholar]
- Kahn, B.E. The Shopping Revolution: How Successful Retailers Win Customers in an Era of Endless Disruption; Wharton School Press: Philadelphia, PA, USA, 2017. [Google Scholar]
- Clement, J. Visual Influence on In-store Buying Decisions: An Eye-tracking Experiment on the Visual Influence of Packaging Design. J. Mark. Manag. 2007, 23, 917–928. [Google Scholar] [CrossRef]
- Wedel, M.; Pieters, R. A Review of Eye-Tracking Research in Marketing. Rev. Mark. Res. 2007, 4, 123–147. [Google Scholar]
- Nobbs, K.; Moore, C.; Sheridan, M. The Impact of Visual Merchandising on Consumer Behaviour Towards Non-apparel Products. Eur. J. Mark. 2015, 49, 1326–1350. [Google Scholar]
- Campelo, A.; Aitken, R.; Thyne, M.; Gnoth, J. Sense of Place: The Importance for Destination Branding. J. Travel Res. 2011, 50, 356–370. [Google Scholar] [CrossRef]
- Jones, M.A.; Reynolds, K.E.; Arnold, M.J. Hedonic and Utilitarian Shopping Value: Investigating Differential Effects on Retail Outcomes. J. Bus. Res. 2008, 59, 974–981. [Google Scholar] [CrossRef]
- Ha, Y.; Lennon, S.J. Online visual merchandising (VMD) cues and consumer pleasure and arousal: Purchasing versus browsing situation. Psychol. Mark. 2010, 27, 141–165. [Google Scholar] [CrossRef]
- Ye, H.; Tussyadiah, I.P. Destination Visual Image and Expectation of Experiences. J. Travel Tour. Mark. 2011, 28, 129–144. [Google Scholar] [CrossRef]
- Ang, S.H.; Leong, S.M.; Kotler, P. Marketing: An Asian Perspective; Pearson Education Limited: London, UK, 2014. [Google Scholar]
- Marius, P. The Influence of Visual Merchandising on Consumer Impulse Buying Behavior. J. Int. Bus. Res. 2015, 14, 1–16. [Google Scholar]
- Manganari, E.E.; Siomkos, G.J.; Vrechopoulos, A.P. Store atmosphere in web retailing. Eur. J. Mark. 2009, 43, 1140–1153. [Google Scholar] [CrossRef]
- Belk, R.W. Possessions and the Extended Self. J. Consum. Res. 1988, 15, 139–168. [Google Scholar] [CrossRef]
- Tractinsky, N.; Lowengart, O. Web-store aesthetics in e-retailing: A conceptual framework and some theoretical implications. Acad. Mark. Sci. Rev. 2007, 11, 1–18. [Google Scholar]
- Lamberton, C.; Diehl, K. Retail Choice Architecture: The Effects of Benefit- and Attribute-Based Assortment Organization on Consumer Perceptions and Choice. J. Consum. Res. 2013, 40, 393–411. [Google Scholar] [CrossRef]
- Janiszewski, C. The Influence of Display Characteristics on Visual Exploratory Search Behavior. J. Consum. Res. 1998, 25, 290–301. [Google Scholar] [CrossRef]
- Kumar, A.; Bezawada, R.; Trivedi, M. The effects of multichannel shopping on customer spending, satisfaction, and retention. J. Mark. Res. 2019, 56, 936–956. [Google Scholar]
- Jiang, Z.; Benbasat, I. The effects of presentation formats and task complexity on online consumers’ product understanding. MIS Q. 2007, 31, 475–500. [Google Scholar] [CrossRef]
- Suh, K.S.; Chang, S. User interfaces and consumer perceptions of online stores: The role of telepresence. Behav. Inf. Technol. 2006, 25, 99–113. [Google Scholar] [CrossRef]
- Adriatico, J.M.; Cruz, A.; Tiong, R.C.; Racho-Sabugo, C.R. An analysis on the impact of choice overload to consumer decision paralysis. J. Econ. Financ. Account. Stud. 2022, 4, 55–75. [Google Scholar] [CrossRef]
- Iyengar, S.S.; Lepper, M.R. When choice is demotivating: Can one desire too much of a good thing? J. Personal. Soc. Psychol. 2000, 79, 995–1006. [Google Scholar] [CrossRef]
- Fasolo, B.; McClelland, G.H.; Todd, P.M. Escaping the tyranny of choice: When fewer attributes make choice easier. Mark. Theory 2007, 7, 13–26. [Google Scholar] [CrossRef]
- Chernev, A. When more is less and less is more: The role of ideal point availability and assortment in consumer choice. J. Consum. Res. 2003, 30, 170–183. [Google Scholar] [CrossRef]
- Diehl, K.; Poynor, C. Great expectations?! Assortment size, expectations, and satisfaction. J. Mark. Res. 2010, 47, 312–322. [Google Scholar] [CrossRef]
- Adaval, R.; Saluja, G.; Jiang, Y. Seeing and thinking in pictures: A review of visual information processing. Consum. Psychol. Rev. 2019, 2, 50–69. [Google Scholar] [CrossRef]
- McCoy, S.; Everard, A.; Polak, P.; Galletta, D.F. The effects of online advertising. Commun. ACM 2007, 50, 84–88. [Google Scholar] [CrossRef]
- Nadkarni, S.; Gupta, R. A task-based model of perceived website complexity. MIS Q. 2007, 31, 501–524. [Google Scholar] [CrossRef]
- Burke, M.; Hornof, A.; Nilsen, E.; Gorman, N. High-cost banner blindness: Ads increase perceived workload, hinder visual search, and are forgotten. ACM Trans. Comput. Hum. Interact. 2005, 12, 423–445. [Google Scholar] [CrossRef]
- Shahrzadi, L.; Mansouri, A.; Alavi, M.; Shabani, A. Causes, consequences, and strategies to deal with information overload: A scoping review. Int. J. Inf. Manag. Data Insights 2024, 4, 100261. [Google Scholar] [CrossRef]
- Tuch, A.N.; Bargas-Avila, J.A.; Opwis, K.; Wilhelm, F.H. Visual complexity of websites: Effects on users’ experience, physiology, performance and memory. Int. J. Hum. Comput. Stud. 2009, 67, 703–715. [Google Scholar] [CrossRef]
- Henderson, P.W.; Giese, J.L.; Cote, J.A. Impression Management Using Typeface Design. J. Mark. 2004, 68, 60–72. [Google Scholar] [CrossRef]
- Vatananan-Thesenvitz, R. Color Psychology and Its Application in Workplace Design for Better Work Satisfaction: A Bibliometric Quantitative Analysis on Publication About the Field; Bangkok University: Bangkok, Thailand, 2024. [Google Scholar]
- Khrouf, L.; Frikha, A. Websites’ hue-context congruence as a vector of trust and behavioral intentions. Int. J. Emerg. Mark. 2023, 18, 1515–1536. [Google Scholar] [CrossRef]
- Lazar, J.; Bessiere, K.; Ceaparu, I.; Robinson, J.; Shneiderman, B. Help! I’m Lost: User Frustration in Web Navigation. IT Soc. 2003, 1, 18–26. [Google Scholar]
- Van Rompay, T.J.; Pruyn, A.T. When visual product features speak the same language: Effects of shape-typeface congruence on brand perception and price expectations. J. Prod. Innov. Manag. 2011, 28, 599–610. [Google Scholar] [CrossRef]
- Lurie, N.H.; Mason, C.H. Visual representation: Implications for decision making. J. Mark. 2007, 71, 160–177. [Google Scholar] [CrossRef]
- Hall, R.H.; Hanna, P. The impact of web page text-background colour combinations on readability, retention, aesthetics and behavioural intention. Behav. Inf. Technol. 2004, 23, 183–195. [Google Scholar] [CrossRef]
- Bonnardel, N.; Piolat, A.; Bloch, P.H. Seeking the ideal form: Product design and consumer response. J. Mark. 1995, 59, 16–29. [Google Scholar]
- Jin, C.; Yoon, M.; Lee, J. The influence of brand color identity on brand association and loyalty. J. Prod. Brand Manag. 2019, 28, 50–62. [Google Scholar] [CrossRef]
- Dzulkifli, M.A.; Mustafar, M.F. The influence of colour on memory performance: A review. Malays. J. Med. Sci. MJMS 2013, 20, 3–9. [Google Scholar]
- Bagozzi, R.P.; Gopinath, M.; Nyer, P.U. The role of emotions in marketing. J. Acad. Mark. Sci. 1999, 27, 184–206. [Google Scholar] [CrossRef]
- Aaker, D.A.; Stayman, D.M.; Hagerty, M.R. Warmth in advertising: Measurement, impact and sequence effects. J. Consum. Res. 1986, 12, 365–381. [Google Scholar] [CrossRef]
- Then, N.K.; DeLong, M.R. Apparel shopping on the web. J. Fam. Consum. Sci. 1999, 91, 65–68. [Google Scholar]
- Boardman, R.; McCormick, H. The impact of product presentation on decision-making and purchasing. Qual. Mark. Res. 2019, 22, 365–380. [Google Scholar] [CrossRef]
- Shuqair, S.; Filieri, R.; Viglia, G.; Mattila, A.S.; Costa Pinto, D. Leveraging online selling through social media influencers. J. Bus. Res. 2024, 171, 114391. [Google Scholar] [CrossRef]
- Poirier, S.-M.; Cosby, S.; Sénécal, S.; Coursaris, C.K.; Fredette, M.; Léger, P.-M. The impact of social presence cues in social media product photos on consumers’ purchase intentions. J. Bus. Res. 2024, 185, 114932. [Google Scholar] [CrossRef]
- Denghua, Y.; Lidan, G. Para-social interaction in social media and its marketing effectiveness. Foreign Econ. Manag. 2020, 42, 21–35. [Google Scholar]
- Cheng, F.F.; Wu, C.S.; Yen, D.C. The effect of online store atmosphere on consumer’s emotional responses—An experimental study of music and colour. Behav. Inf. Technol. 2009, 28, 323–334. [Google Scholar] [CrossRef]
- Xu, P.; Chen, L.; Santhanam, R. Will video be the next generation of e-commerce product reviews? Presentation format and the role of product type. Decis. Support Syst. 2015, 73, 85–96. [Google Scholar] [CrossRef]
- Choi, Y.K.; Taylor, C.R. How do 3-dimensional images promote products on the Internet? J. Bus. Res. 2014, 67, 2164–2170. [Google Scholar] [CrossRef]
- Zhai, L.; Yin, P.; Li, C.; Wang, J.; Yang, M. Investigating the effects of video-based E-word-of-mouth on consumers’ purchase intention: The moderating role of involvement. Sustainability 2022, 14, 9522. [Google Scholar] [CrossRef]
- Li, H.; Lo, H.Y. Do you recognize its brand? The effectiveness of online in-stream video advertisements. J. Advert. 2015, 44, 208–218. [Google Scholar] [CrossRef]
- Jain, R.; Bagdare, S. Music and consumption experience: A review. Int. J. Retail Distrib. Manag. 2011, 39, 289–302. [Google Scholar] [CrossRef]
- Oakes, S. Evaluating empirical research into music in advertising: A congruity perspective. J. Advert. Res. 2007, 47, 38–50. [Google Scholar] [CrossRef]
- Raja, M.W.; Anand, S.; Allan, D. Advertising music: An alternative atmospheric stimulus to retail music. Int. J. Retail Distrib. Manag. 2019, 47, 872–892. [Google Scholar] [CrossRef]
- Hwang, A.H.-C.; Oh, J.; Scheinbaum, A.C. Interactive music for multisensory e-commerce: The moderating role of online consumer involvement in experiential value, cognitive value, and purchase intention. Psychol. Mark. 2020, 37, 1031–1056. [Google Scholar] [CrossRef]
- Weathers, D.; Sharma, S.; Wood, S.L. Effects of online communication practices on consumer perceptions of performance uncertainty for search and experience goods. J. Retail. 2007, 83, 393–401. [Google Scholar] [CrossRef]
- Roy, O. Guide To Creating High Conversion Video Ads. Advids. 15 September 2024. Available online: https://advids.co/content/high-conversion-video-ads (accessed on 10 January 2025).
- Du, L.; Tang, X.; Wang, J. Different types of textual cues in educational animations: Effect on science learning outcomes, cognitive load, and self-efficacy among elementary students. Educ. Inf. Technol. 2024, 30, 3573–3596. [Google Scholar] [CrossRef]
- Luo, J.; Ba, S.; Zhang, H. The effectiveness of online shopping characteristics and well-designed websites on satisfaction. MIS Q. 2012, 36, 1131–1144. [Google Scholar] [CrossRef]
- Mudambi, S.M.; Schuff, D. What makes a helpful online review? A study of customer reviews on Amazon.com. MIS Q. 2010, 34, 185–200. [Google Scholar] [CrossRef]
- Zeithaml, V.A. Consumer perceptions of price, quality, and value: A means-end model and synthesis of evidence. J. Mark. 1988, 52, 2–22. [Google Scholar] [CrossRef]
- Silva, T.S.; Giraldi, J.d.M.E. The influence of store image on customer satisfaction: A case study of a shoe store. Braz. Bus. Rev. 2010, 7, 60–77. [Google Scholar] [CrossRef]
- Zhao, H.; Yao, X.; Liu, Z.; Yang, Q. Impact of pricing and product information on consumer buying behavior with customer satisfaction in a mediating role. Front. Psychol. 2021, 12, 720151. [Google Scholar] [CrossRef]
- Peck, J.; Childers, T.L. Individual differences in haptic information processing: The “need for touch” scale. J. Consum. Res. 2003, 30, 430–442. [Google Scholar] [CrossRef]
- Madden, T.J.; Hewett, K.; Roth, M.S. Managing images in different cultures: A cross-national study of color meanings and preferences. J. Int. Mark. 2000, 8, 90–107. [Google Scholar] [CrossRef]
- Bower, A.B.; Landreth, S. Is beauty best? Highly versus normally attractive models in advertising. J. Advert. 2001, 30, 1–12. [Google Scholar] [CrossRef]
- Deng, L.; Poole, M.S. Affect in web interfaces: A study of the impacts of web page visual complexity and order. MIS Q. 2010, 34, 711–730. [Google Scholar] [CrossRef]
- Pieters, R.; Wedel, M.; Batra, R. The stopping power of advertising: Measures and effects of visual complexity. J. Mark. 2010, 74, 48–60. [Google Scholar] [CrossRef]
- Putrevu, S.; Tan, J.; Lord, K.R. Consumer responses to complex advertisements: The moderating role of need for cognition, knowledge, and gender. J. Curr. Issues Res. Advert. 2004, 26, 9–24. [Google Scholar] [CrossRef]
| Food | Furniture | Home Appliances | Accessories | Apparel | |
|---|---|---|---|---|---|
| Average Price | 4538.94 | 10,032.887 | 11,483.847 | 4514.62 | 3566.3 |
| Maximum Price | 32,400 | 128,000 | 96,800 | 49,500 | 24,200 |
| Minimum Price | 216 | 110 | 302 | 399 | 539 |
| Price Standard Deviation | 5089.418 | 11,982.851 | 13,436.681 | 6264.610 | 3373.040 |
| Average Number of Comments | 3098.07 | 1355.89 | 1070.673 | 1839.563 | 1591.29 |
| Maximum Number of Comments | 70,921 | 45,506 | 29,719 | 102,499 | 54,376 |
| Minimum Number of Comments | 216 | 110 | 302 | 399 | 539 |
| Number of Comments Standard Deviation | 8632.108 | 4144.402 | 2499.896 | 6799.834 | 4324.636 |
| Average Rating | 4.508 | 4.370 | 4.37 | 4.394 | 4.299 |
| Maximum Rating | 4.91 | 4.87 | 4.97 | 4.83 | 4.86 |
| Minimum Rating | 3.98 | 3.42 | 3.4 | 3.5 | 3.14 |
| Rating Standard Deviation | 0.215 | 0.253 | 0.218 | 0.239 | 0.271 |
| 1 | 2 | 3 | 4 | 5 | 6 | 7 | 8 | 9 | 10 | 11 | |
|---|---|---|---|---|---|---|---|---|---|---|---|
| 1. | |||||||||||
| 2. | −0.038 | ||||||||||
| 3. | 0.018 | −0.012 | |||||||||
| 4. | 0.041 | −0.030 | −0.007 | ||||||||
| 5. | −0.235 | 0.111 | 0.021 | 0.029 | |||||||
| 6. | 0.030 | −0.065 | −0.031 | 0.111 | −0.079 | ||||||
| 7. | −0.121 | 0.049 | 0.070 | −0.039 | 0.163 | −0.048 | |||||
| 8. | −0.052 | −0.016 | 0.044 | −0.015 | 0.107 | 0.033 | 0.060 | ||||
| 9. | −0.076 | 0.030 | 0.025 | 0.080 | −0.017 | 0.057 | 0.053 | −0.005 | |||
| 10. | 0.049 | −0.054 | −0.104 | −0.030 | −0.135 | 0.016 | −0.063 | 0.008 | 0.085 | ||
| 11. | −0.026 | 0.027 | −0.048 | −0.023 | 0.098 | 0.062 | −0.070 | −0.075 | −0.160 | −0.111 |
| Mean | Standard Deviation | Maximum | Minimum | |
|---|---|---|---|---|
| 1. | 4.388 | 0.248 | 4.970 | 3.140 |
| 2. | 30.421 | 10.247 | 66.000 | 2.000 |
| 3. | 28.887 | 26.624 | 166.000 | 3.000 |
| 4. | 0.649 | 0.477 | 1.000 | 0.000 |
| 5. | 0.491 | 0.138 | 0.891 | 0.112 |
| 6. | 5.173 | 1.630 | 9.000 | 2.000 |
| 7. | 4.165 | 1.658 | 9.000 | 1.000 |
| 8. | 0.505 | 0.137 | 0.867 | 0.162 |
| 9. | 23.541 | 9.382 | 65.000 | 10.000 |
| 10. | 0.613 | 0.487 | 1.000 | 0.000 |
| 11. | 0.624 | 0.484 | 1.000 | 0.000 |
| Furniture Products | Food Products | Home Appliance Products | Accessory Products | Apparel Products | All Products | |
|---|---|---|---|---|---|---|
| Estimate (Std. Error) | Estimate (Std. Error) | Estimate (Std. Error) | Estimate (Std. Error) | Estimate (Std. Error) | Estimate (Std. Error) | |
| PicNum | 0.013 † (0.007) | 0.000 (0.007) | −0.003 (0.007) | −0.006 (0.006) | 0.010 (0.009) | −0.004 † (0.001) |
| PicOther | −0.003 (0.016) | −0.020 (0.019) | −0.005 (0.015) | 0.013 (0.017) | 0.012 (0.016) | −0.000 (0.000) |
| PicWeb | 0.054 † (0.029) | −0.040 (0.025) | 0.019 (0.024) | −0.056 * (0.026) | −0.001 (0.026) | 0.005 (0.011) |
| ColMulti | −0.034 (0.098) | −0.168 (0.103) | 0.096 (0.067) | 0.164 † (0.097) | 0.003 (0.078) | −0.001 (0.000) |
| ColWord | 0.001 (0.007) | 0.023 * (0.010) | 0.021 *** (0.006) | 0.007 (0.007) | −0.017 * (0.007) | 0.005 (0.003) |
| HINum | −0.001 (0.001) | 0.002 (0.001) | −0.002 * (0.001) | −0.011 *** (0.001) | −0.005 ** (0.002) | 0.006 † (0.003) |
| HIFaceNum | 0.176 * (0.086) | 0.081 (0.088) | −0.064 (0.080) | 0.038 (0.106) | 0.007 (0.079) | 0.000 (0.000) |
| VideoLenth | 0.014 (0.036) | 0.055 (0.061) | −0.046 (0.037) | −0.054 (0.037) | −0.078 † (0.046) | −0.015 (0.015) |
| VideoMusic | −0.008 (0.027) | −0.029 (0.027) | −0.056 * (0.023) | −0.084 *** (0.024) | 0.056 † (0.029) | −0.002 (0.011) |
| VideoExplain | 0.054 * (0.026) | −0.060 † (0.035) | 0.062 *** (0.024) | −0.029 (0.022) | 0.026 (0.029) | 0.021 † (0.012) |
| SellNum | 0.036 *** (0.011) | −0.007 (0.008) | −0.002 (0.009) | 0.009 (0.009) | 0.015 (0.009) | 0.013 ** (0.004) |
| Price | 0.002 (0.014) | 0.055 *** (0.015) | 0.047 *** (0.011) | 0.046 *** (0.01) | 0.076 *** (0.018) | 0.045 *** (0.006) |
| ReviewNum | 0.834 *** (0.082) | 0.593 *** (0.079) | 0.800 *** (0.076) | 0.885 *** (0.114) | 0.814 *** (0.080) | 0.755 *** (0.035) |
| ShopPoint | −0.034 *** (0.009) | 0.008 (0.011) | 0.003 (0.009) | −0.051 *** (0.009) | −0.019 † (0.011) | 0.022 *** (0.004) |
| Intercept | 0.478 (0.473) | 1.160 * (0.491) | 0.369 (0.376) | 0.835 * (0.587) | 0.366 (0.436) | 0.784 *** (0.193) |
| Adjusted R squared | 0.354 | 0.202 | 0.387 | 0.436 | 0.437 | 0.321 |
| Furniture Products | Food Products | Home Appliance Products | Accessory Products | Apparel Products | Summary | |
|---|---|---|---|---|---|---|
| H1: Number of product images ~Consumer satisfaction | - | - | - | - | - | Rejected |
| H2: Number of other product images~Consumer satisfaction | - | - | - | - | - | Rejected |
| H3: Images at the edge of the website–Consumer satisfaction | - | - | - | Supported | - | Partially Supported |
| H4: Proportion of images with multicolored backgrounds~Consumer satisfaction | - | - | - | - | - | Rejected |
| H5: Text color diversity~Consumer satisfaction | - | Supported | Supported | - | Not supported (reverse) | Conditionally Supported |
| H6: Number of human images~Consumer satisfaction | - | - | Not supported (reverse) | Not supported (reverse) | Not supported (reverse) | Reversed |
| H7: Proportion of images with visible human faces~Consumer satisfaction | Supported | - | - | - | - | Partially Supported |
| H8: Video length~Consumer satisfaction | - | - | - | - | - | Rejected |
| H9: Video music~Consumer satisfaction | - | - | Not supported (reverse) | - | - | Reversed |
| H10: Video explanation~Consumer satisfaction | Supported | - | Supported | - | - | Partially Supported |
Disclaimer/Publisher’s Note: The statements, opinions and data contained in all publications are solely those of the individual author(s) and contributor(s) and not of MDPI and/or the editor(s). MDPI and/or the editor(s) disclaim responsibility for any injury to people or property resulting from any ideas, methods, instructions or products referred to in the content. |
© 2025 by the authors. Licensee MDPI, Basel, Switzerland. This article is an open access article distributed under the terms and conditions of the Creative Commons Attribution (CC BY) license (https://creativecommons.org/licenses/by/4.0/).
Share and Cite
Tang, R.; Cui, X.; Inoue, Y. Relationship Between Visual Marketing Elements and Consumer Satisfaction. Platforms 2025, 3, 5. https://doi.org/10.3390/platforms3010005
Tang R, Cui X, Inoue Y. Relationship Between Visual Marketing Elements and Consumer Satisfaction. Platforms. 2025; 3(1):5. https://doi.org/10.3390/platforms3010005
Chicago/Turabian StyleTang, Ruiyang, Xuanzhen Cui, and Yuki Inoue. 2025. "Relationship Between Visual Marketing Elements and Consumer Satisfaction" Platforms 3, no. 1: 5. https://doi.org/10.3390/platforms3010005
APA StyleTang, R., Cui, X., & Inoue, Y. (2025). Relationship Between Visual Marketing Elements and Consumer Satisfaction. Platforms, 3(1), 5. https://doi.org/10.3390/platforms3010005