Article

Simulation of Plasma Level Changes in Cerivastatin and Its Metabolites, Particularly Cerivastatin Lactone, Induced by Coadministration with CYP2C8 Inhibitor Gemfibrozil, CYP3A4 Inhibitor Itraconazole, or Both, Using the Metabolite-Linked Model

Pre-Formulation Department, Pharmaceutical Research and Technology Unit, R & D Division, Towa Pharmaceutical Co., Ltd., 32-8 KuwazaiShinmachi, Kadoma-shi 571-9935, Japan
Drugs Drug Candidates 2025, 4(3), 34; https://doi.org/10.3390/ddc4030034
Submission received: 8 March 2025 / Revised: 30 June 2025 / Accepted: 1 July 2025 / Published: 4 July 2025
(This article belongs to the Section Marketed Drugs)

Abstract

Background/Objective: Cerivastatin (Cer), a cholesterol-lowering statin, was withdrawn from the market due to fatal cases of rhabdomyolysis, particularly when co-administered with gemfibrozil (Gem), a strong CYP2C8 inhibitor. However, the pharmacokinetic (PK) mechanisms underlying these adverse events remain unclear. This study investigates the impact of drug–drug interactions (DDIs) involving Gem and itraconazole (Itr), a potent CYP3A4 inhibitor, on plasma concentrations of Cer and its major metabolites—M23, M1, and cerivastatin lactone (Cer-L)—with a focus on the risk of excessive Cer-L accumulation. Methods: We applied a newly developed Metabolite-Linked Model that simultaneously characterizes parent drug and metabolite kinetics by estimating metabolite formation fractions (fM) and elimination rate constants (KeM). The model was calibrated using observed DDI data from Cer + Gem and Cer + Itr scenarios and then used to predict outcomes in an untested Cer + Gem + Itr combination. Results: The model accurately reproduced observed metabolite profiles in single-inhibitor DDIs. Predicted AUCR values for Cer-L were 4.2 (Cer + Gem) and 2.1 (Cer + Itr), with reduced KeM indicating CYP2C8 and CYP3A4 as primary elimination pathways. In the dual-inhibitor scenario, Cer-L AUCR reached ~70—far exceeding that of the parent drug—suggesting severe clearance impairment and toxic accumulation. Conclusions: Dual inhibition of CYP2C8 and CYP3A4 may cause dangerously elevated Cer-L levels, contributing to Cer-associated rhabdomyolysis. This modeling approach offers a powerful framework for evaluating DDI risks involving active or toxic metabolites, supporting safer drug development and regulatory assessment.

Graphical Abstract

1. Introduction

Predicting drug–drug interactions (DDIs) early in the drug development process is critical for avoiding adverse clinical outcomes caused by co-administration of incompatible therapies. To support this goal, we have been developing a systematic approach for predicting DDIs arising from enzyme inhibition, initially focusing on changes in parent drug plasma levels using a simplified, compartment model-assisted pharmacokinetic (PK) framework [1,2,3,4,5,6]. This method has since been extended to include metabolite dynamics through a “Metabolite-Linked Model”, which allows simultaneous simulation of both parent drug and metabolite concentrations based on mechanistic formation and elimination pathways.
In the present study, we apply this approach to investigate the atypical PKs of cerivastatin (Cer), a cholesterol-lowering statin that was withdrawn from the market in the early 2000s following numerous reports of fatal rhabdomyolysis ([7,8], Supplementary Material SM1). While these adverse events have been primarily attributed to increased Cer plasma levels due to co-administration with gemfibrozil (Gem)—a strong CYP2C8 inhibitor—the mechanistic basis for the severity of the interactions has not been fully elucidated.
Cer is metabolized by multiple enzymes, predominantly CYP2C8, with contributions from CYP3A4 and UGT enzymes [9,10,11]. Gem is known to increase Cer exposure significantly (AUCR ≈ 5) and is considered the primary perpetrator in the Cer–Gem interaction [11]. However, clinical studies of Gem–Cer combinations in hyperlipidemic patients and dose-escalation trials have not consistently shown adverse effects proportional to this increase in Cer levels [12,13,14]. Though additional inhibition of hepatic uptake by OATP1B1 has been proposed as a contributing factor [15,16], Gem’s inhibitory potency toward OATP1B1 is relatively weak in vitro ([17,18,19], Supplementary Material SM2). Similarly, Cer is a minor substrate of CYP3A4, and co-administration with itraconazole (Itr), a potent CYP3A4 inhibitor, produces only a modest increase in Cer exposure (AUCR ≈ 1.1) [20].
Despite the absence of direct clinical studies evaluating the PK interaction of Cer when co-administered with both Gem and Itr—a combination that results in dual inhibition of CYP2C8 and CYP3A4—it is hypothesized that such co-administration could substantially increase the systemic exposure of Cer and its metabolites. This hypothesis is illustrated in Figure 1, which synthesizes current knowledge of Cer’s metabolic pathways with preliminary PK analyses from observed DDIs involving Gem and Itr [see Supplementary Material (SM3)].
Cer is primarily metabolized by CYP2C8, CYP3A4, and UGT enzymes into three major metabolites: M23, M1, and Cer-G2 (the acyl glucuronide form of Cer) [21,22]. Cer-G2 is known to undergo rapid conversion to the lactone metabolite Cer-L [23,24]. Inhibition of both CYP2C8 and CYP3A4 may disrupt these pathways, potentially leading to elevated Cer concentrations and altered metabolite profiles.
Although Cer-L undergoes pH-dependent hydrolysis in vitro [25,26], it remains stable in plasma at physiological pH (7.4), with an approximate half-life of one day. Notably, Cer-L has been linked to statin-associated muscle toxicity through paraoxonase (PON)-dependent hydrolysis in peripheral tissues [27,28]. This mechanism is also suspected to play a role in cases of rhabdomyolysis observed in patients [10,29].
We hypothesize that in the presence of both Gem and Itr, the elimination of Cer-L is severely impaired, leading to a “metabolic dead-end” and a potentially toxic buildup of Cer-L in circulation. This scenario is supported by analogous findings from other DDI studies involving dual CYP2C8/3A4 inhibition [30,31,32]. For example, in the case of repaglinide [31], co-administration with Gem and Itr led to more than a 20-fold increase in exposure to the parent drug, along with substantial increases in metabolite concentrations.
Based on this rationale, the present study had two main objectives. First, we aimed to characterize the PK behavior of Cer and its major metabolites under single-inhibitor DDI conditions (Cer + Gem, Cer + Itr) by estimating the metabolite formation fraction (fM) and elimination rate constant (KeM) for each species. Second, using these derived parameters, we predicted the plasma concentration-time profiles of Cer and its metabolites under a hypothetical but plausible dual-inhibitor scenario (Cer + Gem + Itr). In particular, we sought to determine whether Cer-L could reach abnormally elevated plasma levels under combined CYP inhibition, thereby providing a mechanistic explanation for Cer-associated toxicity and highlighting the clinical importance of including metabolite kinetics in DDI risk assessments.

2. Theory

2.1. Magnitude of DDI: AUCR and Overall Inhibitory Activity

The magnitude of DDIs is commonly quantified using the area under the plasma concentration–time curve ratio (AUCR), which reflects the change in exposure of the victim drug due to the presence of a perpetrator drug. According to the tube-based hepatic extraction model [1,2], AUCR is governed by the hepatic availability (Fh) of the victim drug and the overall inhibitory activity of the perpetrator, denoted as Ai,overall.
1 A i , o v e r a l l = L n A U C R L n A U C R 1 + 1 F h L n F h
The parameter Ai,overall captures the cumulative inhibitory impact of the perpetrator on all relevant elimination pathways for the victim drug. The mechanistic basis of this inhibition is elaborated in the following sections.

2.2. UGT–CYP2C8 Interplay Model

Cer, a substrate of CYP2C8, undergoes metabolic clearance through both oxidative metabolism by CYP2C8 and conjugation by UGT enzymes. The dynamic interplay between these pathways can be perturbed by co-administered drugs such as Gem and Itr.
Gem acts as a dual inhibitor: it competitively inhibits UGT-mediated conjugation and also inhibits CYP2C8 through a non-competitive mechanism, primarily via its acyl glucuronide metabolite (Gem-O-glu). In contrast, Itr selectively inhibits CYP3A4, and its effect lies outside of the UGT–CYP2C8 axis [Supplementary Material (SM4)].

2.3. Mechanistic Expression for Ai,overall in the UGT–CYP2C8 Model

To quantify the inhibitory effects of DDIs on Cer clearance, the Ai,overall is calculated as a weighted sum of the individual inhibitory contributions of each pathway:
1 A i , o v e r a l l = f m , C Y P 3 A 4 p A i , C Y P 3 A 4 + f m , U G T + f m , C Y P 2 C 8 p A i , C Y P 2 C 8 p A i , U G T d
fm,CYP: Fractional metabolic contribution of each CYP isoform.
pAi,CYP3A4, pAi,CYP2C8, and pAi,UGT(d): Pathway-specific inhibition terms, defined by the relationship, pAi = 1 + [Iu]/Ki,u, where [Iu] is the unbound inhibitor concentration and Ki,u is the unbound inhibition constant. These values are derived from in vitro experiments and detailed in Supplementary Material (SM5). The following parameter values were used in this study:
Itr (200 mg QD): pAi,CYP3A4 = 10; pAi,CYP2C8 = pAi,UGT(d) = 1;
Gem(600 mg BID): pAi,CYP2C8 = 16; pAi,UGT(d) = 2; pAi,CYP3A4 = 1.

2.4. Static 2-Compartment Model for Parent Drug Simulation

For simulating plasma concentration–time profiles of Cer, a simplified static 2-compartment model was employed [3,4,5]. Although perpetrator concentrations vary over time in vivo, we assume a constant Ai,overall to facilitate static simulations. This assumption simplifies modeling without significantly compromising accuracy. Further model specifications are provided in Supplementary Material (SM6).

2.5. Metabolite-Linked Model for Time-Dependent Metabolite Levels

To simulate metabolite concentrations over time, we applied a metabolite-linked model that considers both first-pass and systemic formation of the metabolite (M) [Supplementary Material (SM7)]. The total metabolite concentration in plasma, Cp,M(t), is the sum of two components:
Cp,M(1)(t): Metabolite formed during first-pass metabolism;
Cp,M(2)(t): Metabolite formed in systemic circulation.
Each is calculated using convolution integrals involving:
fM: The fraction of parent drug converted to metabolite;
dInput(T)/dT: Absorption rate of parent drug;
Fh,M(eff): Effective hepatic availability of metabolite, defined as 1 − Eh,M × α (with α = 0.6);
GM(t): Response function after IV bolus of the metabolite.
We assumed the metabolite shares the same distribution parameters as the parent drug. Integration of Cp,M(t) over time gives the metabolite AUC, from which the DDI impact on metabolite exposure, AUCR(M).

3. Results

3.1. Simulated Cp(t) and Cp(t)(+) in Cer + Gem and Cer + Itr DDIs, PK Parameters for Cer, and Ai,overall

Figure 2 shows the simulated plasma concentration profiles of Cer for the Cer + Gem and Cer + Itr DDI scenarios. The corresponding PK parameters, both in the presence and absence of perpetrators (Gem or Itr), are summarized in Table 1.
Visually, the predicted PK profiles closely matched the observed data. The goodness of fit was assessed using the average fold error (AFE).
Key parameters for Cer included an initial volume of distribution (V0) of 20 L, a steady-state volume of distribution (Vdss) of 45 L, and a distribution rate constant (Kd) of 0.15 h−1. The calculated Ai,overall values were 4.75 for Cer + Gem and 1.12 for Cer + Itr. The hepatic availability (Fh ~0.9) had a minimal effect on the Ai,overall values.
Enzyme-specific fraction metabolized (fm) values were estimated as follows: fm,CYP3A4 = 0.12; fm,CYP2C8 = 0.75; fm,UGT = 0.13

3.2. PK Parameters for M23, M1, and Cer-L

The initial and steady-state distribution volumes (V0M and VdssM) and distribution rate constants (KdM) for M23, M1, and Cer-L were assumed to be the same as those of Cer. The fraction metabolized (fM) values for M23 and M1 were calculated to be 0.225 and 0.645, respectively (assuming r = 0.3), while fM for Cer-L was 0.13.
Elimination rate constants (KeM) were estimated as follows: M23: 0.31 h−1; M1: 4.0 h−1; Cer-L: 0.75 h−1
Additional parameters including total clearance (CLtotM) and hepatic availability (FhM) are presented in Table 2.

3.3. Simulated Metabolite Cp,M(t), Ratios of fM(+)/fM and KeM(+)/KeM, and Ai,overall(M) in DDIs

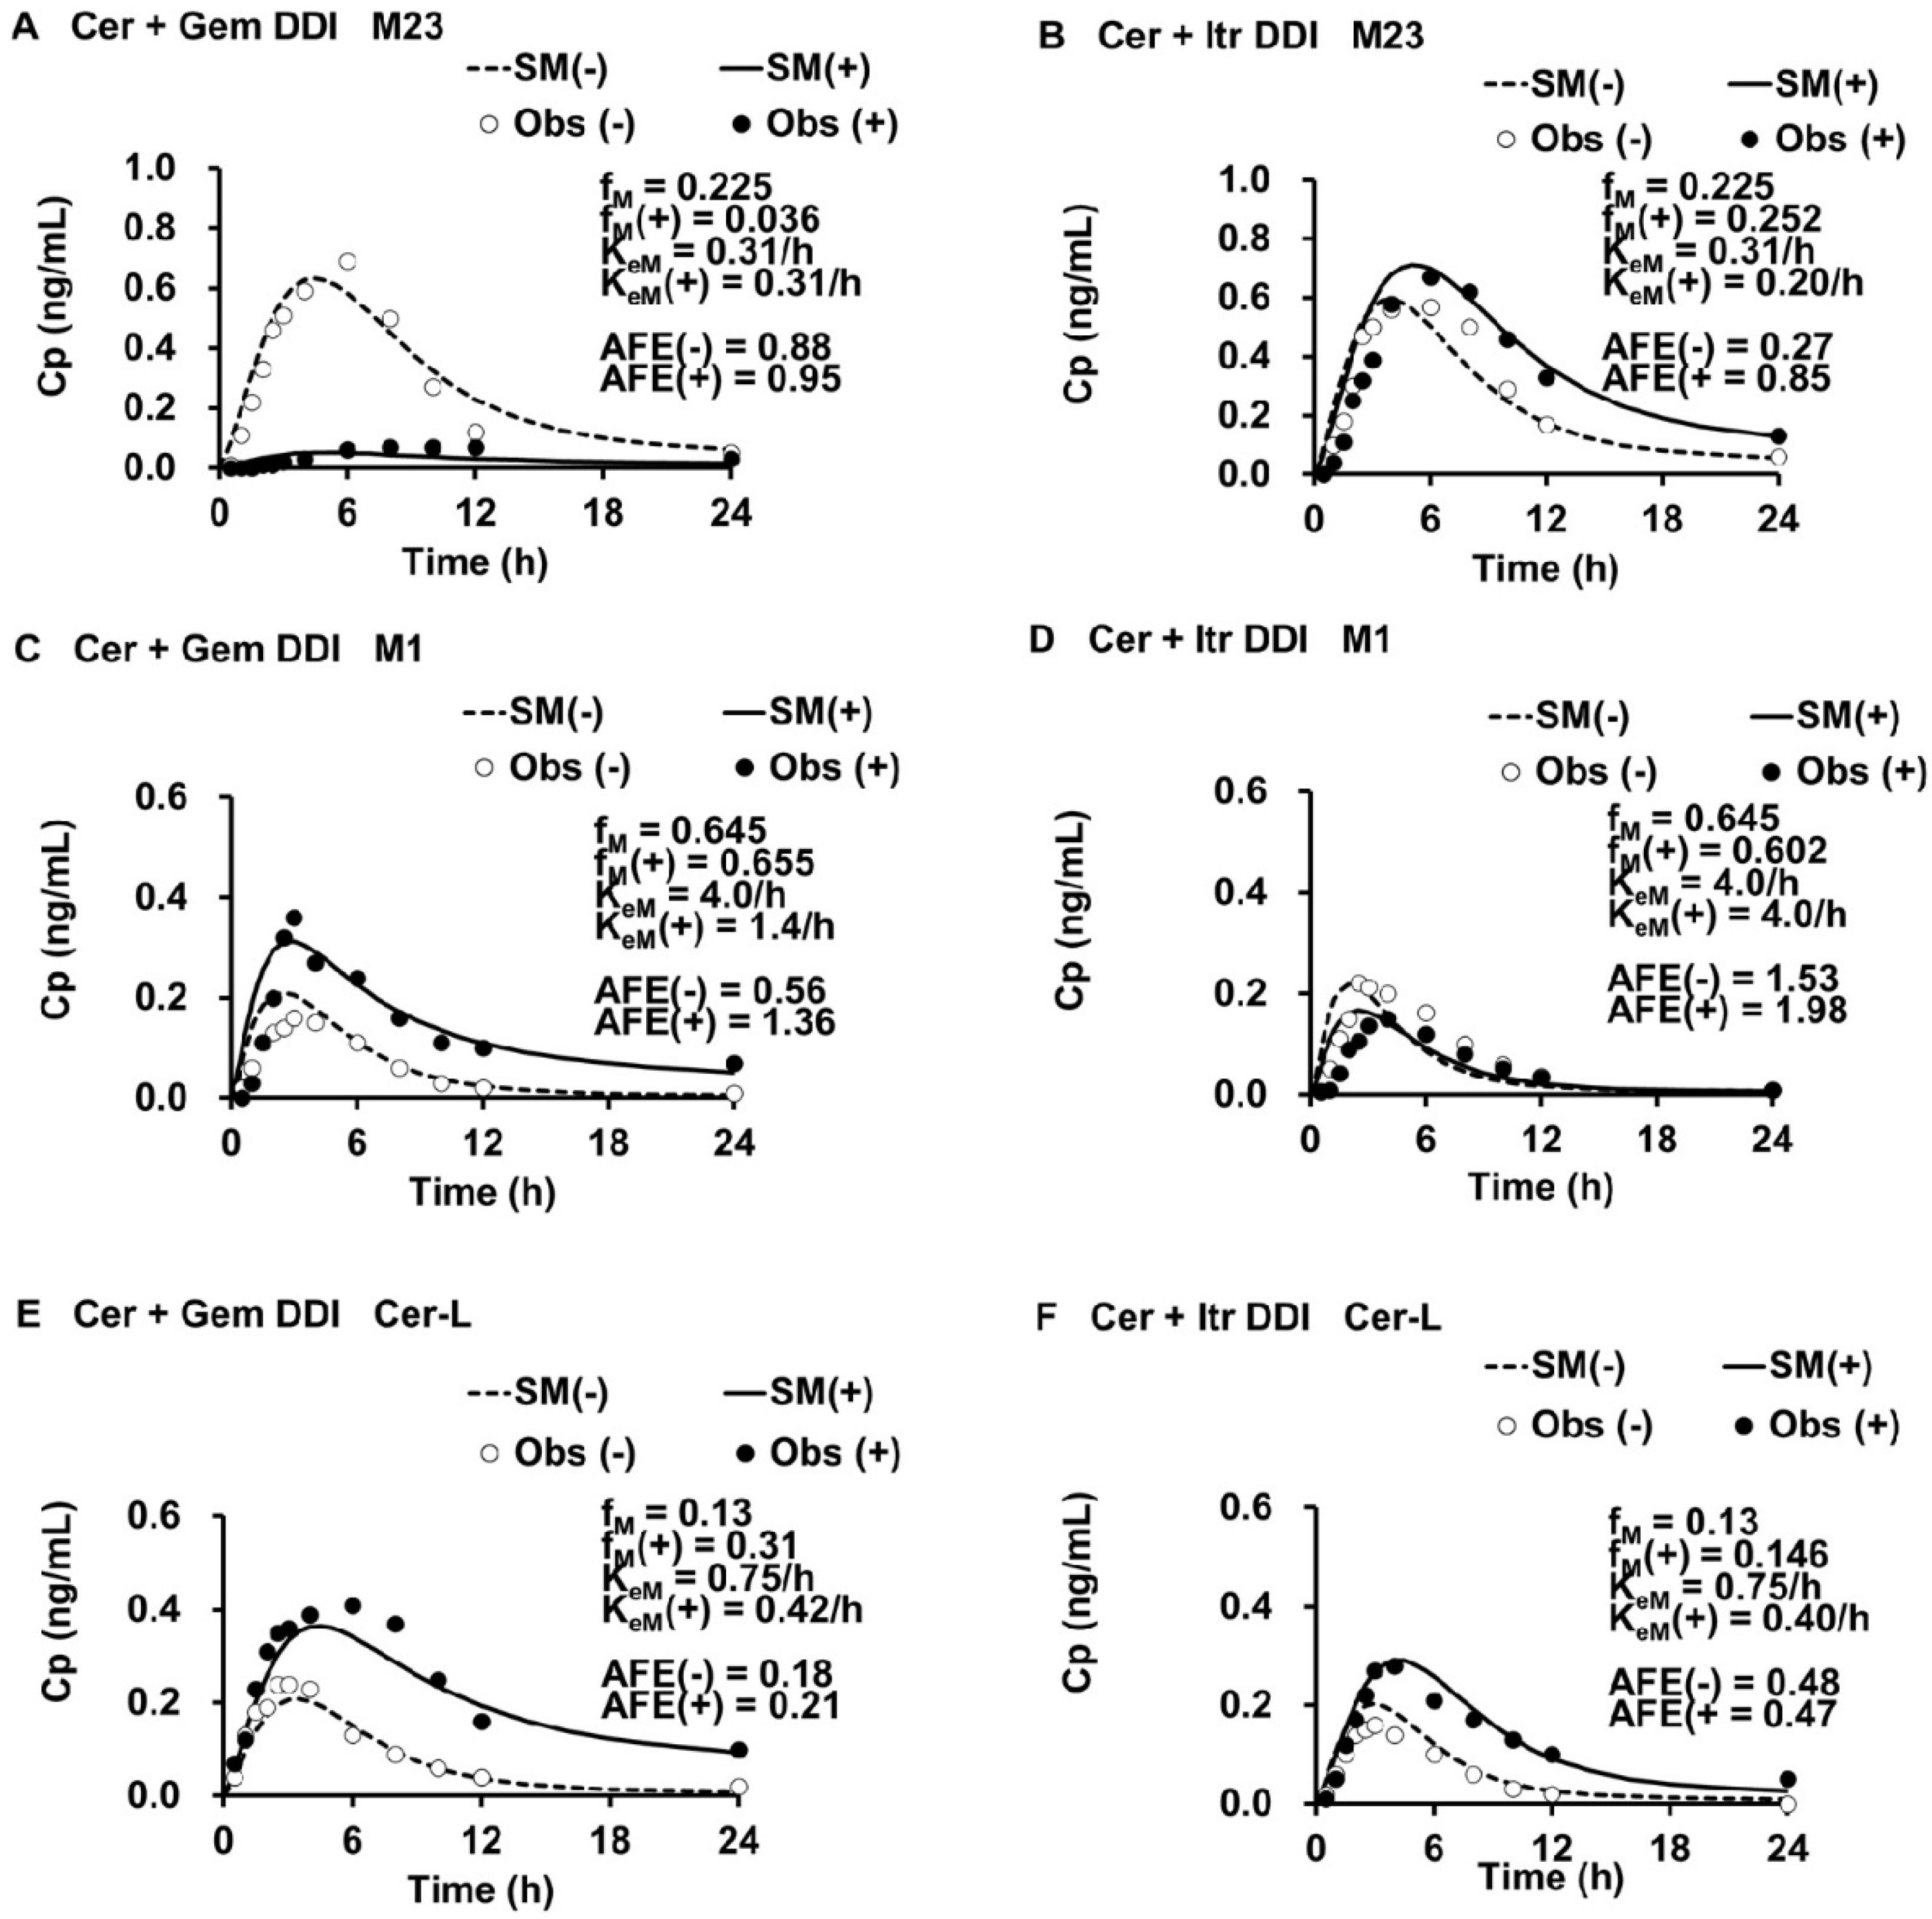
Simulated plasma concentration profiles of M1, M23, and Cer-L under the Cer + Gem and Cer + Itr DDI conditions are shown in Figure 3. The corresponding fM(+)/fM and KeM(+)/KeM ratios, as well as Ai,overall(M) values, are summarized in Table 3.
While visual inspection confirmed general agreement between predicted and observed PK profiles, relatively large AFE values were observed due to variability in the unchanged drug levels.
In the Cer + Gem DDI:
M23: Formation decreased (fM(+)/fM = 0.16); elimination unchanged (KeM(+)/KeM = 1);
M1: Formation unchanged; elimination reduced (KeM(+)/KeM = 0.35) leading to Ai,overall(M) = 32;
Cer-L: Formation increased (fM(+)/fM = 2.38); elimination reduced (KeM(+)/KeM = 0.56) leading to Ai,overall(M) = 1.97.
In the Cer + Itr DDI:
M23: Slightly increased formation (fM(+)/fM = 1.12); reduced elimination (KeM(+)/KeM = 0.64) leading to Ai,overall(M) = 1.58;
M1: Slightly decreased formation (fM(+)/fM = 0.93); elimination unchanged (KeM(+)/KeM = 1);
Cer-L: Slightly increased formation (fM(+)/fM = 1.12); reduced elimination (KeM(+)/KeM = 0.53) leading to Ai,overall(M) = 2.11.

3.4. Enzyme Contributions to the Metabolism of M23, M1, and Cer-L

The relative enzymatic contributions to the metabolism of each metabolite are summarized in Table 4.
M23: ~33% metabolized by CYP3A4 (inhibited by Itr), approximately 67% by UGT (not inhibited by Gem);
M1: 100% metabolized by CYP2C8 (inhibited by Gem);
Cer-L: 50–60% by CYP3A4 and 40–50% by CYP2C8, respectively.

3.5. Sensitivity Analyses: fm,CYP3A4, r, and pAi,UGT(d)

fm,CYP3A4 Sensitivity:
Example 1: Increasing fm,CYP3A4 to 0.15 led to underestimation of Ai,overall (4.39 vs. 4.76) and AUCR (4.39 vs. 5.00) in Cer + Gem DDI.
Example 2: Altering fm,CYP3A4 and fm,UGT without adjusting KeM resulted in a poor fit for Cer-L levels.
r Sensitivity:
Example 3: Assuming r = 1 failed to reproduce M23 levels, even with KeM adjustments.
Example 4: r = 0.5 similarly produced unsatisfactory M23 predictions.
pAi,UGT(d) Sensitivity:
Example 5: Setting pAi,UGT(d) = 1 (no UGT inhibition) increased fM(+)/fM for Cer-L to 3.33 but resulted in AUCR = 3.48 (<5.00).
Example 6: pAi,UGT(d) = 2.5 maintained plasma Cer fit (AUCR = 5.00) but led to implausibly low KeM(+)/KeM and fm,CYP2C8(M) exceeding allowed limits.
Further analysis is provided in Supplementary Material (SM12).

3.6. Prediction of fM(+)/fM and KeM(+)/KeM in the Cer + Gem + Itr DDI

In the triple DDI scenario (Cer + Gem + Itr), Ai,overall for Cer was calculated as follows:
Ai,overall = 1/(0.13/2 + 0.75/32 + 0.12/10) = 9.96.
Using this value:
fM(+)/fM ratios were calculated as follows: M23 = 0.31, M1 = 0.43, Cer = 5;
KeM(+)/KeM values were assumed to be M23 = 0.64 (same as Cer + Itr); M1 = 0.35 (same as Cer + Gem);
Cer-L showed extremely low KeM(+)/KeM values (0.072–0.080), consistent with a high Ai,overall(M) (13.8–15.2).
Results are summarized in Table 5.

3.7. Predicted AUCR(M) for Metabolites in the Cer + Gem + Itr DDI

AUCR(M) values were calculated as [fM(+)/fM] × [KeM/KeM(+)] and are presented in Table 6, alongside observed values and the AUCR for Cer.
Cer: AUCR ≈ 10 (double that of Cer + Gem);
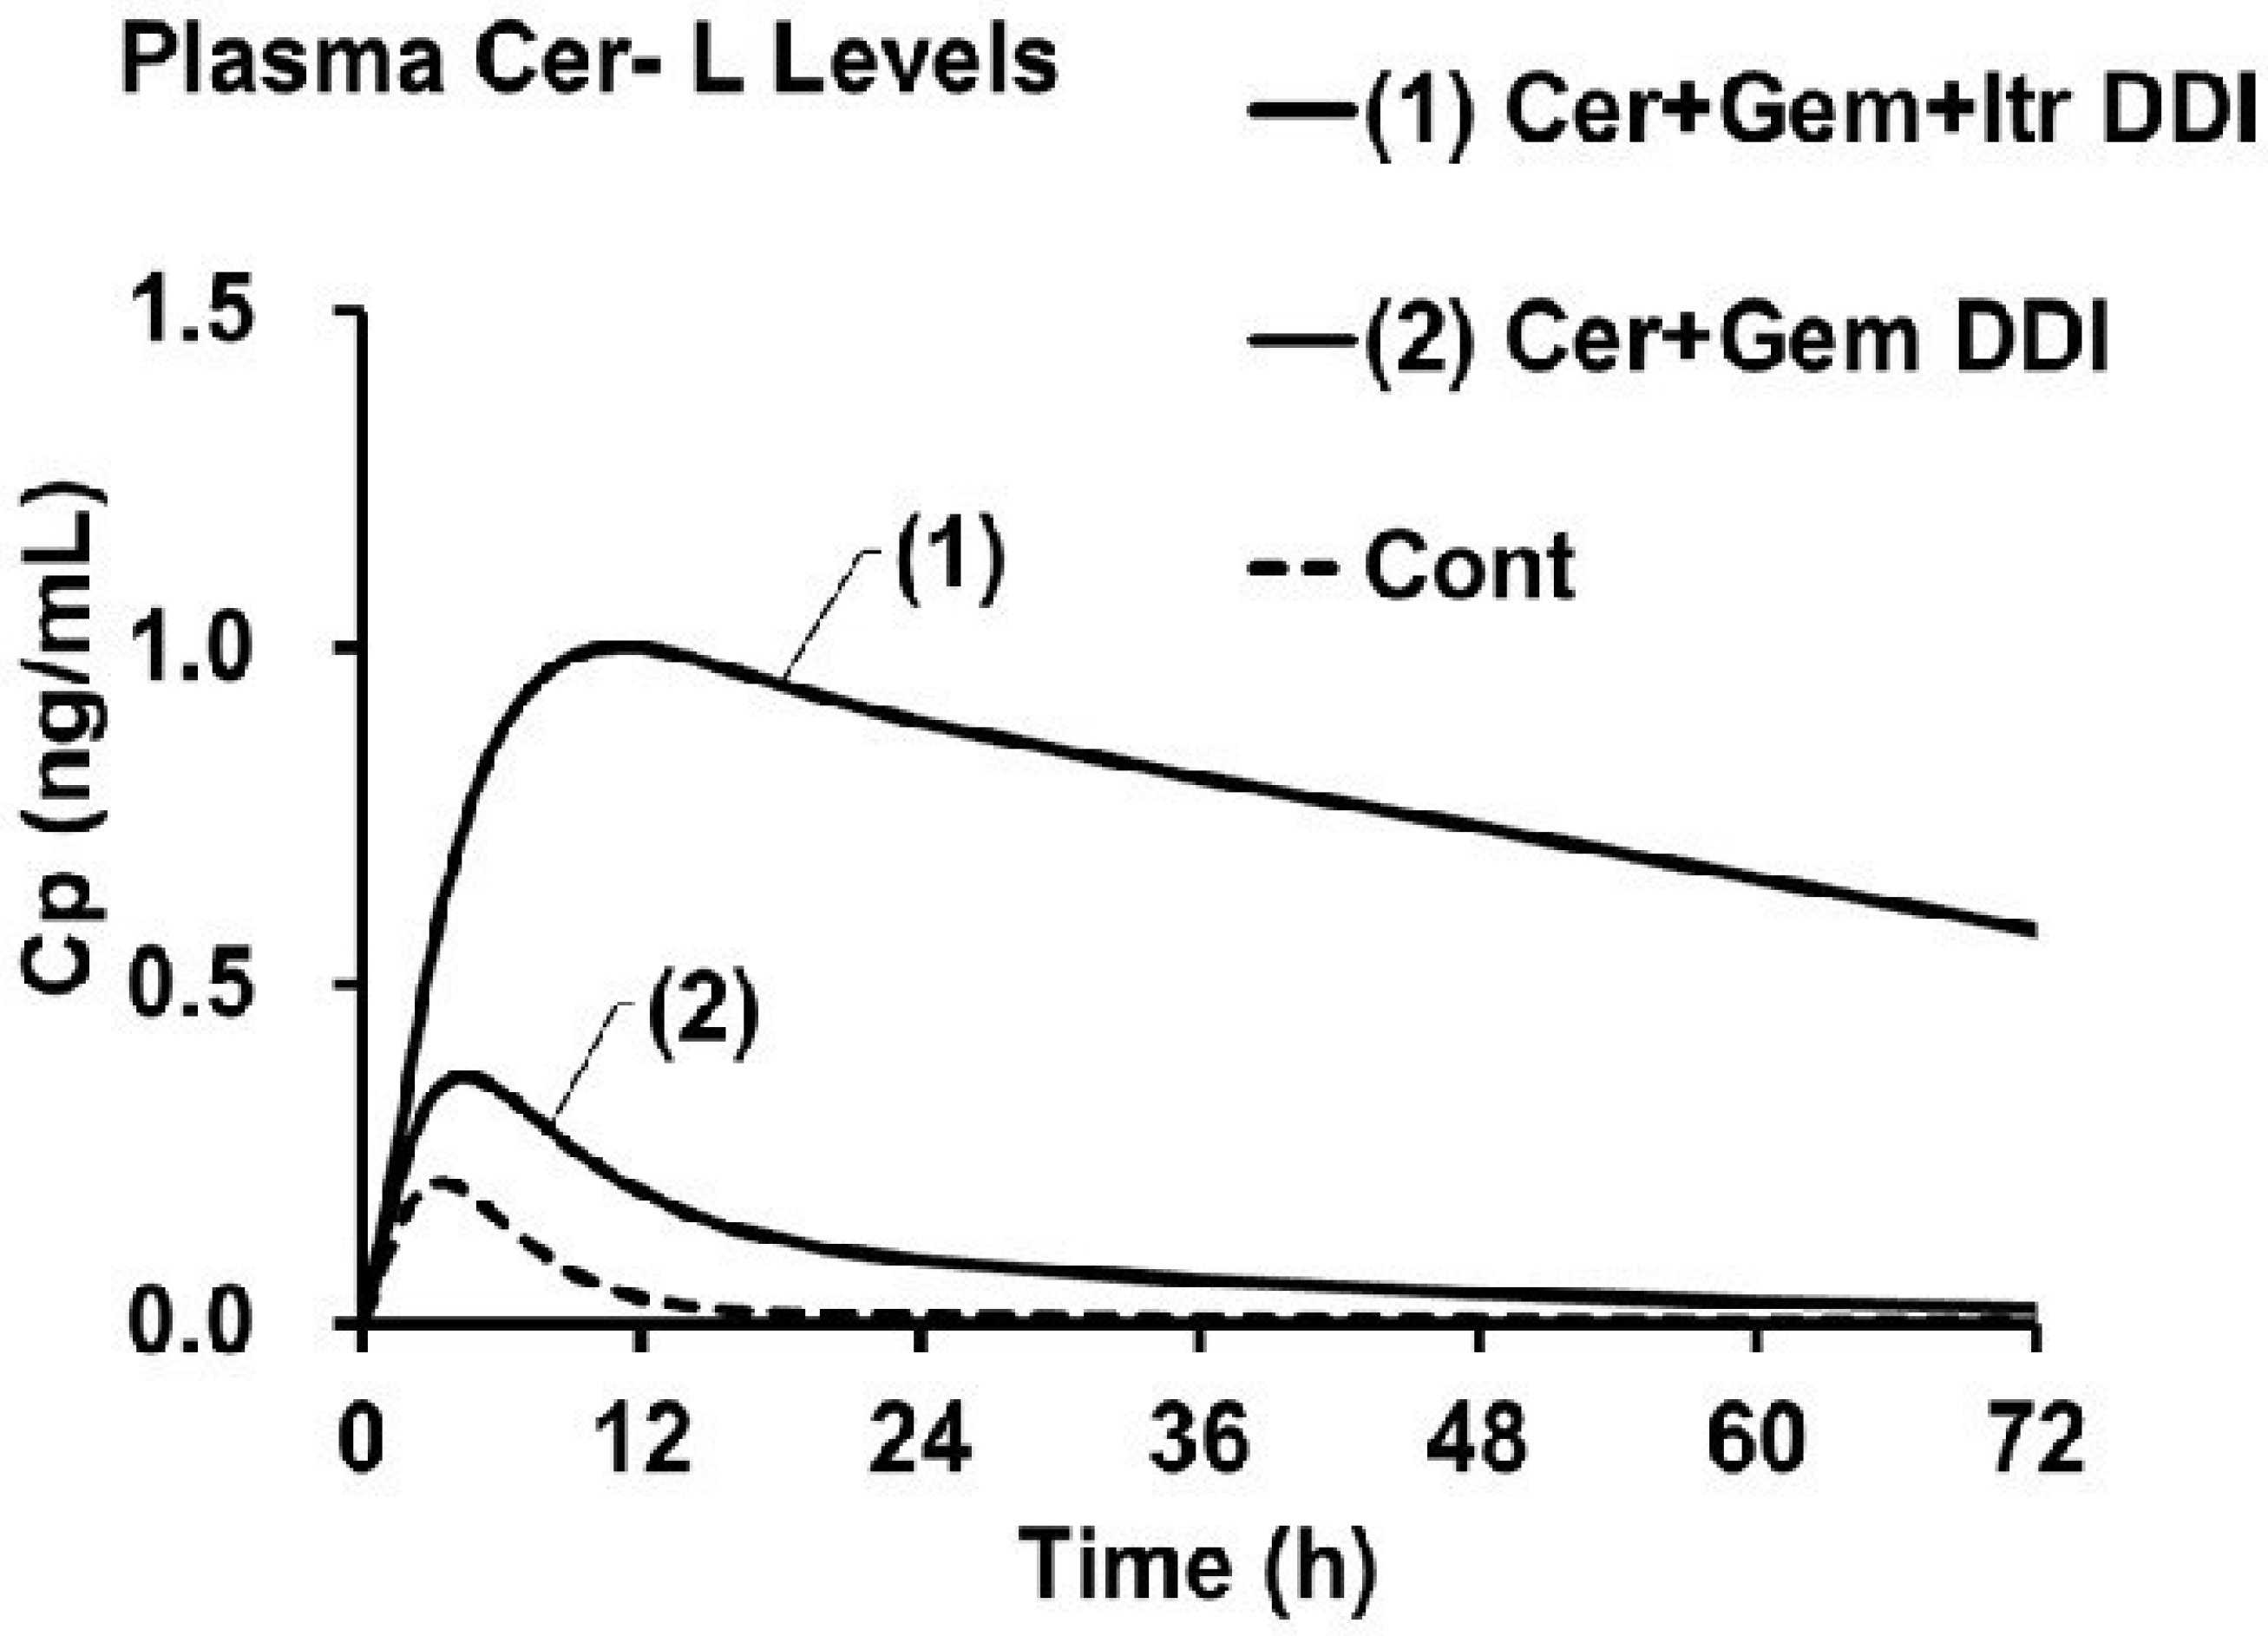
Cer-L: AUCR(M) ≈ 60–70 (15–17× increase vs. Cer + Gem);
M23 and M1: No substantial changes in AUCR(M).
Figure 4 illustrates plasma Cer-L levels across the DDI scenarios. Notably, increases in Cmax were largely attributed to changes in fM(+)/fM, while the t1/2 decreases reflected changes in KeM(+)/KeM.

4. Discussion

This study aimed to predict the impact of DDIs on the plasma concentrations of Cer and its key metabolites. Using a combination of static compartment models and a metabolite-linked modeling approach, we evaluated how inhibitors—both singly and in combination—affect Cer’s PK. Special focus was placed on the dual-inhibition scenario involving Gem and Itr, where we hypothesized a substantial elevation in Cer-L plasma levels due to concurrent inhibition of CYP2C8 and CYP3A4.
We began by validating the two-compartment-assisted model using clinical DDI scenarios involving Cer alone and in combination with either Gem or Itr. The model reliably reproduced observed AUCR values and estimated the Ai,overall, particularly highlighting a strong interaction in the Cer + Gem case (AUCR ~5.0, Ai,overall = 4.76).
Mechanistic analysis of Ai,overall revealed that Cer is primarily eliminated via CYP2C8 (fm = 0.75), with minor contributions from UGT (fm = 0.13) and CYP3A4 (fm = 0.12). Using this breakdown and estimated inhibitory potencies (pAi), we extended the model to predict metabolite formation fractions (fM). Cer-L was assumed to form mainly via UGT, while M1 and M23 arise through oxidation by CYP enzymes, with CYP2C8 contributing predominantly.
To simulate metabolite elimination, we applied a Metabolite-Linked Model, assuming distribution volumes similar to Cer. Simulations fitted to control data allowed us to estimate metabolite-specific elimination rates (KeM) and overall clearance parameters. This provided a mechanistic foundation to predict how DDIs affect each metabolite’s exposure.
A key finding of this study is the predicted dramatic increase in Cer-L exposure when Cer is co-administered with both Gem and Itr. The AUCR for Cer-L reached approximately 70, far exceeding that of the parent compound or any other metabolites. This substantial increase is attributed to both enhanced formation (~5-fold) and markedly reduced elimination (~13-fold), due to the simultaneous inhibition of CYP2C8 and CYP3A4.
Although this calculation assumes that Cer-L clearance occurs solely through metabolism, even when accounting for hydrolytic clearance, the AUCR is not expected to fall below 40. This highlights the potentially significant increase in Cer-L exposure resulting from DDIs.
While direct clinical confirmation of increased Cer-L levels under the Cer + Gem + Itr combination is currently lacking, this does not undermine the model-based predictions. Rather, it reflects a common stage in model-informed drug development, where simulations guide hypothesis generation, followed by experimental validation. In this case, in vitro studies offer a feasible path forward. For example, hepatic microsomal assays could assess Cer and Cer-L metabolism under varying inhibitory conditions (Cer alone, Cer + Gem, Cer + Itr, and Cer + Gem + Itr). Such stepwise experiments would help verify key model assumptions, particularly the dual role of CYP3A4 and CYP2C8 in Cer-L elimination.
Given the potential toxicity of Cer-L, these findings highlight significant safety concerns. Although clinical trials combining Cer and Gem have not reported serious adverse effects, the inclusion of Itr may introduce new and previously unrecognized risks—most notably hepatotoxicity and peripheral tissue toxicity, including rhabdomyolysis. We hypothesize that Cer-L could contribute to rhabdomyolysis through tissue-specific hydrolysis by paraoxonase 1 (PON1), which may regenerate active Cer within muscle tissue. This proposed mechanism remains speculative and warrants further experimental investigation.
The metabolite-linked model showed strong performance in predicting changes in both parent drug and metabolite exposures, even in complex DDI scenarios. Its key advantage is a mechanistic framework that allows detailed analysis of metabolite formation and elimination using only plasma concentration data from the parent drug. This approach enhances traditional two-compartment assisted physiologically based pharmacokinetic (PBPK) modeling, and offers a valuable tool for evaluating DDI risk, particularly in early drug development. Ongoing research is focused on extending the model’s use to a broader range of drug classes and metabolic enzyme systems.
Although this study focused on Cer, the model was developed to be broadly applicable. Its successful application to other CYP substrates, such as montelukast and repaglinide, has shown strong agreement between predicted and observed changes in both parent drugs and their metabolites in DDI scenarios, supporting its wider utility.
One key assumption in the model is that the volume of distribution for the metabolite is equivalent to that of the parent compound. This is considered reasonable given the structural similarities between Cer and its metabolites—M23, M1 (formed via oxidation), and Cer-L (formed via dehydration)—as well as their shared physicochemical properties, which are known to influence distribution behavior. However, while this assumption simplifies the modeling process, it warrants further validation. Ongoing studies are evaluating whether it can be applied to other drug-metabolite pairs whose PK after IV administration have been thoroughly studied.

5. Methods

5.1. Data Acquisition for Cer DDIs with Gem and Itr

Plasma concentration–time data for Cer and its metabolites in the presence of Gem and Itr were obtained by digitizing published graphical data [11,20]. The digitized concentration profiles were used to recalculate the AUC using the trapezoidal method. The accuracy of the digitization and AUC estimation was verified by confirming consistency with the original reported values.

5.2. Sequential PK Modeling Framework for Parent Drug and Metabolites

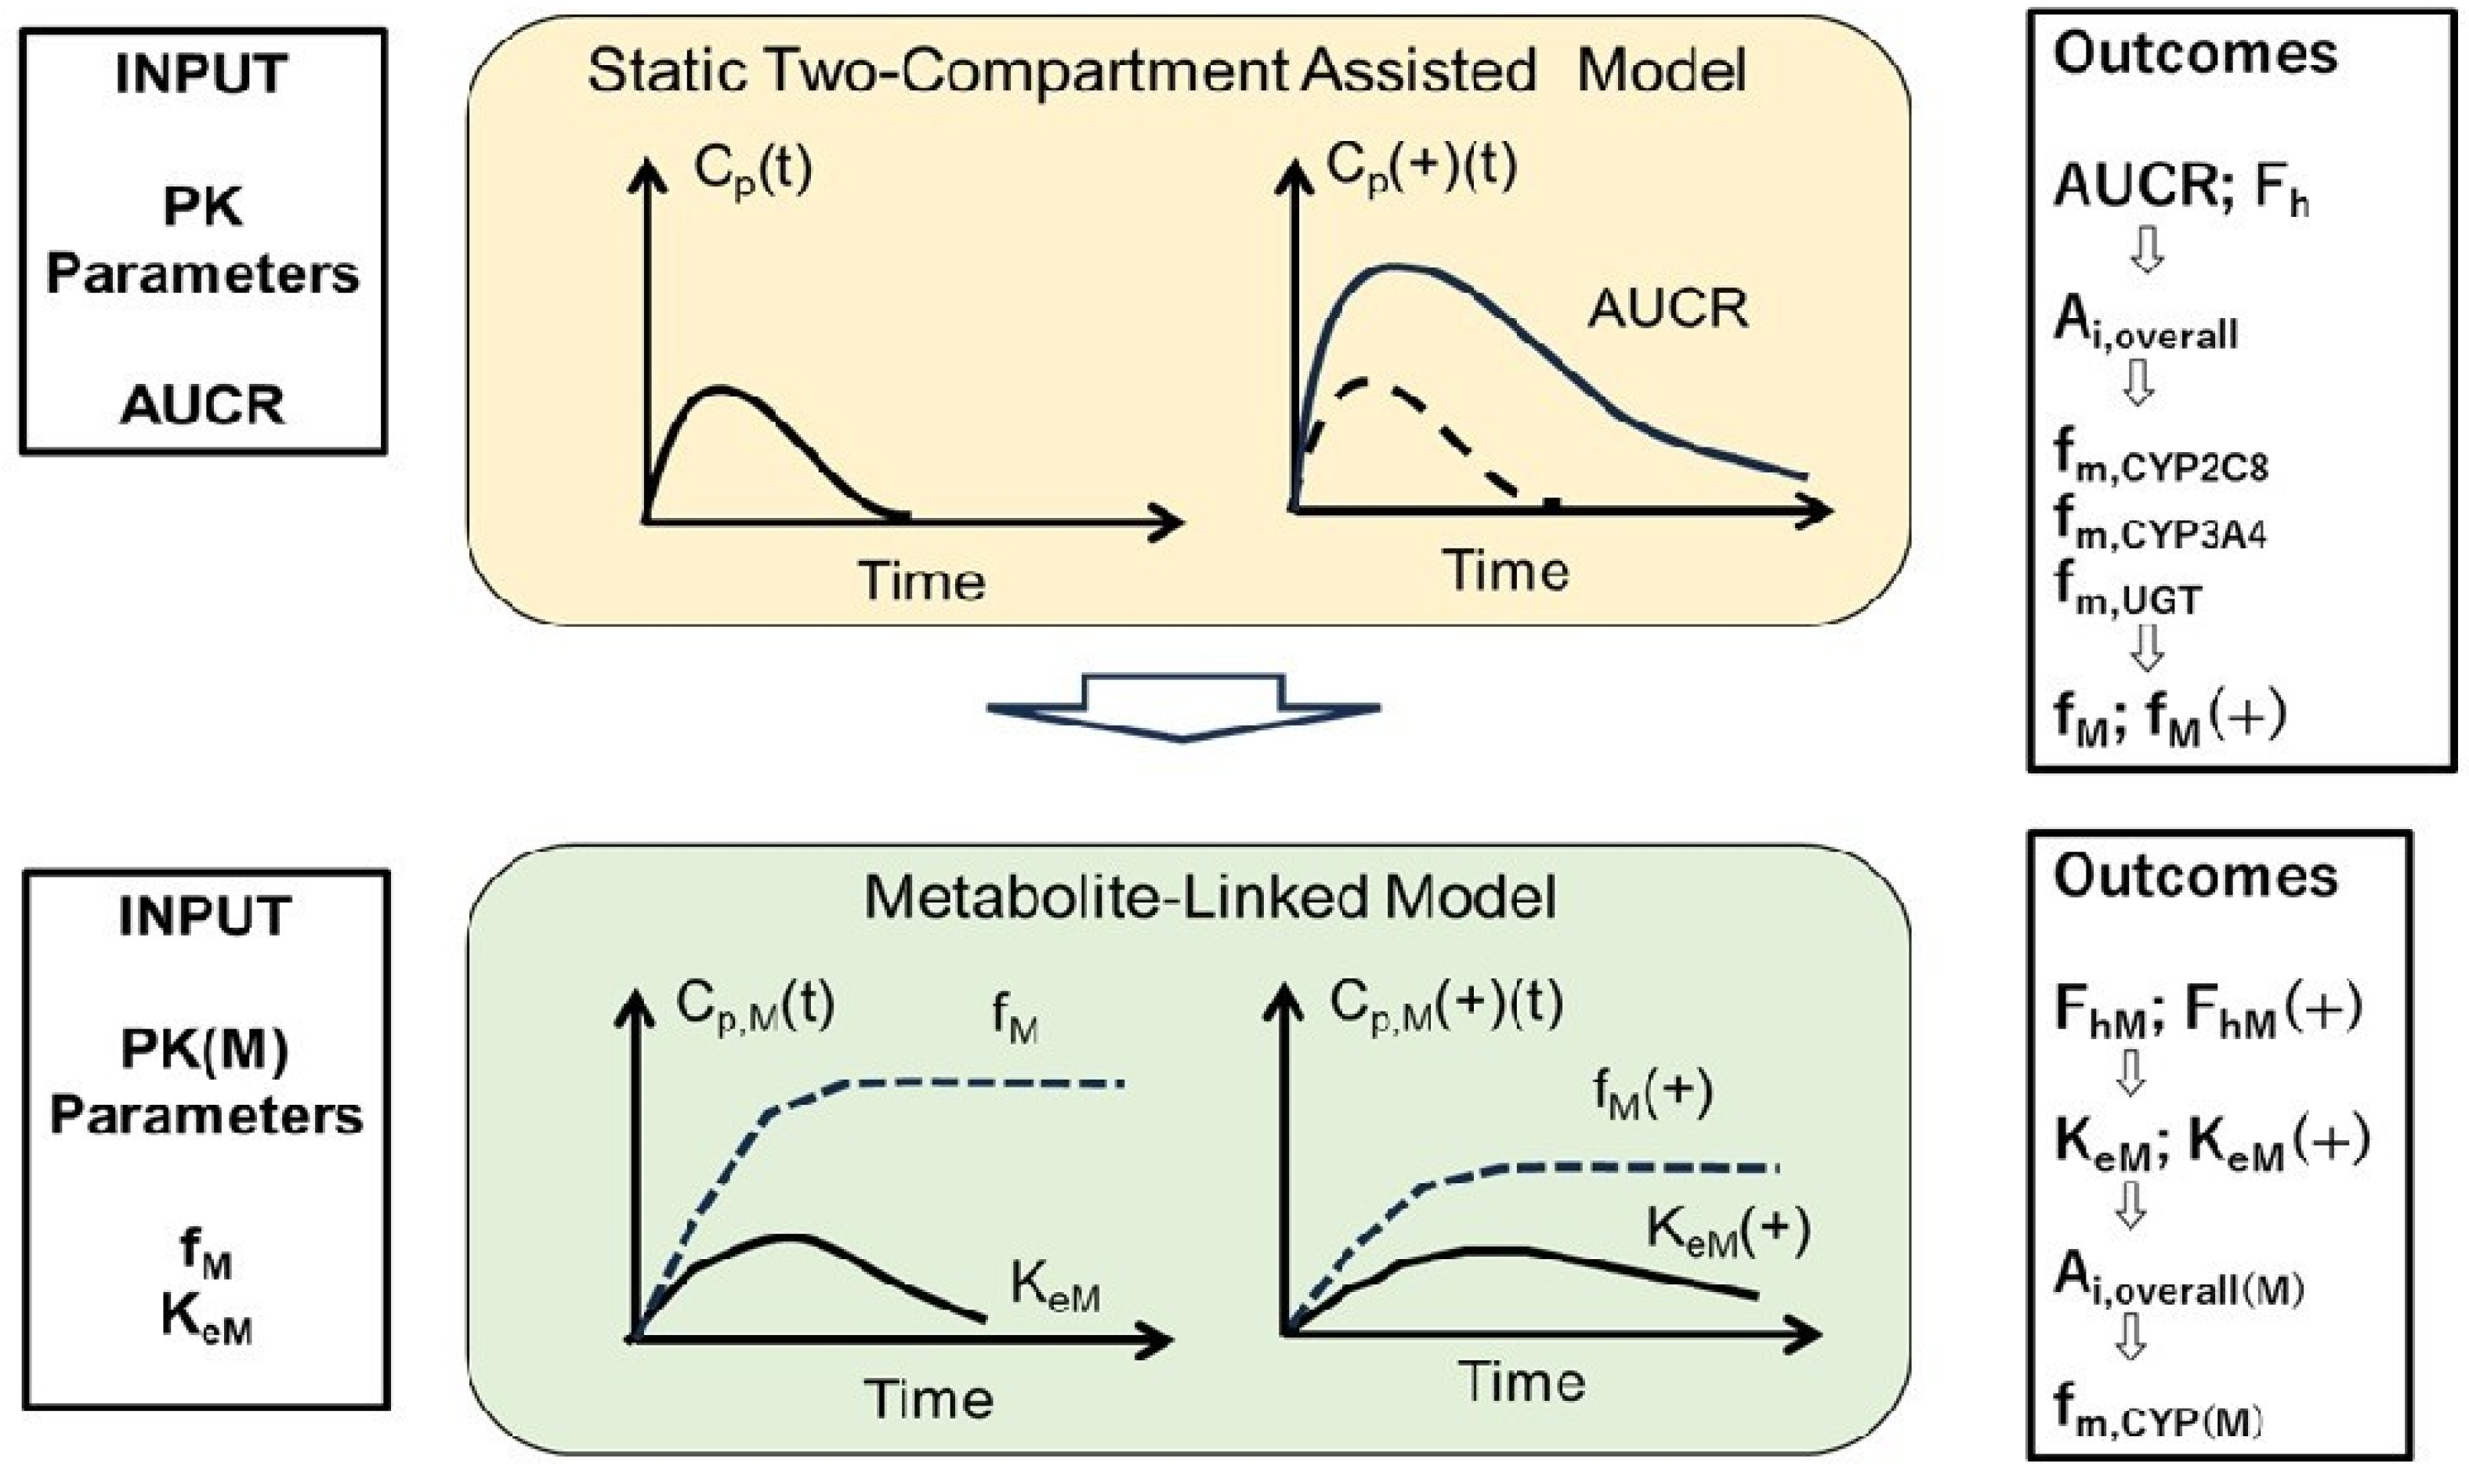
A stepwise modeling approach was employed to characterize the PK of Cer and its metabolites under control and DDI conditions. The workflow is summarized in Figure 5. The parent drug (Cer) was modeled using a Static Two-Compartment Assisted Model, while a Metabolite-Linked Model was applied for each metabolite (M23, M1, and Cer-L). The nomenclature and computational formulae for the derived PK parameters are described in Supplementary Material (SM8).

5.3. PK Analysis

5.3.1. Modeling of the Parent Drug (Cer)

Initial PK simulations focused on reproducing the observed plasma concentration–time profiles of Cer in the absence of a perpetrator [Cp(t)]. Key PK parameters—absorption rate constant (Ka), the product of fraction absorbed and intestinal availability (Fa × Fg), total or oral clearance (CLtot or CLoral), and distribution parameters (V0, Vdss, Kd)—were optimized to achieve the best fit to observed data.
Simulations were then extended to DDI conditions [Cp(t)(+)], using observed AUCR values from the Cer + Gem and Cer + Itr studies. These AUCR values were adjusted within plausible bounds to achieve agreement with observed profiles under each interaction condition.
The overall DDI impact on Cer exposure was quantified as Ai,overall, calculated from the adjusted AUCR. Using a mechanistic DDI model, enzyme-specific contributions to Cer elimination—fm,CYP2C8, fm,CYP3A4, and fm,UGT—were estimated by solving equations that relate Ai,overall to known inhibitory potencies of the perpetrator drugs (pAi,CYP2C8, pAi,CYP3A4, and pAi,UGT). Corresponding enzyme fractions under DDI conditions—fm,CYP2C8(+), fm,CYP3A4(+), and fm,UGT(+)—were also derived. These enzyme-specific values were then used to estimate the fraction of each metabolite formed under both control and DDI conditions (fM and fM(+), respectively).

5.3.2. Modeling of Cer Metabolites

Using the fM and fM(+) values obtained from parent drug simulations, plasma concentration–time profiles for each metabolite [Cp,M(t) and Cp,M(+)(t)] were generated by optimizing their respective first-order elimination rate constants, KeM and KeM(+). In accordance with the theoretical framework proposed by Poulin [33], the distribution parameters for the metabolites were assumed to be equivalent to those of the parent compound [Supplementary Material (SM9)].
Based on the optimized KeM and KeM(+) values, hepatic availability (Fh(M) and Fh(M)(+)) was calculated for each metabolite. These values were used to estimate the overall inhibitory effect on metabolite clearance (Ai,overall(M)) under DDI conditions. From this, enzyme-specific contributions to metabolite elimination were inferred as follows: fm,CYP2C8(M) from the Cer + Gem scenario and fm,CYP3A4(M) from the Cer + Itr scenario.
Finally, the influence of DDI on metabolite exposure was evaluated by calculating the ratios fM/fM(+), KeM/KeM(+), and the AUCR of each metabolite (AUCR(M)), in order to explore the relationship between AUCR(M) and changes in metabolite formation and elimination under DDI conditions.

5.4. Software for PK Simulations

All PK simulations and calculations were performed using Microsoft Excel 2021 (MSO). Detailed workflows and calculation steps for Cer and Cer-L in the Cer + Gem DDI scenario are provided in the Supplementary Material [SM10 for Cer, SM11 for Cer-L].

6. Conclusions

The widespread occurrence of fatal rhabdomyolysis associated with Cer has been primarily linked to its co-administration with the CYP2C8 inhibitor Gem. However, the underlying PK mechanisms contributing to this severe adverse effect have remained poorly understood.
In this study, we applied a novel DDI analysis framework integrating a Metabolite-Linked Model to elucidate the systemic exposure profiles of Cer and its metabolites. Our results indicate that the combination of Cer with Gem and a CYP3A4 inhibitor (e.g., Itr) leads to a substantial reduction in the clearance of the glucuronide metabolite Cer-L. This combined inhibition results in a pronounced accumulation of Cer-L, with predicted plasma levels rising by up to 70-fold.
These findings offer new mechanistic insight into Cer-associated toxicity and suggest that elevated Cer-L, driven by impaired biotransformation and elimination, may play a critical role in mediating tissue-specific adverse effects. The approach presented here provides a promising platform for future DDI risk assessment, particularly for drugs with active or toxic metabolites.

Supplementary Materials

The following supporting information can be downloaded at: https://www.mdpi.com/article/10.3390/ddc4030034/s1, SM1: Fatal Rhabdomyolysis Reported for Cer. SM2: Effect of Transporters or Other Enzymes on the Current DDI Analysis. SM3: Background Data on Cer Metabolism and Preliminary PK Analysis of Cer and Its Primary Metabolites Based on Observed DDIs Mediated by Gem and Itr. SM4: Interplay of UGT and CYP2C8. SM5: PK Parameters of Clop-COOH/Clop-O-glu, and Gem/Gem-O-glu. SM6: Comparison of Static Ai,overall-Based DDI Simulations with Dynamic DDI Simulations. SM7: Metabolite-Linked Model for Time-Dependent Plasma Metabolite Levels. SM8: Nomenclature of Derived PK Parameters and Equations Used to Calculate PK Parameters. SM9: Assumptions Regarding the Distribution Parameters of Metabolites. SM10: Static 2-Compartment Model for the Calculation of Cp,oral(t) and Cp,oral(+)(t). SM11: Static 2-Compartment Model for the Calculation of Cp,M,oral(t) and Cp,M,oral(+)(t). SM12: Deviations from Optimal Simulations.

Funding

This research received no external funding.

Institutional Review Board Statement

Not applicable.

Informed Consent Statement

Not applicable.

Data Availability Statement

Additional data are given in the Electronic Supplementary Information.

Acknowledgments

During the preparation of this work (including the cover letter), the author used generative AI (ChatGPT or Copilot) to improve language and readability. After using this tool, the author reviewed and edited the content as needed and takes full responsibility for the content of the publication.

Conflicts of Interest

The author declares no conflicts of interest. Although the author is employed as an advisor to Towa Pharmaceutical Co., Ltd., this research and the content of this submission were conducted independently, without support or direction from Towa Pharmaceutical Co., Ltd., and solely reflect the author’s personal views.

Abbreviations

The following abbreviations are used in this manuscript:
AUCThe area under the plasma drug level curve
AUCRAUC ratio (Fold increase in AUC)
CYPCytochorme P450
DDIDrug–drug interaction
PKPharmacokinetics
UGTUDP-glucuronosyltransferase

References

  1. Iga, K. Use of three-compartment physiologically based pharmacokinetic modeling to predict hepatic blood levels of fluvoxamine relevant for drug-drug interactions. J. Pharm. Sci. 2015, 104, 1478–1491. [Google Scholar] [CrossRef] [PubMed]
  2. Iga, K. Simulation of metabolic drug-drug interactions perpetrated by fluvoxamine using hybridized two-compartment hepatic drug-pool-based tube modeling and estimation of in vivo inhibition constants. J. Pharm. Sci. 2015, 104, 3565–3577. [Google Scholar] [CrossRef] [PubMed]
  3. Iga, K. Dynamic and static simulations of fluvoxamine-perpetrated drug-drug interactions using multiple cytochrome P450 inhibition modeling, and determination of perpetrator-specific CYP isoform inhibition constants and relative CYP isoform contributions to victim clearance. J. Pharm. Sci. 2016, 105, 1307–1317. [Google Scholar]
  4. Iga, K.; Kiriyama, A. Simulations of cytochrome P450 3A4-mediated drug-drug interactions by simple two-compartment model-assisted static method. J. Pharm. Sci. 2017, 106, 1426–1438. [Google Scholar] [CrossRef]
  5. Iga, K.; Kiriyama, A. Usefulness of two-compartment model-assisted and static overall inhibitory-activity method for prediction of drug-drug interaction. Biol. Pharm. Bull. 2017, 40, 2024–2037. [Google Scholar] [CrossRef]
  6. Iga, K.; Kiriyama, A. Interplay of UDP-glucuronosyltransferase and CYP2C8 for CYP2C8 mediated drug oxidation and its impact on drug-drug interaction produced by standardized CYP2C8 inhibitors, clopidogrel and gemfibrozil. Clin. Pharmacokinet. 2024, 63, 43–56. [Google Scholar] [CrossRef]
  7. Friedman, M.A.; Woodcock, J.; Lumpkin, M.M.; Shuren, J.E.; Hass, A.E.; Thompson, L.J. The safety of newly approved medicines: Do recent market removals mean there is a problem? JAMA 1999, 281, 1728–1734. [Google Scholar] [CrossRef] [PubMed]
  8. Smogorzewski, M. The myopathy of statins. J. Ren. Nutr. 2005, 15, 87–93. [Google Scholar] [CrossRef]
  9. Alfirevic, A.; Neely, D.; Armitage, J.; Chinoy, H.; Cooper, R.G.; Laaksonen, R.; Carr, D.F.; Bloch, K.M.; Fahy, J.; Hanson, A.; et al. Phenotype standardization for statin-induced myotoxicity. Clin. Pharmacol. Ther. 2014, 96, 470–476. [Google Scholar] [CrossRef]
  10. Turner, R.M.; Pirmohamed, M. Statin-Related Myotoxicity: A Comprehensive Review of pharmacokinetic, pharmacogenomic and muscle components. J. Clin. Med. 2019, 9, 22. [Google Scholar] [CrossRef]
  11. Backman, J.T.; Kyrklund, C.I.; Neuvonen, M.; Neuvonen, P.J. Gemfibrozil greatly increases plasma concentrations of cerivastatin. Clin. Pharmacol. Ther. 2002, 72, 685–691. [Google Scholar] [CrossRef] [PubMed]
  12. Farnier, M. Cerivastatin in the treatment of mixed hyperlipidemia: The RIGHT study. The cerivastatin study group. cerivastatin gemfibrozil hyperlipidemia treatment. Am. J. Cardiol. 1998, 82, 47J–51J. [Google Scholar] [CrossRef] [PubMed]
  13. Mück, W. Clinical pharmacokinetics of cerivastatin. Clin. Pharmacokinet. 2000, 39, 99–116. [Google Scholar]
  14. Plosker, G.L.; Dunn, C.I.; Figgitt, D.P. Cerivastatin: A review of its pharmacological properties and therapeutic efficacy in the management of hypercholesterolaemia. Drugs 2000, 60, 1179–1206. [Google Scholar] [CrossRef] [PubMed]
  15. Generaux, G.T.; Bonomo, F.M.; Johnson, M.; Doan, K.M.M. Impact of SLCO1B1 (OATP1B1) and ABCG2 (BCRP) genetic polymorphisms and inhibition on LDL-C lowering and myopathy of statins. Xenobiotica 2011, 41, 639–651. [Google Scholar] [CrossRef]
  16. Tornio, A.; Neuvonen, P.J.; Niemi, M.; Backman, J.T. Role of gemfibrozil as an inhibitor of CYP2C8 and membrane transporters. Expert. Opin. Drug. Metab. Toxicol. 2017, 13, 83–95. [Google Scholar] [CrossRef]
  17. Shitara, Y.; Hirano, M.; Sato, H.; Sugiyama, Y. Gemfibrozil and its glucuronide inhibit the organic anion transporting polypeptide 2 (OATP2/OATP1B1:SLC21A6)-mediated hepatic uptake and CYP2C8-mediated metabolism of cerivastatin: Analysis of the mechanism of the clinically relevant drug-drug interaction between cerivastatin and gemfibrozil. J. Pharmacol. Exp. Ther. 2004, 311, 228–236. [Google Scholar]
  18. Izumi, S.; Nozaki, Y.; Maeda, K.; Komori, T.; Takenaka, O.; Kusuhara, H.; Sugiyama, Y. Investigation of the impact of substrate selection on in vitro organic anion transporting polypeptide 1B1 inhibition profiles for the prediction of drug-drug interactions. Drug Metab. Dispos. 2015, 43, 235–247. [Google Scholar] [CrossRef]
  19. Tátrai, P.; Schweigler, P.; Poller, B.; Domange, N.; Wilde, R.D.; Hanna, I.; Gáborik, Z.; Huth, F. A systematic in vitro investigation of the inhibitor preincubation effect on multiple classes of clinically relevant transporters. Drug Metab. Dispos. 2019, 47, 768–778. [Google Scholar] [CrossRef]
  20. Kantola, T.; Kivistö, K.T.; Neuvonen, P.J. Effect of itraconazole on cerivastatin pharmacokinetics. Eur. J. Clin. Pharmacol. 1999, 54, 851–855. [Google Scholar] [CrossRef]
  21. Mück, W.; Ritter, W.; Ochmann, K.; Unger, S.; Ahr, G.; Wingender, W.; Kuhlmann, J. Absolute and relative bioavailability of the HMG-CoA reductase inhibitor cerivastatin. Int. J. Clin. Pharmacol. Ther. 1997, 35, 255–260. [Google Scholar]
  22. Boberg, M.; Angerbauer, R.; Fey, P.; Kanhai, W.K.; Karl, W.; Kern, A.; Ploschke, J.; Radtke, M. Metabolism of cerivastatin by human liver microsomes in vitro. Characterization of primary metabolic pathways and of cytochrome P450 isozymes involved. Drug Metab. Dispos. 1997, 25, 321–331. [Google Scholar] [PubMed]
  23. Prueksaritanont, T.; Subramanian, R.; Fang, X.; Ma, B.; Qiu, Y.; Lin, J.H.; Pearson, P.G.; Baillie, T.A. Glucuronidation of statins in animals and humans: A novel mechanism of statin lactonization. Drug Metab. Dispos. 2002, 30, 505–512. [Google Scholar] [CrossRef]
  24. Schirris, T.J.J.; Ritschel, T.; Bilos, A.; Smeitink, J.A.M.; Russel, F.G.M. Statin lactonization by uridine 5′-diphospho-glucuronosyltransferases (UGTs). Mol. Pharm. 2015, 12, 4048–4055. [Google Scholar] [CrossRef]
  25. Taha, D.A.; Moor, C.H.D.; Barrett, D.A.; Lee, J.B.; Gandhi, R.D.; Hoo, C.W.; Gershkovich, P. The role of acid-base imbalance in statin-induced myotoxicity. Transl. Res. 2016, 174, 140–160. [Google Scholar] [CrossRef] [PubMed]
  26. Kearney, A.S.; Crawford, L.F.; Mehta, S.C.; Radebaugh, G.W. The interconversion kinetics, equilibrium, and solubilities of the lactone and hydroxyacid forms of the HMG-CoA reductase inhibitor, CI-981. Pharm. Res. 1993, 10, 1461–1465. [Google Scholar] [CrossRef] [PubMed]
  27. Khersonsky, O.; Tawfik, D.S. Structure-reactivity studies of serum paraoxonase PON1 suggest that its native activity is lactonase. Biochemistry 2005, 44, 6371–6382. [Google Scholar] [CrossRef] [PubMed]
  28. Meneses, M.J.; Silvestre, R.; Sousa-Lima, I.; Macedo, M.P. Paraoxonase-1 as a regulator of glucose and lipid homeostasis: Impact on the onset and progression of metabolic disorders. Int. J. Mol. Sci. 2019, 20, 4049. [Google Scholar] [CrossRef]
  29. Skottheim, I.B.; Dahl, A.G.; Hejazifar, S.; Hoel, K.; Asberg, A. Statin induced myotoxicity: The lactone forms are more potent than the acid forms in human skeletal muscle cells in vitro. Eur. J. Pharm. Sci. 2008, 33, 317–325. [Google Scholar] [CrossRef]
  30. Karonen, T.; Neuvonen, P.J.; Backman, J.T. CYP2C8 but not CYP3A4 is important in the pharmacokinetics of montelukast. Br. J. Clin. Pharmacol. 2012, 73, 257–267. [Google Scholar] [CrossRef]
  31. Niemi, M.; Backman, J.T.; Neuvonen, M.; Neuvonen, P.J. Effects of gemfibrozil, itraconazole, and their combination on the pharmacokinetics and pharmacodynamics of repaglinide: Potentially hazardous interaction between gemfibrozil and repaglinide. Clin. Trial Diabetol. 2003, 46, 347–351. [Google Scholar] [CrossRef] [PubMed]
  32. Jaakkola, T.; Backman, J.T.; Neuvonen, M.; Neuvonen, P.J. Effects of gemfibrozil, itraconazole, and their combination on the pharmacokinetics of pioglitazone. Clin. Pharmacol. Ther. 2005, 77, 404–414. [Google Scholar] [CrossRef] [PubMed]
  33. Poulin, P. Drug Distribution to Human Tissues: Prediction and Examination of the Basic Assumption in In Vivo Pharmacokinetics-Pharmacodynamics (PK/PD) Research. J. Pharm. Sci. 2015, 104, 2110–2118. [Google Scholar] [CrossRef] [PubMed]
Figure 1. Potential for abnormal increases in plasma levels of Cer and its metabolites in the Cer + Gem + Itr DDI.
Ddc 04 00034 g001
Figure 2. Simultaneous simulations of changes in plasma Cer levels in the Cer + Gem and Cer + Itr DDIs. The doses of Cer, Gem, and Itr were 0.3 mg (single dose), 600 mg BID for 3 days, and 100 mg QD for 3 days, respectively. (−) Control; (+) Co-administration; SM, Simulation; Obs, Observed; AFE, Average Fold Error at each time point.
Ddc 04 00034 g002
Figure 3. Simultaneous simulations of changes in plasma M1, M23, and Cer-L levels in the Cer + Gem and Cer + Itr DDIs. The doses of Cer, Gem, and Itr were 0.3 mg (single dose), 600 mg BID for 3 days, and 100 mg QD for 3 days, respectively. (−) Control; (+) Co-administration; SM, Simulation; Obs, Observed; AFE, Average Fold Error at each time point.
Ddc 04 00034 g003
Figure 4. Predictions of changes in plasma Cer-L levels in the Cer + Gem and Cer + Gem + Itr DDIs.
Ddc 04 00034 g004
Figure 5. Illustrative workflow for the sequential PK modeling framework.
Ddc 04 00034 g005
Table 1. PK parameters for Cer, both with and without co-administered perpetrators, including the magnitudes of the DDIs and the relevant DDI-specific parameters.
Cer + Gem DDICer + Itr DDI
(−)(+)(−)(+)
CLoral (1/h)15.03.013.011.5
CLtotal (1/h)9.242.047.326.55
Fa×Fg0.70.70.620.62
Ka (1/h)0.41.00.70.5
Fh0.880.970.900.91
F0.610.680.560.56
V0 (L)20202020
Vdss (L)45454545
Kd (1/h)0.150.150.150.15
AUCR15.0011.13
Ai,overall14.7611.12
fm,CYP2C80.75 0.75
fm,UGT0.13 0.13
fm,CYP3A40.12 0.12
pAi,CYP2C811611
pAi,UGT(d)1211
pAi,CYP3A411110
Table 2. Estimation of PK parameters for M23, M1, and Cer-L.
M23M1Cer-L
fM0.225
[=0.3 a× fm,CYP2C8]
0.654
[=fm,CYP3A4 + 0.7 a× fm,CYP2C8]
0.13
[=fm,UGT]
KeM (1/h)0.314.00.75
V0M (L)202020
VdssM (L)454545
KdM (1/h)0.150.150.15
CLtotM [=KeM × V0M] (L/h)6.18015
FhM0.9300.80
a Assuming “r” = 0.3.
Table 3. Estimation of fM(+)/fM and KeM(+)/KeM, and Ai,overall(M) for each metabolite in the Cer + Gem and Cer + Itr DDIs.
Metabolite Cer + Gem DDICer + Itr DDI
M23fM(+)/fM0.161.12
KeM(+)/KeM1.000.64
FhM(+)
Ai,overall(M)
0.93
1.00
0.95
1.58
M1fM(+)/fM1.010.93
KeM(+)/KeM0.351.00
FhM(+)
Ai,overall(M)
0.35
32
0 a
1.00
Cer-LfM(+)/fM2.381.12
KeM(+)/KeM0.560.53
FhM(+)
Ai,overall(M)
0.89
1.97
0.89
2.11
a FhM(+)Ai,overall = 0.3532 ≈ 0.
Table 4. Estimated relative contributions of each enzyme to the metabolism of M23, M1, and Cer-L and metabolic products.
EnzymeM23M1Cer-L
fm,CYP3A4(M)0.3300.58 (from 0.5 to 0.6)
fm,CYP2C8(M)010.50 (from 0.5 to 0.4)
fm,UGT(G2)(M)000
fm,UGT(G1)(M)0.6700
ProductsM24 (by CYP3A4)M24 [by CYP2C8]M1-L (by CYP3A4)
M23-G1 [by UGT(G1)] M23-L (by CYP2C8)
Table 5. Predictions of fM(+)/fM, KeM/KeM(+) and Ai,overall(M) for M23, M1 and Cer-L in the Cer + Gem + Itr DDI.
Metabolite Cer + Gem + Itr DDI
M23fM(+)/fM0.312
KeM(+)/KeM0.64
Fh(M)(+)0.95
Ai,overall(M)1.58
M1fM(+)/fM0.44
KeM(+)/KeM0.35
Fh(M)(+)0.35
Ai,overall(M)32
Cer-LfM(+)/fM5
KeM(+)/KeM0.072~0.080
Fh(M)(+)0.98
Ai,overall(M)13.8~15.2
Table 6. Predictions of AUCR(M) for each metabolite compared with the AUCR for Cer in the Gem-induced DDIs.
Cer + Gem DDICer + Itr DDICer + Gem + Itr DDI
SimulatedObservedSimulatedObservedPredicted
AUCR(Cer)5.05.01.11.110
AUCR(M23)0.160.171.71.30.48
AUCR(M1)2.94.40.930.761.2
AUCR(Cer-L)4.24.42.12.662~69
Disclaimer/Publisher’s Note: The statements, opinions and data contained in all publications are solely those of the individual author(s) and contributor(s) and not of MDPI and/or the editor(s). MDPI and/or the editor(s) disclaim responsibility for any injury to people or property resulting from any ideas, methods, instructions or products referred to in the content.