Article

Trends and Inequities in the Burden of Depressive Disorders Among Adolescents and Young Adults in the Western Pacific, 1990–2021: Findings from the Global Burden of Disease Study, 2021

1
Institute of Child and Adolescent Health, School of Public Health, Peking University, Beijing 100191, China
2
NHC Key Laboratory of Mental Health, Peking University, Beijing 100191, China
3
National Clinical Research Center for Mental Disorders, Peking University Sixth Hospital, Beijing 100191, China
4
Institute of Mental Health, Peking University Sixth Hospital, Beijing 100191, China
5
State Key Joint Laboratory of Environmental Simulation and Pollution Control, College of Environmental Sciences and Engineering, Peking University, Beijing 100871, China
*
Authors to whom correspondence should be addressed.
Future 2025, 3(2), 10; https://doi.org/10.3390/future3020010
Submission received: 20 January 2025 / Revised: 22 April 2025 / Accepted: 15 May 2025 / Published: 22 May 2025

Abstract

:
Despite growing concern, there is limited comprehensive and up-to-date research on the burden, disparities, and inequalities of depressive disorders in the Western Pacific region. We obtained data from the Global Burden of Disease Study (GBD; 2021) for the Western Pacific region. We reported the prevalence and disability-adjusted life years (DALYs) rates of depressive disorders from 1990 to 2021. Our results showed that the prevalence of depressive disorders in the Western Pacific region was 1723.1 per 100,000 people (95% UI: 1359.2–2164.9), contributing to 1057.3 DALYs per 100,000 (95% UI: 683.0–1551.8). From 1990 to 2021, the burden of depressive disorders initially decreased but then increased, with Japan, Malaysia, and South Korea seeing the most significant rise. The burden grew with age, especially in the 10–14 age group, and exhibited significant sex disparities, especially in this age group. Among 31 countries, those with higher UHC scored had higher prevalence rates, but the gap between high- and low-UHC countries has decreased over time, indicating that countries with lower UHC might face greater challenges in the future. Our results highlight the differences in burden by sex and age call for targeted policies and interventions to promote youth mental health. Accelerating universal health coverage could be a key strategy to further reduce this high burden.

1. Introduction

Depressive disorders are the most prominent mental disorders, and they usually initiate in adolescence [1]. They are characterized by persistent sadness, loss of interest or pleasure, and impairments in daily functioning, representing a key group of non-communicable diseases (NCDs) affecting youth globally. Depressive disorders were the first leading cause of global disability-adjusted life years (DALYs) among mental disorders and suicide among adolescents and young adults [2,3,4]. The Lancet Commission on Sustainable Development for Global Mental Health emphasized that mental health is a fundamental human right and intuitively important for the development of all countries [5], but mental health of adolescents and young adults currently remains neglected, and there is a distinct lack of attention to the burden of disease in the adolescent population in many countries [6]. Therefore, a better understanding of the current prevalence of depressive disorders at the country level would contribute to greater results in the Comprehensive Mental Health Action Plan, 2013–2030 [7].
Approximately 20% of the world’s adolescents and young adults reside in the Western Pacific region. Of these, 5.6 million individuals suffered from depression, resulting in 1.0 million DALYs. Despite this significant prevalence, the burden of depression in the region has received comparatively less attention [2,8]. Few studies have explored the prevalence of depressive disorders in children and adolescents and systematically analyzed the burden of disease for specific regions [9,10,11,12]. The countries in the Western Pacific region exhibit high heterogeneity in resource allocation to adolescent and young adult mental health services, which can significantly hinder investment and rational allocation of resources for mental healthcare [13]. Only 46% of Western Pacific countries report the presence of stand-alone or integrated mental health programs/policies for adolescents and young adults, which falls below the global average [6]. The Western Pacific region is significantly under-represented in terms of both government health expenditure per capita and the number of mental health staff in child and adolescent services [6]. The irrational distribution of these policies and resources may be attributed to differences in socioeconomic development levels and health coverage in the Western Pacific countries. Therefore, special attention needs to be paid to the burden of depressive disorders among adolescents and young adults in the Western Pacific region.
From a theoretical perspective, depressive disorders in adolescents and young adults are influenced not only by individual-level risk factors (e.g., genetic vulnerability, personality traits, and life events) but also by broader social determinants of health (SDH), such as income, education, gender inequality, social support, and access to services. The SDH framework has been widely used in global public health to explain how upstream socioeconomic and structural factors shape downstream health outcomes, including mental health [14]. In adolescence—a life stage sensitive to environmental stressors—the interaction between these determinants and healthcare systems becomes especially salient.
Socio-demographic indices are used to reflect the status of social and economic development and have been widely employed to explore the association between social and economic development and disease burden. However, these indices have yet to fully consider some essential factors including health. It has been reported that the Social Development Index is only moderately correlated with the DALYs rate caused by non-communicable diseases, suggesting the need to consider other indicators in the burden of depression. The World Health Organization emphasizes the critical importance of achieving universal health coverage in addressing the agenda for non-communicable diseases[15]. Universal Health Coverage (UHC)—defined as ensuring that all people receive the health services they need without financial hardship—may affect the burden of depressive disorders through three mechanisms: accessibility, affordability, and quality of care. UHC remains a distant goal for adolescents’ health, as they often encounter inadequate coverage, subpar quality of care, and significant financial burdens from healthcare expenses. This demographic, comprising 1.2 billion individuals globally according to the World Health Organization (WHO), necessitates tailored attention to their unique health requirements for any hope of achieving universal health coverage [16]. Therefore, exploring the association between UHC and the burden of depressive disorders can be used to ensure that all adolescents and young adults have access to the quality mental health services they need. In addition, analyzing differences in the burden of depressive disorders and detecting changes in health inequality based on the UHC effective coverage levels across Western Pacific region provides valuable evidence for the formulation of relevant programs, practices, and policies aimed at enhancing overall health [17].
In this study, using data from the Global Burden of Disease Study (GBD; 2021), we aimed to describe the trends in prevalence and DALYs rate of depressive disorders among adolescents and young adults, aged 10–24 years, in 31 member states of Western Pacific region from 1990 to 2021, and then we explored the relationships between the prevalence and DALYs rate of depressive disorders and the UHC effective coverage index; finally, age- and sex-specific inequalities in the depressive disorders burden were assessed.

2. Materials and Methods

2.1. Data Sources

The GBD (2021) provided estimates of DALYs, years lived with disability, years of life lost, prevalence, and incidence for 371 diseases across 21 regions, 204 countries and territories, 23 age groups, and both sexes from 1990 to 2021 [18]. The input data are derived from population censuses, household surveys, civil registrations, population dynamics statistics, disease registries, healthcare service utilization, air pollution monitoring, satellite imaging, disease notifications, and other sources. Specific cause mortality rates and death scores are computed using the Cause of Death Ensemble model and spatiotemporal Gaussian process regression. The Bayesian meta-regression modeling tool DisMod-MR 2.1 is employed to ensure consistency among the incidence, prevalence, remission, excess mortality rates, and specific cause mortality rates for most causes. Uncertainty intervals (UI) for each indicator are generated using the 25th and 97.5th ordered values from 1000 draws of the posterior distribution. Detailed information has been extensively reported in previous articles [19].
We conducted an analysis that focuses on the prevalence and DALYs of depressive disorders in adolescents and young adults aged 10-24 years in the 31 countries of the WHO Western Pacific regions from the Global Health Data Exchange. The dataset used for our analysis is available at https://vizhub.healthdata.org/gbd-results/ (accessed on 11 May 2024). We focused on the population aged 10–24 years, given this demographic period is a crucial stage of growth and development, with individuals undergoing significant biological and substantial social role transitions [20,21]. We summarized these data sources for 31 countries and territories of interest, related to depressive disorders in the 10–24 age range, in the Supplementary Text (Overview on data coverage). In addition, we chose the European Union (EU) region as a comparative benchmark for the analysis of the burden of depression, because of its notable increases in the burden of depression in the past three decades [9] and all EU Member States being in high–middle and high SDI levels. GBD adheres to ethical principles for data collection and use, with the study having been approved by the University of Washington (Seattle, WA, USA) Institutional Review Board.

2.2. Data and Definitions

Depressive disorders were diagnosed according to the 10th edition of the International Classification of Diseases (ICD-10), including major depressive disorders and dysthymia. The analysis of epidemiological data related to depressive disorders in the GBD study consists of two parts. Firstly, biases in epidemiological estimates reported across studies were assessed and corrected. Secondly, the “gold standard” estimates (i.e., those requiring no bias adjustment) and adjusted estimates where we modeled using DISMod-MR 2.1 in a meta-regression analysis. DISMod-MR 2.1 is a Bayesian meta-regression tool that synthesizes data from different sources to produce internally consistent estimates of incidence, remission, and excess mortality rates by age, sex, location, and year. The detailed calculation process has been reported in previous studies [22]. Estimates were generated using simulated outputs from surrounding locations for areas with partially high-quality raw epidemiological data [22].
The UHC effective coverage index was constructed based on 23 effective coverage indicators covering 5 areas of health services, including promotion, prevention, treatment, rehabilitation, and palliative care. The UHC effective coverage index ranges from 0 to 100, with higher values indicating that the country has higher quality health services for the entire population [13].

2.3. Statistical Analysis

We first reported the rate (per 100,000 population) and number with corresponding 95% UIs of prevalence and DALYs and showed the percentage change (95% UIs) of prevalence and DALYs rate by sex ( male, and female) and age (10–14, 15–19, and 20–24 years) between 1990 and 2021, and then we compared sex and age differences in the prevalence and DALYs of depressive disorders in adolescents and young adults aged 10–24 years in the Western Pacific region. In addition, we analyzed the associations of the prevalence and DALYs rate of depressive disorders with the UHC effective coverage levels using the Spearman correlation.
Finally, we used the Health Equity Assessment Toolkit developed by WHO to explore inequities in the burden of depressive disorders [23]. We calculated two indicators of health equity, including the relative concentration index (RCI) and slope of inequality index (SII). The RCI values range from −100 to +100 (zero indicates no inequality) and positive values indicate a concentration of the burden among the higher UHCI countries, while negative values indicate a concentration of the burden among the lower UHC countries. The greater the absolute value of RCI, the higher the level of inequality. Likewise, the interpretation of SII is the same as RCI.

3. Results

3.1. Burden of Depressive Disorders Among Adolescents and Young Adults Aged 10–24 Years in the Western Pacific Region in 1990–2021

In 2021, a total of 5.84 (95% UI: 4.61, 7.34) million adolescents and young adults suffered from depressive disorders, which has caused 1.06 (95% UI: 0.68, 1.55) million DALYs. The prevalence and DALYs rate of depressive disorders was 1723.114 (95% UI: 1359.21, 2164.91) and 311.91 (95% CI: 201.50, 457.80) per 100,000 population, respectively, with a 4% and 5% increase from 2019 to 2021. In addition, the prevalence and DALYs rate increased with age, with the 10–14 years age group having the highest burden of depressive disorders and the most significant increasing trend (Table 1 and Table S1).
Among 31 countries and territories in the Western Pacific region, Australia [5592.03 (95% UI: 3994.14, 7567.77)], New Zealand [4937.38 (95% UI: 3618.19, 6703.87)], and Guam [3251.84 (95% UI: 2296.25, 4497.79)] showed the highest prevalence rate of depressive disorders in 2021, while China [1265.38 (95% UI: 1013.95, 1581.38)], American Samoa [1971.18 (95% UI: 1407.57, 2729.65)], and Viet Nam [1992.08 (95% UI: 1387.38, 2726.51)] had the lowest prevalence rate of depressive disorders (Table 1 and Figures S1 and S2). From 1990 to 2021, Japan, Malaysia and Republic of Korea saw the greatest increase in the prevalence rate of depressive disorders, with percentage change and corresponding 95% UI of 37% (29%, 45%), 32% (9%, 59%), and 29% (5%, 54%), respectively. Conversely, the greatest decreases in the prevalence rate were in China, Singapore, and Kiribati, with percentage change of −34% (−29%, −40%), −18% (−1%, −34%), and −2% (−19%, 20%), respectively (Table 1 and Figure S1). In 2019 and 2021, we only found China with a decreasing change in the burden of depressive disorders. The trends in the number and rate of DALYs due to depressive disorders were consistent with the prevalence in the Western Pacific region in the past three decades (Table S1 and Figure S2).

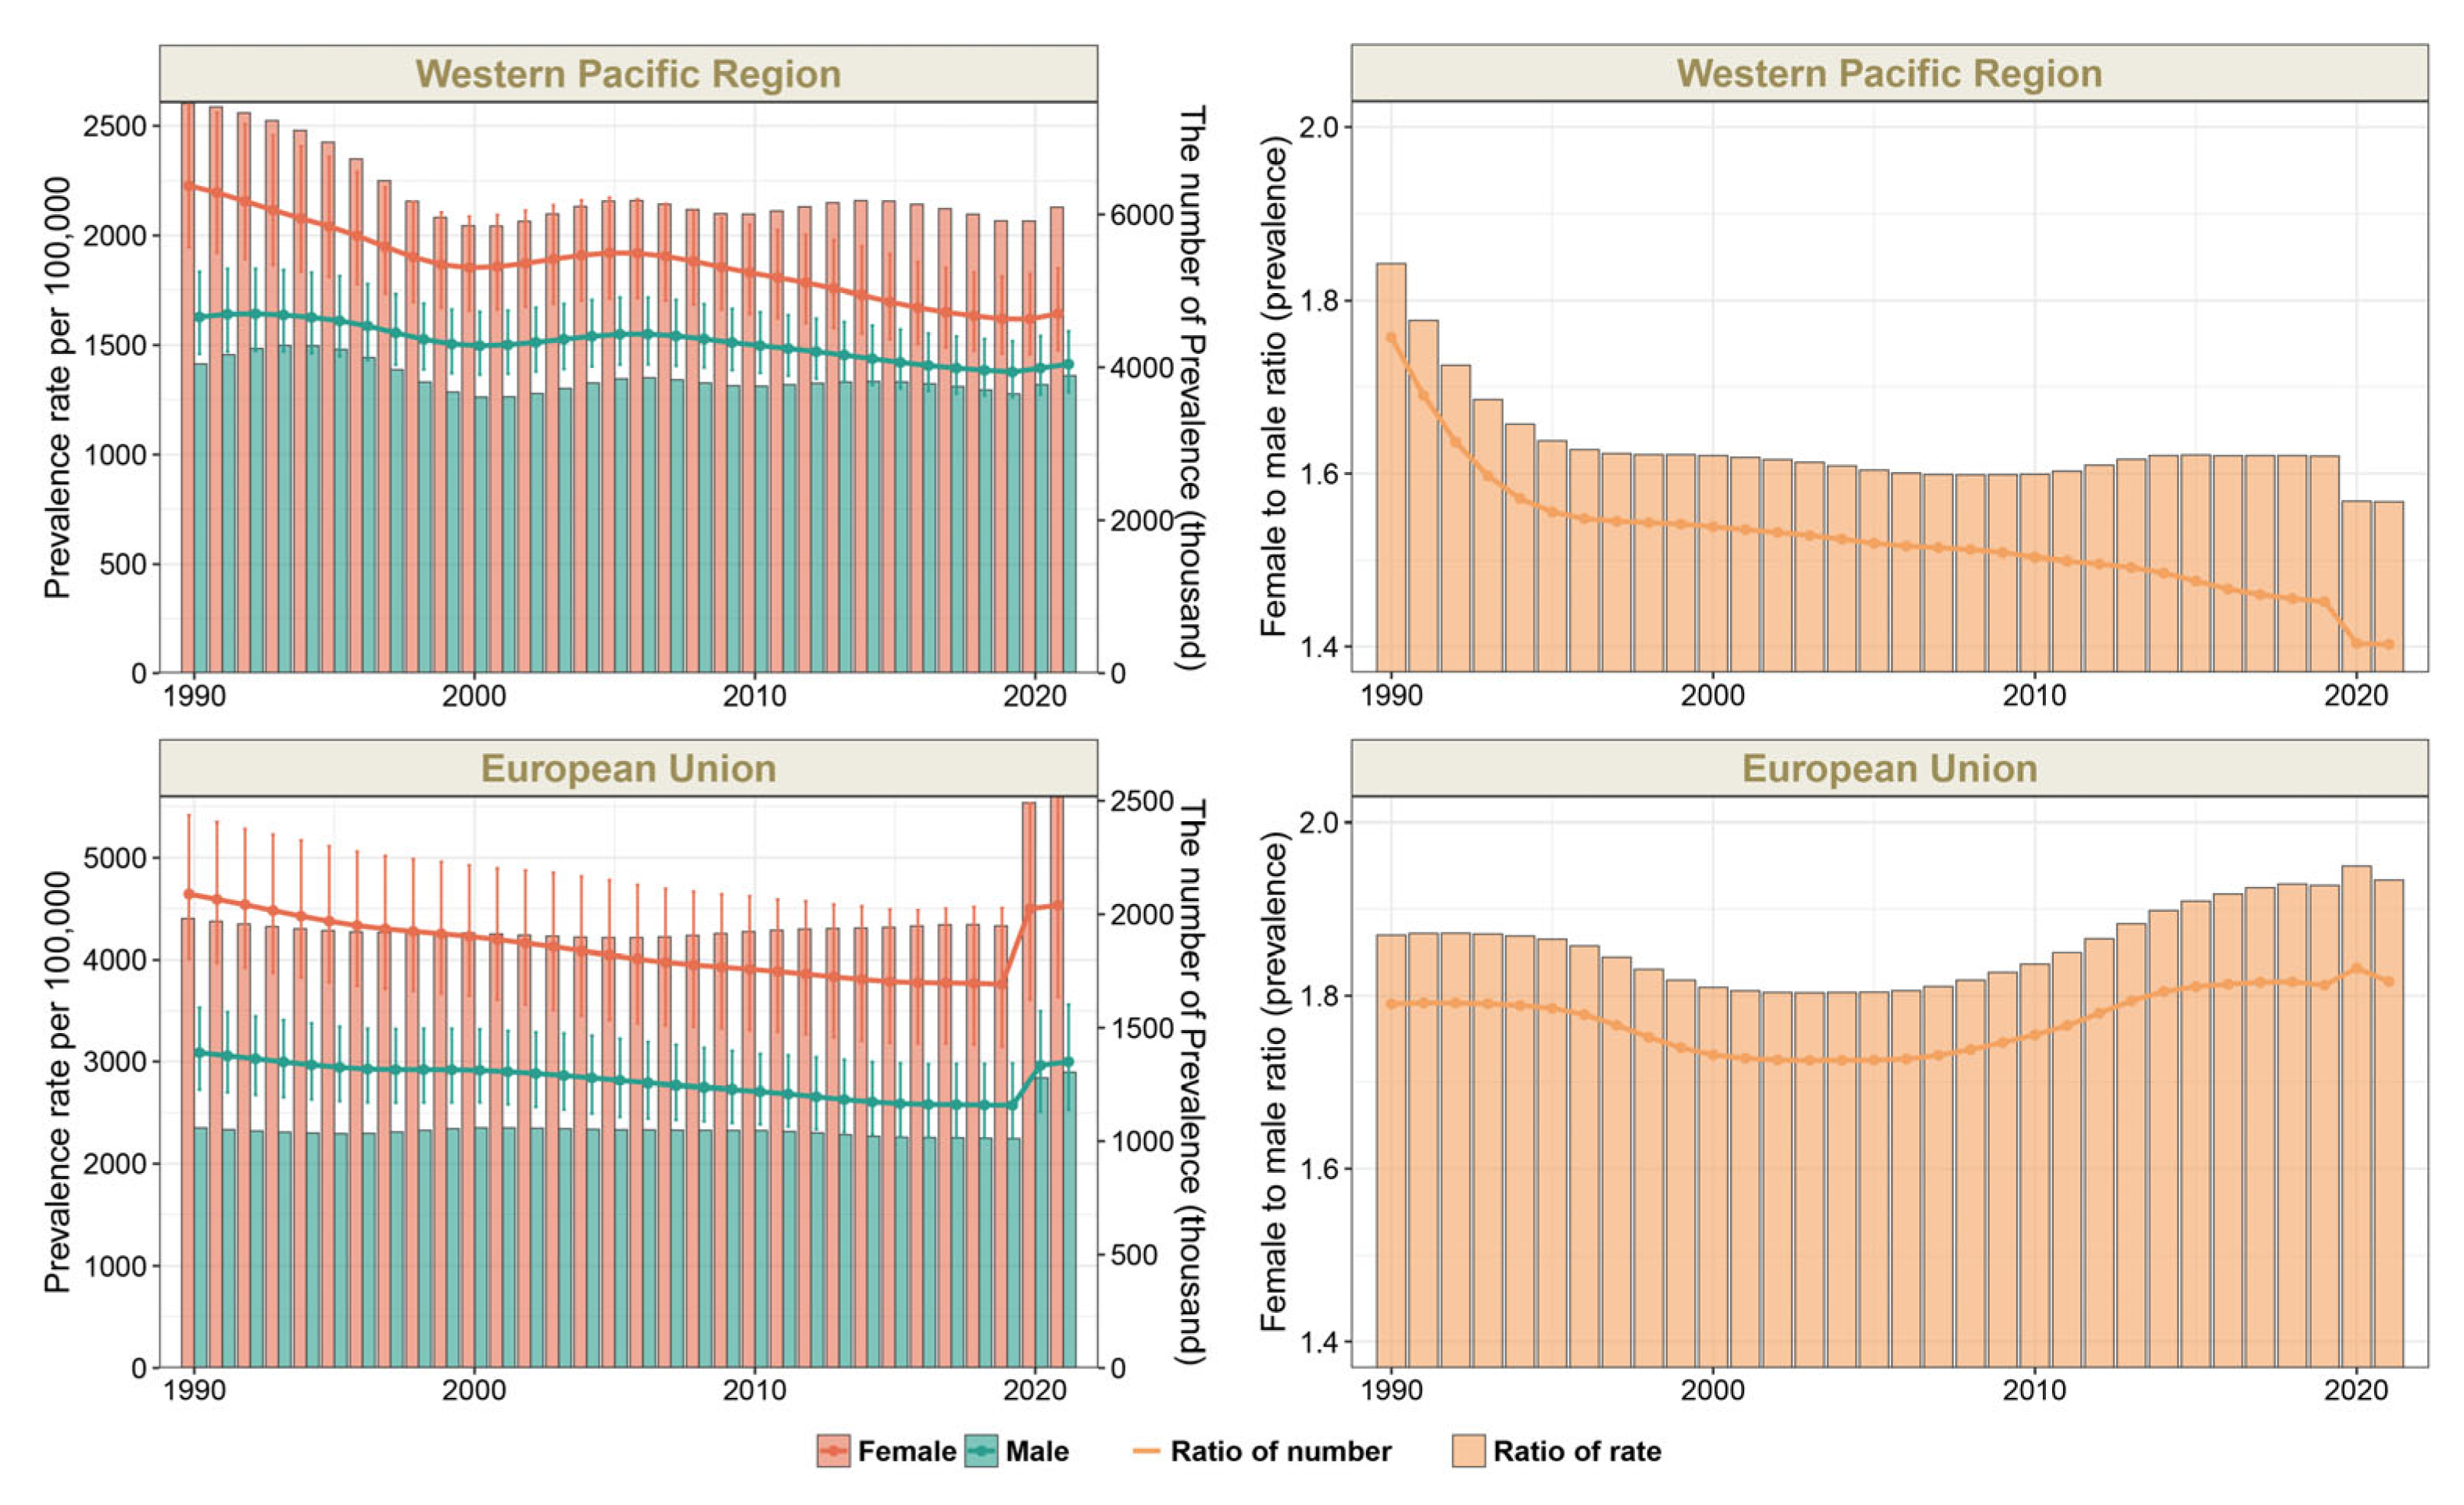
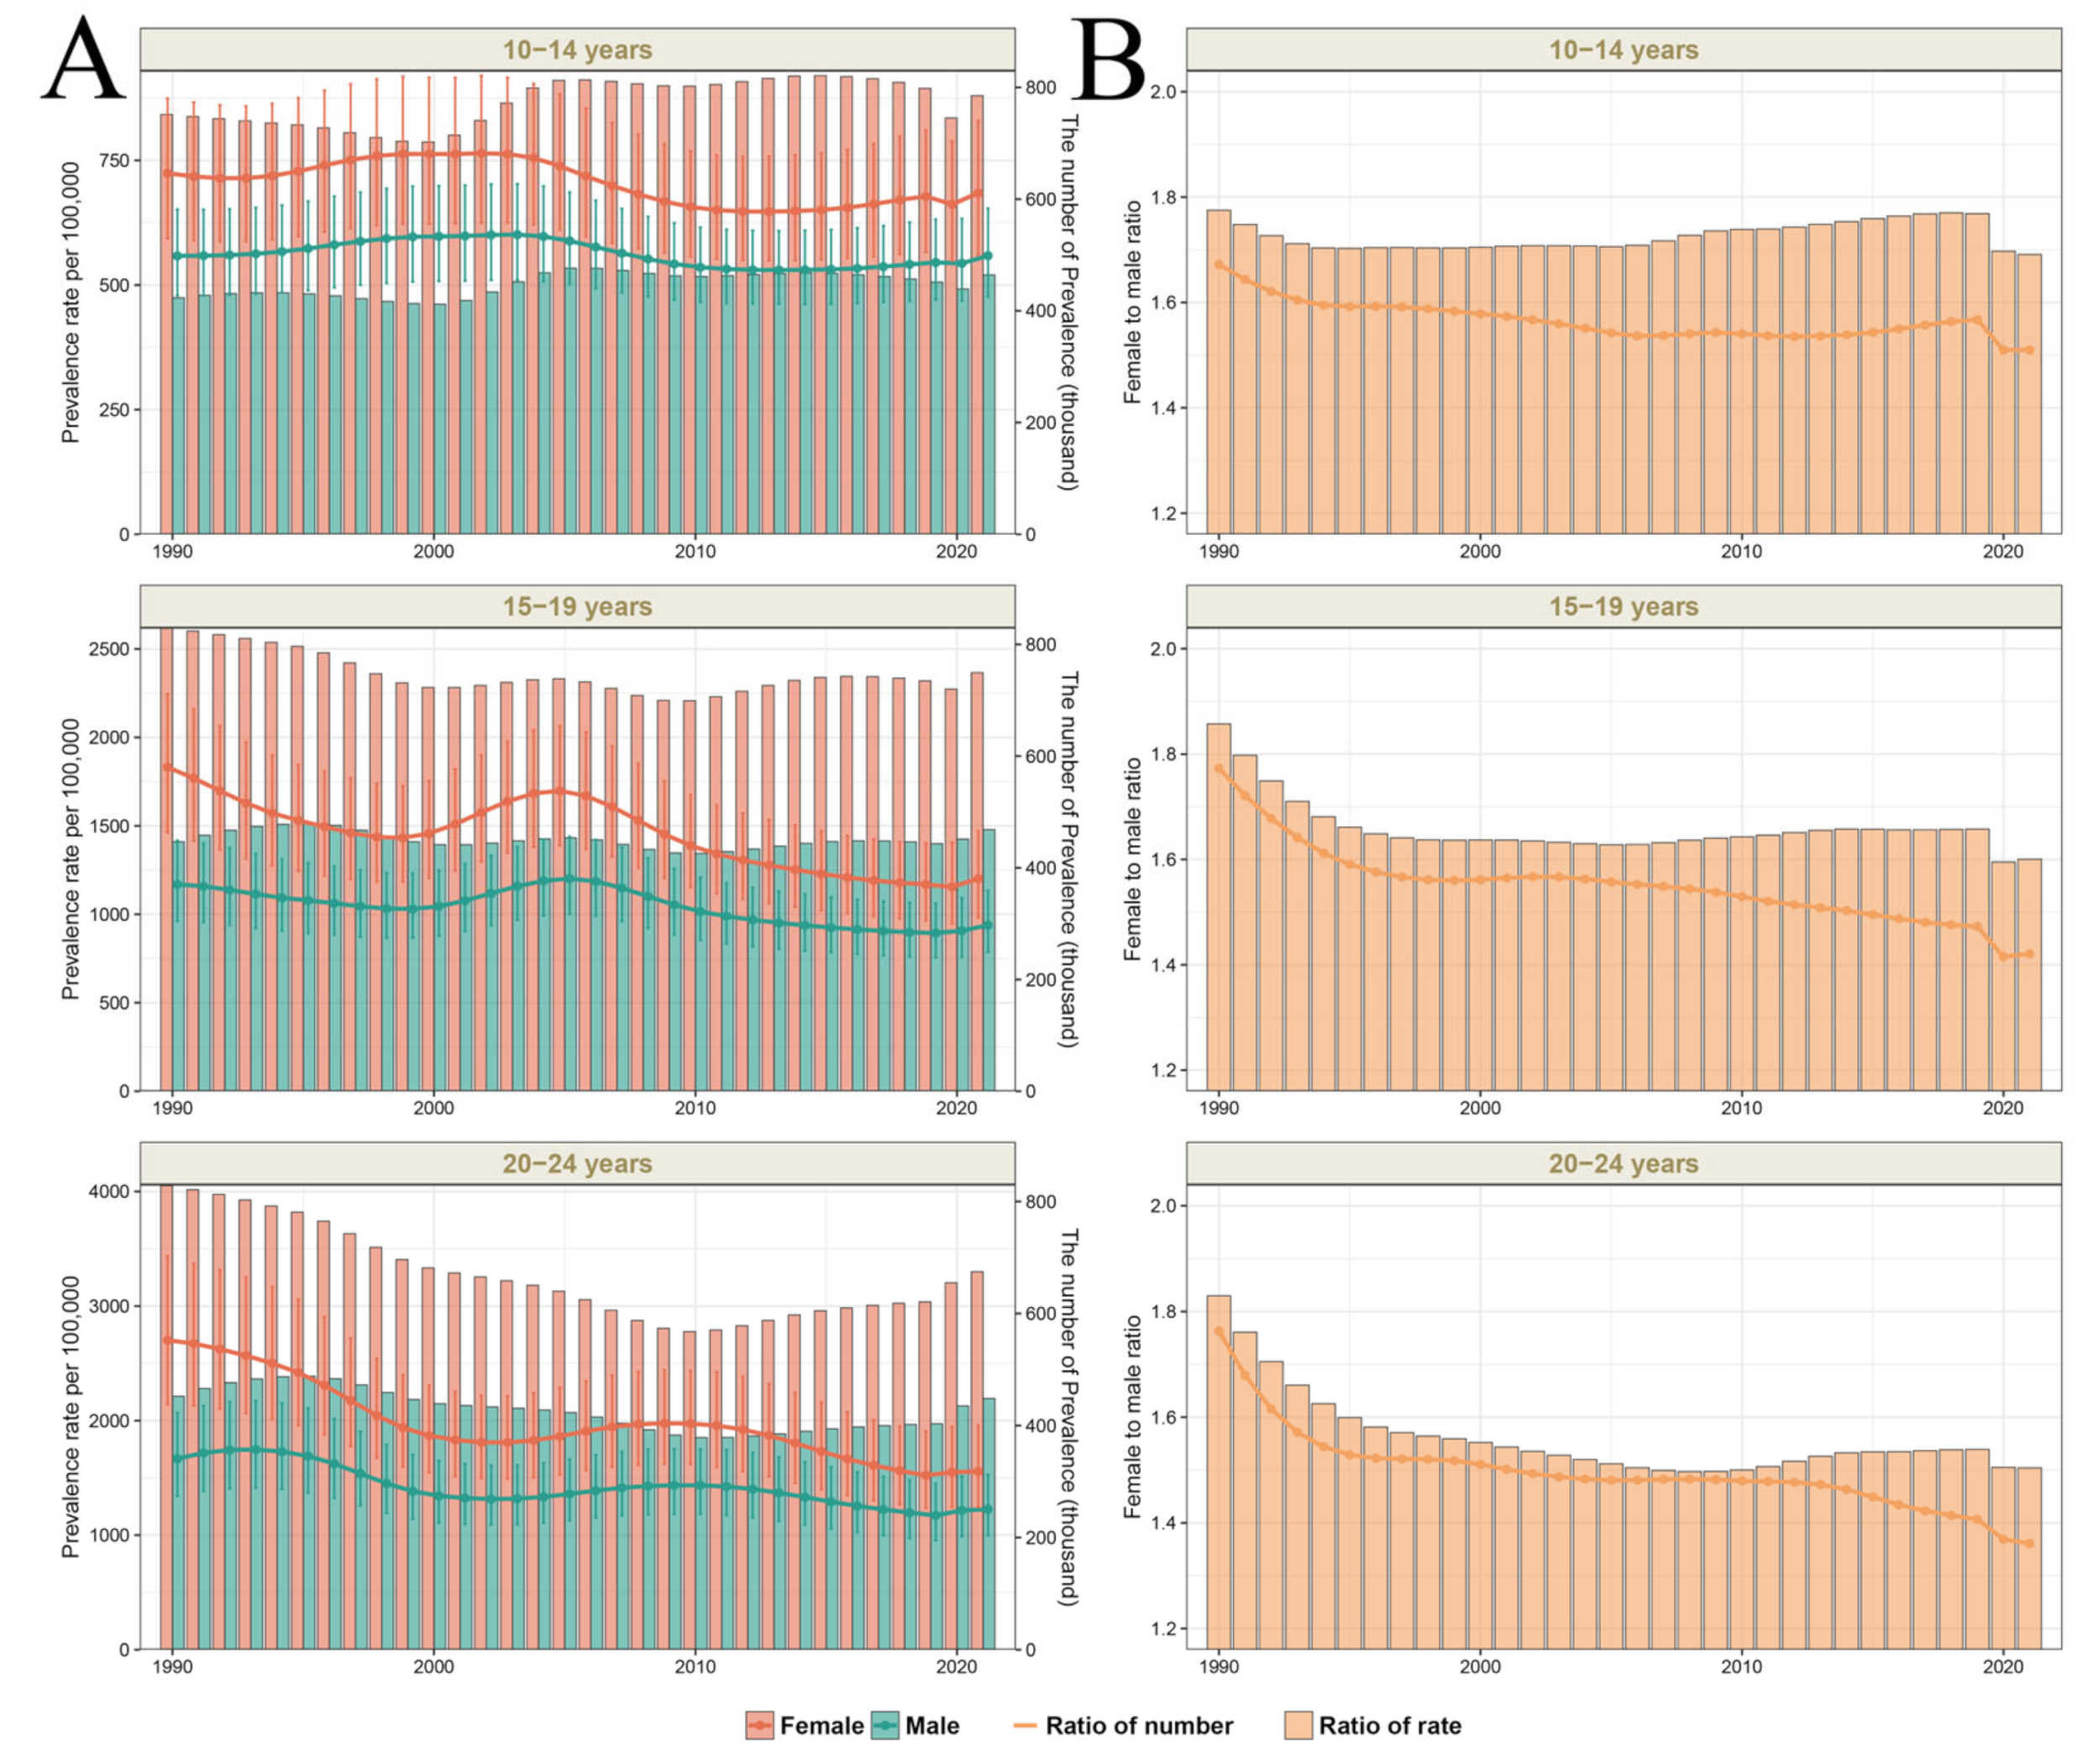
3.2. Sex Differences Among Adolescents and Young Adults Aged 10–24 Years in the Western Pacific Region in 1990–2021

Figure 1 demonstrates a decrease in sex disparity regarding the burden of depressive disorders in the West Pacific region, as evidenced by the decreasing ratio of DALYs for females to males, from 1.84 in 1990 to 1.58 in 2021. In contrast, the sex difference in the burden of depressive disorders in the European Union exhibits a clear ‘U’ shape over time, reaching its lowest point in 2003 and exhibiting the most pronounced difference in 2020. We found that sex differences in depressive disorders narrowed with age among 10–24-year-olds in the Western Pacific region from 1990 to 2021, with the greatest disparity being in the 10–14 age group (Figure 2 and S3 and S4). Across 31 countries and territories of the Western Pacific region, the burden of depressive disorders among males and females in each country is not the same, and the sex differences are also different, with the most significant differences observed in Australia, New Zealand, and China. In most countries and territories in the Western Pacific, the sex gap in depressive disorders decreases as individuals age. However, sex differences were most significant among population aged 20–24 years in Brunei Darussalam, Japan, Mongolia, Singapore, and the Republic of Korea (Tables S2 and S3 and Figures S5 and S6).

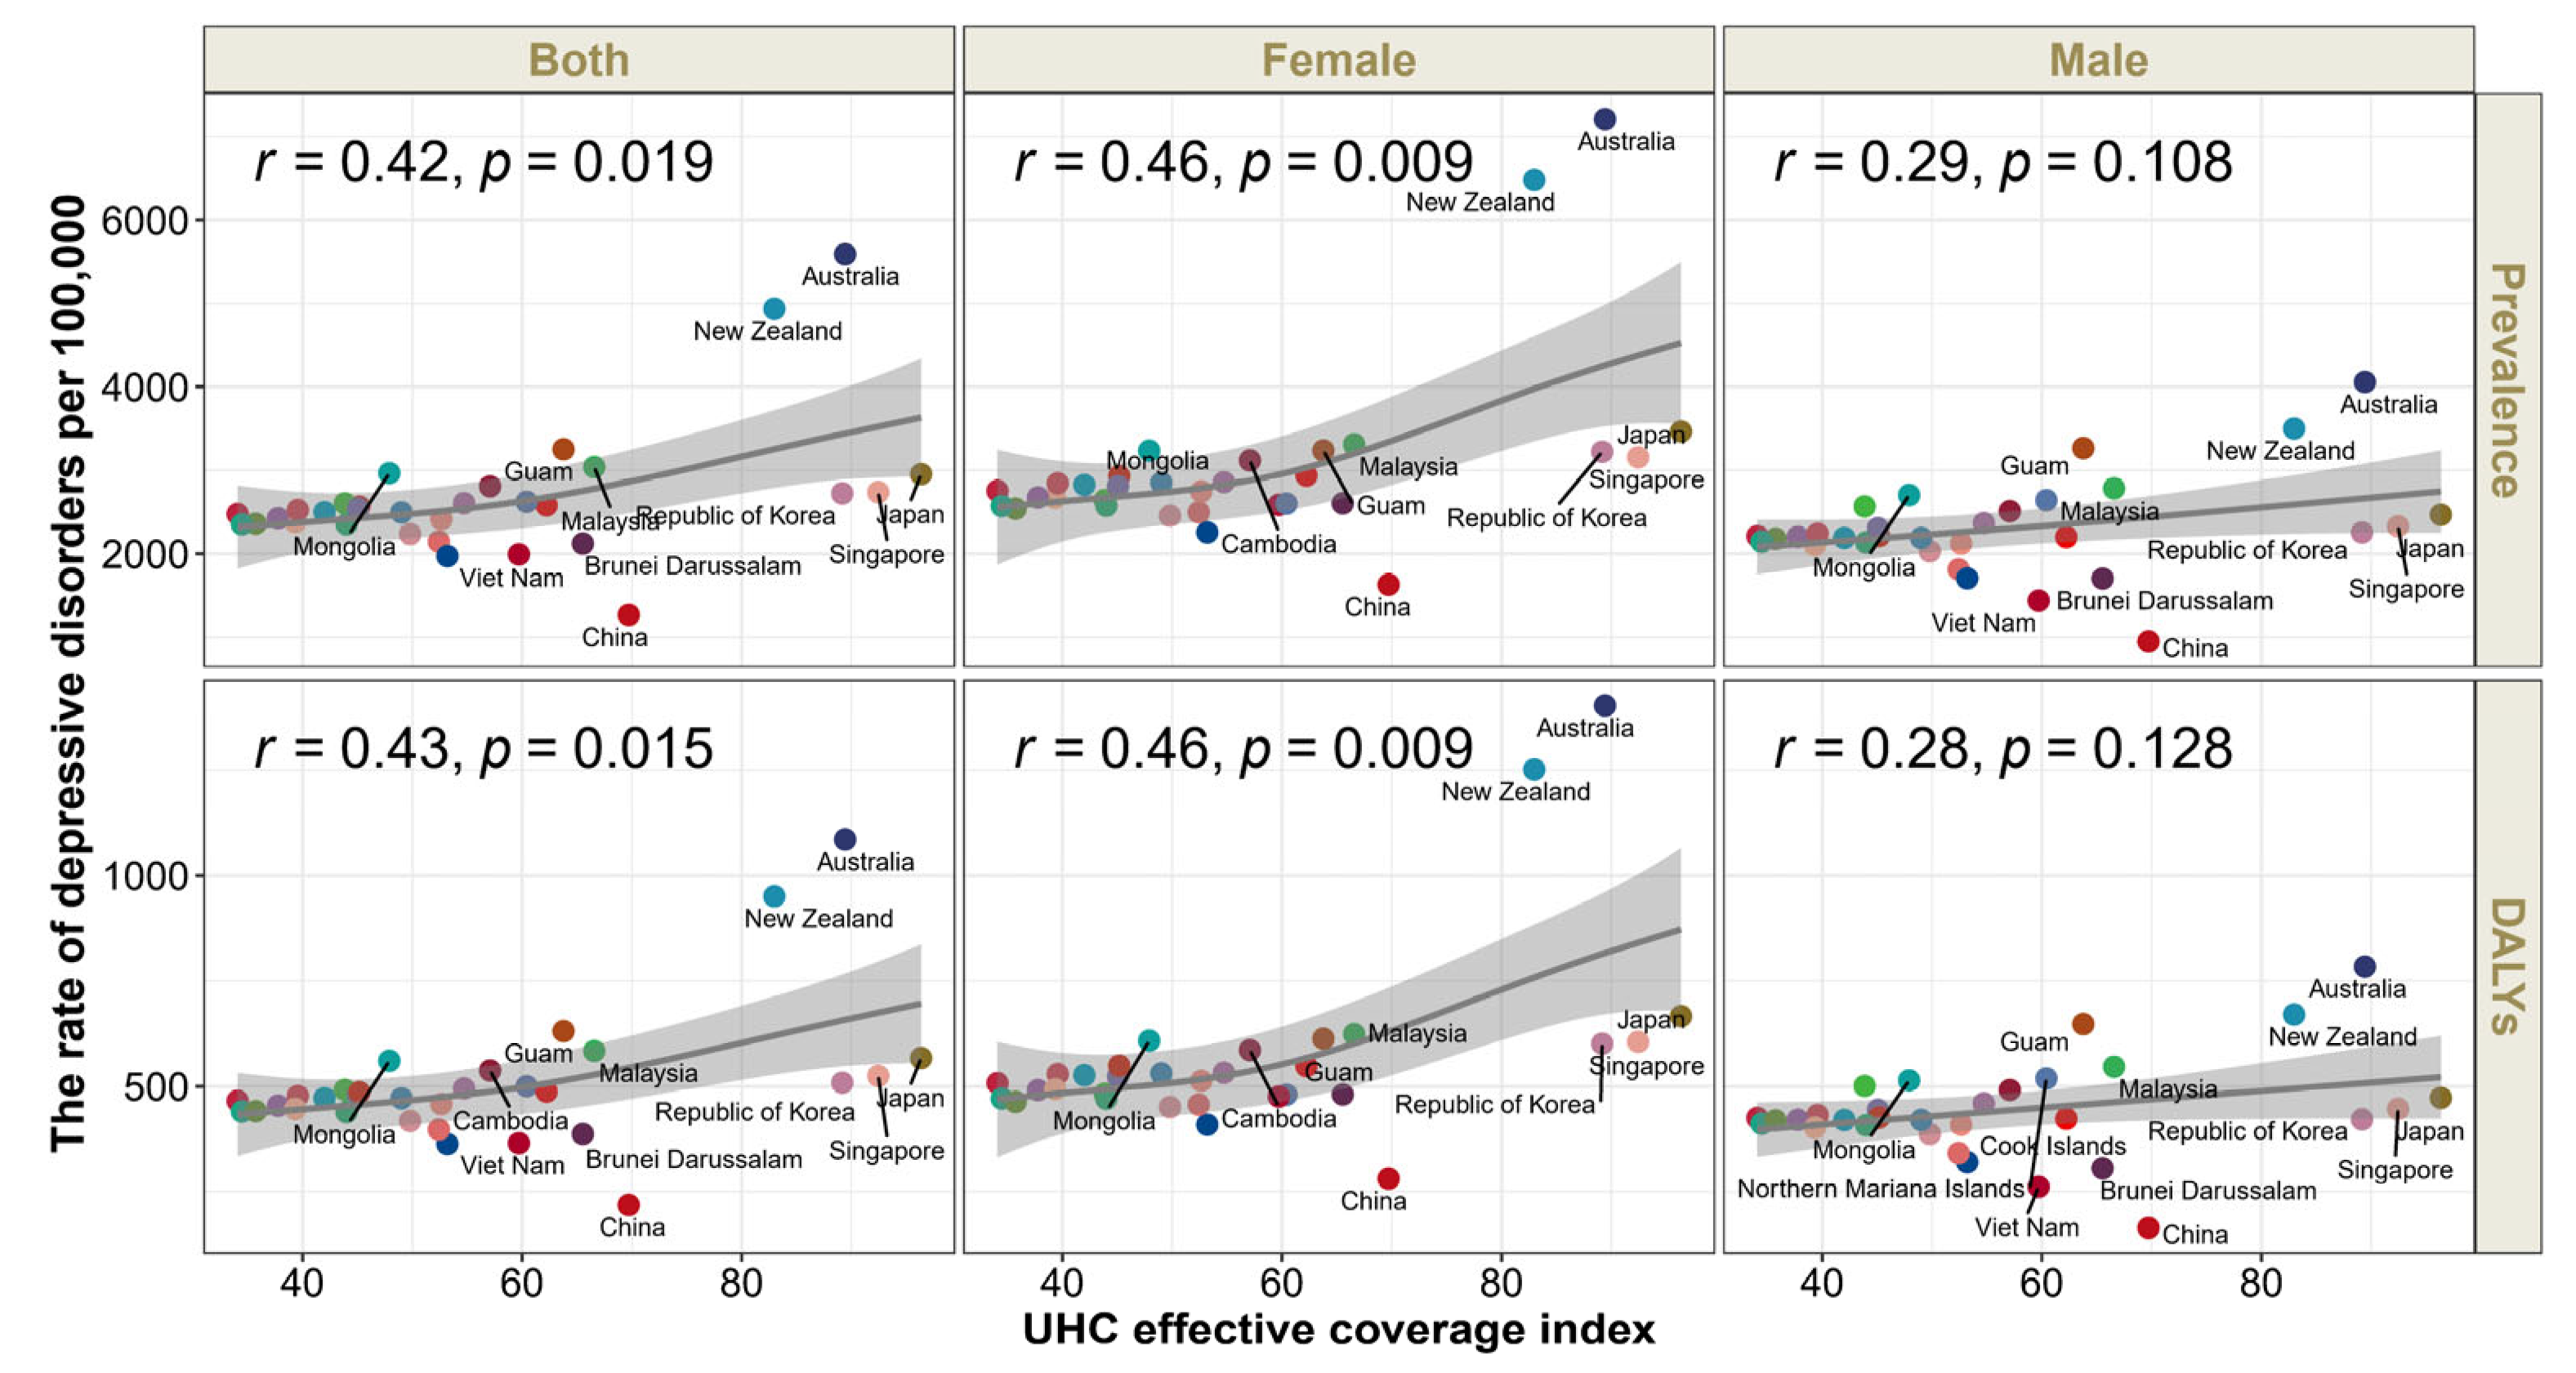
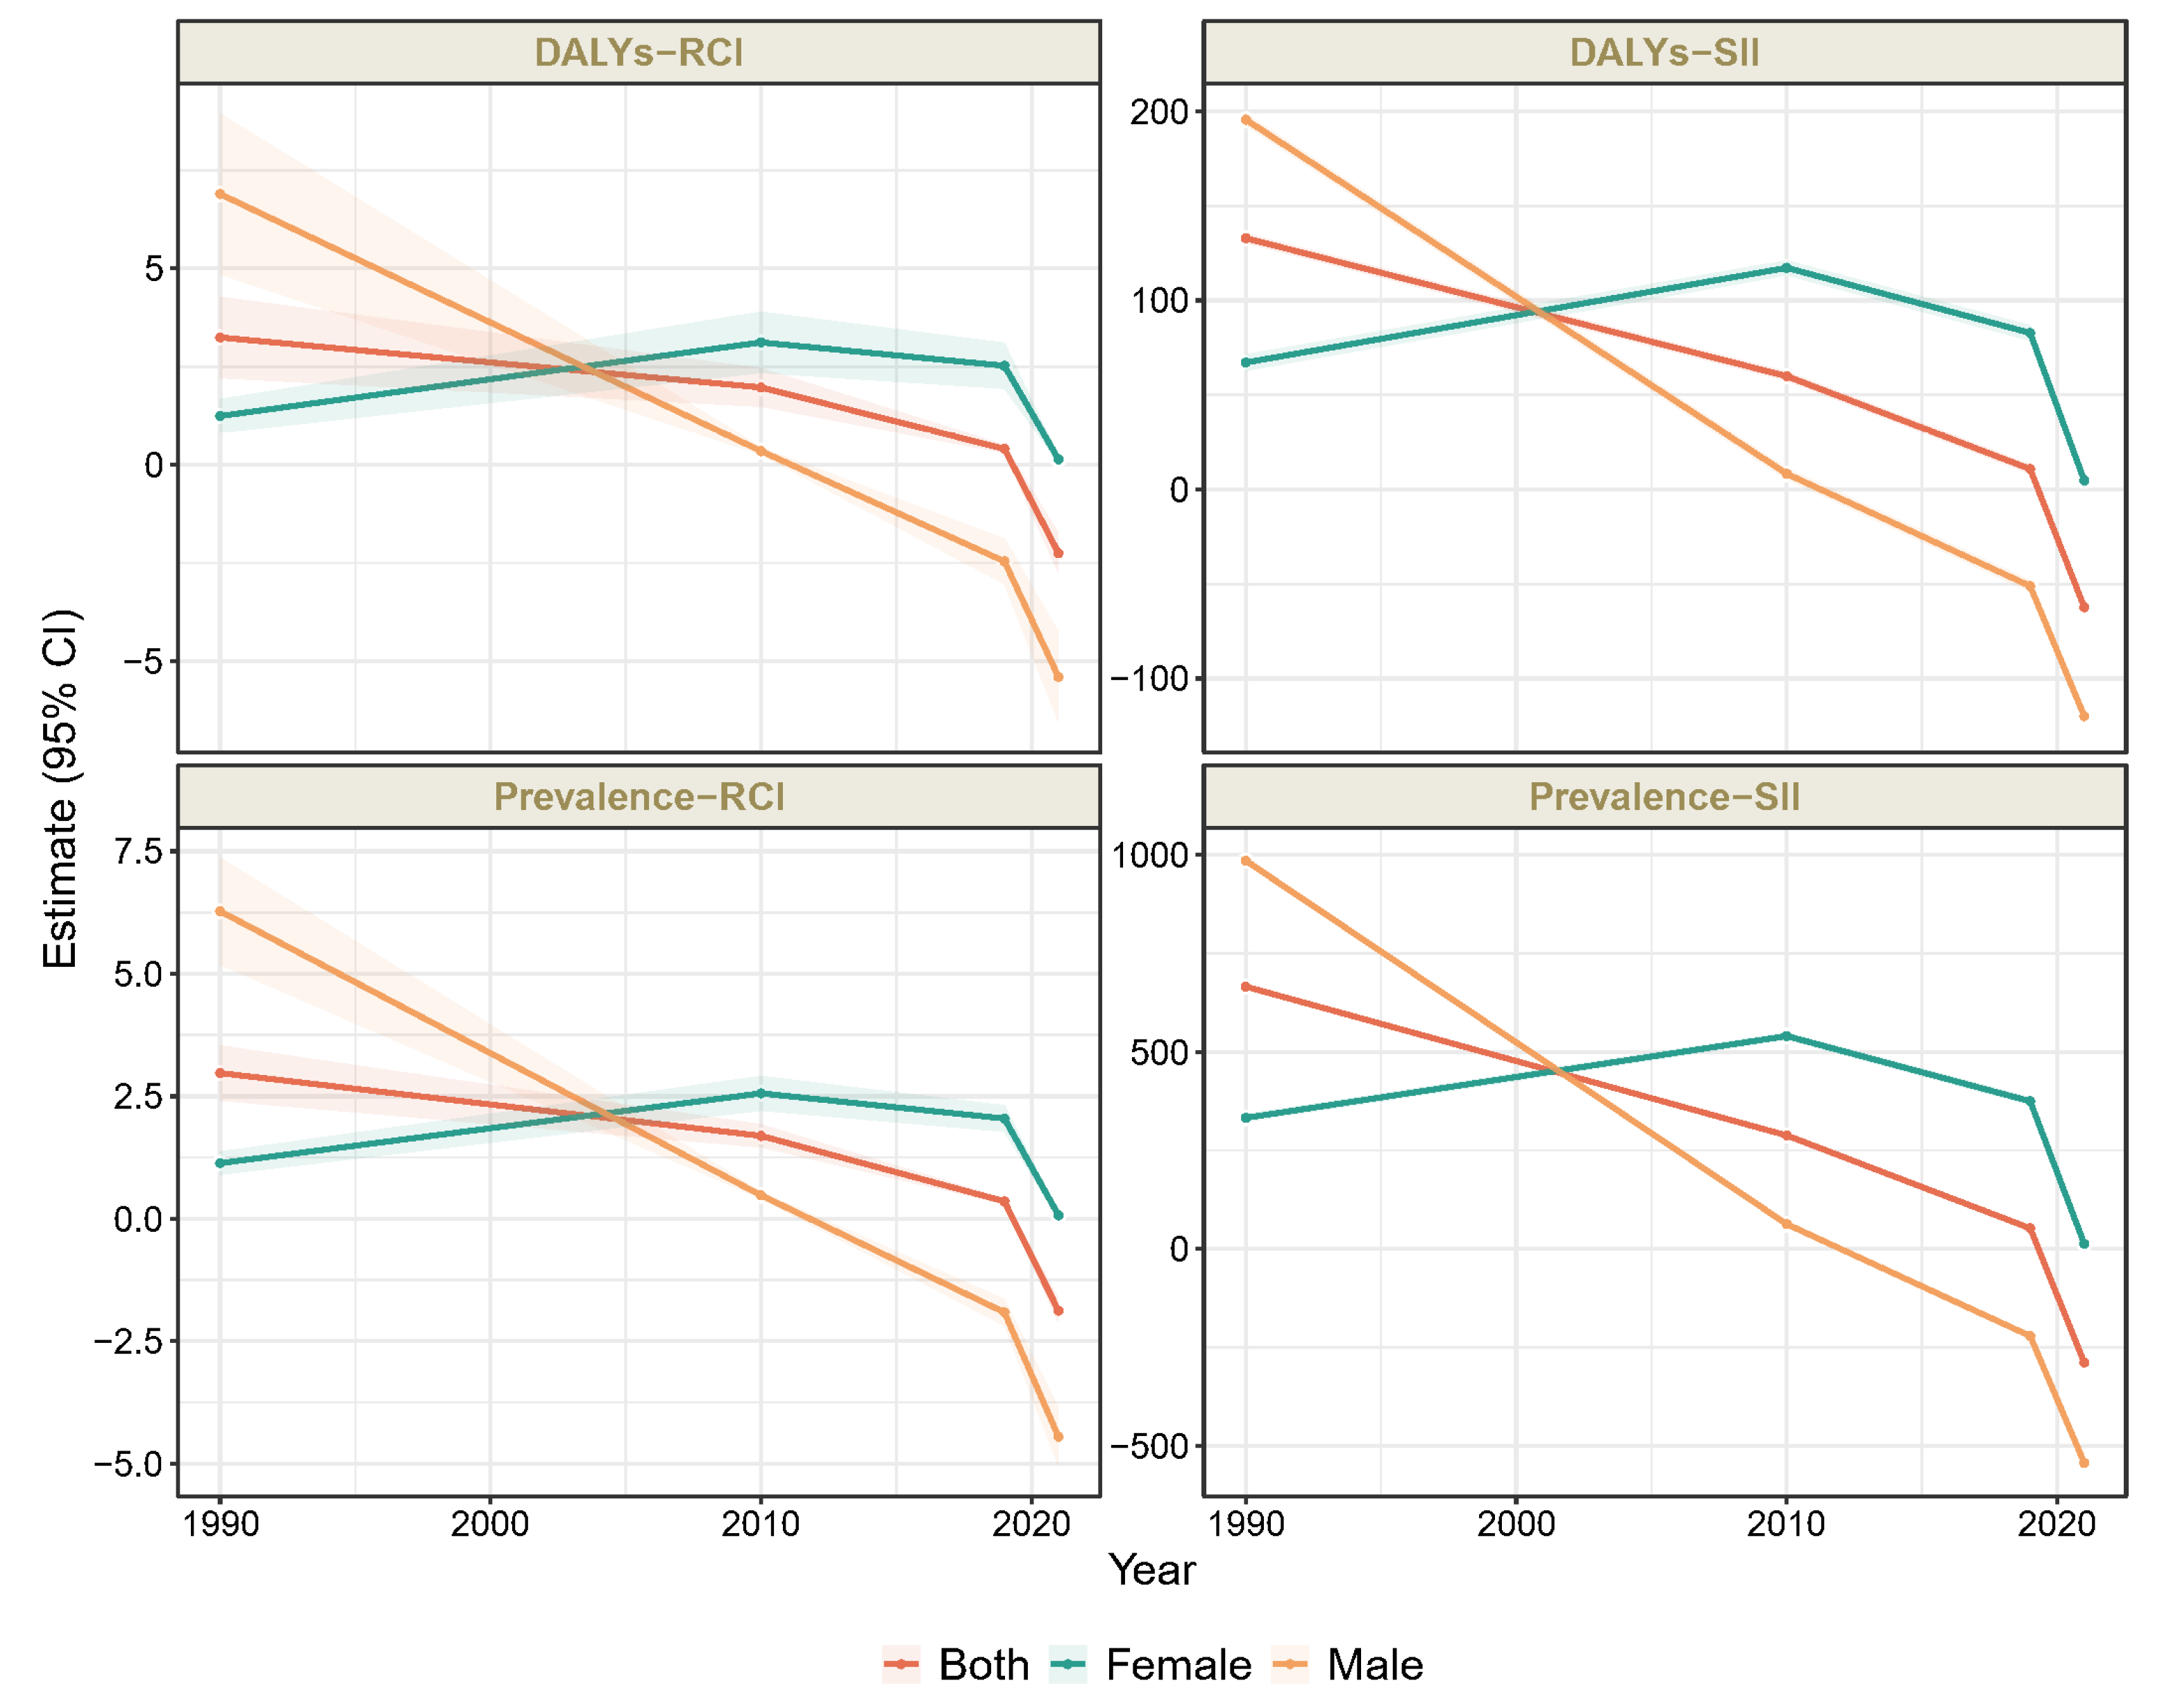
3.3. UHC Effective Coverage-Related Health Inequality in Depressive Disorders Among Adolescents and Young Adults Aged 10–24 Years in the Western Pacific Region

Figure 3 shows that the depressive disorders burden is significantly associated with the UHC effective coverage levels, especially in the female group, which indicated that countries with higher UHC effective coverage levels experienced a higher depressive disorders burden compared to those with lower UHC effective coverage levels in 2021. Additionally, we found that depressive disorders burden, stratified by age, was most strongly associated with the UHC effective coverage level in the 10–14-year-old group (Figures S7–S9).
Figure 4 and Table S4 show the trend in the UHC effective coverage-related health inequality for the burden of depressive disorders in people aged 10–24 years in the Western Pacific region, and there were significant inequalities in the burden of depressive disorders across countries with various UHC effective coverage levels. The gap in prevalence rate between countries with the highest and lowest UHC effective coverage level was narrowed considerably from 1990 to 2021, which indicated that the burden of depressive disorders is shifting towards countries with lower UHC. Specifically, the SII changed from 665.48 (95% CI: 659.47, 671.50) in 1990 to −287.89 (95% CI: −293.72, −282.06) in 2021, and the RCI changed from 2.97 (95% CI: 2.41, 3.53) in 1990 to −1.88 (95% CI: −2.12, −1.63) in 2021. The similar gap in prevalence rates between countries with the highest and lowest UHC effective coverage level was also narrowed considerably from 1990 to 2021 for both females and males. The SII narrowed from 332.75 (95% CI: 322.92, 342.58) in 1990 to 13.31 (95% CI: 3.93, 22.69) in 2021, and the RCI narrowed from 1.14 (95% CI: 0.90, 1.37) in 1990 to 0.07 (95% CI: 0.02, 0.12) in 2021 in female and the SII decreased from 984.81 (95% CI: 977.68, 991.94) in 1990 to −543.21 (95% CI: −550.40, −536.02) in 2021, and the RCI decreased form −6.28 (95% CI: 5.18, 7.36) in 1990 to −4.45 (95% CI: −5.05, −3.86) in 2021 in male.

4. Discussion

In 2021, the Western Pacific region reported nearly 5.84 million people suffered from depressive disorders in young people aged 10–24 years, which have caused over 1.06 million years of DALYs. The burden of depressive disorders in Western Pacific countries shows a downward and then an upward trend. Notably, the burden of depressive disorders increased significantly in countries such as Japan, Malaysia, and the Republic of Korea. The burden of depressive disorders increased significantly in the 10–14-year-old group between 1990 and 2021, while the burden of depressive disorders increased most significantly in the 20–24-year-old group between 2019 and 2021. From 1990 to 2021, the sex difference in the burden of depressive disorders gradually decreased. The sex difference decreased with age and is most pronounced in the 10–14 age group. Countries with higher UHC effective coverage levels bore a disproportionate burden overall in 2021, and the magnitude of this UHC effective coverage level-related inequalities decreased over time. This study highlights the need for a greater emphasis on preventing depressive disorders in countries with high UHC effective coverage and may require more resources to detect depressive disorders in countries with low UHC effective coverage indices.
The Western Pacific region has made significant progress in implementing policies or plans for child and mental health. In 2007, no countries in the region had such policies or programs; however, by 2017, 46% of countries had implemented them [6]. In 2020, government spending on mental health in the Western Pacific region increased by a factor of 5.28 (5.81/1.10) as compared to 2017 [6]. Furthermore, the number of mental health workers (median, per 100,000 population) in the Western Pacific region rose from 8.7 in 2014 to 15.4 in 2020 [6]. The decrease in the burden of depressive disorders among adolescents and young adults in the Western Pacific region can be attributed to policy, financial, and human resource inputs. Nevertheless, during the period 2019–2021, in the vast majority of Western Pacific countries, increased levels of exposure to stressful life events, prolonged home confinement, brutal grief, intra-familial violence, and excessive use of the internet and social media have significantly increased the prevalence of mental illness in adolescents and have also led to a widening gap in mental health services [24,25]. COVID-19 likely played a pivotal role in changing mental health dynamics, especially through the reduced access to in-person healthcare and rising psychosocial stress. These factors should be discussed more explicitly as they help contextualize the sharp increases seen during 2019–2021.
Early adolescents are more prone to depression mainly because their physiological development, emotional regulation, social adaptation, and psychological resilience are still immature, making them vulnerable to academic pressure, peer relationships, and family environment. We also found significant sex differences in the group of adolescents and young adults aged 10–24 years in the Western Pacific region. Since the 1970s, when Myrna Weissman first emphasized sex differences in depressive disorders [26],they have been extensively studied in clinical and community samples [27,28]. In a meta-analysis involving data from 1,716,195 individuals and 1,922,064 individuals from over 90 different countries, results revealed that sex differences in depressive disorders emerge earlier than previously thought, manifesting as early as the age of 12. The differences peak during adolescence (13–16 years), subsequently decline, and remain stable in adulthood. Moreover, significant variations in these sex differences were observed among different countries [29]. This is entirely consistent with the findings of our study. The emergence of sex differences in depressive disorders burden may, on the one hand, be due to a combination of temperament and stress[29]. On the other hand, girls with early puberty experience more disadvantages (e.g., peer sexual harassment) in early adolescence leading to consequences such as depressive disorders compared with boys and girls with on-time puberty. In the early puberty explanation, the narrowing of the sex gap in depressive disorders in adulthood may be due to the effects of early puberty diminishing over time, especially after 10 years or more [30,31,32]. These results underscore the urgent need for gender-sensitive interventions, particularly during puberty, including school-based mental health education and community-level protection against gender-based harassment.
In 2021, we discovered a notable positive correlation between the UHC effective coverage index and depressive disorders. Our analysis also examined the inequities in cross-country depressive disorder burdens using the Health Equity Assessment Toolkit of WHO. We identified that countries with higher UHC effective coverage index incurred a considerable burden of depressive disorders in contrast to their counterparts. However, this inequality reduced with the passage of time. Living with a high UHC effective coverage level is widely recognized as resulting in better access to and enjoyment of higher-quality healthcare services, which may ultimately lead to a lower burden of disease. This study identified an unexpected correlation between the burden of depressive disorders and the UHC effective coverage levels, attributable to various factors. Firstly, diagnostic heterogeneity across countries (ICD vs. DSM criteria, evolving versions, and cultural applicability) likely contributed to the variation [33]. Additionally, many countries have rudimentary child and adolescent health systems with low coverage and limited accessibility to healthcare resources, especially in low- and middle-income countries. This hinders the effective identification of patients with mental disorders in these countries, leading to an underestimation of the burden of mental illness [34]. Moreover, potential reasons for youth avoiding healthcare include a perceived low level of mental health literacy (i.e., the ability to correctly identify one’s own or peers’ mental disorders) and negative emotional reactions or attitudes towards individuals with mental illnesses (i.e., stigmatization), which vary between different countries [35,36,37,38,39]. Therefore, while UHC improves service availability, it does not automatically ensure equity. Broader social and cultural determinants, including education, stigma, and cultural norms, must be addressed alongside system-level reforms. Strengthening mental health literacy, especially among the youth, remains critical.
Therefore, this finding may require further analysis as there are significant disparities in the burden of depressive disorders among nations that have highly effective UHC levels. For instance, in countries like Australia and New Zealand, the burden of depressive disorders is almost twice as high as that of Singapore, South Korea, and Japan, which may be attributed to differences in geography, cultural practices, and frequency of natural calamities [40,41]. Additionally, it is evident that Singapore, South Korea, and Japan possess a greater UHC index as compared to Australia and New Zealand [42]. Encouragingly, the gap between high- and low-UHC countries has narrowed over the past three decades, suggesting a positive trend towards equity. However, caution is warranted in interpreting these findings. The burden of disease may appear high in countries with better detection systems and data infrastructure. Diagnostic criteria have changed over time (e.g., DSM-IV to DSM-5), and not all countries consistently apply the same standards. Changes in health coverage and access during the study period may have also affected the sample, thus altering the observed prevalence.
This primary strength of our study lies in its comprehensive depiction of the mental health status of young people residing in the Western Pacific region. It stands out as one of the few investigations specifically focusing on the psychological well-being of individuals aged 10–24 years. Previously, only one study had addressed the burden of mental disorders among young people aged 10–24 in Europe [9]. Additionally, following the work of Alize J. Ferrari and colleagues, this study represents the first exploration of sex differences in the burden of depressive disorders at the national level [43]. Furthermore, this research sheds light on the health inequalities surrounding the burden of depressive disorders, providing an initial exploration of the disparities. This information is valuable for understanding the origins of depressive disorders, formulating effective policy interventions, and enabling countries with inadequate prevention and control measures to learn from the experiences of specific nations, ultimately contributing to the achievement of sustainable development goals.
However, there are several considerations when translating our results into public health viewpoints. First, there are general limitations in GBD research, such as uncertainty in classifying non-fatal diseases, variability from different data sources, and wide 95% UIs for some diseases. Second, the severity distribution estimate is based on high-income countries, and applying this to areas with underdeveloped medical systems could introduce errors. Therefore, estimates for low- and middle-income countries without original data should be interpreted with caution. Additionally, data in the Western Pacific region is limited, with only one-third of countries providing explicit data, especially for the 10–14 age group. Given concerns about rising depressive disorders among younger populations, more up-to-date, high-quality data from this age group should be prioritized in Western Pacific countries. Cross-cultural differences also pose challenges: while DSM and ICD classifications help standardize case definitions, they may not capture cultural nuances. Future studies should address the evolving definitions of depressive disorders, shifts in diagnostic tools (ICD vs. DSM), and the influence of sociocultural contexts on healthcare access. A more robust theoretical foundation, drawing from public health, psychology, and sociology, would strengthen the work, especially in relation to adolescent development, health equity, and structural determinants of mental health. Policy implications should be expanded to suggest actionable strategies, such as school-based interventions, digital mental health platforms, and primary care integration. Successful models from high-UHC countries could guide tailored approaches in other regions.

5. Conclusions

In summary, our current study utilized GBD (2021) data to identify significant sex and age heterogeneities in the burden of depressive disorders among adolescents and young adults in 31 countries and territories of the Western Pacific region. Furthermore, countries with higher UHC levels exhibited a disproportionately heavier burden of depressive disorders, while this inequality diminished over time. Our findings provided insights into the diverse patterns of burden of depressive disorders across the Western Pacific countries. There is an urgent need for additional quantitative studies to investigate the country-specific determinants of the burden of depressive disorders and to establish targeted prevention, management, and treatment programs.

Supplementary Materials

The following supporting information can be downloaded at: https://www.mdpi.com/article/10.3390/future3020010/s1, Table S1. Number and rate (per 100,000) of DALYs due to depressive disorders and changes in the DALYs rate in people aged 10–24 years in the Western Pacific region, by sex, in 1990–2021. Table S2. The prevalence rates (per 100,000) and percentage change by sex in people aged 10–24 years in the Western Pacific regions, 1990–2021. Table S3. The DALYs rates (per 100,000) and percentage change by sex in people aged 10–24 years in the Western Pacific regions, 1990–2021. Table S4. UHC effective coverage level—related health inequality for the burden of depressive disorders in people aged 10–24 years in the Western Pacific region by sex, 1990–2019. Figure S1. The prevalence (A) and DALYs (B) rates of depressive disorders among adolescents and young adults aged 10–24 years in the Western Pacific region, 2021. Figure S2. The percentage change in prevalence (A) and DALYs (B) rates of depressive disorders in the Western Pacific region, 1990–2021. Figure S3. The sex difference trends in the DALYs of depressive disorders among adolescents and young adults aged 10–24 years in the Western Pacific and European Union regions, 1990–2021. Figure S4. The sex difference in trends in the DALYs rates of depressive disorders by age in the Western Pacific region, 1990–2021. Figure S5. The trends in the sex difference in the prevalence due to depressive disorders in people aged 10–24 years in 31 Western Pacific member states, 1990–2021. Figure S6. The trends in the sex difference in the DALYs due to depressive disorders in people aged 10–24 years in 31 Western Pacific member states, 1990–2021. Figure S7. Associations of the burden of depressive disorders with UHC effective coverage index in people aged 10–14 years in the Western Pacific regions, in 2021. Figure S8. Associations of the burden of depressive disorders with UHC effective coverage index in people aged 15–19 years in the Western Pacific regions, in 2021. Figure S9. Associations between rate of depressive disorders burden and UHC effective coverage index in people aged 20–24 years in the Western Pacific regions, in 2021. Supplementary Text: Data coverage of depressive disorders among adolescents and young adults aged 10–24 years in the Western Pacific region.

Author Contributions

Conceptualization, J.L., Z.Z. and J.G.; methodology, J.L., Z.Z. and J.G.; software, J.G.; validation, J.G., F.S. and H.W.; formal analysis, J.G.; writing—original draft preparation, J.G., F.S. and H.W.; writing—review and editing, J.G., Y.W., X.L. and S.X.; visualization, J.G. and X.L.; supervision, all authors; funding acquisition, J.L. and Z.Z. All authors have read and agreed to the published version of the manuscript.

Funding

This research was funded by the Special Fund of the State Key Joint Laboratory of Environmental Simulation and Pollution Control (23K02ESPCP to J.L.) and the National Natural Science Foundation of China (42307133 to J.L. and 82073573 to Z.Z.).

Institutional Review Board Statement

The study was conducted in accordance with the Declaration of Helsinki and approved by the University of Washington (Seattle, WA, USA) Institutional Review Board.

Informed Consent Statement

Not applicable.

Data Availability Statement

All data in this study are publicly available for GBD collaborators through the GBD 2021 portal, please visit the website at https://collab2021.healthdata.org/gbd-results/ (accessed on 6 June 2024).

Conflicts of Interest

The authors declare no conflicts of interest.

Abbreviations

The following abbreviations are used in this manuscript:
GBDGlobal Burden of Diseases Study
UHCUniversal Health Coverage
DALYsDisability-adjusted life years
WHOWorld Health Organization
UIUncertainty intervals
RCIRelative concentration index
SIISlope of inequality index

References

  1. McGrath, J.J.; Al-Hamzawi, A.; Alonso, J.; Altwaijri, Y.; Andrade, L.H.; Bromet, E.J.; Bruffaerts, R.; de Almeida, J.M.C.; Chardoul, S.; Chiu, W.T.; et al. Age of onset and cumulative risk of mental disorders: A cross-national analysis of population surveys from 29 countries. Lancet Psychiatry 2023, 10, 668–681. [Google Scholar] [CrossRef] [PubMed]
  2. GBD 2019 Mental Disorders Collaborators. Global, regional, and national burden of 12 mental disorders in 204 countries and territories, 1990-2019: A systematic analysis for the Global Burden of Disease Study 2019. Lancet Psychiatry 2022, 9, 137–150. [Google Scholar] [CrossRef] [PubMed]
  3. Stringaris, A. Editorial: What is depression? J. Child. Psychol. Psychiatry 2017, 58, 1287–1289. [Google Scholar] [CrossRef] [PubMed]
  4. World Health Organization. Mental Health. Available online: https://www.who.int/health-topics/mental-health#tab=tab_1 (accessed on 12 August 2023).
  5. Patel, V.; Saxena, S.; Lund, C.; Thornicroft, G.; Baingana, F.; Bolton, P.; Chisholm, D.; Collins, P.Y.; Cooper, J.L.; Eaton, J.; et al. The Lancet Commission on global mental health and sustainable development. Lancet 2018, 392, 1553–1598. [Google Scholar] [CrossRef]
  6. World Health Organization. Mental Health Atlas 2020; WHO: Geneva, Switzerland, 2021. [Google Scholar]
  7. World Health Organization. Comprehensive Mental Health Action Plan 2013–2030; WHO: Geneva, Switzerland, 2021. [Google Scholar]
  8. Global Burden of Disease Collaborative Network. Global Burden of Disease Study 2019 (GBD 2019) Population Estimates 1950–2019; IHME: Seattle, WA, USA, 2020. [Google Scholar] [CrossRef]
  9. Castelpietra, G.; Knudsen, A.K.S.; Agardh, E.E.; Armocida, B.; Beghi, M.; Iburg, K.M.; Logroscino, G.; Ma, R.; Starace, F.; Steel, N.; et al. The burden of mental disorders, substance use disorders and self-harm among young people in Europe, 1990-2019: Findings from the Global Burden of Disease Study 2019. Lancet Reg. Health Eur. 2022, 16, 100341. [Google Scholar] [CrossRef]
  10. Piao, J.; Huang, Y.; Han, C.; Li, Y.; Xu, Y.; Liu, Y.; He, X. Alarming changes in the global burden of mental disorders in children and adolescents from 1990 to 2019: A systematic analysis for the Global Burden of Disease study. Eur. Child. Adolesc. Psychiatry 2022, 31, 1827–1845. [Google Scholar] [CrossRef]
  11. Kieling, C.; Buchweitz, C.; Caye, A.; Silvani, J.; Ameis, S.H.; Brunoni, A.R.; Cost, K.T.; Courtney, D.B.; Georgiades, K.; Merikangas, K.R.; et al. Worldwide Prevalence and Disability from Mental Disorders Across Childhood and Adolescence: Evidence from the Global Burden of Disease Study. JAMA Psychiatry 2024, 81, 347–356. [Google Scholar] [CrossRef]
  12. Li, Z.B.; Lv, J.J.; Lu, W.; Yin, M.Y.; Li, X.Y.; Yang, C.H. Burden of depression in adolescents in the Western Pacific Region from 1990 to 2019: An age-period-cohort analysis of the Global Burden of Disease study. Psychiatry Res. 2024, 336, 115889. [Google Scholar] [CrossRef]
  13. GBD 2019 Universal Health Coverage Collaborators. Measuring universal health coverage based on an index of effective coverage of health services in 204 countries and territories, 1990–2019: A systematic analysis for the Global Burden of Disease Study 2019. Lancet 2020, 396, 1250–1284. [Google Scholar] [CrossRef]
  14. Murray, C.J.L.; Abbafati, C.; Abbas, K.M.; Abbasi, M.; Abbasi-Kangevari, M.; Abd-Allah, F.; Abdollahi, M.; Abedi, P.; Abedi, A.; Abolhassani, H.; et al. Five insights from the Global Burden of Disease Study 2019. Lancet 2020, 396, 1135–1159. [Google Scholar] [CrossRef]
  15. Nishtar, S.; Niinistö, S.; Sirisena, M.; Vázquez, T.; Skvortsova, V.; Rubinstein, A.; Mogae, F.G.; Mattila, P.; Ghazizadeh Hashemi, S.H.; Kariuki, S.; et al. Time to deliver: Report of the WHO Independent High-Level Commission on NCDs. Lancet 2018, 392, 245–252. [Google Scholar] [CrossRef] [PubMed]
  16. The Lancet Child Adolescent, H. Universal health coverage and the forgotten generation. Lancet Child. Adolesc. Health 2019, 3, 749. [Google Scholar] [CrossRef] [PubMed]
  17. World Health Organization. Handbook on Health Inequality Monitoring with a Special Focus on Low- and Middle-Income Countries; WHO: Geneva, Switzerland, 2013. [Google Scholar]
  18. GBD 2021 Diseases and Injuries Collaborators. Global incidence, prevalence, years lived with disability (YLDs), disability-adjusted life-years (DALYs), and healthy life expectancy (HALE) for 371 diseases and injuries in 204 countries and territories and 811 subnational locations, 1990-2021: A systematic analysis for the Global Burden of Disease Study 2021. Lancet 2024, 403, 2133–2161. [Google Scholar] [CrossRef]
  19. GBD 2019 Diseases and Injuries Collaborators. Global burden of 369 diseases and injuries in 204 countries and territories, 1990-2019: A systematic analysis for the Global Burden of Disease Study 2019. Lancet 2020, 396, 1204–1222. [Google Scholar] [CrossRef]
  20. Bundy, D.A.P.; de Silva, N.; Horton, S.; Patton, G.C.; Schultz, L.; Jamison, D.T. Investment in child and adolescent health and development: Key messages from Disease Control Priorities, 3rd Edition. Lancet 2018, 391, 687–699. [Google Scholar] [CrossRef]
  21. Sawyer, S.M.; Azzopardi, P.S.; Wickremarathne, D.; Patton, G.C. The age of adolescence. Lancet Child. Adolesc. Health 2018, 2, 223–228. [Google Scholar] [CrossRef]
  22. Flaxman, A.D.; Vos, D.T.; Murray, C.J. An Integrative Metaregression Framework for Descriptive Epidemiology; University of Washington Press: Seattle, WA, USA, 2015. [Google Scholar]
  23. Hosseinpoor, A.R.; Nambiar, D.; Schlotheuber, A.; Reidpath, D.; Ross, Z. Health Equity Assessment Toolkit (HEAT): Software for exploring and comparing health inequalities in countries. BMC Med. Res. Methodol. 2016, 16, 141. [Google Scholar] [CrossRef]
  24. Guessoum, S.B.; Lachal, J.; Radjack, R.; Carretier, E.; Minassian, S.; Benoit, L.; Moro, M.R. Adolescent psychiatric disorders during the COVID-19 pandemic and lockdown. Psychiatry Res. 2020, 291, 113264. [Google Scholar] [CrossRef]
  25. The Lancet Regional Health-Western, P. The widened gap in mental health services during the pandemic. Lancet Reg. Health West. Pac. 2021, 15, 100320. [Google Scholar] [CrossRef]
  26. Weissman, M.M.; Klerman, G.L. Sex differences and the epidemiology of depression. Arch. Gen. Psychiatry 1977, 34, 98–111. [Google Scholar] [CrossRef]
  27. Faravelli, C.; Alessandra Scarpato, M.; Castellini, G.; Lo Sauro, C. Gender differences in depression and anxiety: The role of age. Psychiatry Res. 2013, 210, 1301–1303. [Google Scholar] [CrossRef] [PubMed]
  28. Hong, C.; Liu, Z.; Gao, L.; Jin, Y.; Shi, J.; Liang, R.; Maimaitiming, M.; Ning, X.; Luo, Y. Global trends and regional differences in the burden of anxiety disorders and major depressive disorder attributed to bullying victimisation in 204 countries and territories, 1999-2019: An analysis of the Global Burden of Disease Study. Epidemiol. Psychiatr. Sci. 2022, 31, e85. [Google Scholar] [CrossRef] [PubMed]
  29. Salk, R.H.; Hyde, J.S.; Abramson, L.Y. Gender differences in depression in representative national samples: Meta-analyses of diagnoses and symptoms. Psychol. Bull. 2017, 143, 783–822. [Google Scholar] [CrossRef] [PubMed]
  30. Ge, X.; Conger, R.D.; Elder, G.H., Jr. Pubertal transition, stressful life events, and the emergence of gender differences in adolescent depressive symptoms. Dev. Psychol. 2001, 37, 404–417. [Google Scholar] [CrossRef]
  31. Lindberg, S.M.; Grabe, S.; Hyde, J.S. Gender, pubertal development, and peer sexual harassment predict objectified body consciousness in early adolescence. J. Res. Adolesc. 2007, 17, 723–742. [Google Scholar] [CrossRef]
  32. Copeland, W.; Shanahan, L.; Miller, S.; Costello, E.J.; Angold, A.; Maughan, B. Outcomes of early pubertal timing in young women: A prospective population-based study. Am. J. Psychiatry 2010, 167, 1218–1225. [Google Scholar] [CrossRef]
  33. Herrman, H.; Patel, V.; Kieling, C.; Berk, M.; Buchweitz, C.; Cuijpers, P.; Furukawa, T.A.; Kessler, R.C.; Kohrt, B.A.; Maj, M.; et al. Time for united action on depression: A Lancet-World Psychiatric Association Commission. Lancet 2022, 399, 957–1022. [Google Scholar] [CrossRef]
  34. Saxena, S.; Thornicroft, G.; Knapp, M.; Whiteford, H. Resources for mental health: Scarcity, inequity, and inefficiency. Lancet 2007, 370, 878–889. [Google Scholar] [CrossRef]
  35. Singh, S.; Zaki, R.A.; Farid, N.D.N. A systematic review of depression literacy: Knowledge, help-seeking and stigmatising attitudes among adolescents. J. Adolesc. 2019, 74, 154–172. [Google Scholar] [CrossRef]
  36. Angermeyer, M.C.; Matschinger, H.; Riedel-Heller, S.G. Whom to ask for help in case of a mental disorder? Preferences of the lay public. Soc. Psychiatry Psychiatr. Epidemiol. 1999, 34, 202–210. [Google Scholar] [CrossRef]
  37. Shi-Jie, F.; Hong-Mei, G.; Li, W.; Bin-Hong, W.; Yi-Ru, F.; Gang, W.; Tian-Mei, S. Perceptions of stigma and its correlates among patients with major depressive disorder: A multicenter survey from China. Asia Pac. Psychiatry 2017, 9, e12260. [Google Scholar] [CrossRef] [PubMed]
  38. Kasahara-Kiritani, M.; Matoba, T.; Kikuzawa, S.; Sakano, J.; Sugiyama, K.; Yamaki, C.; Mochizuki, M.; Yamazaki, Y. Public perceptions toward mental illness in Japan. Asian J. Psychiatr. 2018, 35, 55–60. [Google Scholar] [CrossRef] [PubMed]
  39. Sun, Y.; Chen, G.; Wang, L.; Li, N.; Srisurapanont, M.; Hong, J.P.; Hatim, A.; Chen, C.H.; Udomratn, P.; Bae, J.N.; et al. Perception of Stigma and Its Associated Factors Among Patients with Major Depressive Disorder: A Multicenter Survey from an Asian Population. Front. Psychiatry 2019, 10, 321. [Google Scholar] [CrossRef] [PubMed]
  40. Ng, F.Y.; Wilson, L.A.; Veitch, C. Climate adversity and resilience: The voice of rural Australia. Rural. Remote Health 2015, 15, 3071. [Google Scholar] [CrossRef]
  41. Shepherd, C.C.; Li, J.; Mitrou, F.; Zubrick, S.R. Socioeconomic disparities in the mental health of Indigenous children in Western Australia. BMC Public. Health 2012, 12, 756. [Google Scholar] [CrossRef]
  42. GBD 2019 Demographics Collaborators. Global age-sex-specific fertility, mortality, healthy life expectancy (HALE), and population estimates in 204 countries and territories, 1950–2019: A comprehensive demographic analysis for the Global Burden of Disease Study 2019. Lancet 2020, 396, 1160–1203. [Google Scholar] [CrossRef]
  43. Ferrari, A.J.; Charlson, F.J.; Norman, R.E.; Patten, S.B.; Freedman, G.; Murray, C.J.; Vos, T.; Whiteford, H.A. Burden of depressive disorders by country, sex, age, and year: Findings from the global burden of disease study 2010. PLoS Med. 2013, 10, e1001547. [Google Scholar] [CrossRef]
Figure 1. The sex difference trends in the prevalence of depressive disorders among adolescents and young adults aged 10–24 years in the Western Pacific and European Union regions, 1990–2021. The bar graph, referring to the left y-axis, displays the prevalence rate (per 100,000). The line graph, referring to the right y-axis, displays the female-to-male ratio equivalent to the prevalence rate of females/the prevalence rate of males.
Future 03 00010 g001
Figure 2. The trends in sex difference in the prevalence number and rate of depressive disorders in the Western Pacific region, by age, 1990–2021. Panel (A) shows the number and rate of prevalence due to depressive disorders. The bar graph, referring to the left y-axis, displays the prevalence rate (per 100,000). The line graph, referring to the right-axis, displays the prevalence number. Panel (B) shows the female-to-male ratio of DALYs due to depressive disorders, which equals the number or rate of prevalence of females/the number or rate of prevalence of males.
Future 03 00010 g002
Figure 3. Associations between the rate of depressive disorders burden and UHC effective coverage index among adolescents and young adults aged 10–24 years in the Western Pacific region, in 2021. UHC = Universal Health Coverage; DALY = disability-adjusted life-year.
Future 03 00010 g003
Figure 4. UHC effective coverage level-related health inequality for the burden of depressive disorders among adolescents and young adults aged 10–24 years in the Western Pacific region by sex, 1990–2021. UHC = universal health coverage; RCI = relative concentration index; SII = slope index of inequality.
Future 03 00010 g004
Table 1. Number and rate of prevalence due to depressive disorders and percentage changes in rate among adolescents and young adults aged 10–24 years in the Western Pacific region from 1990 to 2021.
Characteristic199020192021Percentage
Change in Rate *
Percentage
Change in Rate #
Number, ThousandRate, per 100,000Number, ThousandRate, per 100,000Number, ThousandRate, per 100,000
Western Pacific region9221.77 (7313.66, 11,647.72)1994.38 (1581.72, 2519.04)5588.20 (4442.00, 6999.32)1649.68 (1311.31, 2066.25)5841.00 (4607.37, 7338.50)1723.14 (1359.21, 2164.91)−0.14 (−0.18, −0.09)0.04 (0.01, 0.08)
By sex
Male3344.41 (2630.02, 4209.93)1413.27 (1111.39, 1779.02)2279.02 (1793.05, 2878.64)1275.71 (1003.68, 1611.36)2431.20 (1884.65, 3070.31)1359.07 (1053.55, 1716.35)−0.04 (−0.08, 0.01)0.07 (0.03, 0.10)
Female5877.36 (4680.21, 7461.48)2603.54 (2073.23, 3305.27)3309.18 (2637.56, 4120.41)2066.97 (1647.47, 2573.68)3409.80 (2704.09, 4274.31)2129.95 (1689.13, 2669.97)−0.18 (−0.23, −0.12)0.03 (−0.01, 0.07)
Age
10–14 years896.57 (610.44, 1224.63)652.81 (444.48, 891.68)815.64 (560.54, 1111.92)688.44 (473.13, 938.52)843.29 (564.33, 1172.91)689.86 (461.65, 959.51)0.06 (0.01, 0.11)0.00 (−0.05, 0.05)
15–19 years3232.18 (2442.67, 4116.56)2000.65 (1511.96, 2548.06)1956.81 (1491.28, 2508.93)1832.40 (1396.46, 2349.41)2062.30 (1557.88, 2698.77)1895.75 (1432.07, 2480.82)−0.05 (−0.11, 0.00)0.03 (−0.01, 0.07)
20–24 years5093.02 (3901.24, 6604.97)3115.17 (2386.21, 4039.96)2815.75 (2138.75, 3730.15)2481.29 (1884.70, 3287.07)2935.40 (2203.58, 3897.72)2719.26 (2041.33, 3610.72)−0.13 (−0.18, −0.08)0.10 (0.06, 0.13)
By countries and territories
American Samoa0.29 (0.22, 0.38)1908.84 (1432.38, 2528.99)0.24 (0.18, 0.32)1706.87 (1261.42, 2253.41)0.27 (0.20, 0.38)1971.18 (1407.57, 2729.65)0.03 (−0.13, 0.23)0.15 (−0.02, 0.37)
Australia206.67 (159.56, 256.31)5205.63 (4019.03, 6456.01)236.86 (175.54, 312.74)5129.72 (3801.71, 6773.18)264.21 (188.71, 357.55)5592.03 (3994.14, 7567.77)0.07 (−0.14, 0.33)0.09 (−0.10, 0.33)
Brunei Darussalam1.35 (1.01, 1.79)1767.78 (1320.09, 2355.71)1.97 (1.49, 2.60)1822.14 (1375.94, 2408.65)2.25 (1.62, 3.15)2121.00 (1526.54, 2965.93)0.20 (0.01, 0.42)0.16 (−0.02, 0.37)
Cambodia76.26 (56.06, 100.62)2378.11 (1747.97, 3137.46)100.01 (73.73, 132.15)2167.42 (1597.97, 2864.12)129.99 (90.19, 181.67)2807.48 (1947.84, 3923.47)0.18 (−0.02, 0.43)0.30 (0.06, 0.55)
China6967.37 (5532.09, 8874.80)1930.24 (1532.61, 2458.68)3152.87 (2517.98, 3944.82)1347.73 (1076.34, 1686.26)2961.49 (2373.05, 3701.06)1265.38 (1013.95, 1581.38)−0.34 (−0.40, −0.29)−0.06 (−0.10, −0.02)
Cook Islands0.13 (0.09, 0.18)2161.70 (1553.39, 3004.97)0.09 (0.07, 0.13)2224.75 (1594.59, 3128.94)0.11 (0.07, 0.15)2579.06 (1734.95, 3775.97)0.19 (0.00, 0.44)0.16 (−0.03, 0.39)
Guam1.02 (0.76, 1.35)2603.16 (1946.15, 3447.53)0.95 (0.71, 1.24)2538.01 (1902.02, 3314.02)1.17 (0.83, 1.62)3251.84 (2296.25, 4497.79)0.25 (0.02, 0.49)0.28 (0.06, 0.54)
Fiji4.79 (3.61, 6.31)2012.63 (1519.36, 2651.58)4.88 (3.59, 6.37)2068.47 (1524.67, 2702.83)6.14 (4.38, 8.37)2563.64 (1831.52, 3498.01)0.27 (0.06, 0.54)0.24 (0.04, 0.51)
Japan604.28 (481.35, 755.83)2151.67 (1713.94, 2691.26)418.32 (333.41, 523.50)2348.05 (1871.44, 2938.46)518.79 (408.08, 658.20)2953.21 (2322.98, 3746.81)0.37 (0.29, 0.45)0.26 (0.20, 0.33)
Kiribati0.54 (0.39, 0.71)2395.50 (1766.38, 3158.00)0.72 (0.53, 0.94)2072.14 (1525.84, 2734.78)0.83 (0.59, 1.16)2359.05 (1661.96, 3293.63)−0.02 (−0.19, 0.20)0.14 (−0.06, 0.39)
Laos27.54 (20.39, 36.39)2134.63 (1580.99, 2821.39)46.30 (34.38, 59.96)2201.14 (1634.60, 2850.86)54.34 (37.55, 76.00)2604.00 (1799.43, 3642.39)0.22 (−0.01, 0.47)0.18 (−0.02, 0.41)
Malaysia123.26 (89.64, 163.66)2294.62 (1668.83, 3046.77)299.72 (225.60, 385.64)3658.74 (2754.00, 4707.66)245.91 (170.51, 344.12)3038.94 (2107.14, 4252.58)0.32 (0.09, 0.59)−0.17 (−0.38, 0.06)
Marshall Islands0.30 (0.22, 0.40)1980.59 (1451.19, 2609.81)0.34 (0.25, 0.45)2024.01 (1488.24, 2702.58)0.39 (0.28, 0.54)2351.20 (1668.67, 3257.06)0.19 (−0.01, 0.44)0.16 (−0.04, 0.42)
Micronesia0.70 (0.51, 0.93)2039.32 (1496.30, 2708.73)0.65 (0.48, 0.88)2040.94 (1493.14, 2730.46)0.74 (0.54, 1.02)2351.46 (1714.85, 3268.88)0.15 (−0.04, 0.40)0.15 (−0.04, 0.38)
Mongolia20.89 (15.38, 27.90)2948.45 (2171.30, 3938.48)20.95 (15.44, 28.33)2892.64 (2132.62, 3913.12)22.51 (16.09, 31.36)2964.75 (2119.37, 4130.06)0.01 (−0.15, 0.19)0.02 (−0.14, 0.22)
Nauru0.06 (0.05, 0.09)2125.58 (1537.25, 2936.99)0.07 (0.05, 0.10)2151.54 (1534.34, 2974.94)0.09 (0.06, 0.12)2497.47 (1708.65, 3603.45)0.17 (−0.03, 0.42)0.16 (−0.04, 0.40)
New Zealand34.76 (26.01, 46.00)4132.72 (3092.99, 5469.47)48.81 (37.98, 62.77)4959.33 (3858.50, 6377.53)49.99 (36.63, 67.87)4937.38 (3618.19, 6703.87)0.19 (0.02, 0.41)−0.00 (−0.14, 0.16)
Niue0.01 (0.01, 0.02)2062.32 (1479.27, 2871.68)0.01 (0.01, 0.01)2134.41 (1519.22, 2962.34)0.01 (0.01, 0.01)2495.37 (1690.31, 3581.26)0.21 (0.00, 0.46)0.17 (−0.03, 0.41)
Northern Mariana Islands0.27 (0.21, 0.37)2150.17 (1629.16, 2899.83)0.22 (0.17, 0.29)1967.84 (1461.94, 2529.36)0.30 (0.21, 0.43)2621.54 (1860.90, 3715.52)0.22 (−0.01, 0.49)0.33 (0.11, 0.62)
Palau0.10 (0.07, 0.15)2226.20 (1591.55, 3128.64)0.08 (0.06, 0.11)2194.57 (1583.51, 3049.84)0.09 (0.06, 0.13)2541.35 (1722.38, 3737.45)0.14 (−0.06, 0.38)0.16 (−0.04, 0.40)
Papua New Guinea30.99 (22.73, 43.00)2366.76 (1735.59, 3283.51)66.56 (48.84, 89.71)2273.85 (1668.39, 3064.82)74.07 (53.06, 104.63)2425.48 (1737.53, 3425.98)0.02 (−0.15, 0.23)0.07 (−0.11, 0.27)
Philippines438.23 (339.32, 572.56)2139.98 (1656.98, 2795.95)626.40 (490.20, 816.58)1958.46 (1532.61, 2553.05)846.82 (653.54, 1119.54)2605.90 (2011.11, 3445.14)0.22 (0.17, 0.27)0.33 (0.27, 0.39)
Republic of Korea278.32 (224.47, 347.70)2117.64 (1707.93, 2645.53)195.87 (155.91, 245.53)2384.64 (1898.17, 2989.27)209.84 (153.97, 281.77)2722.35 (1997.51, 3655.53)0.29 (0.05, 0.54)0.14 (−0.05, 0.36)
Samoa1.23 (0.90, 1.62)2078.05 (1523.70, 2743.78)1.19 (0.87, 1.57)1938.70 (1426.73, 2565.27)1.40 (0.98, 1.95)2235.39 (1571.07, 3120.00)0.08 (−0.12, 0.28)0.15 (−0.05, 0.38)
Singapore27.64 (22.77, 34.67)3351.21 (2761.29, 4204.06)18.85 (14.55, 24.17)2518.75 (1944.28, 3230.61)19.81 (14.72, 26.71)2736.48 (2033.14, 3688.46)−0.18 (−0.34, −0.01)0.09 (−0.11, 0.32)
Solomon Islands2.48 (1.83, 3.29)2146.52 (1583.35, 2849.59)4.17 (3.07, 5.61)2059.14 (1517.55, 2771.81)5.01 (3.55, 7.05)2376.86 (1684.00, 3347.67)0.11 (−0.07, 0.31)0.15 (−0.04, 0.38)
Tokelau0.01 (0.01, 0.01)2106.32 (1517.70, 2922.27)0.01 (0.01, 0.01)2082.10 (1494.68, 2903.69)0.01 (0.01, 0.01)2414.63 (1588.30, 3427.80)0.15 (−0.05, 0.40)0.16 (−0.02, 0.42)
Tonga0.62 (0.46, 0.81)1863.93 (1381.13, 2414.36)0.58 (0.43, 0.76)1856.25 (1389.61, 2443.55)0.67 (0.47, 0.94)2144.45 (1521.18, 3019.68)0.15 (−0.04, 0.37)0.16 (−0.04, 0.38)
Tuvalu0.05 (0.04, 0.08)2196.23 (1582.83, 3070.81)0.07 (0.05, 0.10)2171.96 (1553.66, 3021.56)0.09 (0.06, 0.13)2524.22 (1703.77, 3699.38)0.15 (−0.03, 0.36)0.16 (−0.02, 0.38)
Vanuatu1.04 (0.76, 1.38)2194.70 (1610.88, 2923.64)1.93 (1.41, 2.56)2141.31 (1563.59, 2836.87)2.32 (1.63, 3.25)2476.52 (1735.64, 3462.34)0.13 (−0.06, 0.36)0.16 (−0.04, 0.38)
Viet Nam372.17 (274.63, 485.56)1727.54 (1274.79, 2253.87)339.96 (255.73, 436.99)1614.67 (1214.61, 2075.51)423.10 (294.67, 579.09)1992.08 (1387.38, 2726.51)0.15 (−0.05, 0.38)0.23 (0.03, 0.45)
Note: * presents the percentage change in the depressive disorders rate from 1990 to 2021. # presents the percentage change in the depressive disorders rate from 2019 to 2021.
Disclaimer/Publisher’s Note: The statements, opinions and data contained in all publications are solely those of the individual author(s) and contributor(s) and not of MDPI and/or the editor(s). MDPI and/or the editor(s) disclaim responsibility for any injury to people or property resulting from any ideas, methods, instructions or products referred to in the content.

