Abstract
Post-traumatic stress disorder (PTSD) is a severe mental illness with grave social, political, economic, and humanitarian implications. To apply the principles of personalized omics-based medicine to this psychiatric problem, we implemented our previously introduced drug efficiency index (DEI) to the PTSD gene expression datasets. Generally, omics-based personalized medicine evaluates individual drug action using two classes of data: (1) gene expression, mutation, and Big Data profiles, and (2) molecular pathway graphs that reflect the protein–protein interaction. In the particular case of the DEI metric, we evaluate the drug action according to the drug’s ability to restore healthy (control) activation levels of molecular pathways. We have curated five PTSD and one TRD (treatment-resistant depression) cohorts of next-generation sequencing (NGS) and microarray hybridization (MH) gene expression profiles, which, in total, comprise 791 samples, including 379 cases and 413 controls. To check the applicability of our DEI metrics, we have performed three differential studies with gene expression and pathway activation data: (1) case samples vs. control samples, (2) case samples after treatment or/and observation vs. before treatment, and (3) samples from patients positively responding to the treatment vs. those responding negatively or non-responding patients. We found that the DEI values that use the signaling pathway impact activation (SPIA) metric were better than those that used the Oncobox pathway activation level (Oncobox PAL) approach. However, SPIA, Oncobox PAL, and DEI evaluations were reliable only if there were differential genes between case and control, or treated and untreated, samples.
1. Introduction
Post-traumatic stress disorder (PTSD) is a pathological mental health condition triggered by a terrifying event—either experiencing it or witnessing it. Symptoms may include flashbacks, nightmares, severe anxiety, and uncontrollable thoughts about the event [1,2]. Given the drastic, humiliating, and oppressing conditions that provoke PTSD, it poses a grave and ever-actual social, political, and humanitarian threat worldwide [3,4]. Most people who go through traumatic events may have temporary difficulty adjusting and coping, but with time and good self-care, they usually get better. If the symptoms worsen, last for more than a month or longer, and interfere with day-to-day functioning, the patient may have PTSD [5,6].
The epidemiology of PTSD seems controversial around the world; this is likely due to cultural differences and non-identical healthcare standards in different nations. For example, about 3.5% of adults in the US have PTSD in a given year. Additionally, 9% of US people develop it at some point in their life; however, in much of the rest of the world, rates during a given year are between 0.5% and 1% [3]. Higher rates may occur in regions of armed conflict. Consequently, there is debate over the rates of PTSD found in populations. However, despite changes in diagnosis and the criteria used to define PTSD between 1997 and 2013, the epidemiological rates have not changed significantly [7,8]. Women are more vulnerable to PTSD than men [9,10].
Obtaining effective treatment after PTSD symptoms develop can be critical to improving the functional state of a patient. There are different types of treatments available to PTSD patients. The approaches that mitigate PTSD include behavioral and cognitive-behavioral therapies, such as prolonged exposure therapy [11], cognitive processing therapy, eye movement desensitization and reprocessing (EMDR) [12,13], brief eclectic psychotherapy (BEP), narrative exposure therapy (NET), written exposure therapy [14], social supports [15,16], interpersonal psychotherapy [17], prolonged exposure therapy, and relaxation therapy [18,19]. Additionally, doctors recommend moderate exercise to distract from disturbing emotions, build self-esteem, and increase feelings of being in control again, as well as to improve physical health [20].
Many of the approaches, unfortunately, are not effective. A 2019 Cochrane review, for example, did not find any evidence to support the use of a standard intervention offered to everyone, and multiple-session interventions may result in worse outcomes than no intervention for some individuals [21]. Additionally, the World Health Organization disapproves of the application of benzodiazepines and antidepressants during acute stress (with symptoms lasting shorter than one month) [22]. Some evidence supports the use of hydrocortisone for the reduction of PTSD symptoms in adults, while there is limited or no evidence supporting the use of propranolol, escitalopram, temazepam, or gabapentin [13,23,24].
Considering pharmacotherapy, four CYP2D6 inhibitors (sertraline, fluoxetine, paroxetine, and venlafaxine) have a small to modest benefit over placebo [4]. Selective serotonin reuptake inhibitors (SSRIs) and serotonin–norepinephrine reuptake inhibitors (SNRIs) may have some benefits for PTSD symptoms [4,25,26]. Tricyclic antidepressants are equally effective but are less well tolerated [27]. Benzodiazepines are not the best solution for PTSD due to a lack of evidence of benefits and the risk of worsening PTSD symptoms [28]. Prazosin, an alpha-1 adrenergic antagonist, was used by war veterans to reduce nightmares, although there was some variability in symptom reduction and dosage used in this population [29,30,31]. Glucocorticoids are beneficial in the short term to protect against neurodegeneration triggered by PTSD. However, their further application may cause neurodegeneration [31].
Cannabis is another possible therapy option for PTSD patients. Some authors, however, do not recommend cannabis for the treatment of PTSD. They argue there is no sufficient evidence for the efficacy of cannabinoids [32,33] or smoked cannabis [34]. The cannabinoids, however, are sometimes given to PTSD patients [32,35,36,37,38,39,40,41,42,43]. Additionally, the application of cannabis or derived products is widespread among US veterans with PTSD [44]. An increasing number of states permit and have legalized the use of medical cannabis for the treatment of PTSD [34,45,46,47,48,49,50]. The low efficacy of cannabis and cannabinoids for PTSD or other conditions could be because cannabis extracts are given randomly, without knowing beforehand whether the combination of active ingredients would be effective.
Recently, we have proposed a novel approach to the assessment of the cannabis drug efficiency index (CDEI) for individual patients. We calculated the CDEI using expression-based signaling pathway activation levels [51]. The corresponding software drug efficiency index (DEI) metric was presented and validated on the prediction of cannabis drug efficiency for the treatment of inflammation in 3D epithelial tissues, including intestine, oral, and skin tissues [51]. The changes in the expression of genes involved in various signaling/metabolic/cytoskeleton pathways often help in the evaluation of personalized drug action on individual patients, particularly for the treatment of cancer [52,53,54,55,56]; diabetes [57,58]; inflammation [59,60], including COVID-19 cases [61,62]; hemostasis disorders [63]; rheumatoid arthritis [64]; and for delaying aging [65,66].
We can evaluate pathway activation levels using various mathematical algorithms, such as the Oncobox pathway activation level (PAL) [67], topology analysis of pathway phenotype association (TAPPA) [68], topology-based score (TBScore) [69], pathway-express (PE) [70], signaling pathway impact analysis (SPIA) [71], in silico pathway activation network decomposition analysis (iPANDA) [65], etc. Such a pathway activation level calculation utilizes expression/mutation Big Data profiles. The protein–protein interaction graphs are used from several databases such as Biocarta [72], KEGG [73], HumanCyc [74], Qiagen (https://www.qiagen.com/us/shop/genes-and-pathways/pathway-central; accessed on 15 December 2022), NCI [75], Reactome [76], PathBank [77], etc.
In the current work, we have attempted to use and modify our gene expression analysis software for the DEI metric [51] to analyze the gene expression data in PTSD patients. We found that the DEI metric is meaningful if there are enough differentially expressed genes between the case and control samples and the pre-treatment and post-treatment samples. Otherwise, the DEI metric is not reliable, which correlates with high p-values for the differential Student’s t-test.
2. Materials and Methods
2.1. PTSD Gene Expression Datasets
We processed six gene expression datasets for PTSD and treatment-resistant depression (TRD) patients before and after treatment or observation, as well as corresponding gene expression profiles for the control/healthy samples (See Table 1). For each dataset, except dataset GSE185855, there was no specific treatment for PTSD given. In other words, the main expectation was that time cures stress. The untreated cases were cases before the observation period, whereas the treated cases were those studied after treatment.
The microarray gene expression data were normalized using the quantile normalization (QN) method [78], and the next-generation sequencing (NGS) profiles were normalized using the Differentially Expression in Sequencing 2 (DESeq2) approach [79].

Table 1.
Overview of the PTSD and control gene expression profiles processed in the current work.
Table 1.
Overview of the PTSD and control gene expression profiles processed in the current work.
| Reference | [80] | [81] | [81] | [82] | [82] | [30,83] | [84] | [84] |
|---|---|---|---|---|---|---|---|---|
| GSE ID; clinical description | GSE860 | GSE64814-GPL6244 | GSE64814-GPL11154 | GSE81761 no improvement; non-responders | GSE81761 improvement; responders | GSE97356 | GSE185855 TRD: non- responders | GSE185855 TRD: responders |
| Profiling platform | Affymetrix U95A Array | Affymetrix Gene 1.0 ST Array | Illumina HiSeq 2000 | Affymetrix U133 Plus 2.0 Array | Affymetrix U133 Plus 2.0 Array | Illumina HiSeq 2000 | Illumina HiSeq 2000 | Illumina HiSeq 2000 |
| Treatment | Not specified | Not specified | Not specified | * | * | Not specified | Ketamine | Ketamine |
| Untreated cases | 8 | 24 | 47 | 39 | 39 | 81 | 8 | 17 |
| Untreated controls | 7 | 48 | 94 | 27 | 27 | 201 | 21 | 21 |
| Treated cases | 9 | 24 | 47 | 5 | 6 | 42 | 8 | 13 |
| Treated controls | 9 | 48 | 94 | 6 | 6 | 201 | 21 | 21 |
| Number of genes | 9068 | 12,631 | 10,184 | 22,878 | 22,878 | 25,830 | 55,178 | 55,178 |
* Treatment: Evidence-based sleep treatment; cognitive behavioral therapy for insomnia; automatic positive airway pressure therapy.
2.2. Pathway Activation Level Assessment
Previously, we introduced two computational methods for the activation levels of cell signaling pathways. One approach, called Oncobox PAL [67], calculates for each pathological case sample the following quantities:
- Log-fold-change, LFCn, i.e., log2 ratio of gene n mRNA concentrations in the test sample and in the control pool (median value in the control group)
- Pathway p activation level, PALp = ∑n NIInp ∙ ARRnp ∙ LFCn/∑n |ARRn|. Here, the node involvement index, NIInp, is the Boolean flag for gene product n concerning the pathway p. The discrete value ARRnp (activator/repressor role) is determined for a gene n in the pathway p as follows:
- ARRnp = −1; gene product n is a repressor of pathway p
- −0.5; gene product n is more a repressor than an activator of pathway p
- 0; unclear repressor or activator role in pathway p
- 0.5; gene product n is more an activator than a repressor of pathway p
- 1; gene product n is an activator of pathway p.
Note that we calculate LFC and PAL values using the available corresponding control samples. The algorithm for ARR calculations uses pathway topology graphs [85,86]. We checked the adequacy of Oncobox PAL, a method for pathway activation assessment, using the low-level realistic kinetic models for signal propagation along the pathways [86,87]. The Oncobox database for signaling/metabolic/cytoskeleton pathways encounters 51,672 uniformly processed graphs. The full interactome graph contains 361,654 reactions and 64,095 molecular nodes [88] borrowed from the following storehouses: Biocarta [72], KEGG [73], HumanCyc [74], Qiagen (https://www.qiagen.com/us/shop/genes-and-pathways/pathway-central; accessed on 15 Decembe 2022), NCI [75], Reactome [76], and PathBank [77].
Another method we have proposed for pathway-based assessment of individual drug reactions is the DEI metric, as we have applied it to cannabis-based drugs. It uses the SPIA method [51,71] for pathway activation levels [51,71]. Among the other methods for gene expression-based assessment of signaling pathway activation, including TAPPA [68], TBScore [69], and PE [70], the SPIA [71] approach showed the best statistical performance during the comparison between pathway-based and gene-based values [51,89].
We calculate the SPIA values [51,71] for a pathway graph, , where is the set of graph nodes (vertices), and is the set of graph edges. We define the adjacency matrix a as follows: aij = 1, if or and aij = 0, if . We consider then perturbation factors for the all genes g of the pathway K.
Here, is the signed log2-fold change of the gene g expression level in a given sample compared with the average value for the pool of control samples. The latter term expresses the summation over all the genes γ that belong to the set Ug of the upstream genes for the gene g. The value of ndown (γ) denotes the number of downstream genes for gene γ. The weight factor indicates the interaction type between γ and g: if γ activates g and when γ inhibits g. We apply the depth-first search method to upstream/downstream genes [51,71].
We use the second term in the formula for the perturbation factor (PF) from the previous paragraph, resulting in the accuracy value, . Tarca et al. [71] showed that accuracy vector as expressed as follows:
where
I is the identity matrix, and
We calculated the overall score for the pathway perturbation, calculated as [51,71].
According to the SPIA method [51,71], we calculated the activation levels for 241 signaling pathways. We borrowed the graph topology from the Qiagen pathway database [51,88].
We applied the SPIA calculation with and without the differential expression gene filter. If in a case sample the gene g had an expression level at least 1.5 times higher or lower than the median expression levels of the control samples, we considered this gene differentially expressed and used it for the SPIA calculations.
2.3. Evaluation of the Individual Drug Action
Having calculated the Oncobox PAL and SPIA values, we then performed the following statistical analysis [51],
- Obtain the SPIA (PAL) values for each dataset and biological pathway.
- Calculate the values of the pathway weight (wp) factor as follows. For pathways with a positive mean SPIA (PAL) score of the case samples, wp = ((number of case samples with positive SPIA (PAL) score)/(total number of case samples)). For pathways with a negative mean SPIA (PAL) score of the case samples, wp = ((number of case samples with negative SPIA (PAL) score)/(total number of case samples)).
- Adjust the mean SPIA (PAL) score of each pathway by the weight factor,SPIAμ (PALμ) = mean (SPIA(PAL))·wp.
- Perform a Student’s t-test if the values of SPIAμ (PALμ) for the pool of case samples are different from 0 (for the pool of control samples, the values of SPIAμ (PALμ) are clearly equal to 0). During the Student’s t-test, the following case classes are taken into account: the untreated case (U), i.e., the pathological state before drug application, should be far from the control (C).
- 4.1
- The treated case (T), i.e., the pathological state after drug application, should be close to the control;
- 4.2
- The following values are the results for such calculations: |tU| = absolute t-value for the Student’s t-test for U-vs-C profiles;
- 4.3
- |tT| = absolute t-value for the Student’s t-test for T-vs-C profiles.
In addition to the old DEI metric [51] for individual drug action, , we have now introduced an alternative metric, called mirrored DEI, calculated as follows,
The DEIM metric equals 1 when tT = −tU; this is the maximal possible value of this metric.
Similar to the old DEI metric, DEIM = 0, when in tT = tU, and when |tT| ≫ |tU|, DEIM = −1.
The third metric, balanced DEI: , is the mean value over DEI and mirrored DEI.
2.4. Robust Marker Gene and Pathway Analysis
We applied (see Figure 1) the leave-one-out (LOO) procedure [90,91] to complete the robust core marker gene/pathway set that distinguishes:
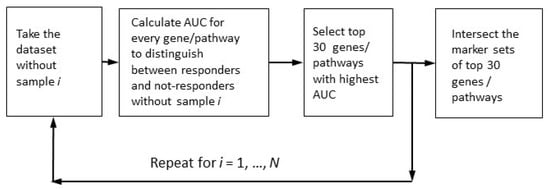
Figure 1.
Determination of robust marker gene/pathway sets for the case of multiple markers with maximally high quality.
- (1)
- Case samples from control samples (PTSD or TRD), the disease-vs-healthy, D_vs_H test;
- (2)
- Case samples after treatment or/and observation from those before treatment (untreated), the post-vs-ante, P_vs_A test;
- (3)
- Patients positively responding to the treatment from negatively or non-responding patients, the responders-vs-non-responders, R_vs_N test.
We called a gene or a pathway upregulated if it had an expression or activation level higher for the disease state than for the healthy state after the treatment versus before the treatment and for the responders versus non-responders. If the expression/activation levels were lower, they were downregulated.
We selected the marker genes/pathways according to the area under the receiver-operating curve (AUC) metric. The ROC (receiver–operator curve) is a widely-used graphical plot that illustrates the diagnostic ability of a binary classifier system, as its discrimination threshold is varied. The ROC is created by plotting the true positive rate (TPR) against the false positive rate (FPR) at various threshold settings. The area under the ROC curve, called ROC AUC, or simply AUC, is routinely employed for classifier quality [92].
In the resulting robust marker gene and pathway sets, we selected only those genes/pathways with AUC > 0.70 (the conventional threshold for a significant marker). The robust set of marker features (genes or pathways) should assure the reliable distinction between different classes of samples (cases vs. controls, untreated vs. treated cases, and positively responding patients vs. those with no positive response). From the theory of machine learning, we know that the number of robust marker features should not exceed the number of samples. Since the smallest cohort, GSE860, contained 33 samples, we selected 30 as the maximal number of possible marker features (Figure 1).
For the genes in robust marker set, we retrieved the description for the corresponding protein and the relevant biological processes (Gene Ontology) using Metascape, an online resource for gene annotation and analysis [93].
2.5. Alternative Methods for Differential Gene Expression and Enrichment Analysis
To check the overall pattern for marker genes/pathways for all three tests (D_vs_N, P_vs_A, and R_vs_N), we also applied the conventional procedure for differential gene expression (DEG) analysis. According to conventional procedure [94], we considered a gene differentially expressed if it simultaneously satisfies the two criteria for DESeq2 test [79]: the adjusted p-value for the negative binomial model, pAdjusted < 0.05, and the log2-fold change, |LFC2| > 0.5. We plotted the results of the DESeq2 analysis using the EnhancedVolcano R package.
3. Results
3.1. Cohorts Used in the Analysis
We aimed to analyze all available transcriptome data for PTSD/TRD patients using our previously published DEI approach. Our goal was to test whether the DEI approach would differentiate the responders vs. the non-responders, the case vs. control samples, and treated vs. non-treated based on their gene expression levels. We curated six cohorts of 791 gene expression profiles, including 379 case samples and 413 control samples (Table 2; see more details in Table 1).
Table 2.
PTSD and control cohorts curated in the current work.
3.2. Comparison of DEI Options for Different Approaches to the Assessment of Pathway Activation Levels
We have attempted three methods for calculation of PAL:
- SPIA with differential expression filter [51];
- SPIA without differential expression filter;
- Oncobox PAL with the pathway databased OncoboxPD [88].
The DEI value we suggested [51] is a normalized indicator of treatment success. We measured the deviation of PAL values from the healthy reference using the Student’s t-test, which produces the metrics t(U) and t(T) for the untreated and treated cases, respectively. It equals 1 when the cell’s physiological conditions after treatment are undistinguishable from the healthy state. Higher DEI values may indicate that the treatment was efficient and that the post-treatment state is close to a healthy reference in terms of gene expression. The positive DEI value means that the post-treatment conditions are less dysregulated than the pre-treatment conditions, while a negative DEI value means that the post-treatment conditions are more dysregulated than the pre-treatment conditions. A strongly dysregulated post-treatment state may have a DEI value approaching −1.
To select the best PAL metric, we required that the corresponding DEI value is positive as frequently as possible. According to this criterion, we obtained the best results using the SPIA method with a differential expression filter; see Table 3.
Table 3.
DEI metrics for different calculation methods of pathway activation levels.
However, for the TRD dataset GSE185855 [84], all the DEI scores for responders to ketamine treatment were unexpectedly negative, although they were insufficiently reliable in terms of the differential Student’s t-test with pathway activation values, at least for the patients without positive response to the treatment.
Additionally, for the datasets GSE81761 [82] and GSE185855 [84], the DEI values for the patients with no improvement were higher than for the patients with positive changes.
These negative values may indicate the following disadvantage of the DEI metric: it does not consider the sign flip from positive to negative, which indicates a transition through the zero value.
Perhaps, to overcome the disease, the treatment should change the pathway perturbation and the most effective treatment, which inverses the sign of the SPIA deviation from the control level. Thus, the best treatment should result in tT = –tU rather than tT = 0.
Therefore, in addition to the old DEI [51], we introduced an alternative metric, called mirrored DEI (DEIm), as well as the average of the DEI and DEIm, called balanced DEI (DEIb) (see Materials and Methods).
Note that the DEIm and DEIb metrics helped the GSE81761 cohort but not the GSE185855 cohort, where the results for non-responders were always statistically unconvincing according to the Student’s t-test (Table 3).
3.3. Robust Marker Gene/Pathway Analysis, Differentially Expressed Gene (DEG) Analysis, and Gene Ontology (GO) Enrichment Analysis
To have a closer and more in-depth view of the pattern of genes and pathways that discriminate different types of samples from one another, we identified robust marker sets [90,91] of genes and pathways for three different comparison groups described above: D_vs_H, P_vs_A and R_vs_N
For these three tests, we considered a gene/pathway upregulated when the expression/activation level was higher for the case samples than the control samples, for the post-treatment cases than the pre-treatment counterparts, and for the patients with clinical improvements than the persons with no improvement.
Using the online gene analytical portal Metascape [93], we specified the protein description and biological functions (Gene Ontology) for the identified robust marker genes.
Additionally, for these three comparison groups, we analyzed the differentially expressed genes using the DESeq2 tool [79].
We analyzed the intersection of robust marker genes and pathway sets between differential tests for all cohorts (Figure 2) and between cohorts for all comparison groups (Figure 3).
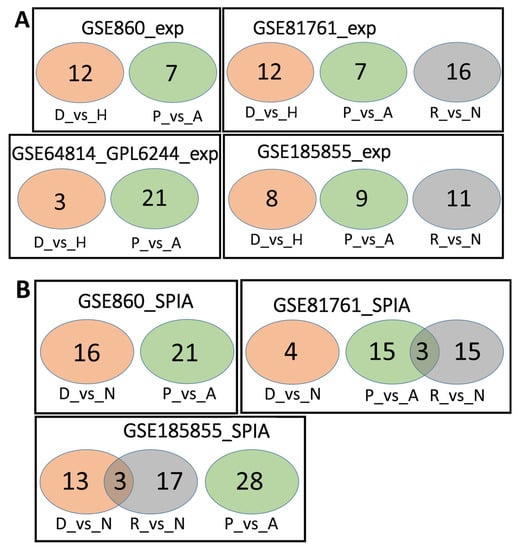
Figure 2.
Overlaps between the dysregulated genes found within different cohorts. Intersection of robust marker gene sets (A) and SPIA pathways (B) for three comparison groups (D_vs_H, P_vs_A, and R_vs_N) for different cohorts. Numbers indicate the number of unique or overlapping genes or pathways for three comparison groups within the same cohort.
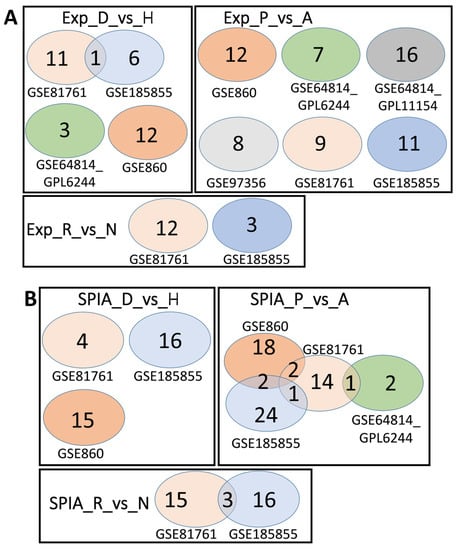
Figure 3.
Overlaps between the dysregulated genes found between different cohorts. Intersection of robust marker gene sets (A) and SPIA pathways (B) for three comparison groups (D_vs_H, P_vs_A, and R_vs_N) for different cohorts. Numbers indicate the number of unique or overlapping genes or pathways for different cohorts.
Table 4 shows the number of robust marker genes (marked as Exp) and pathways. We calculated the pathway activation levels using the SPIA method with the differential expression filter (marked as SPIA). These genes and pathways are also listed in Supplementary Files S1–S6.
Table 4.
Number of robust marker genes (Exp) and pathways for three differential tests: D_vs_H, P_vs_A, and R_vs_N.
A detailed description of the function of genes in various comparisons is presented in Supplementary File S7.
As can be seen from the analysis above, the number of the robust marker genes for all tests and datasets was relatively small, with little to no overlap between cohorts. To confirm this data, we also performed a classical DEG analysis, where we selected the genes with an expression level higher or lower than log2 of 0.5 and an adjusted p = value lower than 0.05 (see methods section for details).
Table 5 summarizes the data seen in Figure 3, Figure 4 and Figure 5, and Supplementary File S8 has a list of all genes significantly (p < 0.05) altered by log2 > 0.5 or log2 < −0.5. Cohort GSE81761 had a large number of genes in two categories, A_vs_P and R_vs_N; in both, most of the genes were downregulated. Cohort GSE64814-GPL6244 also contains a large number of genes in A_vs_P category.
Table 5.
Number of up- and down-regulated genes per DESeq2.
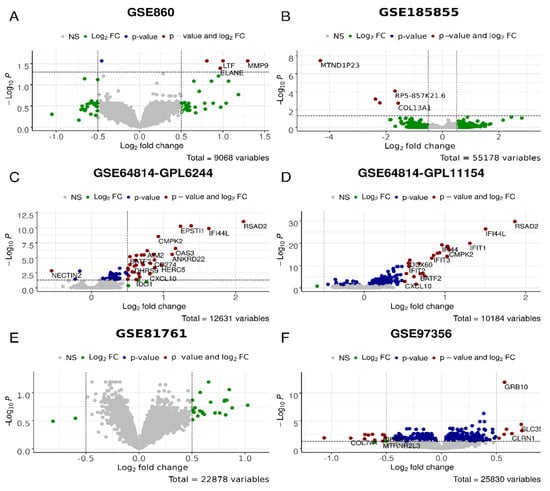
Figure 4.
Differential gene expression analysis for the D_vs_H test, i.e., PTSD/TRD vs. healthy datasets in GSE860 (A), GSE185855 (B), GSE64814-GPL6244 (C), GSE64814GPL11154 (D), GSE81761 (E), GSE97356 (F) cohorts. In green, genes with expression values of log2 > 0.5 and log2 < −0.5; in blue, genes significantly (p < 0.05) differently expressed; in red, genes that are significantly differently expressed with the differences of log2 > 0.5 and log2 < −0.5.
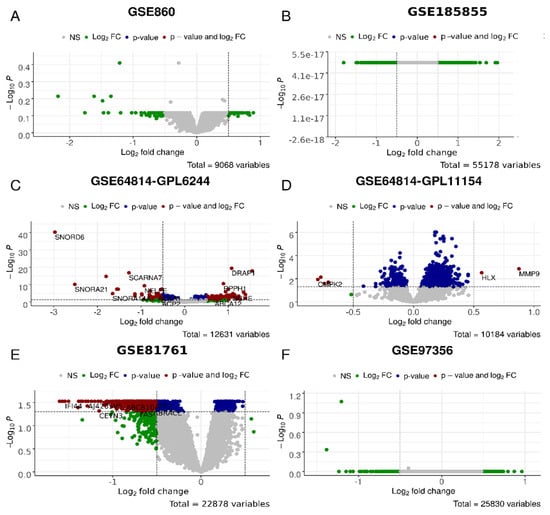
Figure 5.
Differential gene expression analysis for the P_vs_A test, i.e., PTSD/TRD patients after (post) observation and/or treatment and before (ante) in GSE860 (A), GSE185855 (B), GSE64814-GPL6244 (C), GSE64814GPL11154 (D), GSE81761 (E), GSE97356 (F) cohorts. In green, genes with the expression values of log2 > 0.5 and log2 < −0.5; in blue, genes significantly (p < 0.05) differently expressed; in red, genes that are significantly differently expressed with the differences of log2 > 0.5 and log2 < −0.5.
We then compared the number of robust genes (as per AUC criteria) and DESeq2 genes. It appears that only for cohort GSE860 was the number of genes higher per AUC criteria. For the GSE97356 and GSE64814-GPL11154 cohorts, the numbers were comparable, while for GSE64814-GPL6244, GSE81761 and GSE185855, the numbers were higher in the DESeq2 category. The most dramatic differences were observed for the GSE81761 cohort, especially in P_vs_A and R_vs_N categories.
We then analyzed whether there are any overlapping genes in both categories (Table 6 and Supplementary File S9). For the GSE860 cohort, there was one gene overlap in the D_vs_H category: PAX3, encoding the protein involved in sensory perception of sound and mechanical stimuli, as well as muscle development. In the GSE64814-GPL6244 cohort, D_vs_H also had one gene overlap: EPSTI1—epithelial stromal interaction 1, while P_vs_A had an overlap of 17 genes. Among these, there was a large number of genes encoding snoRNAs, including SCARNA7, SCARNA17, SNORD6, SNORD24, SNORDD43, SNORD68, and SNORA65 as well as regulators of transcription, DRAP1, PHTF1, and NELFE. For the GSE81761 cohort, there were seven gene overlaps in the R_vs_N category, all encoding Zn finger proteins involved in spindle formation, regulation of non-coding RNA biogenesis, and regulation of transcription and protein ubiquitination. For the GSE185855 cohort, the was a complete overlap of 11 genes between AUC and DESeq2 analyses for the R_vs_N category; they included proteins involved in differentiation of natural killer cells, basophils, and erythrocytes; suppression by virus of apoptotic processes; regulation of autophagy in neurons; and the adiponectin-activated signaling pathway.
Table 6.
Number of robust maker genes (according to the AUC criteria), differentially expressed genes (according to the DESeq2 criteria), and overlapping genes.
The failure of DEI, DEIm, and DEIb metrics to reflect differences between responders and non-responders for the TDR cohort (GSE185855) may be due to the small number, or lack of, differentially expressed genes in the D_vs_H and P_vs_A tests for this cohort (Figure 4 and Figure 5, respectively), which makes the PAL/SPIA and DEI calculations highly unreliable. High p-values for the differential Student’s t-test with pathway values for untreated and treated non-responders confirm this unreliability. On the other hand, the differential genes for the R_vs_N test with the GSE185855 dataset were rather numerous (Figure 6A)—most of these genes showed a more drastic dysregulation in the responder group, thus reflecting the negative value for DEI/DEIm/DEIb (Table 3).
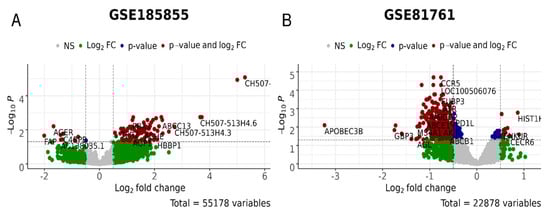
Figure 6.
Differential gene expression analysis for the R_vs_N test, i.e., PTSD/TRD patients who were responsive or non-responsive to treatments in GSE185855 (A) and GSE81761 (B) cohorts. In green, genes with the expression values of log2 > 0.5 and log2 < −0.5; in blue, genes significantly (p < 0.05) differently expressed; in red, genes that are significantly differently expressed with the differences of log2 > 0.5 and log2 < −0.5.
4. Future Perspectives
The omics-based personalized approach has been popular for cancer [52,95], hereditary diseases [96,97], endocrine disorders [98,99,100], immunological/infectious diseases [101,102,103], neurological conditions [104], regenerative medicine/geriatrics [98,105,106], etc., for approximately a decade.
The systems bioinformatics approach to personalized drug prescription uses different paradigms. First, we can focus on pathway activation data, which have higher reliability and robustness than single/handfuls of gene expression and mutation profiles [89]. We can use aggregated (cumulative) PAL and mutation burden values as personalized markers for the analysis of drug efficiency [67]. We refer to this paradigm for personalized drug prescription as an a posteriori, or non-hypothesis-driven, approach. It relies on direct mathematical association of molecular and clinical features in the training dataset, using machine learning (ML)/artificial intelligence (AI) applications [90,91].
Another paradigm, an a priori, or hypothesis-driven, approach links molecular pathway activation with specific targets of drugs and ranks these drugs according to their ability to restore the healthy state within the cell [52]. Despite its greater complexity, we can say that this approach may be more appropriate for clinical implementation.
On the other hand, we have already proposed and verified (for the action of cannabis drugs on the skin, oral, and intestinal epithelial cells) the method and software for omics-based personalized scoring of treatment efficiency. Like many, if not most, other omics-based personalized medicine projects, our DEI (drug efficiency index) metric [51] uses the following methodology:
- The Big Data full expression profiles, obtained via ether microarray hybridization (MH) or next-generation sequencing (NGS) of mRNA are used as input data for PAL calculations;
- For each gene, we calculate the case-to-control log-fold changes (LFCs) using full expression profiles;
- We then unitize these LFCs for the assessment of PAL, including Oncobox PAL [67], or SPIA (signaling pathway impact analysis) metrics [71], according to the protein–protein interactions graphs for each pathway.
However, unlike the Oncobox [52] approach to the assessment of personalized drug efficiency, our DEI [51] method does not exploit the purely a priori paradigm. Instead, it compares the SPIA values before and after treatment to check which state (pre- or post-treatment) differs more from healthy conditions. Therefore, our DEI method is more a posteriori by type than the Oncobox approach.
To check whether our DEI method is helpful in psychiatry, we have attempted it for five PTSD cohorts and one TRD cohort. These six cohorts enlisted 379 cases and 413 control samples (overall, 791 profiles). Except for the TRD cohort (GSE185855), which contained patients treated with ketamine, all patients from the five PTSD cohorts did not receive any pharmaceutical treatment; instead, they were under observation during psychotherapy. Thus, we could not apply the Oncobox drug efficiency scoring (DES) approach [52,107] since psychotherapy has no molecular targets.
Our analysis of the DEI metric for the psychotherapy of PTSD, as well as for the ketamine therapy of TRD, implied the following differential analysis of PAL values (both SPIA and Oncobox PAL), as well as of gene expression values:
- Case samples (PTSD or TRD) from control samples;
- Case samples after treatment or/and observation from before treatment (untreated);
- Samples from patients positively responding to the treatment from responding negatively or non-responding.
To assess the adequacy of the DEI metric for treatment success, we checked whether DEI values are positive as frequently as possible. According to this criterion, we achieved the best results for the DEI with SPIA values with a differential expression filter. The SPIA values without differential expression filter and Oncobox PAL values produced worse DEI results.
Only one PTSD (GSE81761) and the only TRD cohort (GSE185855) contained information on the clinical success of the therapy. For these cohorts, we tested the quality of the DEI metric in identifying responders versus non-responders only in these two cohorts; our analysis could differentiate, that is, provide the higher values for the responders.
We introduced two DEI modifications, mirrored DEI (DEIm) and balanced DEI (DEIb, the mean value over our original DEI, and mirrored DEI). The DEIm and DEIb values provided the proper difference between groups for the PTSD cohort. However, they did not produce meaningful results for the TRD cohort, perhaps because there were no reliable differentially expressed genes (DEG) in the disease-vs-healthy and after-vs-before treatment tests. This lack of DEG made every PAL, SPIA, and DEI calculation questionable, despite the abundance of DEG in the responders-vs-non-responders comparison.
The analysis of dysregulated genes showed the genes falling into the following categories: gene expression regulators on the level of chromatin, transcription, splicing, mRNA stability, and histone ubiquitination; immune response to bacteria, viruses, and fungi; signal transduction; ion transport; neuron morphogenesis, autophagy, and oxidative stress; cell division and differentiation. On a molecular level, dysregulation of these genes may cause multiple symptoms of PTSD. Indeed, a number of reports documented the dysfunction of the immune system in PTSD patients, including an increase in pro-inflammatory cytokines, immunosenescence, and decreased circulation of T cells [108]. PTSD also shows changes in neuronal morphology, disrupted neural plasticity, and substantial remodeling of dendrites [109].
Another question for the further application of the DEI/DEIm/DEIb metrics concerns cohort merging. For example, the cohort GSE64814 contained two sub-cohorts, one with data obtained with microarray hybridization (MH) Affymetrix Human Gene 1.0 ST Array (GPL6244), and the other with data obtained by sequencing with the NGS device Illumina HiSeq 2000 (GPL11154). Some methods can merge the unlimited number of MH and NGS cohorts. One of the most general examples is the uniformly shaped harmonization algorithm; however, this algorithm may affect the LFC values [110]. Therefore, this may invalidate the SPIA calculations with the differential expression filter. Thus, applying DEI/DEIm/DEIb metrics after transcriptomic harmonization may require more detailed research.
5. Conclusions
There is no consensus on the best treatment strategy for PTSD; some practitioners argue that the proverb “time cures” suggests the most proper treatment. To assess the clinical aspects of PTSD at the molecular and cell physiology level, we have applied the multi-omics personalized medicine approach to PTSD treatment. This approach utilizes Big Data on multi-omics (genome, transcriptome, proteome, etc.) profiling to study the physiological properties of healthy and pathological samples at the level of different cellular pathways.
Previously, we introduced the DEI, a metric for a drug’s ability to restore a healthy state in the gene expression pathways. Here, we have applied the DEI concept to the transcriptomics data from six cohorts of PTSD and TRD patients. We found that the best treatment should not only make the pathway activation levels similar to the healthy state (as we suggested previously) but should also encourage the pathological changes to disappear by reverting the sign of pathway activation levels.
In addition, we concluded that any type of DEI is adequate only when there are significant differences between the healthy vs. pathological and treated vs. untreated gene expression profiles. The differential gene expression analysis (based on the area under the receiver-operating curve (robust AUC) and negative binomial distribution (DESeq2)) confirms this finding.
Supplementary Materials
The following supporting information can be downloaded at: https://www.mdpi.com/article/10.3390/psychoactives2020007/s1, File S1: Robust marker gene (with Gene Ontology) and pathway set for the dataset GSE860; File S2: Robust marker gene (with Gene Ontology) and pathway set for the dataset GSE64814-GPL6244; File S3: Robust marker gene (with Gene Ontology) and pathway set for the dataset GSE64814-GPL11154; File S4: Robust marker gene (with Gene Ontology) and pathway set for the dataset GSE97356; File S5: Robust marker gene (with Gene Ontology) and pathway set for the dataset GSE81761; File S6: Robust marker gene (with Gene Ontology) path pathway set or the dataset GSE185855; File S7: Description of function of genes in various cohort comparisons. File S8: Differentially expressed genes from different cohorts and categories; File S9: Genes overlapping between the robust maker genes (AUC criteria) and the differentially expressed genes (DESeq2 criteria).
Author Contributions
Conceptualization, I.K., O.K.; methodology, N.B., B.B., Y.I.; software, B.B., N.B.; validation, N.B., I.K.; formal analysis, N.B.; resources, B.B., I.K., O.K.; data curation, N.B., I.K.; writing—original draft, N.B., I.K.; writing—review and editing, N.B., I.K., O.K.; visualization, N.B., I.K.; supervision, I.K., O.K.; funding acquisition, I.K., O.K. All authors have read and agreed to the published version of the manuscript.
Funding
This research was funded by MITACS, grant numbers IT11447, IT15089.
Institutional Review Board Statement
Not applicable.
Informed Consent Statement
Not applicable.
Data Availability Statement
The data from all cohorts analyzed here have been published and listed in the Methods Section.
Conflicts of Interest
The authors declare no conflict of interest.
Abbreviations
| AI | Artificial intelligence |
| APAP | Automatic positive airway pressure |
| ARR | Activator/repressor role |
| AUC | Area under curve |
| BEP | Brief eclectic psychotherapy |
| CBT-i | Cognitive behavioral therapy for insomnia |
| CDEI | Cannabis drug efficiency index |
| DEG | Differentially expressed genes |
| DEI | Drug efficiency index |
| DEIb | Balanced drug efficiency index |
| DEIm | Mirrored drug efficiency index |
| DES | Drug efficiency score |
| DESeq2 | Differential gene expression analysis in sequencing 2 |
| EMDR | Eye movement desensitization and reprocessing |
| FloWPS | Floating-window projective separator |
| GAD | Generalized anxiety disorder |
| GO | Gene ontology |
| iPANDA | In silico pathway activation network decomposition analysis |
| LFC | Log-fold change |
| MDD | Major depressive disorder |
| MH | Microarray hybridization |
| ML | Machine learning |
| NET | Narrative exposure therapy |
| NGS | Next-generation sequencing |
| NII | Node involvement index |
| PAL | Pathway activation level |
| PE | Pathway-express |
| PTSD | Post-traumatic stress disorder |
| QN | Quantile normalization |
| SNRI | Serotonin–norepinephrine reuptake inhibitor |
| SPIA | Signaling pathway impact analysis |
| SSRI | Selective serotonin reuptake inhibitors |
| TAPPA | Topology analysis of pathway phenotype association |
| TBScore | Topology-based score |
| TRD | Treatment-resistant depression |
References
- Tarhan, N.; Konuk, M.; Karahan, M.; Özcan, Ö.Ö.; Öztürk Ayvaz, S.; Hızlı Sayar, G.; Ülküer, N.; Ayas, H.; Zeynep Güder, F. New diagnosis and treatment approaches to post-traumatic stress disorder. In Stress-Related Disorders; Ovuga, E., Ed.; IntechOpen: London, UK, 2022; ISBN 978-1-80355-363-4. [Google Scholar]
- Ehlers, A.; Hackmann, A.; Michael, T. Intrusive Re-experiencing in Post-traumatic Stress Disorder: Phenomenology, Theory, and Therapy. Memory 2004, 12, 403–415. [Google Scholar] [CrossRef] [PubMed]
- Bisson, J.I.; Cosgrove, S.; Lewis, C.; Robert, N.P. Post-Traumatic Stress Disorder. BMJ 2015, 351, h6161. [Google Scholar] [CrossRef] [PubMed]
- Hoskins, M.; Pearce, J.; Bethell, A.; Dankova, L.; Barbui, C.; Tol, W.A.; van Ommeren, M.; de Jong, J.; Seedat, S.; Chen, H.; et al. Pharmacotherapy for Post-Traumatic Stress Disorder: Systematic Review and Meta-Analysis. Br. J. Psychiatry 2015, 206, 93–100. [Google Scholar] [CrossRef] [PubMed]
- Edmondson, D. An Enduring Somatic Threat Model of Posttraumatic Stress Disorder Due to Acute Life-Threatening Medical Events: Enduring Somatic Threat Model. Soc. Personal. Psychol. Compass 2014, 8, 118–134. [Google Scholar] [CrossRef]
- McHugh, P.R.; Treisman, G. PTSD: A Problematic Diagnostic Category. J. Anxiety Disord. 2007, 21, 211–222. [Google Scholar] [CrossRef]
- Brunet, A.; Akerib, V.; Birmes, P. Don’t Throw out the Baby with the Bathwater (PTSD Is Not Overdiagnosed). Can. J. Psychiatry 2007, 52, 501–502; discussion 503. [Google Scholar] [CrossRef]
- Kilpatrick, D.G.; Resnick, H.S.; Milanak, M.E.; Miller, M.W.; Keyes, K.M.; Friedman, M.J. National Estimates of Exposure to Traumatic Events and PTSD Prevalence Using DSM-IV and DSM-5 Criteria: DSM-5 PTSD Prevalence. J. Trauma. Stress 2013, 26, 537–547. [Google Scholar] [CrossRef]
- Breslau, N. The Epidemiology of Trauma, PTSD, and Other Posttrauma Disorders. Trauma Violence Abus. 2009, 10, 198–210. [Google Scholar] [CrossRef]
- Ditlevsen, D.N.; Elklit, A. Gender, Trauma Type, and PTSD Prevalence: A Re-Analysis of 18 Nordic Convenience Samples. Ann. Gen. Psychiatry 2012, 11, 26. [Google Scholar] [CrossRef]
- Powers, M.B.; Halpern, J.M.; Ferenschak, M.P.; Gillihan, S.J.; Foa, E.B. A Meta-Analytic Review of Prolonged Exposure for Posttraumatic Stress Disorder. Clin. Psychol. Rev. 2010, 30, 635–641. [Google Scholar] [CrossRef]
- Lee, C.W.; Cuijpers, P. A Meta-Analysis of the Contribution of Eye Movements in Processing Emotional Memories. J. Behav. Ther. Exp. Psychiatry 2013, 44, 231–239. [Google Scholar] [CrossRef]
- Amos, T.; Stein, D.J.; Ipser, J.C. Pharmacological Interventions for Preventing Post-Traumatic Stress Disorder (PTSD). Cochrane Database Syst. Rev. 2014, 8, CD006239. [Google Scholar] [CrossRef]
- Sloan, D.M.; Marx, B.P. Written Exposure Therapy for PTSD: A Brief Treatment Approach for Mental Health Professionals; American Psychological Association: Washington, DC, USA, 2019; ISBN 978-1-4338-3013-6. [Google Scholar]
- Brewin, C.R.; Andrews, B.; Valentine, J.D. Meta-Analysis of Risk Factors for Posttraumatic Stress Disorder in Trauma-Exposed Adults. J. Consult. Clin. Psychol. 2000, 68, 748–766. [Google Scholar] [CrossRef]
- Ozer, E.J.; Best, S.R.; Lipsey, T.L.; Weiss, D.S. Predictors of Posttraumatic Stress Disorder and Symptoms in Adults: A Meta-Analysis. Psychol. Bull. 2003, 129, 52–73. [Google Scholar] [CrossRef]
- Bleiberg, K.L.; Markowitz, J.C. A Pilot Study of Interpersonal Psychotherapy for Posttraumatic Stress Disorder. Am. J. Psychiatry 2005, 162, 181–183. [Google Scholar] [CrossRef]
- Markowitz, J.C. IPT and PTSD. Depress. Anxiety 2010, 27, 879–881. [Google Scholar] [CrossRef]
- Markowitz, J.C.; Milrod, B.; Bleiberg, K.; Marshall, R.D. Interpersonal Factors in Understanding and Treating Posttraumatic Stress Disorder. J. Psychiatr. Pract. 2009, 15, 133–140. [Google Scholar] [CrossRef]
- Lawrence, S.; De Silva, M.; Henley, R. Sports and Games for Post-Traumatic Stress Disorder (PTSD). Cochrane Database Syst. Rev. 2010, 2010, CD007171. [Google Scholar] [CrossRef]
- Roberts, N.P.; Kitchiner, N.J.; Kenardy, J.; Robertson, L.; Lewis, C.; Bisson, J.I. Multiple Session Early Psychological Interventions for the Prevention of Post-Traumatic Stress Disorder. Cochrane Database Syst. Rev. 2019, 8, CD006869. [Google Scholar] [CrossRef]
- World Health Organization; UNHCR. Assessment and Management of Conditions Specifically Related to Stress: MhGAP Intervention Guide Mode; World Health Organization: Geneva, Switzerland, 2013; ISBN 978-92-4-150593-2. [Google Scholar]
- Birur, B.; Moore, N.C.; Davis, L.L. An Evidence-Based Review of Early Intervention and Prevention of Posttraumatic Stress Disorder. Community Ment. Health J. 2017, 53, 183–201. [Google Scholar] [CrossRef]
- Frijling, J.; Olff, M.; van Zuiden, M. Pharmacological Prevention of PTSD: Current Evidence for Clinical Practice. Psychiatr. Ann. 2019, 49, 307–313. [Google Scholar] [CrossRef]
- Williams, T.; Phillips, N.J.; Stein, D.J.; Ipser, J.C. Pharmacotherapy for Post Traumatic Stress Disorder (PTSD). Cochrane Database Syst. Rev. 2022, 3, CD002795. [Google Scholar] [CrossRef] [PubMed]
- Jeffreys, M.; Capehart, B.; Friedman, M.J. Pharmacotherapy for Posttraumatic Stress Disorder: Review with Clinical Applications. J. Rehabil. Res. Dev. 2012, 49, 703–715. [Google Scholar] [CrossRef] [PubMed]
- Puetz, T.W.; Youngstedt, S.D.; Herring, M.P. Effects of Pharmacotherapy on Combat-Related PTSD, Anxiety, and Depression: A Systematic Review and Meta-Regression Analysis. PLoS ONE 2015, 10, e0126529. [Google Scholar] [CrossRef]
- Jain, S.; Greenbaum, M.A.; Rosen, C. Concordance between Psychotropic Prescribing for Veterans with PTSD and Clinical Practice Guidelines. Psychiatr. Serv. 2012, 63, 154–160. [Google Scholar] [CrossRef]
- Vergoulis, T.; Vlachos, I.S.; Alexiou, P.; Georgakilas, G.; Maragkakis, M.; Reczko, M.; Gerangelos, S.; Koziris, N.; Dalamagas, T.; Hatzigeorgiou, A.G. TarBase 6.0: Capturing the Exponential Growth of MiRNA Targets with Experimental Support. Nucleic Acids Res. 2012, 40, D222–D229. [Google Scholar] [CrossRef]
- Kuan, P.-F.; Waszczuk, M.A.; Kotov, R.; Clouston, S.; Yang, X.; Singh, P.K.; Glenn, S.T.; Cortes Gomez, E.; Wang, J.; Bromet, E.; et al. Gene Expression Associated with PTSD in World Trade Center Responders: An RNA Sequencing Study. Transl. Psychiatry 2017, 7, 1297. [Google Scholar] [CrossRef]
- Griffin, G.D.; Charron, D.; Al-Daccak, R. Post-Traumatic Stress Disorder: Revisiting Adrenergics, Glucocorticoids, Immune System Effects and Homeostasis. Clin. Transl. Immunol. 2014, 3, e27. [Google Scholar] [CrossRef]
- Black, N.; Stockings, E.; Campbell, G.; Tran, L.T.; Zagic, D.; Hall, W.D.; Farrell, M.; Degenhardt, L. Cannabinoids for the Treatment of Mental Disorders and Symptoms of Mental Disorders: A Systematic Review and Meta-Analysis. Lancet Psychiatry 2019, 6, 995–1010. [Google Scholar] [CrossRef]
- O’Neil, M.E.; Nugent, S.M.; Morasco, B.J.; Freeman, M.; Low, A.; Kondo, K.; Zakher, B.; Elven, C.; Motu’apuaka, M.; Paynter, R.; et al. Benefits and Harms of Plant-Based Cannabis for Posttraumatic Stress Disorder: A Systematic Review. Ann. Intern. Med. 2017, 167, 332–340. [Google Scholar] [CrossRef]
- Bonn-Miller, M.O.; Sisley, S.; Riggs, P.; Yazar-Klosinski, B.; Wang, J.B.; Loflin, M.J.E.; Shechet, B.; Hennigan, C.; Matthews, R.; Emerson, A.; et al. The Short-Term Impact of 3 Smoked Cannabis Preparations versus Placebo on PTSD Symptoms: A Randomized Cross-over Clinical Trial. PLoS ONE 2021, 16, e0246990. [Google Scholar] [CrossRef]
- Orsolini, L.; Chiappini, S.; Volpe, U.; Berardis, D.D.; Latini, R.; Papanti, G.D.; Corkery, A.J.M. Use of Medicinal Cannabis and Synthetic Cannabinoids in Post-Traumatic Stress Disorder (PTSD): A Systematic Review. Medicina 2019, 55, 525. [Google Scholar] [CrossRef]
- Sbarski, B.; Akirav, I. Cannabinoids as Therapeutics for PTSD. Pharmacol. Ther. 2020, 211, 107551. [Google Scholar] [CrossRef]
- Stanciu, C.N.; Brunette, M.F.; Teja, N.; Budney, A.J. Evidence for Use of Cannabinoids in Mood Disorders, Anxiety Disorders, and PTSD: A Systematic Review. Psychiatr. Serv. 2021, 72, 429–436. [Google Scholar] [CrossRef]
- Krediet, E.; Bostoen, T.; Breeksema, J.; van Schagen, A.; Passie, T.; Vermetten, E. Reviewing the Potential of Psychedelics for the Treatment of PTSD. Int. J. Neuropsychopharmacol. 2020, 23, 385–400. [Google Scholar] [CrossRef]
- Babson, K.A.; Sottile, J.; Morabito, D. Cannabis, Cannabinoids, and Sleep: A Review of the Literature. Curr. Psychiatry Rep. 2017, 19, 23. [Google Scholar] [CrossRef]
- Fraguas-Sánchez, A.I.; Torres-Suárez, A.I. Medical Use of Cannabinoids. Drugs 2018, 78, 1665–1703. [Google Scholar] [CrossRef]
- Loflin, M.J.; Babson, K.A.; Bonn-Miller, M.O. Cannabinoids as Therapeutic for PTSD. Curr. Opin. Psychol. 2017, 14, 78–83. [Google Scholar] [CrossRef]
- Garakani, A.; Murrough, J.W.; Freire, R.C.; Thom, R.P.; Larkin, K.; Buono, F.D.; Iosifescu, D.V. Pharmacotherapy of Anxiety Disorders: Current and Emerging Treatment Options. Front. Psychiatry 2020, 11, 595584. [Google Scholar] [CrossRef]
- Lowe, D.J.E.; Sasiadek, J.D.; Coles, A.S.; George, T.P. Cannabis and Mental Illness: A Review. Eur. Arch. Psychiatry Clin. Neurosci. 2019, 269, 107–120. [Google Scholar] [CrossRef]
- Betthauser, K.; Pilz, J.; Vollmer, L.E. Use and Effects of Cannabinoids in Military Veterans with Posttraumatic Stress Disorder. Am. J. Health Syst. Pharm. 2015, 72, 1279–1284. [Google Scholar] [CrossRef] [PubMed]
- Yarnell, S. The Use of Medicinal Marijuana for Posttraumatic Stress Disorder: A Review of the Current Literature. Prim. Care Companion CNS Disord. 2015, 17, PCC.15r01786. [Google Scholar] [CrossRef] [PubMed]
- Mahabir, V.K.; Merchant, J.J.; Smith, C.; Garibaldi, A. Medical Cannabis Use in the United States: A Retrospective Database Study. J. Cannabis Res. 2020, 2, 32. [Google Scholar] [CrossRef] [PubMed]
- Bridgeman, M.B.; Abazia, D.T. Medicinal Cannabis: History, Pharmacology, And Implications for the Acute Care Setting. P&T 2017, 42, 180–188. [Google Scholar]
- Shishko, I.; Oliveira, R.; Moore, T.A.; Almeida, K. A Review of Medical Marijuana for the Treatment of Posttraumatic Stress Disorder: Real Symptom Re-Leaf or Just High Hopes? Ment. Health Clin. 2018, 8, 86–94. [Google Scholar] [CrossRef]
- Wilkinson, S.T.; Yarnell, S.; Radhakrishnan, R.; Ball, S.A.; D’Souza, D.C. Marijuana Legalization: Impact on Physicians and Public Health. Annu. Rev. Med. 2016, 67, 453–466. [Google Scholar] [CrossRef]
- Belendiuk, K.A.; Baldini, L.L.; Bonn-Miller, M.O. Narrative Review of the Safety and Efficacy of Marijuana for the Treatment of Commonly State-Approved Medical and Psychiatric Disorders. Addict. Sci. Clin. Pract. 2015, 10, 10. [Google Scholar] [CrossRef]
- Borisov, N.; Ilnytskyy, Y.; Byeon, B.; Kovalchuk, O.; Kovalchuk, I. System, Method and Software for Calculation of a Cannabis Drug Efficiency Index for the Reduction of Inflammation. Int. J. Mol. Sci. 2020, 22, 388. [Google Scholar] [CrossRef]
- Tkachev, V.; Sorokin, M.; Garazha, A.; Borisov, N.; Buzdin, A. Oncobox Method for Scoring Efficiencies of Anticancer Drugs Based on Gene Expression Data. In Nucleic Acid Detection and Structural Investigations; Astakhova, K., Bukhari, S.A., Eds.; Springer: New York, NY, USA, 2020; Volume 2063, pp. 235–255. ISBN 978-1-07-160137-2. [Google Scholar]
- Wang, Y.; Chu, F.; Lin, J.; Li, Y.; Johnson, N.; Zhang, J.; Gai, C.; Su, Z.; Cheng, H.; Wang, L.; et al. Erianin, the Main Active Ingredient of Dendrobium Chrysotoxum Lindl, Inhibits Precancerous Lesions of Gastric Cancer (PLGC) through Suppression of the HRAS-PI3K-AKT Signaling Pathway as Revealed by Network Pharmacology and in Vitro Experimental Verification. J. Ethnopharmacol. 2021, 279, 114399. [Google Scholar] [CrossRef]
- Khojasteh Poor, F.; Keivan, M.; Ramazii, M.; Ghaedrahmati, F.; Anbiyaiee, A.; Panahandeh, S.; Khoshnam, S.E.; Farzaneh, M. Mini Review: The FDA-Approved Prescription Drugs That Target the MAPK Signaling Pathway in Women with Breast Cancer. Breast Dis. 2021, 40, 51–62. [Google Scholar] [CrossRef]
- Yuan, L.; Zhou, M.; Huang, D.; Wasan, H.S.; Zhang, K.; Sun, L.; Huang, H.; Ma, S.; Shen, M.; Ruan, S. Resveratrol Inhibits the Invasion and Metastasis of Colon Cancer through Reversal of Epithelial- Mesenchymal Transition via the AKT/GSK-3β/Snail Signaling Pathway. Mol. Med. Rep. 2019, 20, 2783–2795. [Google Scholar] [CrossRef] [PubMed]
- Li, J.-X.; Li, R.-Z.; Sun, A.; Zhou, H.; Neher, E.; Yang, J.-S.; Huang, J.-M.; Zhang, Y.-Z.; Jiang, Z.-B.; Liang, T.-L.; et al. Metabolomics and Integrated Network Pharmacology Analysis Reveal Tricin as the Active Anti-Cancer Component of Weijing Decoction by Suppression of PRKCA and Sphingolipid Signaling. Pharmacol. Res. 2021, 171, 105574. [Google Scholar] [CrossRef] [PubMed]
- He, D.; Huang, J.-H.; Zhang, Z.-Y.; Du, Q.; Peng, W.-J.; Yu, R.; Zhang, S.-F.; Zhang, S.-H.; Qin, Y.-H. A Network Pharmacology-Based Strategy for Predicting Active Ingredients and Potential Targets of LiuWei DiHuang Pill in Treating Type 2 Diabetes Mellitus. Drug Des. Dev. Ther. 2019, 13, 3989–4005. [Google Scholar] [CrossRef] [PubMed]
- Qiu, Z.; Dong, J.; Xue, C.; Li, X.; Liu, K.; Liu, B.; Cheng, J.; Huang, F. Liuwei Dihuang Pills Alleviate the Polycystic Ovary Syndrome with Improved Insulin Sensitivity through PI3K/Akt Signaling Pathway. J. Ethnopharmacol. 2020, 250, 111965. [Google Scholar] [CrossRef] [PubMed]
- Wang, Y.; Sang, X.; Shao, R.; Qin, H.; Chen, X.; Xue, Z.; Li, L.; Wang, Y.; Zhu, Y.; Chang, Y.; et al. Xuanfei Baidu Decoction Protects against Macrophages Induced Inflammation and Pulmonary Fibrosis via Inhibiting IL-6/STAT3 Signaling Pathway. J. Ethnopharmacol. 2022, 283, 114701. [Google Scholar] [CrossRef]
- Li, X.; Shan, C.; Wu, Z.; Yu, H.; Yang, A.; Tan, B. Emodin Alleviated Pulmonary Inflammation in Rats with LPS-Induced Acute Lung Injury through Inhibiting the MTOR/HIF-1α/VEGF Signaling Pathway. Inflamm. Res. 2020, 69, 365–373. [Google Scholar] [CrossRef]
- Zhao, J.; Tian, S.; Lu, D.; Yang, J.; Zeng, H.; Zhang, F.; Tu, D.; Ge, G.; Zheng, Y.; Shi, T.; et al. Systems Pharmacological Study Illustrates the Immune Regulation, Anti-Infection, Anti-Inflammation, and Multi-Organ Protection Mechanism of Qing-Fei-Pai-Du Decoction in the Treatment of COVID-19. Phytomedicine 2021, 85, 153315. [Google Scholar] [CrossRef]
- Li, Y.; Chu, F.; Li, P.; Johnson, N.; Li, T.; Wang, Y.; An, R.; Wu, D.; Chen, J.; Su, Z.; et al. Potential Effect of Maxing Shigan Decoction against Coronavirus Disease 2019 (COVID-19) Revealed by Network Pharmacology and Experimental Verification. J. Ethnopharmacol. 2021, 271, 113854. [Google Scholar] [CrossRef]
- Shatzel, J.J.; Olson, S.R.; Tao, D.L.; McCarty, O.J.T.; Danilov, A.V.; DeLoughery, T.G. Ibrutinib-Associated Bleeding: Pathogenesis, Management and Risk Reduction Strategies. J. Thromb. Haemost. 2017, 15, 835–847. [Google Scholar] [CrossRef]
- Wu, N.; Yuan, T.; Yin, Z.; Yuan, X.; Sun, J.; Wu, Z.; Zhang, Q.; Redshaw, C.; Yang, S.; Dai, X. Network Pharmacology and Molecular Docking Study of the Chinese Miao Medicine Sidaxue in the Treatment of Rheumatoid Arthritis. Drug Des. Devel. Ther. 2022, 16, 435–466. [Google Scholar] [CrossRef]
- Ozerov, I.V.; Lezhnina, K.V.; Izumchenko, E.; Artemov, A.V.; Medintsev, S.; Vanhaelen, Q.; Aliper, A.; Vijg, J.; Osipov, A.N.; Labat, I.; et al. In Silico Pathway Activation Network Decomposition Analysis (IPANDA) as a Method for Biomarker Development. Nat. Commun. 2016, 7, 13427. [Google Scholar] [CrossRef]
- Lashmanova, E.; Zemskaya, N.; Proshkina, E.; Kudryavtseva, A.; Volosnikova, M.; Marusich, E.; Leonov, S.; Zhavoronkov, A.; Moskalev, A. The Evaluation of Geroprotective Effects of Selected Flavonoids in Drosophila Melanogaster and Caenorhabditis Elegans. Front. Pharmacol. 2017, 8, 884. [Google Scholar] [CrossRef]
- Borisov, N.; Sorokin, M.; Garazha, A.; Buzdin, A. Quantitation of Molecular Pathway Activation Using RNA Sequencing Data. In Nucleic Acid Detection and Structural Investigations; Astakhova, K., Bukhari, S.A., Eds.; Springer: New York, NY, USA, 2020; Volume 2063, pp. 189–206. ISBN 978-1-07-160137-2. [Google Scholar]
- Gao, S.; Wang, X. TAPPA: Topological Analysis of Pathway Phenotype Association. Bioinformics 2007, 23, 3100–3102. [Google Scholar] [CrossRef]
- Ibrahim, M.A.-H.; Jassim, S.; Cawthorne, M.A.; Langlands, K. A Topology-Based Score for Pathway Enrichment. J. Comput. Biol. A J. Comput. Mol. Cell Biol. 2012, 19, 563–573. [Google Scholar] [CrossRef]
- Draghici, S.; Khatri, P.; Tarca, A.L.; Amin, K.; Done, A.; Voichita, C.; Georgescu, C.; Romero, R. A Systems Biology Approach for Pathway Level Analysis. Genome Res. 2007, 17, 1537–1545. [Google Scholar] [CrossRef]
- Tarca, A.L.; Draghici, S.; Khatri, P.; Hassan, S.S.; Mittal, P.; Kim, J.-S.; Kim, C.J.; Kusanovic, J.P.; Romero, R. A Novel Signaling Pathway Impact Analysis. Bioinformatics 2009, 25, 75–82. [Google Scholar] [CrossRef]
- Nishimura, D. BioCarta. Biotech Softw. Internet Rep. 2001, 2, 117–120. [Google Scholar] [CrossRef]
- Nakaya, A.; Katayama, T.; Itoh, M.; Hiranuka, K.; Kawashima, S.; Moriya, Y.; Okuda, S.; Tanaka, M.; Tokimatsu, T.; Yamanishi, Y.; et al. KEGG OC: A Large-Scale Automatic Construction of Taxonomy-Based Ortholog Clusters. Nucleic Acids Res. 2013, 41, D353–D357. [Google Scholar] [CrossRef]
- Romero, P.; Wagg, J.; Green, M.L.; Kaiser, D.; Krummenacker, M.; Karp, P.D. Computational Prediction of Human Metabolic Pathways from the Complete Human Genome. Genome Biol. 2004, 6, R2. [Google Scholar] [CrossRef]
- Schaefer, C.F.; Anthony, K.; Krupa, S.; Buchoff, J.; Day, M.; Hannay, T.; Buetow, K.H. PID: The Pathway Interaction Database. Nucleic Acids Res. 2009, 37, D674–D679. [Google Scholar] [CrossRef]
- Croft, D.; Mundo, A.F.; Haw, R.; Milacic, M.; Weiser, J.; Wu, G.; Caudy, M.; Garapati, P.; Gillespie, M.; Kamdar, M.R.; et al. The Reactome Pathway Knowledgebase. Nucleic Acids Res. 2014, 42, D472–D477. [Google Scholar] [CrossRef] [PubMed]
- Wishart, D.S.; Li, C.; Marcu, A.; Badran, H.; Pon, A.; Budinski, Z.; Patron, J.; Lipton, D.; Cao, X.; Oler, E.; et al. PathBank: A Comprehensive Pathway Database for Model Organisms. Nucleic Acids Res. 2020, 48, D470–D478. [Google Scholar] [CrossRef] [PubMed]
- Bolstad, B. Preprocessing and Normalization for Affymetrix GeneChip Expression Microarrays. In Methods in Microarray Normalization; Stafford, P., Ed.; CRC Press: Boca Raton, FL, USA, 2008; pp. 41–59. ISBN 978-1-4200-5278-7. [Google Scholar]
- Love, M.I.; Huber, W.; Anders, S. Moderated Estimation of Fold Change and Dispersion for RNA-Seq Data with DESeq2. Genome Biol. 2014, 15, 550. [Google Scholar] [CrossRef] [PubMed]
- Segman, R.H.; Shefi, N.; Goltser-Dubner, T.; Friedman, N.; Kaminski, N.; Shalev, A.Y. Peripheral Blood Mononuclear Cell Gene Expression Profiles Identify Emergent Post-Traumatic Stress Disorder among Trauma Survivors. Mol. Psychiatry 2005, 10, 425, 500–513. [Google Scholar] [CrossRef]
- Breen, M.S.; Maihofer, A.X.; Glatt, S.J.; Tylee, D.S.; Chandler, S.D.; Tsuang, M.T.; Risbrough, V.B.; Baker, D.G.; O’Connor, D.T.; Nievergelt, C.M.; et al. Gene Networks Specific for Innate Immunity Define Post-Traumatic Stress Disorder. Mol. Psychiatry 2015, 20, 1538–1545. [Google Scholar] [CrossRef]
- Rusch, H.L.; Robinson, J.; Yun, S.; Osier, N.D.; Martin, C.; Brewin, C.R.; Gill, J.M. Gene Expression Differences in PTSD Are Uniquely Related to the Intrusion Symptom Cluster: A Transcriptome-Wide Analysis in Military Service Members. Brain Behav. Immun. 2019, 80, 904–908. [Google Scholar] [CrossRef]
- Kuan, P.-F.; Ren, X.; Clouston, S.; Yang, X.; Jonas, K.; Kotov, R.; Bromet, E.; Luft, B.J. PTSD Is Associated with Accelerated Transcriptional Aging in World Trade Center Responders. Transl. Psychiatry 2021, 11, 311. [Google Scholar] [CrossRef]
- Cathomas, F.; Bevilacqua, L.; Ramakrishnan, A.; Kronman, H.; Costi, S.; Schneider, M.; Chan, K.L.; Li, L.; Nestler, E.J.; Shen, L.; et al. Whole Blood Transcriptional Signatures Associated with Rapid Antidepressant Response to Ketamine in Patients with Treatment Resistant Depression. Transl. Psychiatry 2022, 12, 12. [Google Scholar] [CrossRef]
- Sorokin, M.; Borisov, N.; Kuzmin, D.; Gudkov, A.; Zolotovskaia, M.; Garazha, A.; Buzdin, A. Algorithmic Annotation of Functional Roles for Components of 3,044 Human Molecular Pathways. Front. Genet. 2021, 12, 617059. [Google Scholar] [CrossRef]
- Aliper, A.M.; Korzinkin, M.B.; Kuzmina, N.B.; Zenin, A.A.; Venkova, L.S.; Smirnov, P.Y.; Zhavoronkov, A.A.; Buzdin, A.A.; Borisov, N.M. Mathematical Justification of Expression-Based Pathway Activation Scoring (PAS). Methods Mol. Biol. 2017, 1613, 31–51. [Google Scholar] [CrossRef]
- Kuzmina, N.B.; Borisov, N.M. Handling Complex Rule-Based Models of Mitogenic Cell Signaling (On the Example of ERK Activation upon EGF Stimulation). Int. Proc. Chem. Biol. Environ. Eng. 2011, 5, 76–82. [Google Scholar]
- Zolotovskaia, M.A.; Tkachev, V.S.; Guryanova, A.A.; Simonov, A.M.; Raevskiy, M.M.; Efimov, V.V.; Wang, Y.; Sekacheva, M.I.; Garazha, A.V.; Borisov, N.M.; et al. OncoboxPD: Human 51 672 Molecular Pathways Database with Tools for Activity Calculating and Visualization. Comput. Struct. Biotechnol. J. 2022, 20, 2280–2291. [Google Scholar] [CrossRef]
- Borisov, N.; Suntsova, M.; Sorokin, M.; Garazha, A.; Kovalchuk, O.; Aliper, A.; Ilnitskaya, E.; Lezhnina, K.; Korzinkin, M.; Tkachev, V.; et al. Data Aggregation at the Level of Molecular Pathways Improves Stability of Experimental Transcriptomic and Proteomic Data. Cell Cycle 2017, 16, 1810–1823. [Google Scholar] [CrossRef]
- Tkachev, V.; Sorokin, M.; Mescheryakov, A.; Simonov, A.; Garazha, A.; Buzdin, A.; Muchnik, I.; Borisov, N. FLOating-Window Projective Separator (FloWPS): A Data Trimming Tool for Support Vector Machines (SVM) to Improve Robustness of the Classifier. Front. Genet. 2019, 9, 717. [Google Scholar] [CrossRef]
- Tkachev, V.; Sorokin, M.; Borisov, C.; Garazha, A.; Buzdin, A.; Borisov, N. Flexible Data Trimming Improves Performance of Global Machine Learning Methods in Omics-Based Personalized Oncology. Int. J. Mol. Sci. 2020, 21, 713. [Google Scholar] [CrossRef]
- Obuchowski, N.A. Receiver Operating Characteristic Curves and Their Use in Radiology. Radiology 2003, 229, 3–8. [Google Scholar] [CrossRef]
- Zhou, Y.; Zhou, B.; Pache, L.; Chang, M.; Khodabakhshi, A.H.; Tanaseichuk, O.; Benner, C.; Chanda, S.K. Metascape Provides a Biologist-Oriented Resource for the Analysis of Systems-Level Datasets. Nat. Commun. 2019, 10, 1523. [Google Scholar] [CrossRef]
- Borisov, N.; Sergeeva, A.; Suntsova, M.; Raevskiy, M.; Gaifullin, N.; Mendeleeva, L.; Gudkov, A.; Nareiko, M.; Garazha, A.; Tkachev, V.; et al. Machine Learning Applicability for Classification of PAD/VCD Chemotherapy Response Using 53 Multiple Myeloma RNA Sequencing Profiles. Front. Oncol. 2021, 11, 652063. [Google Scholar] [CrossRef]
- Zhou, R.; Wen, Z.; Liao, Y.; Wu, J.; Xi, S.; Zeng, D.; Sun, H.; Wu, J.; Shi, M.; Bin, J.; et al. Evaluation of Stromal Cell Infiltration in the Tumor Microenvironment Enable Prediction of Treatment Sensitivity and Prognosis in Colon Cancer. Comput. Struct. Biotechnol. J. 2022, 20, 2153–2168. [Google Scholar] [CrossRef]
- Tebani, A.; Afonso, C.; Marret, S.; Bekri, S. Omics-Based Strategies in Precision Medicine: Toward a Paradigm Shift in Inborn Errors of Metabolism Investigations. Int. J. Mol. Sci. 2016, 17, 1555. [Google Scholar] [CrossRef]
- Malas, T.B.; Leonhard, W.N.; Bange, H.; Granchi, Z.; Hettne, K.M.; Van Westen, G.J.P.; Price, L.S.; ’t Hoen, P.A.C.; Peters, D.J.M. Prioritization of Novel ADPKD Drug Candidates from Disease-Stage Specific Gene Expression Profiles. EBioMedicine 2020, 51, 102585. [Google Scholar] [CrossRef] [PubMed]
- Blaser, M.C.; Kraler, S.; Lüscher, T.F.; Aikawa, E. Multi-Omics Approaches to Define Calcific Aortic Valve Disease Pathogenesis. Circ. Res. 2021, 128, 1371–1397. [Google Scholar] [CrossRef] [PubMed]
- Thomford, N.E.; Senthebane, D.A.; Rowe, A.; Munro, D.; Seele, P.; Maroyi, A.; Dzobo, K. Natural Products for Drug Discovery in the 21st Century: Innovations for Novel Drug Discovery. Int. J. Mol. Sci. 2018, 19, 1578. [Google Scholar] [CrossRef] [PubMed]
- Zhang, M.; Luo, H.; Xi, Z.; Rogaeva, E. Drug Repositioning for Diabetes Based on “omics” Data Mining. PLoS ONE 2015, 10, e0126082. [Google Scholar] [CrossRef]
- Fadaka, A.O.; Sibuyi, N.R.S.; Martin, D.R.; Klein, A.; Madiehe, A.; Meyer, M. Development of Effective Therapeutic Molecule from Natural Sources against Coronavirus Protease. Int. J. Mol. Sci. 2021, 22, 9431. [Google Scholar] [CrossRef]
- Suratanee, A.; Plaimas, K. Heterogeneous Network Model to Identify Potential Associations Between Plasmodium Vivax and Human Proteins. Int. J. Mol. Sci. 2020, 21, 1310. [Google Scholar] [CrossRef]
- Danieli, M.G.; Tonacci, A.; Paladini, A.; Longhi, E.; Moroncini, G.; Allegra, A.; Sansone, F.; Gangemi, S. A Machine Learning Analysis to Predict the Response to Intravenous and Subcutaneous Immunoglobulin in Inflammatory Myopathies. A Proposal for a Future Multi-Omics Approach in Autoimmune Diseases. Autoimmun. Rev. 2022, 21, 103105. [Google Scholar] [CrossRef]
- Charoenkwan, P.; Chumnanpuen, P.; Schaduangrat, N.; Lio’, P.; Moni, M.A.; Shoombuatong, W. Improved Prediction and Characterization of Blood-Brain Barrier Penetrating Peptides Using Estimated Propensity Scores of Dipeptides. J. Comput. Aided. Mol. Des. 2022, 36, 781–796. [Google Scholar] [CrossRef]
- Aliper, A.M.; Csoka, A.B.; Buzdin, A.; Jetka, T.; Roumiantsev, S.; Moskalev, A.; Zhavoronkov, A. Signaling Pathway Activation Drift during Aging: Hutchinson-Gilford Progeria Syndrome Fibroblasts Are Comparable to Normal Middle-Age and Old-Age Cells. Aging 2015, 7, 26–37. [Google Scholar] [CrossRef]
- Makarev, E.; Cantor, C.; Zhavoronkov, A.; Buzdin, A.; Aliper, A.; Csoka, A.B. Pathway Activation Profiling Reveals New Insights into Age-Related Macular Degeneration and Provides Avenues for Therapeutic Interventions. Aging 2014, 6, 1064–1075. [Google Scholar] [CrossRef][Green Version]
- Poddubskaya, E.; Buzdin, A.; Garazha, A.; Sorokin, M.; Glusker, A.; Aleshin, A.; Allina, D.; Moiseev, A.; Sekacheva, M.; Suntsova, M.; et al. Oncobox, Gene Expression-Based Second Opinion System for Predicting Response to Treatment in Advanced Solid Tumors. J. Clin. Oncol. 2019, 37, e13143. [Google Scholar] [CrossRef]
- Neigh, G.N.; Ali, F.F. Co-Morbidity of PTSD and Immune System Dysfunction: Opportunities for Treatment. Curr. Opin. Pharmacol. 2016, 29, 104–110. [Google Scholar] [CrossRef]
- Monsour, M.; Ebedes, D.; Borlongan, C.V. A Review of the Pathology and Treatment of TBI and PTSD. Exp. Neurol. 2022, 351, 114009. [Google Scholar] [CrossRef]
- Borisov, N.; Buzdin, A. Transcriptomic Harmonization as the Way for Suppressing Cross-Platform Bias and Batch Effect. Biomedicines 2022, 10, 2318. [Google Scholar] [CrossRef]


Disclaimer/Publisher’s Note: The statements, opinions and data contained in all publications are solely those of the individual author(s) and contributor(s) and not of MDPI and/or the editor(s). MDPI and/or the editor(s) disclaim responsibility for any injury to people or property resulting from any ideas, methods, instructions or products referred to in the content. |
© 2023 by the authors. Licensee MDPI, Basel, Switzerland. This article is an open access article distributed under the terms and conditions of the Creative Commons Attribution (CC BY) license (https://creativecommons.org/licenses/by/4.0/).