Article

Optimization of Copper-Ammonia-Sulfate Electrolyte for Maximizing Cu(I):Cu(II) Ratio Using pH and Copper Solubility

by
Zulqarnain Ahmad Ali
and
Joshua M. Werner
*
Mining Engineering Department, University of Kentucky, Lexington, KY 40506, USA
*
Author to whom correspondence should be addressed.
Waste 2024, 2(4), 397-413; https://doi.org/10.3390/waste2040022
Submission received: 9 July 2024 / Revised: 26 September 2024 / Accepted: 26 September 2024 / Published: 8 October 2024

Abstract

:
An investigation has been carried out to understand the solution chemistry of the Cu-NH-SO4−2 system, focusing on the effect of pH on the solubility of copper in the solution and maximizing the Cu(I):Cu(II) ratio. A Pourbaix diagram for the Cu-N-S system has also been created using the HSC Chemistry software for a wide range of Cu-NH3 species, unlike most other studies that focused only on Cu(NH3)42+ and Cu(NH3)52+ (Cu(II)) as the dominant species. The Pourbaix diagram demonstrated that the Cu(I) exists as Cu(NH3)2+, while the Cu(II) species are present in the system as Cu(NH3)42+ and Cu(NH3)52+, depending upon the Eh and pH of the solution. Copper precipitation was observed in the electrolyte at pH values less than 8.0, and the precipitation behavior increased as the pH became acidic. The highest Cu(I):Cu(II) ratio was observed at higher pH values of 10.05 due to the higher solubility of copper at higher alkaline pH. The maximum Cu(II) concentration can be achieved at 4.0 M NH4OH and 0.76 M (NH4)2SO4. In the case of low pH, the highest Cu(I):Cu(II) ratio obtained was 0.91 against the 4.0 M and 0.25 M concentrations of NH4OH and (NH4)2SO4, respectively. Meanwhile, at high pH, the maximum Cu(I):Cu(II) ratio was 15.11 against the 0.25 M (NH4)2SO4 and 4.0 M NH4OH. Furthermore, the low pH experiments showed the equilibrium constant (K) K < 1, and the high pH experiments demonstrated K > 1, which justified the lower and higher copper concentrations in the solution, respectively.

1. Introduction

Ammonia salts have proven efficient in leaching copper from various sources, including e-waste, and have been reported in the literature [1]. Common ammonium salts include ammoniacal salts of sulfate, chloride, carbonate, and nitrate, and among all these salts, sulfate salt solutions have proved to be the best in terms of selective leaching of copper [2,3]. The leaching of unwanted metals other than copper (e.g., Pb, Ag, Sn, Ni, and Zn) proved higher in nitrate, carbonate, and chloride solutions than sulfate and also exhibited higher electrowinning potential. Greater than 95% copper recovery was reported in all the listed ammonium salts in 0.5 M NH3, 1 M ammonia salt, and 0.05 M Cu2+. In the given solutions, Pb, Ag, and Sn showed lower dissolution in ammonium sulfate, i.e., 5%, compared to other ammonium salts. Zn and Ni had relatively higher dissolution in ammonium salts than ammonium sulfate [4].
Koyama, Tanaka, Miyasaka, et al. [5] studied the cuprous ammonia complexes in the ammonium sulfate solutions and demonstrated their selectivity towards leaching copper. It was also more current efficient (i.e., >95%) in the electrowinning stage. The reason for the current efficiency not being 100% was attributed to the presence of Cu(II) in the solution [5]. To further elucidate the proposed copper ammoniacal system found in literature and herein. A leaching, solvent extraction and electrowinning circuit for copper-ammonium systems is presented in Figure 1 which shows the pre-existing Cu(II) in the electrolyte acts as the oxidizer, leaches the metallic copper in the feed sample, and produces Cu(I) with some slightly leached metallic impurities. The leached solution goes through solvent extraction to remove the metallic impurities and Cu(II). The purified Cu(I) solution goes to the electrowinning cell in the cathodic compartment, where Cu(I) accepts an electron, reduces to metallic copper, and deposits at the cathode. The spent electrolyte solution goes across the separating membrane to the anodic compartment to oxidize the Cu(I) to Cu(II) to reuse the electrolyte for leaching [6]. The diaphragm represented in the electrowinning compartment is supplied to minimize the transport of Cu(II) to the cathode. Several examples are possible see [7].
Z. H. I. Sun et al. [8] presented the reactions for the copper-ammonia system with the dissolved oxygen within the electrolyte as given in Equations (1)–(3). The copper reacted with dissolved oxygen to form cupric oxide, which then reacted with the dissolved ammonia to form the copper ammonia complex of carbonate, as the salt used was ammonium carbonate [8].
Cu + ½O2 → CuO
CuO + 2NH3·H2O +(NH4)2CO3 → 2Cu(NH3)4CO3 + 3H2O
Overall Reaction
Cu + 2NH3·H2O + 2NH4+ + CO32− + ½O2 → Cu(NH3)42+ + 3H2O + CO32−
Radmehr et al. [9] also provided detailed reactions for Cu(OH)2 dissolution and formation of copper-ammine complex, water breakage, and electrowinning reactions as described in the equations (4)–(10). The cupric hydroxide dissociates into the cupric and hydroxide ions, and the cupric ion reacts with ammonia to form a copper ammonia complex. The Cu(NH3)42+ specie was transported to the electrowinning cell, accepted an electron, and was converted into Cu(NH3)2+, which was further reduced to metallic copper at the cathode.
Cu(OH)2(s) ←→ Cu2+(aq) + 2OH(aq)
Cu2+(aq) + 2NH3(aq) ←→ Cu(NH3)22+(aq)
Cu(NH3)22+(aq) + 2NH3(aq) ←→ Cu(NH3)42+(aq)
2H+ + 2e → H2
O2 + 4H+ + 4e → H2O
Cu(NH3)42+ + e → Cu(NH3)2+ + 2NH3
Cu(NH3)2+ + e- → Cu + e → Cu + 2NH3
Another study presented an additional, much simpler leaching reaction (Equation (11)) in which the metallic copper reacts with the Cu(NH3)42+ and reduces it to Cu(NH3)2+ [10], while various authors presented the same reactions as given in Equations (7)–(10) [5,10,11]. In some studies, Equation (11) is reported as the dissolution reaction of deposited copper due to the presence of Cu(NH3)42+ in the system [12,13].
Cu + Cu(NH3)42+ → 2Cu(NH3)2+
However, a recent study by Velásquez-Yévenes & Ram, [14] provides more detailed speciation in the system, including all the possible copper-ammonia complexes along with their equilibrium constants (log K), which is the ratio of the concentration of products to the reactants. The reported log K values are presented in Table 1. According to their study, different species can exist in the system depending upon the free ammonia available [14].
A review by Meng & Han [15] provided important physiochemical properties of the copper-ammonia system for the involved copper-ammine complexes. They reported that the ammonia-based solutions are very effective for leaching transition metals such as copper, cobalt, nickel, and zinc. However, this technique proved best for only copper, nickel, and cobalt, metals which are soluble in ammonia solutions at higher pH. The thermodynamic data for ammonia species is presented in Table 2 [15].
The behavior of copper species in the electrolyte can be evaluated using the Eh-pH diagrams, also known as the Pourbaix diagrams. These diagrams elucidate the stability of species in the aqueous system by highlighting the dominating species where multiple species co-exist. Z. Sun et al., [16] reported an Eh-pH diagram for 1 mol/L Cu and 1 mol/L NH3 for the pH range of 5.0–11.0 and reported Cu(NH3)42+ and Cu(NH3)2+ as the dominating copper species within the pH range of 8 and 11, depending upon the Eh of the system [16]. Outside the pH range of 8 and 11, copper existed as Cu(OH)2, CuO2, and CuO. Some other authors proposed the same Eh-pH diagram for the copper activity of 0.5 and 7 kmol/m3 of ammonia concentration and reported the same species against slightly different Eh and pH ranges [8,9,10,11]. Velásquez-Yévenes & Ram [14] also presented an Eh-pH diagram for 1 mol/L Cu and 1 mol/L NH3, but their species and respective Eh and pH differ. Their species only included CuO and Cu2O and omitted Cu(OH)2 with a very small Eh-pH range for Cu(NH3)42+ and Cu(NH3)2+ as compared to other available Pourbaix diagrams [14].
This study aims to determine the saturation level of CuSO4.5H2O in the ammonia-ammonium sulfate solution and the maximum Cu(I):Cu(II) ratio in the solution at low and high alkaline pH. These are required to understand the nature of the system as a higher Cu(I):Cu(II) ratio is ideal for electrowinning current efficiency. Furthermore, the development of statistical models for all the given scenarios can be used to predict Cu(II) and Cu(I) concentrations and Cu(I):Cu(II) ratio. Lastly, equilibrium constants (K) were also determined from the Cu(I) and Cu(II) concentrations given at different combinations of ammonium sulfate, ammonium hydroxide, copper sulfate, and metallic copper and compared with the statistical software MINTEQ.
In summary, the highlights of this study are:
i.
Determining the saturation level of CuSO4·5H2O.
ii.
Determining maximum Cu(I):Cu(II) ratio for low and high pH solutions.
iii.
Development of statistical models to predict i and ii.
iv.
Calculating K value by experimentation and using MINTEQ.

2. Materials and Methods

2.1. Scoping Experiments

The literature review [2,17] and scoping experiments (See Supplementary Data S6 and S7) were conducted to finalize the limits for the electrolyte components in the electrolyte. Experimentation showed that higher ammonium sulfate contributes to lower solubility of copper due to increased sulfate ions concentration [17]. Even the ammonium ions that help increase the solubility of copper after a certain concentration impact the system negatively by increasing power consumption at the electrowinning stage [18]. These outcomes lead to the conclusion that the upper limits for ammonium sulfate and ammonium hydroxide would be 1 M and 4 M, respectively. The details of the scoping experiments are provided in the Supplementary Data section.

2.2. Experimental Classification

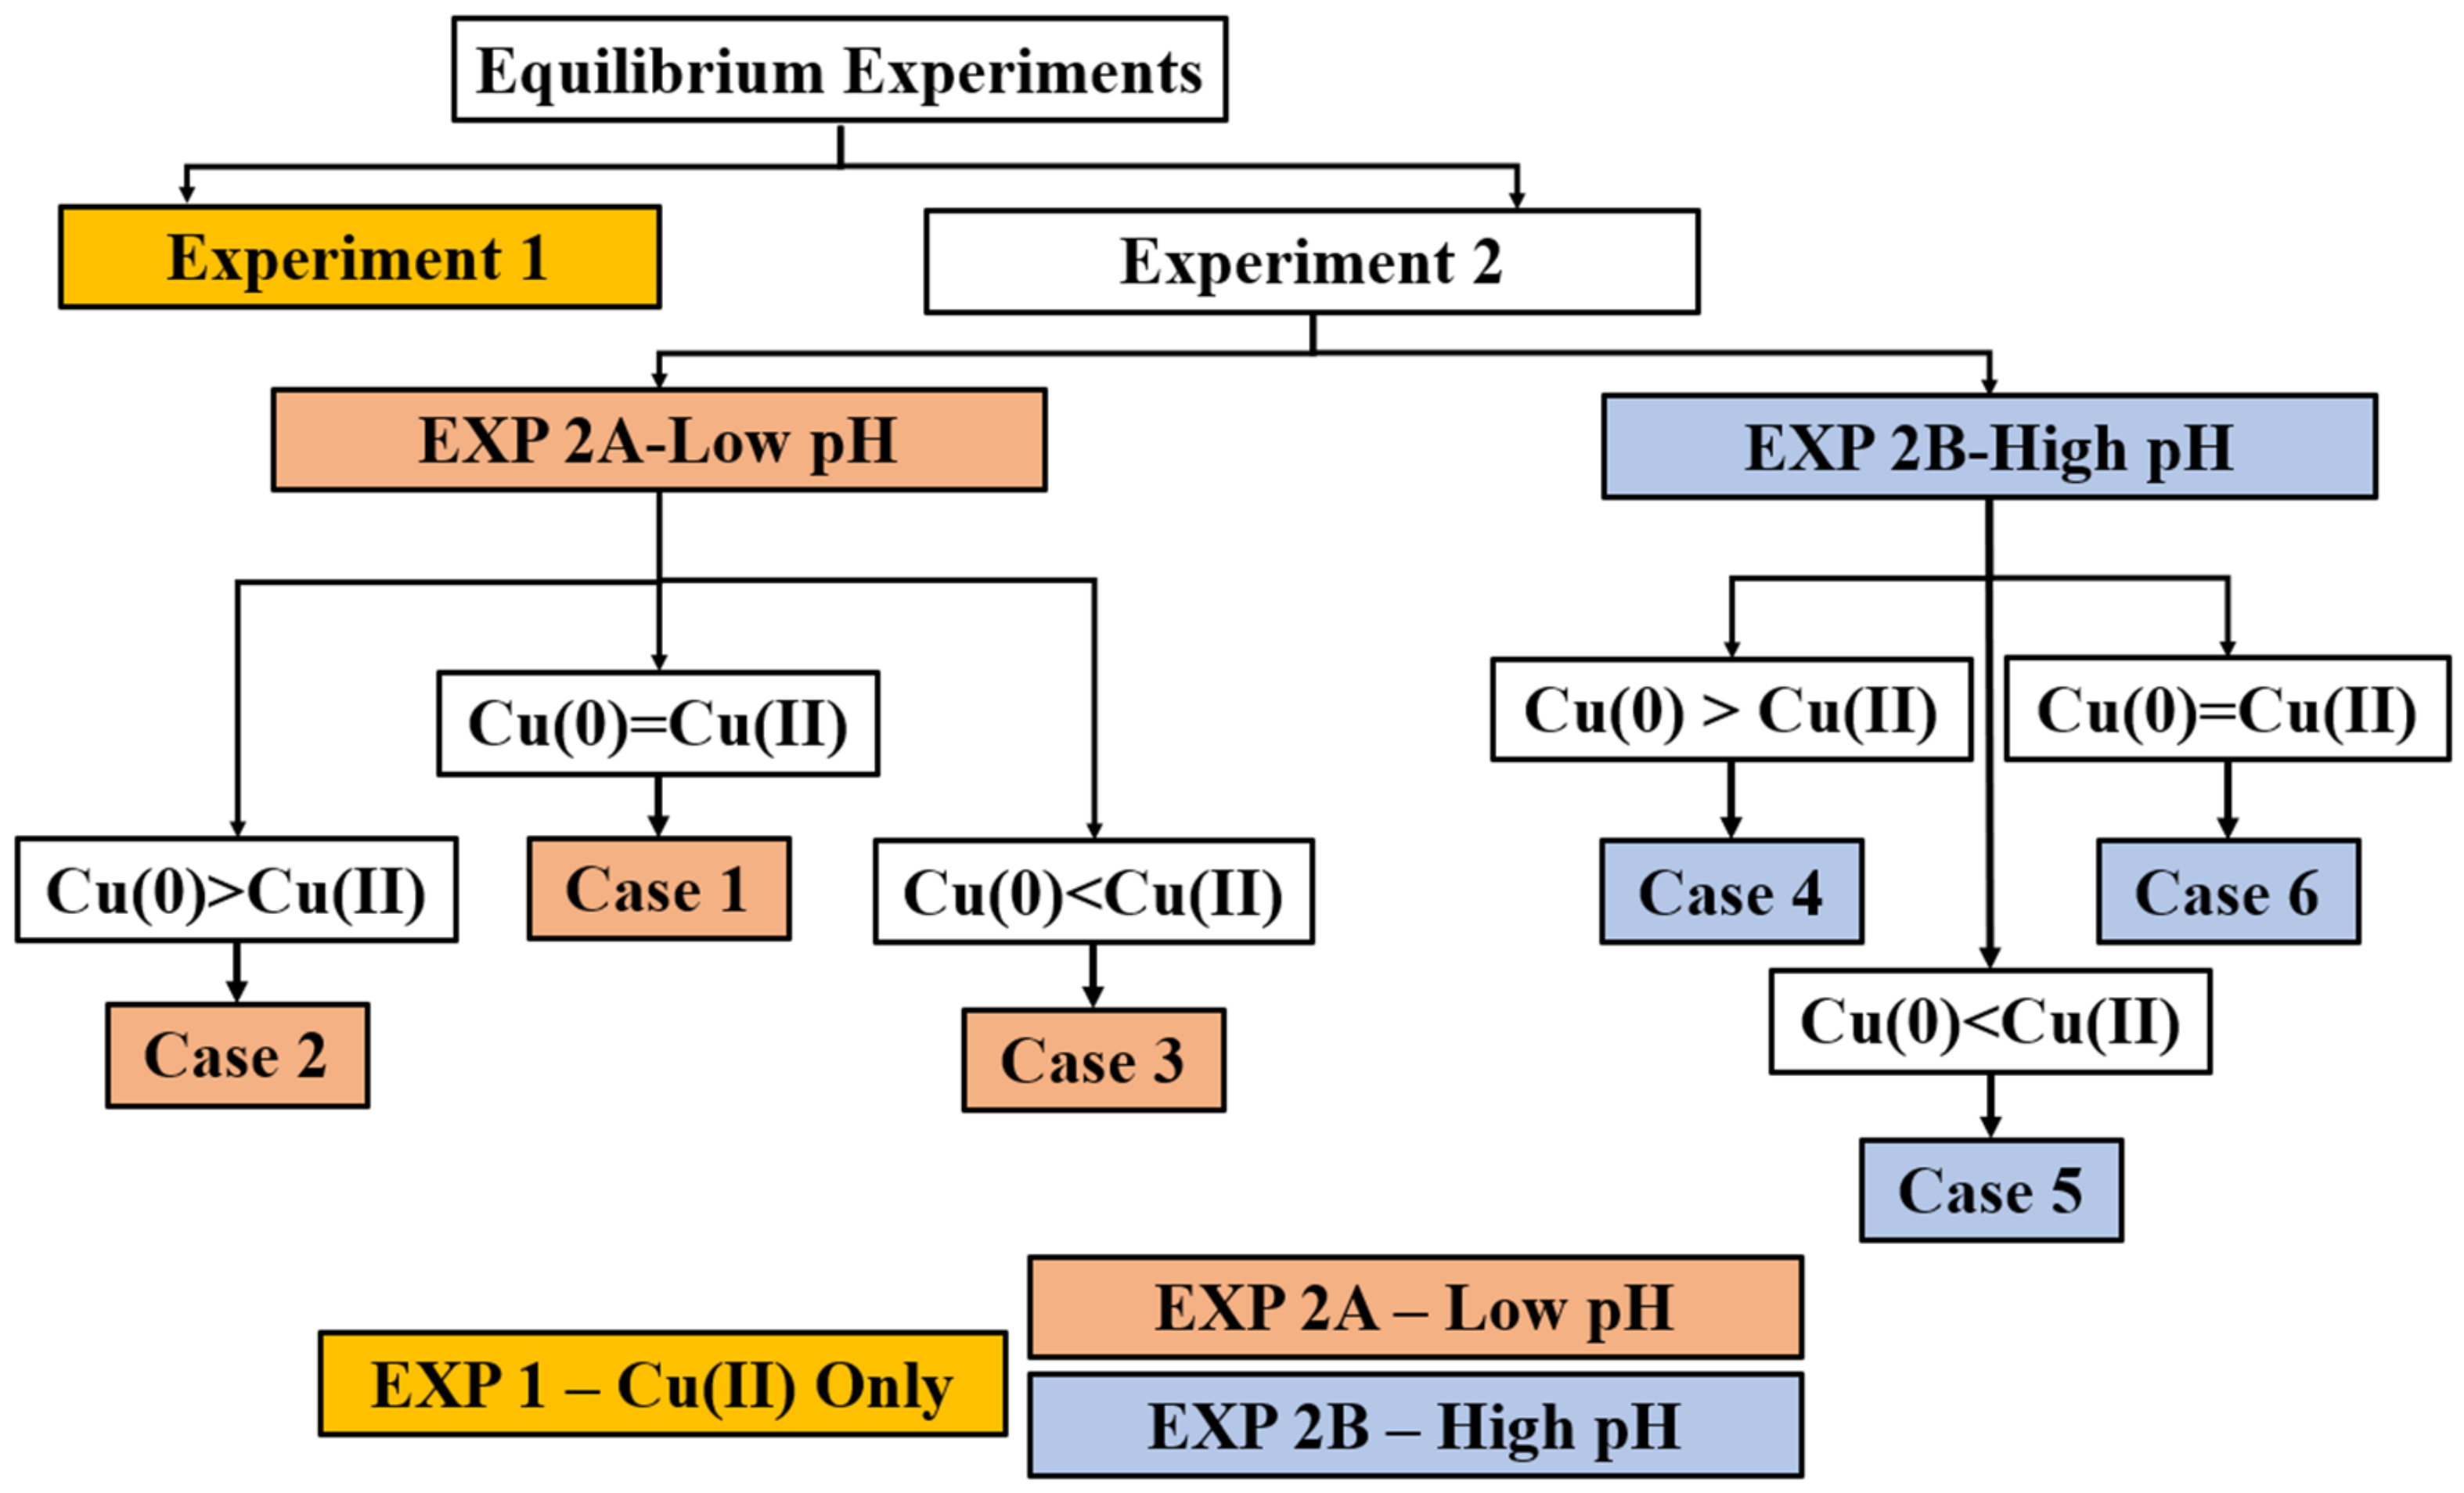
Because copper in ammonia systems may exist in a monovalent or divalent form, complexities can arise between 3 components, namely metallic copper, Cu(I) and Cu(II). For this reason, the experimentation was divided into two experimental sets, identified as Experiment 1 and Experiment 2. Experiment 1 focused solely on the maximum solubility of Cu(II) as supplied by a surplus of copper sulfate and measuring the copper concentration. The second set, Experiment 2 was designed to achieve a maximum Cu(I):Cu(II) ratio. The experimental space is further complicated by the 3 component system alluded to and is shown conceptually in Figure 2.
Originally, Experiment 2 (A and B) was designed as a singular experiment plan. However, upon reviewing the results, it was determined that the experimental space would be reduced to more appropriately quantify the results based on the underlying mechanism. For this reason, Experiment 2 was further subdivided between low pH and high pH areas owing to the different mechanisms. Further, conceptually, six cases were developed to categorize the mechanism dominant in the Cu(0), Cu(I), and Cu(II) space. These cases are defined by pH range and the relative abundance of oxidant (Cu(II)) or reductant (Cu(0)). In the case of the 2A experiments, Cu(II) was saturated owing to the low pH. The 2B experiments represent a set concentration of Cu(II) lower than saturation. Experiments 2A and 2B are further defined and presented as follows. Note the reflection of saturation vs scarcity between 2A and 2B in the context of oxidizer (Cu(II)) and reductant (Cu(O)).
  • Low pH (5.04–7.91)—2A
    Case 1: Cu(II) at Saturation = Cu(0)—Saturation balance between Cu(I) and Cu(II).
    Case 2: Cu(II) at Saturation < Cu(0)—Oxidizer limitation.
    Case 3: Cu(II) at Saturation > Cu(0)—Might show saturation balance or ran out of Cu(0)
  • High pH (8.02–10.41)—2B
    Case 4: Cu(II) Insufficient < Cu(0) Surplus—It shows thermodynamic equilibrium between Cu(II) and Cu(I).
    Case 5: Cu(II) > Cu(0) Insufficient—Due to stoichiometry the Cu(0) is the limiting reagent.
    Case 6: Cu(II) Insufficient = Cu(0)—Thermodynamic limits.
In summary, these cases illustrate the possibility of an overabundance of oxidizer, insufficient oxidizer, or stoichiometrically balanced in addition to Cu(II) starting saturation. This will allow the exploration of the saturation limit of total copper vs the constituent concentrations of Cu(II) and Cu(I) in Experiment 2A and the evaluation of Cu(I) to Cu(II) ratio away from Cu(II) saturation in 2B. However, this experimental setup is not perfect as the solutions are prepared in a two-part process, namely the makeup with Cu(II) then the addition of a reductant. This means that in case 2, the Cu(II) is consumed to produce Cu(I), decreasing Cu(II) from its original solubility limit.
From these principles, experiments were designed with three replicates in each experiment set (shown in Supplementary Tables S1 and S2). Experiment 1 was run as shown in supplementary data Table S3 with nine runs, Experiment 2A as Supplementary Table S4 with 10 runs, and Experiment 2B (Supplementary Table S5) with 13 runs. The experimental parameters are given in Table 3, Table 4 and Table 5, consisting of lower limit, upper limit, and center point (mean of upper and lower limit).

2.3. Materials

The electrolyte used for the experimentation included solutions of metallic copper (Cu), copper sulfate pentahydrate (CuSO4.5H2O) as a source of Cu(II), ammonium hydroxide (NH4OH), ammonium sulfate ((NH4)2SO4) prepared in deionized water (18 MΩ). All the chemicals used for the experimentation were ACS reagent grade and purchased from GFS Chemicals (Powell, OH, USA). The concentrations of components were maintained as a variable to determine optimized concentrations. Preliminary scoping experiments were performed to find the upper limits for concentration until the copper sulfate did not dissolve completely.

2.4. Experimental Setup and Procedure

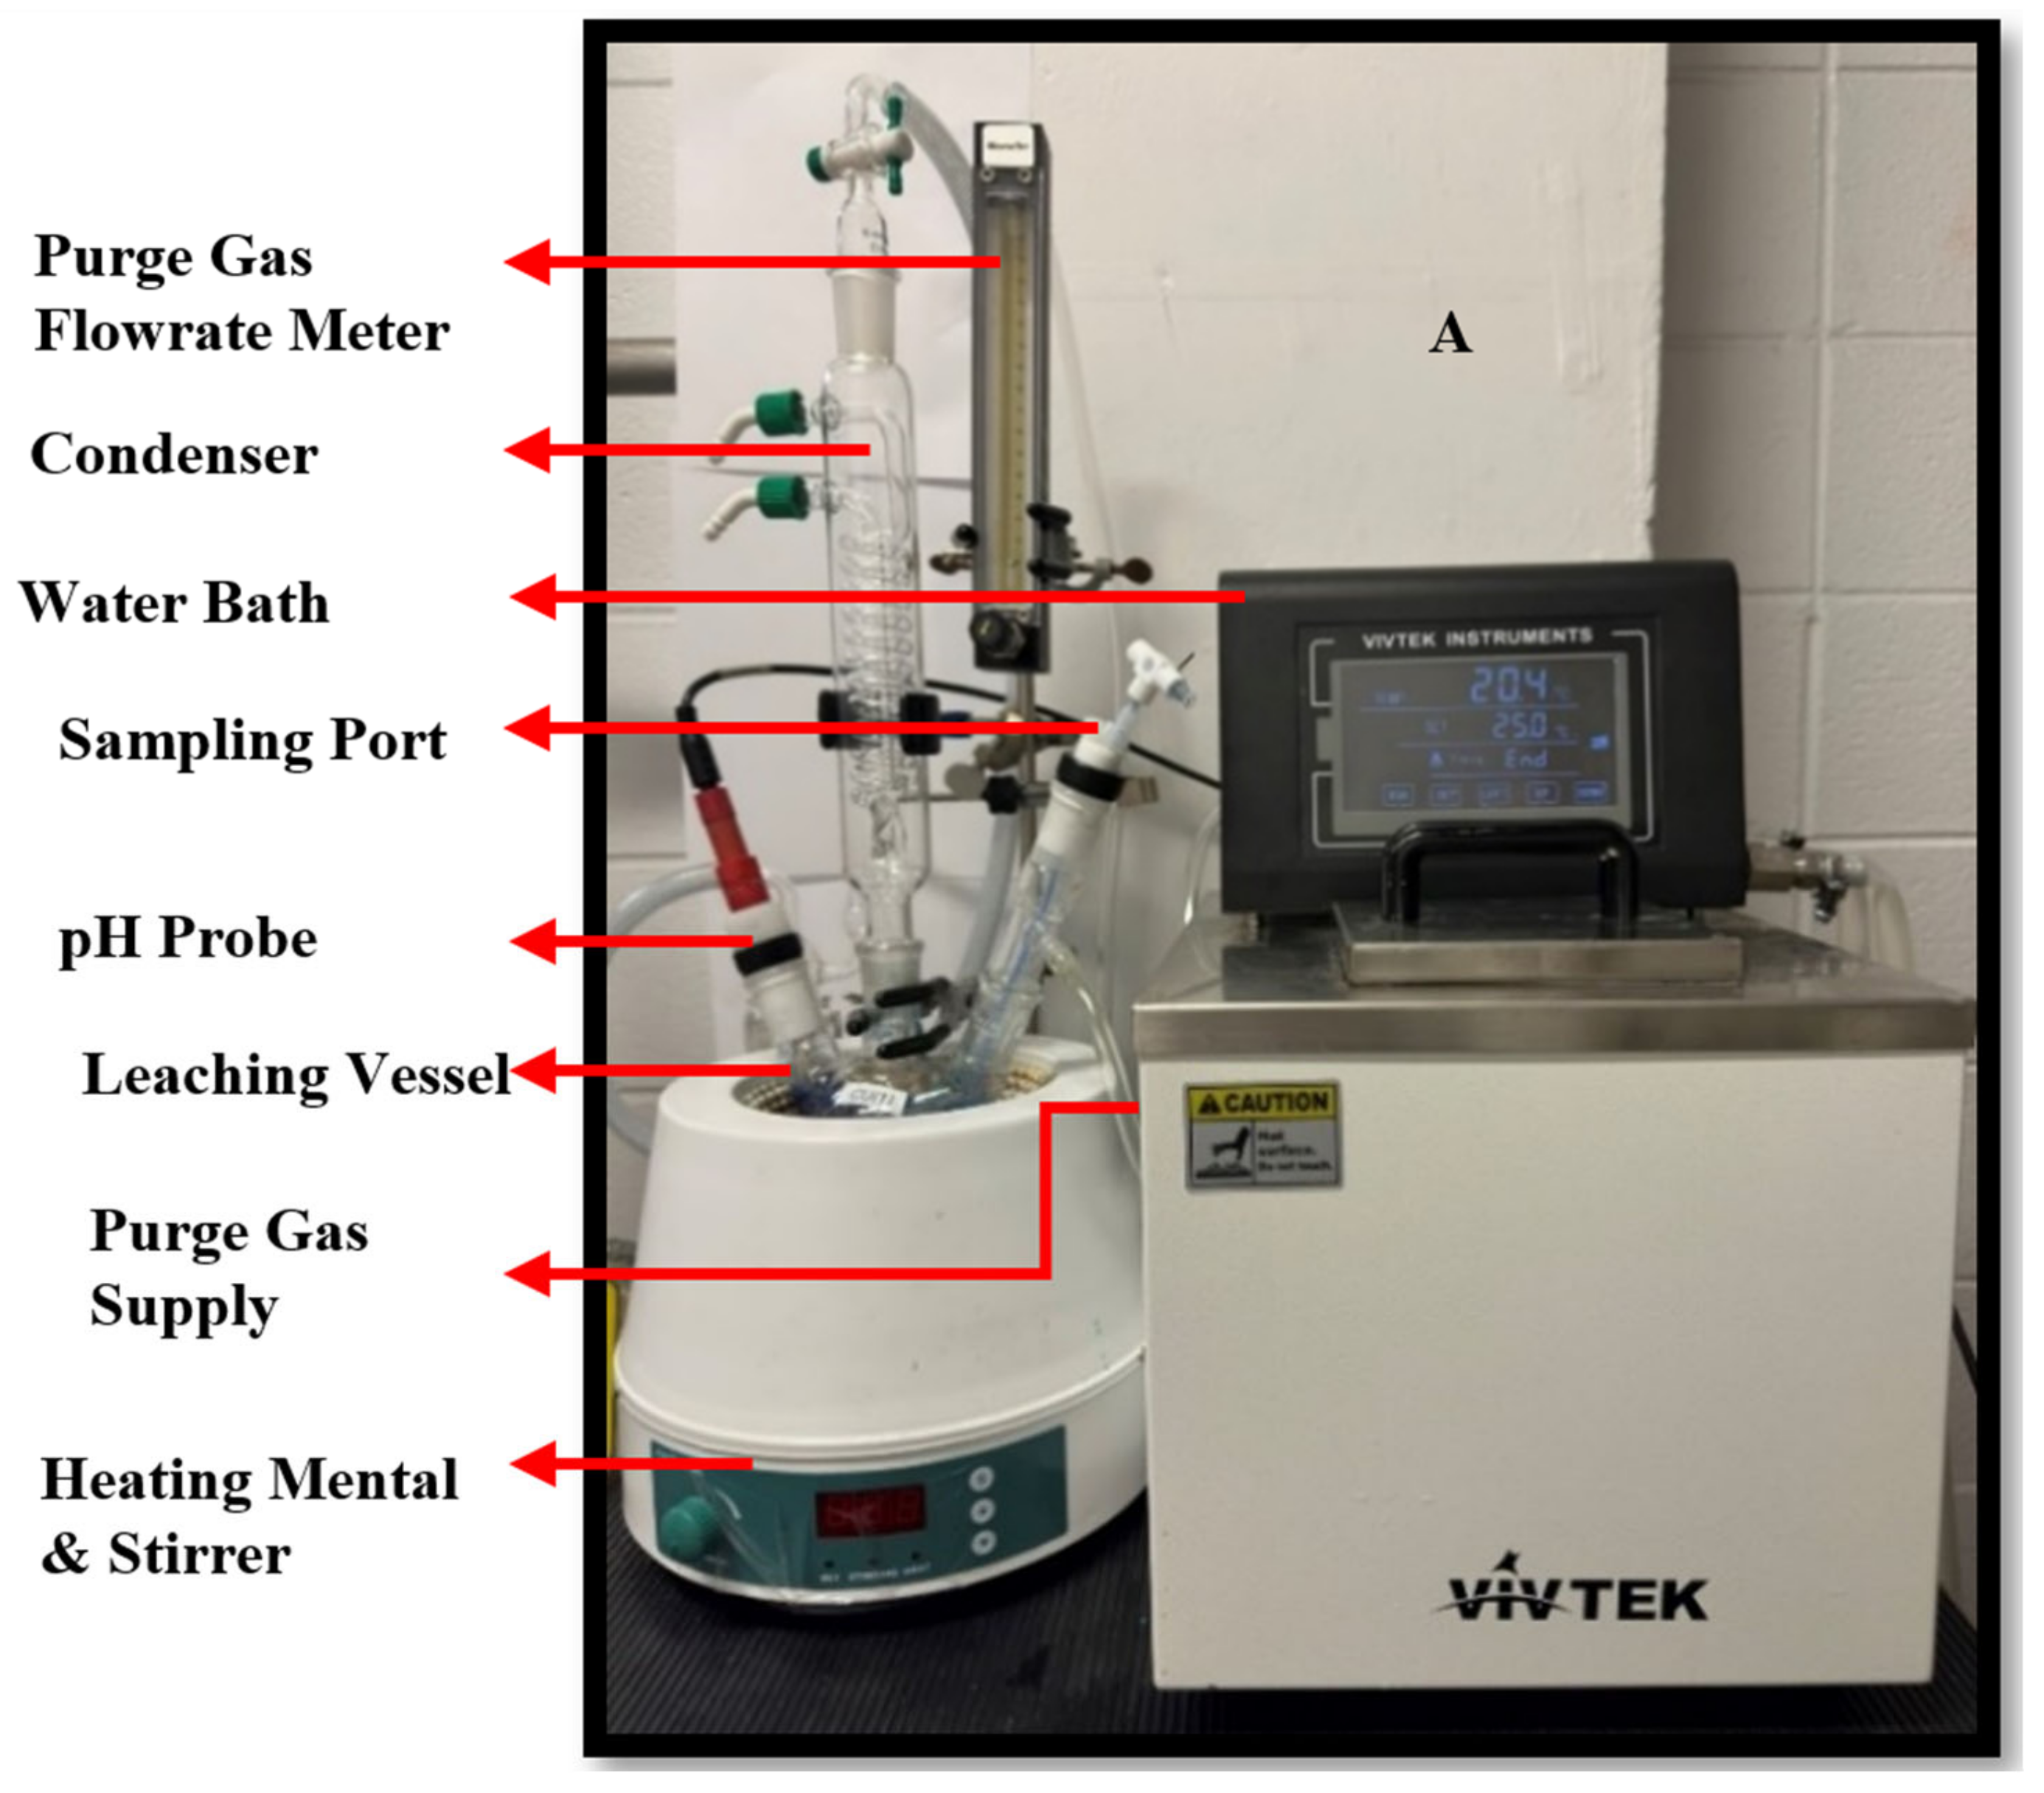
The experiments were performed in a 250 ml 3-neck round bottom flask fitted with a sampling port with lure syringe connection, condenser, air/purge gas supply connection, and pH/Oxidation Reduction Potential (ORP) probe (Mettler Toledo InPro 3100i, Columbus, OH, USA). The purge gas flow was controlled using the flow meter as shown in Figure 3. The Cu(II) saturation experiments (Experiment 1) were performed under air, and Cu(I) experiments (Experiment 2A and 2B) were performed under Argon (Ar) as a purge gas to avoid oxidation of Cu(I) to Cu(II). Experiments were designed (the design Tables are presented in the Supplement Tables S3, S4 and S5) using the response surface from the design of experiment (DOE) in Minitab and 3 replicates (replicate data available in Supplement Tables S1 and S2) were included in each experiment plan to ensure repeatability.
The Cu(II) enriched solution was prepared in a separate measuring flask in all cases and then transferred to the leaching vessel for the measurement of pH and ORP of the solution. The Cu(II) solution was prepared by adding all the ingredients into the measuring flask and stirring for 30 minutes before transferring to the leaching vessel. After transferring the electrolyte to the leaching vessel, the electrolyte was allowed to stabilize for 15 minutes with a pH/ORP/Temperature probe, and pH/ORP readings were noted, ensuring the readings were stable. The Cu(I) dominant experiment plan with metallic copper followed the same procedure. However, some additional steps were performed in this case after noting the pH and ORP for Cu(II) enriched solution. The metallic copper was added to the solution while it was under purge gas and left to dissolve in the solution for 1 hour before the pH and ORP of the solution were measured to ensure system stability. In all the experiments, the temperature was controlled and maintained at 25 ± 1 °C using the water bath and was monitored using the probe.

2.5. Theoretical and Experimental Equilibrium Constant “K”

The equilibrium constant (K) was calculated using the principle of chemical equilibrium and the law of mass action from the Cu(I) and Cu(II) concentrations obtained experimentally, as shown in Equations (12)–(14):
K = P r o d u c t s P R e a c t a n t s R
where K is the equilibrium constant, P and R are the stoichiometric coefficients for reactants and products.
K = C u N H 3 2 + 1 2 C u N H 3 4 + 2 [ C u ]
As Cu is the metallic species and is not in the solution it will not be considered in the calculation for the equilibrium constant.
K = C u N H 3 2 + 1 2 C u N H 3 4 + 2
Using the law of mass action, K was also modeled using the Cu(I), Cu(II), and pH obtained from the experiment as input to Visual MINTEQ. The concentration obtained from Visual MINTEQ was used to calculate the equilibrium constant and compared with the experimentally obtained K-values

2.6. UV-Vis Spectrometry and ICP-OES Analysis

To determine the maximum Cu(I):Cu(II) ratio, the Cu(I) and Cu(II) concentrations were calculated using the Ultraviolet-Visible (UV-Vis) Spectrometry and Inductively Coupled Plasma-Optical Emission Spectroscopy (ICP-OES) analyses. For the experiments that dissolved copper sulfate completely, both Cu(I) and Cu(II) concentrations were measured using UV-Vis spectrometry at a wavelength of 620 nm [19]. Firstly, Cu(II) concentration was measured. Then, the samples were completely oxidized under open air for 48 h to measure the total copper. Cu (I) was calculated by subtracting the Cu(II) concentration from the total copper. While the experiments did not dissolve the copper sulfate completely, Cu(II) was measured using the UV-Vis, and the total dissolved copper in the solution was measured using the ICP-OES to avoid any ambiguity of other possible species and dilution error in the results. For ICP-OES analysis, dilutions were made using 5% nitric acid as this measurement showed that copper could be analyzed and identified more effectively in the nitric acid matrix.

3. Results and Discussion

3.1. Pourbaix Diagram

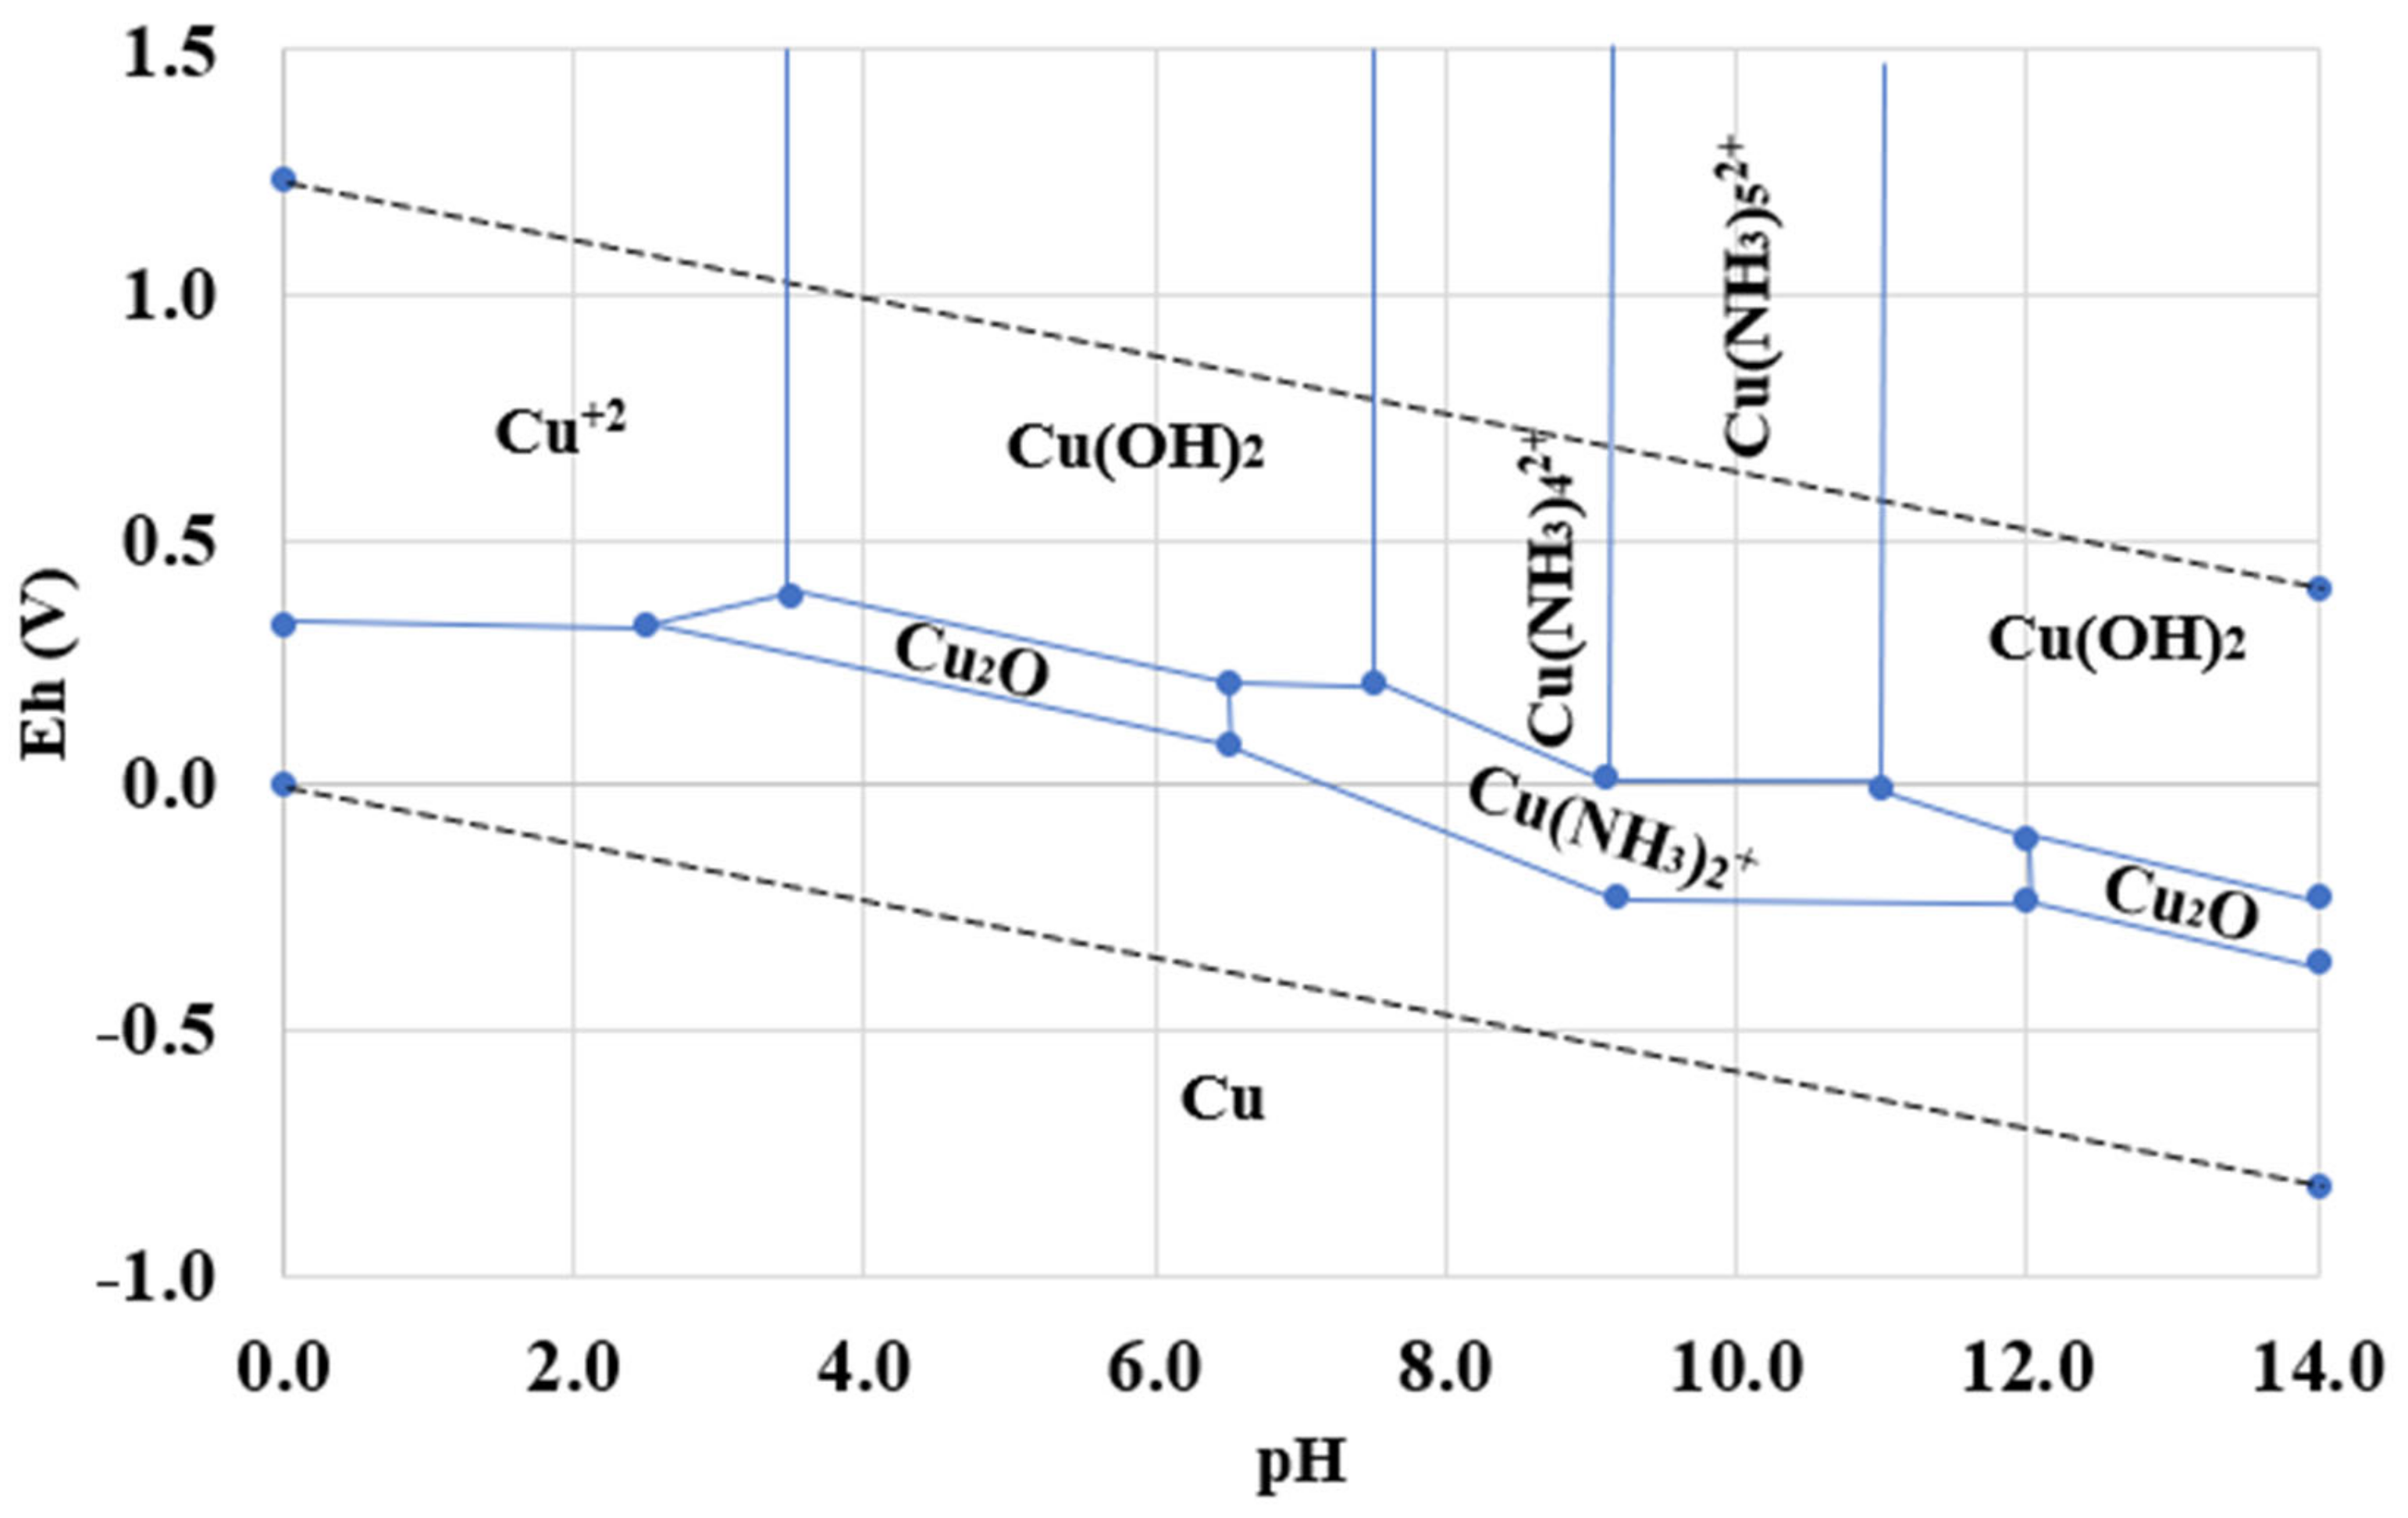
All the reported Eh-pH diagrams [9,10,16,20,21] presented only Cu(NH3)42+ as the dominating Cu(II) species, while [14] reported that five different possible Cu(II) species can be present in the electrolyte. An Eh-pH diagram was constructed for copper, sulfate, and ammonia systems, as presented in Figure 4, for most available Cu(I) and Cu(II) species to verify this statement. It was observed that the influence of pH was significant on the Cu(II) species. At the lower pH (approx. 3.5 to 7.5), copper will occur as Cu(OH)2 or Cu2O. As the pH increases (approx. > 7.5), these species start to convert into Cu(NH3)42+, Cu(NH3)52+, and Cu(NH3)2+, depending upon the pH and oxidation-reduction potential. However, for these species to dominate the system, the pH must be below 11 because pH > 11 will again cause these species to convert into Cu(OH)2 or Cu2O. It is worth mentioning that most of the speciation software does not have Cu(NH3)52+ in their databases. A recent study [14] reported Cu(NH3)52+ in their study but reported Cu(NH3)42+ as the dominant species. Moreover, the reported log K values for both species are the same and do not affect the pH of the solution.

3.2. Cu(II) Solubility (Experiment 1)

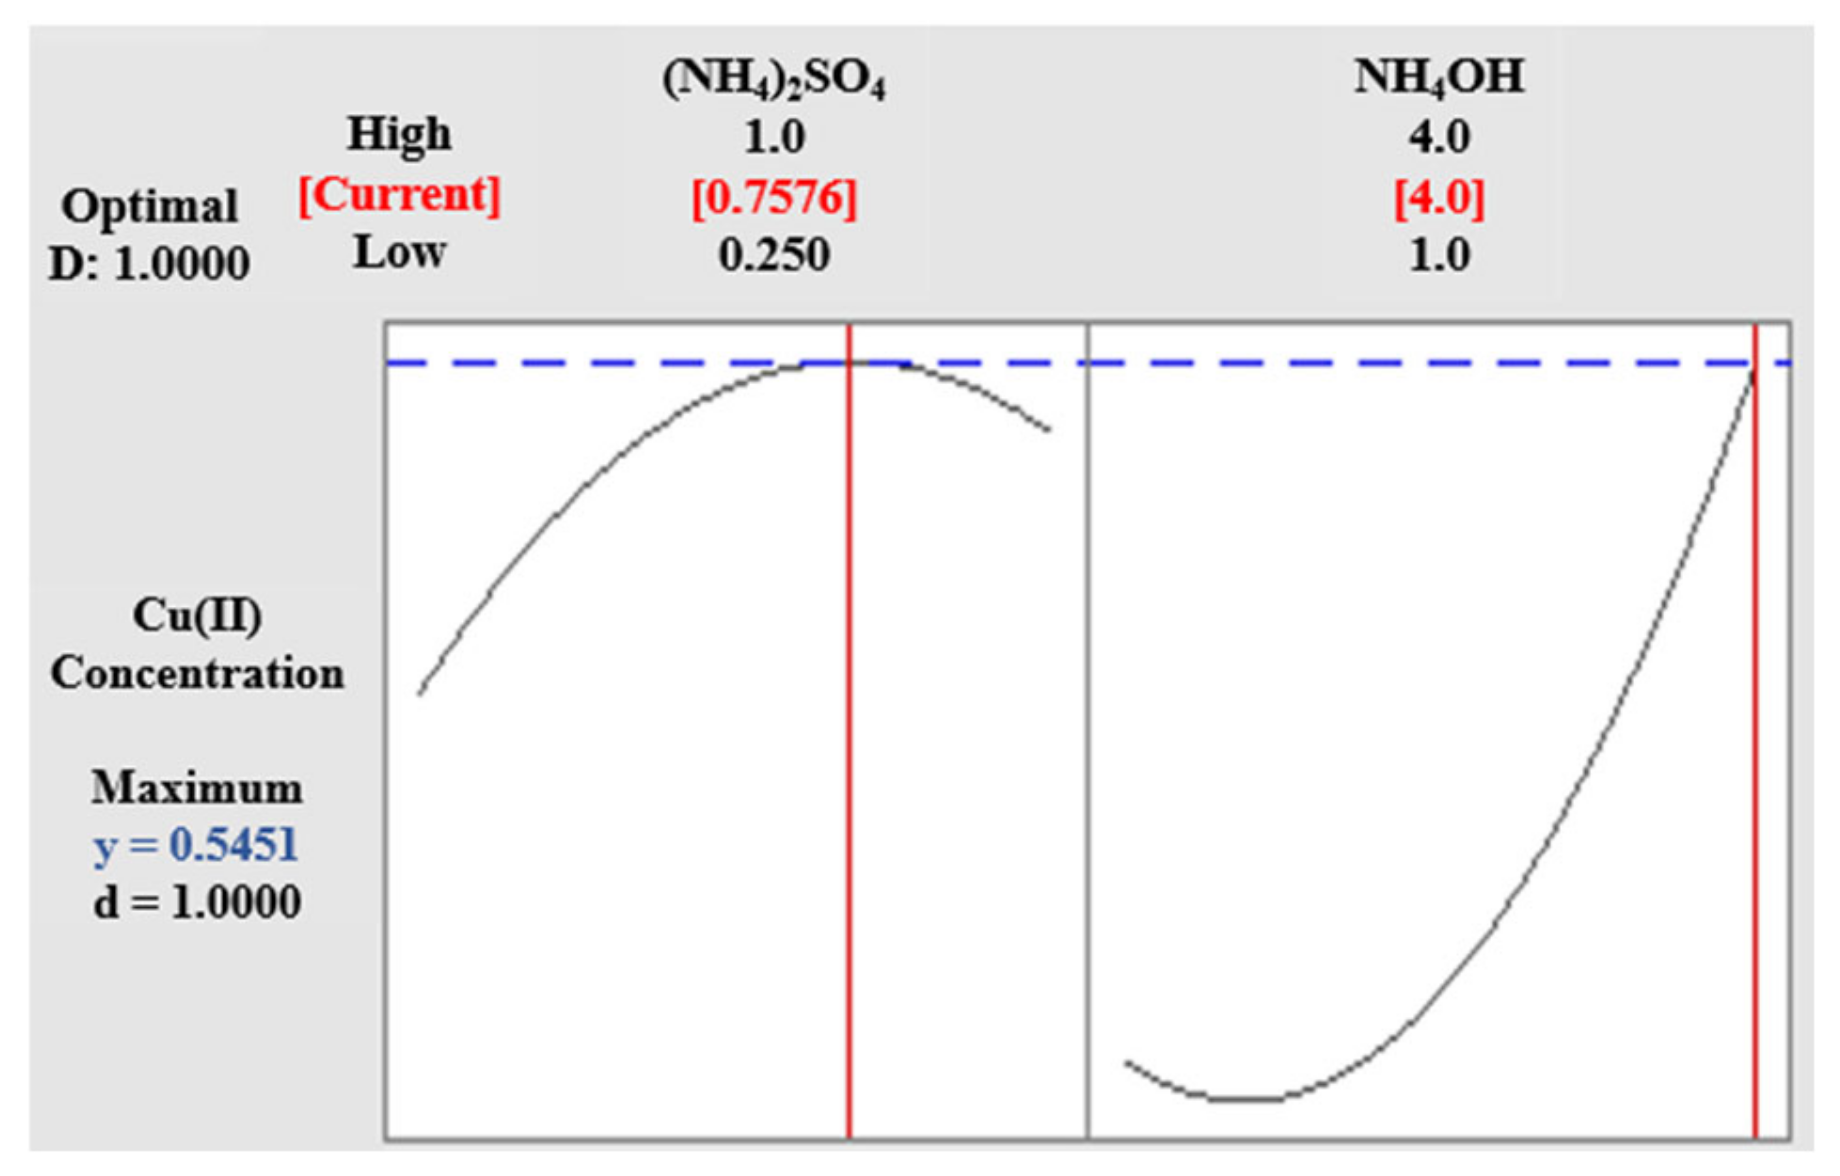
To identify the maximum solubility of copper sulfate and hence Cu(II) in the ammonia-sulfate-based electrolyte, the concentration of electrolyte components (NH4OH and (NH4)2SO4) varied as indicated in Table 3. The effects of anion and cation, NH4+ and SO42- were not the primary scope of this study. Still, the results indicated that the concentration of sulfate anions impacted copper solubility as sulfate ions reduced the solubility of copper [17]. The obtained data was analyzed, and the optimum concentration of electrolyte components was obtained, as shown in Figure 5 where the maximum concentration of copper can be achieved against 0.7576 M and 4.0 M of (NH4)2SO4 and NH4OH.
The solubility of copper in the ammoniacal solution increased with an increase in ammonium sulfate concentration. Note that these conditions were performed under air. At about 1 M concentration of ammonium sulfate, a slight decrease in copper solubility was observed. These trends for ammonium sulfate, shown in Figure 3, are in agreement with the trends presented in the literature [14]. For the concentration of ammonium hydroxide, the literature presented an increase in solubility with the increase in the total ammonia concentration due to the hydroxyl anions released into the solution, attributed to ammonium hydroxide dissociation [22]. To achieve maximum copper solubility in the ammonium sulfate system, less than 1 M ammonium sulfate and 4 M ammonium hydroxide is suggested.
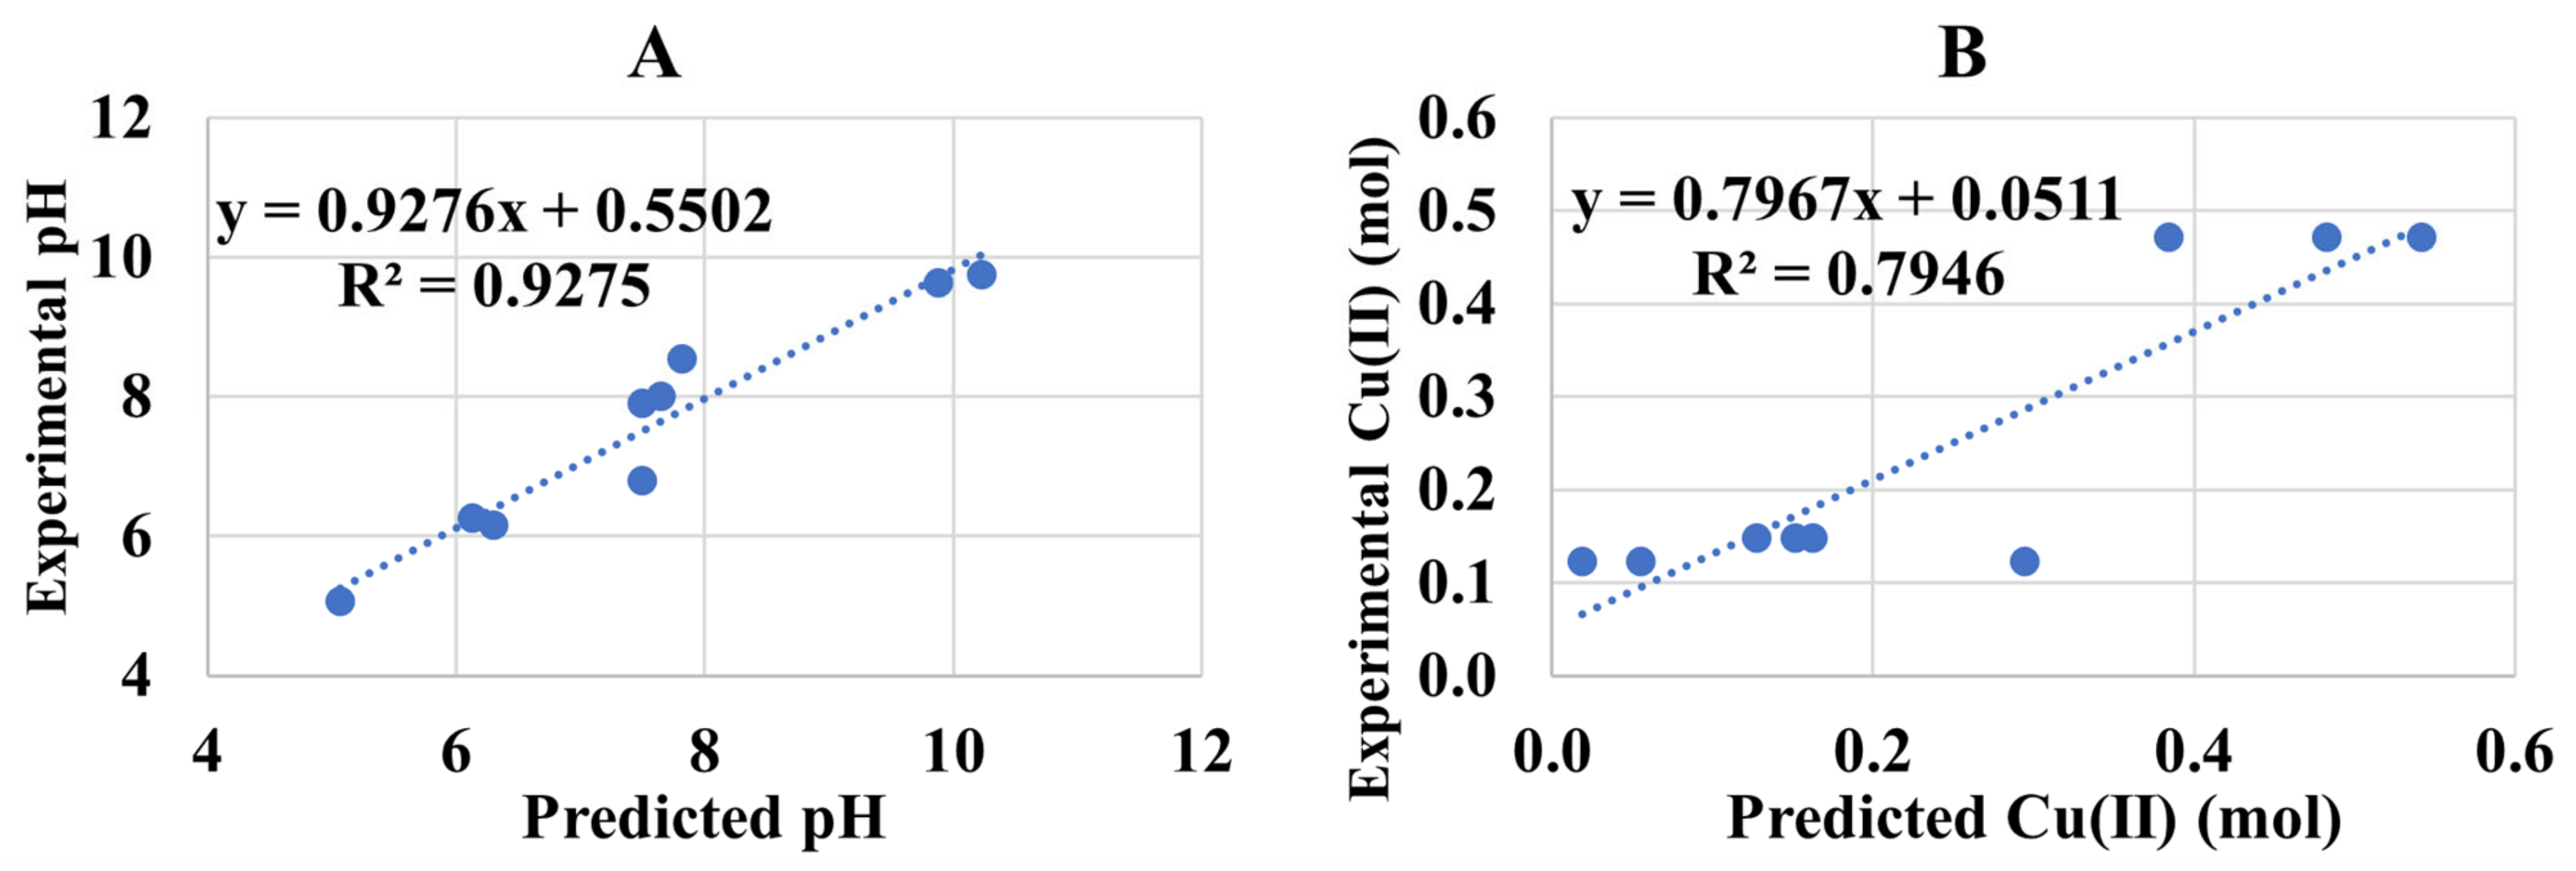
Statistical analysis was performed using the back elimination method for significant values having p-value < 0.05 and predictive statistical models were obtained for pH and Cu(II) concentration. These predictive models (valid for ranges in Table 3, Table 4 and Table 5) are given in Equations (15) and (16) with their goodness of fit with experimental data displayed in Figure 6. The higher adjusted R2 shows the goodness of these predictive models.
pH = 7.19 − 10.38[A] + 1.159[B] + 8.19[A]2 Adj. R2 = 88.41%
[Cu(II)] = 0.272 − 0.215[B] + 0.0662[B]2 Adj. R2 = 72.62%
where “[]” represents the concentration of the mentioned species in mol/L and these models are valid for ranges of (NH4)2SO4 and NH4OH given in Table 3 at 25 °C.

3.3. Cu(I):Cu(II) at Low pH (Experiment 2A)

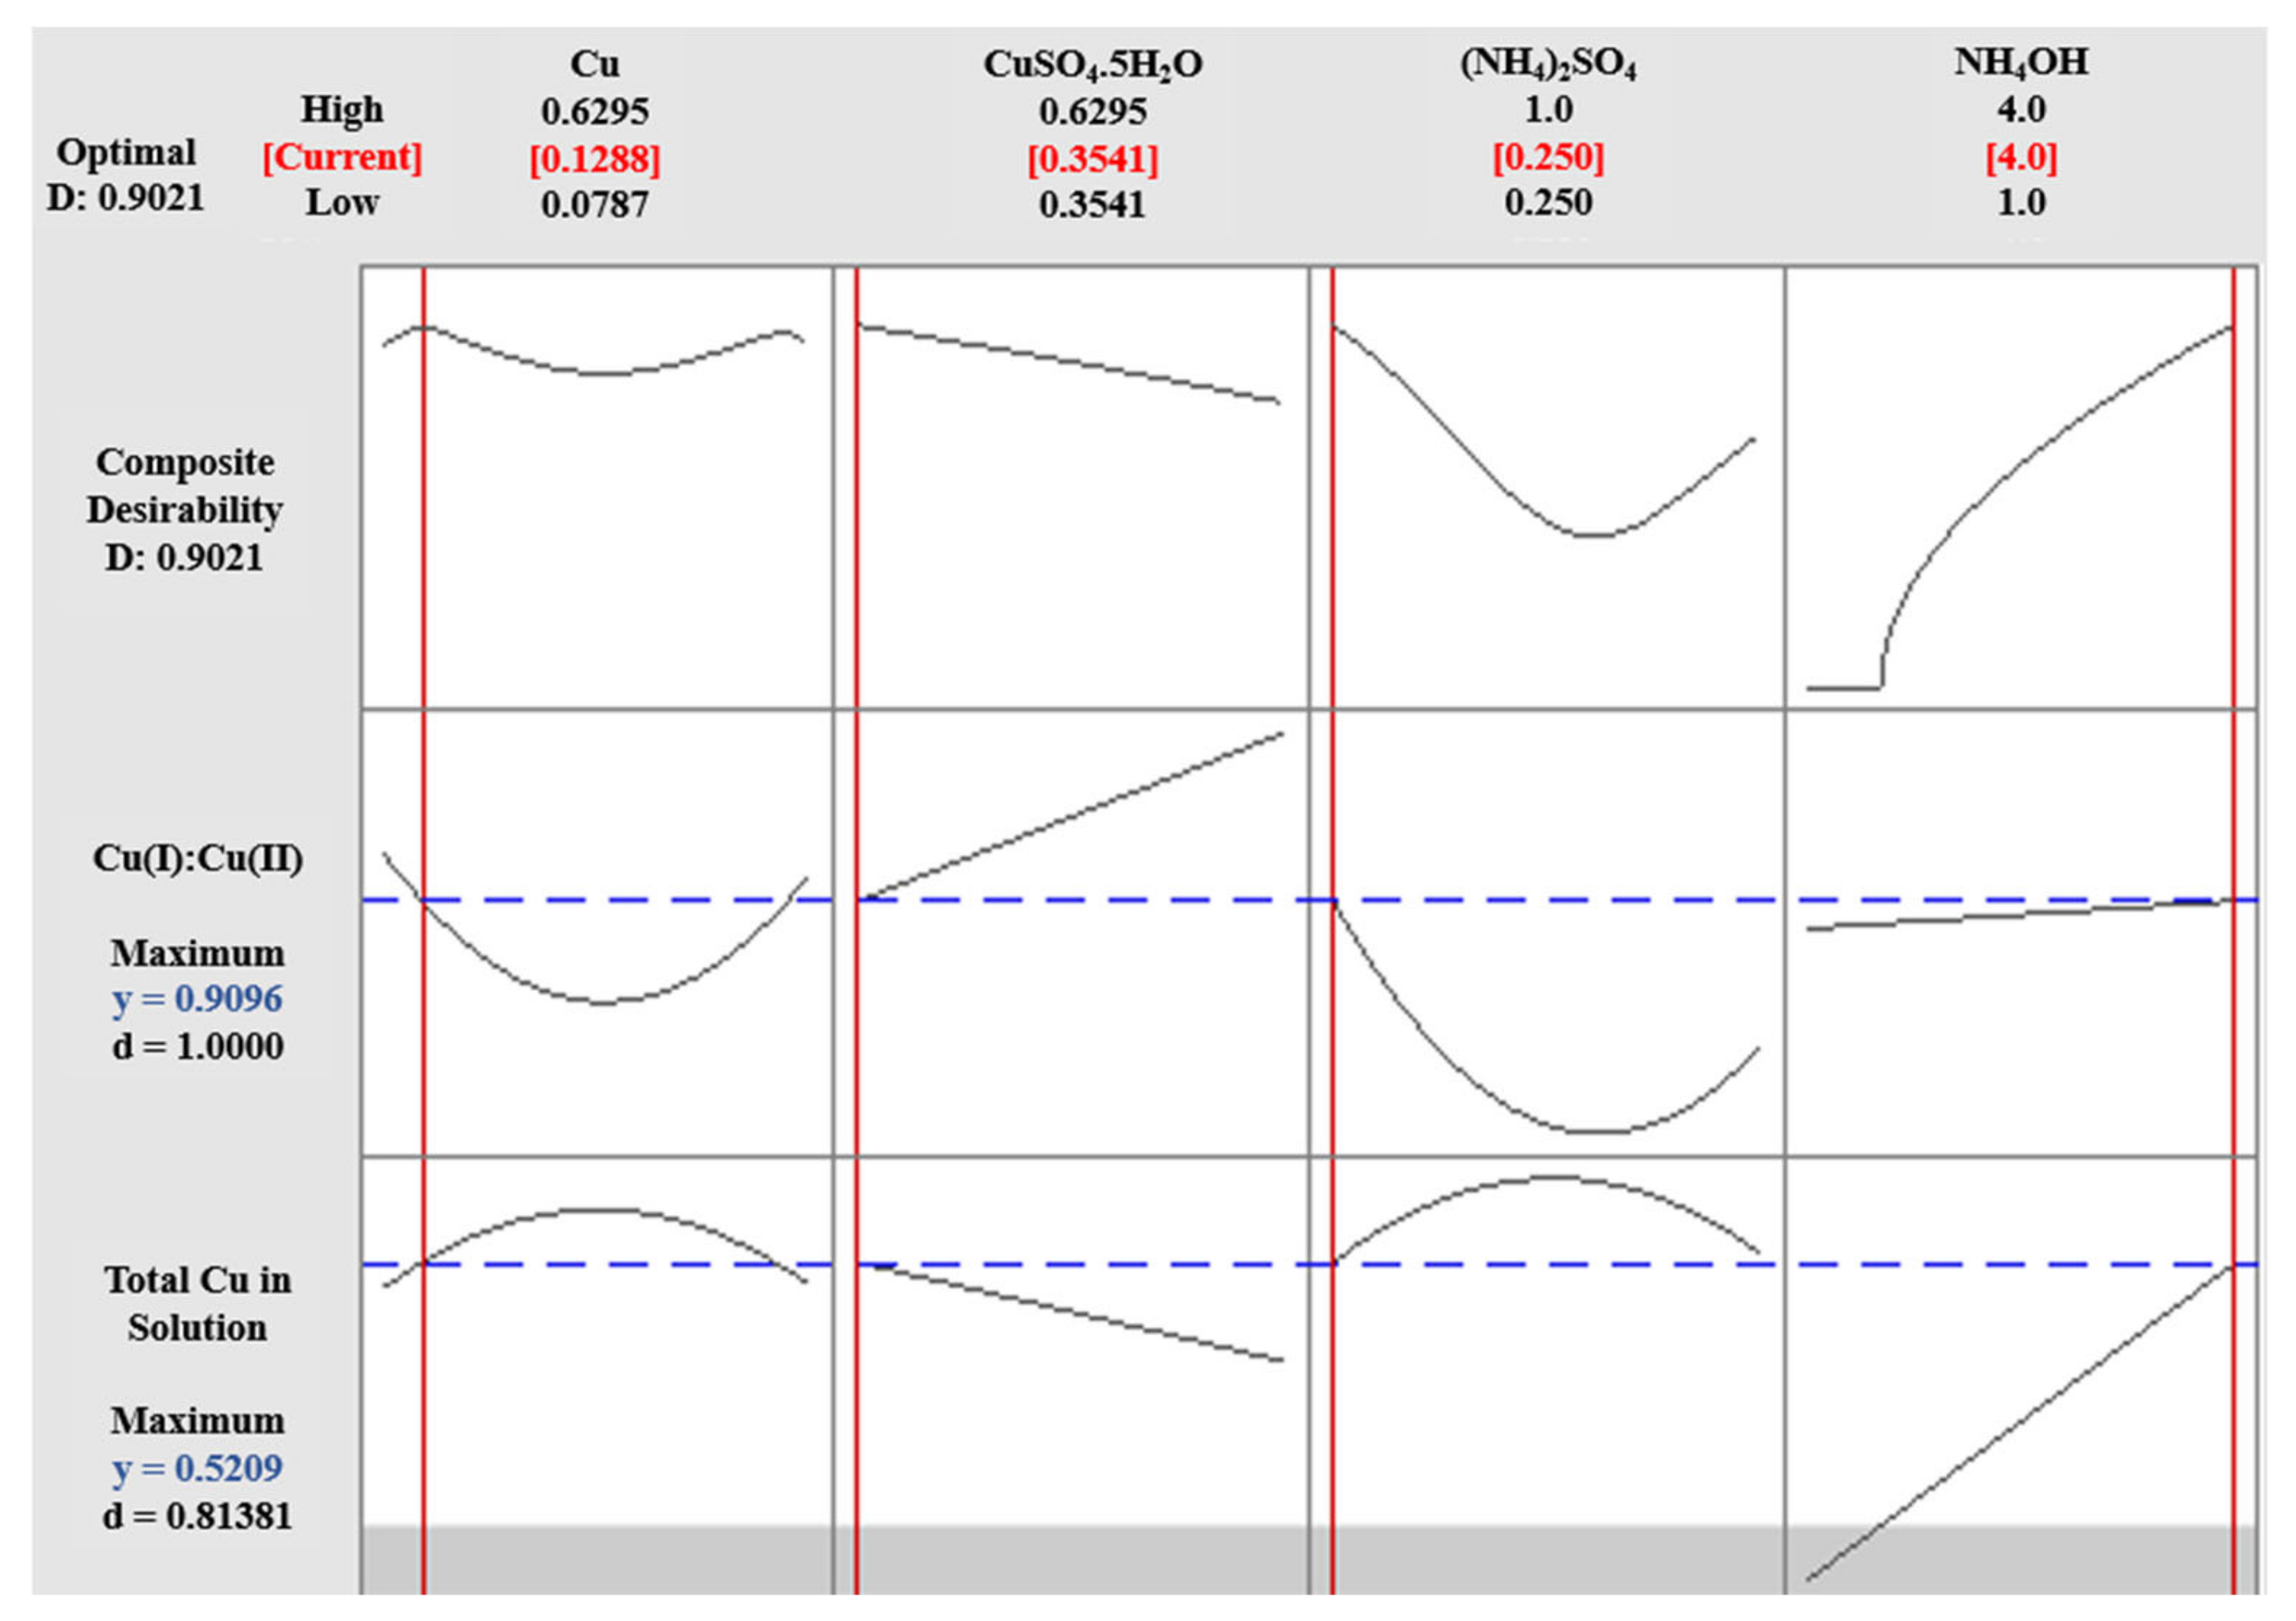
When metallic copper was added to the Cu(II) solution at a lower pH range of 5.04–7.91, most of the copper sulfate remained undissolved in the solution. At a lower or acidic pH, the copper forms insoluble compounds that precipitate, ultimately resulting in a very small amount of Cu(I) formation due to limited Cu(II) availability to react with Cu(0). The obtained data was analyzed for optimization and predictive statistical models. The maximum Cu(I):Cu(II) ratio can be obtained at 0.250M and 4.0M (NH4)2SO4 and NH4OH, respectively, as shown in Figure 7. The metallic copper and copper sulfate concentrations were minimal because the pH indicated the thermodynamic and oxidizer limits.
The lower solubility of copper in the lower alkaline pH of Experiment 2A was because the copper formed the soluble copper-ammonia complexes at pH above 8 and below pH 11 and precipitates if pH < 8.0 or > 11 [16]. Due to the lower pH of the system, the copper formed Cu(OH)2 and precipitated as an insoluble salt. A small amount of copper, due to the lower soluble copper in the system, was able to react with the metallic copper to form Cu(NH3)2+, as per the reaction given in Equation (11). The ammonium hydroxide aided towards the solubility of copper by producing free ammonia in the aqueous phase for copper to convert into soluble and sTable copper-ammonia complex Cu(NH3)42+ as per reaction in Equations (5) and (6) [9].
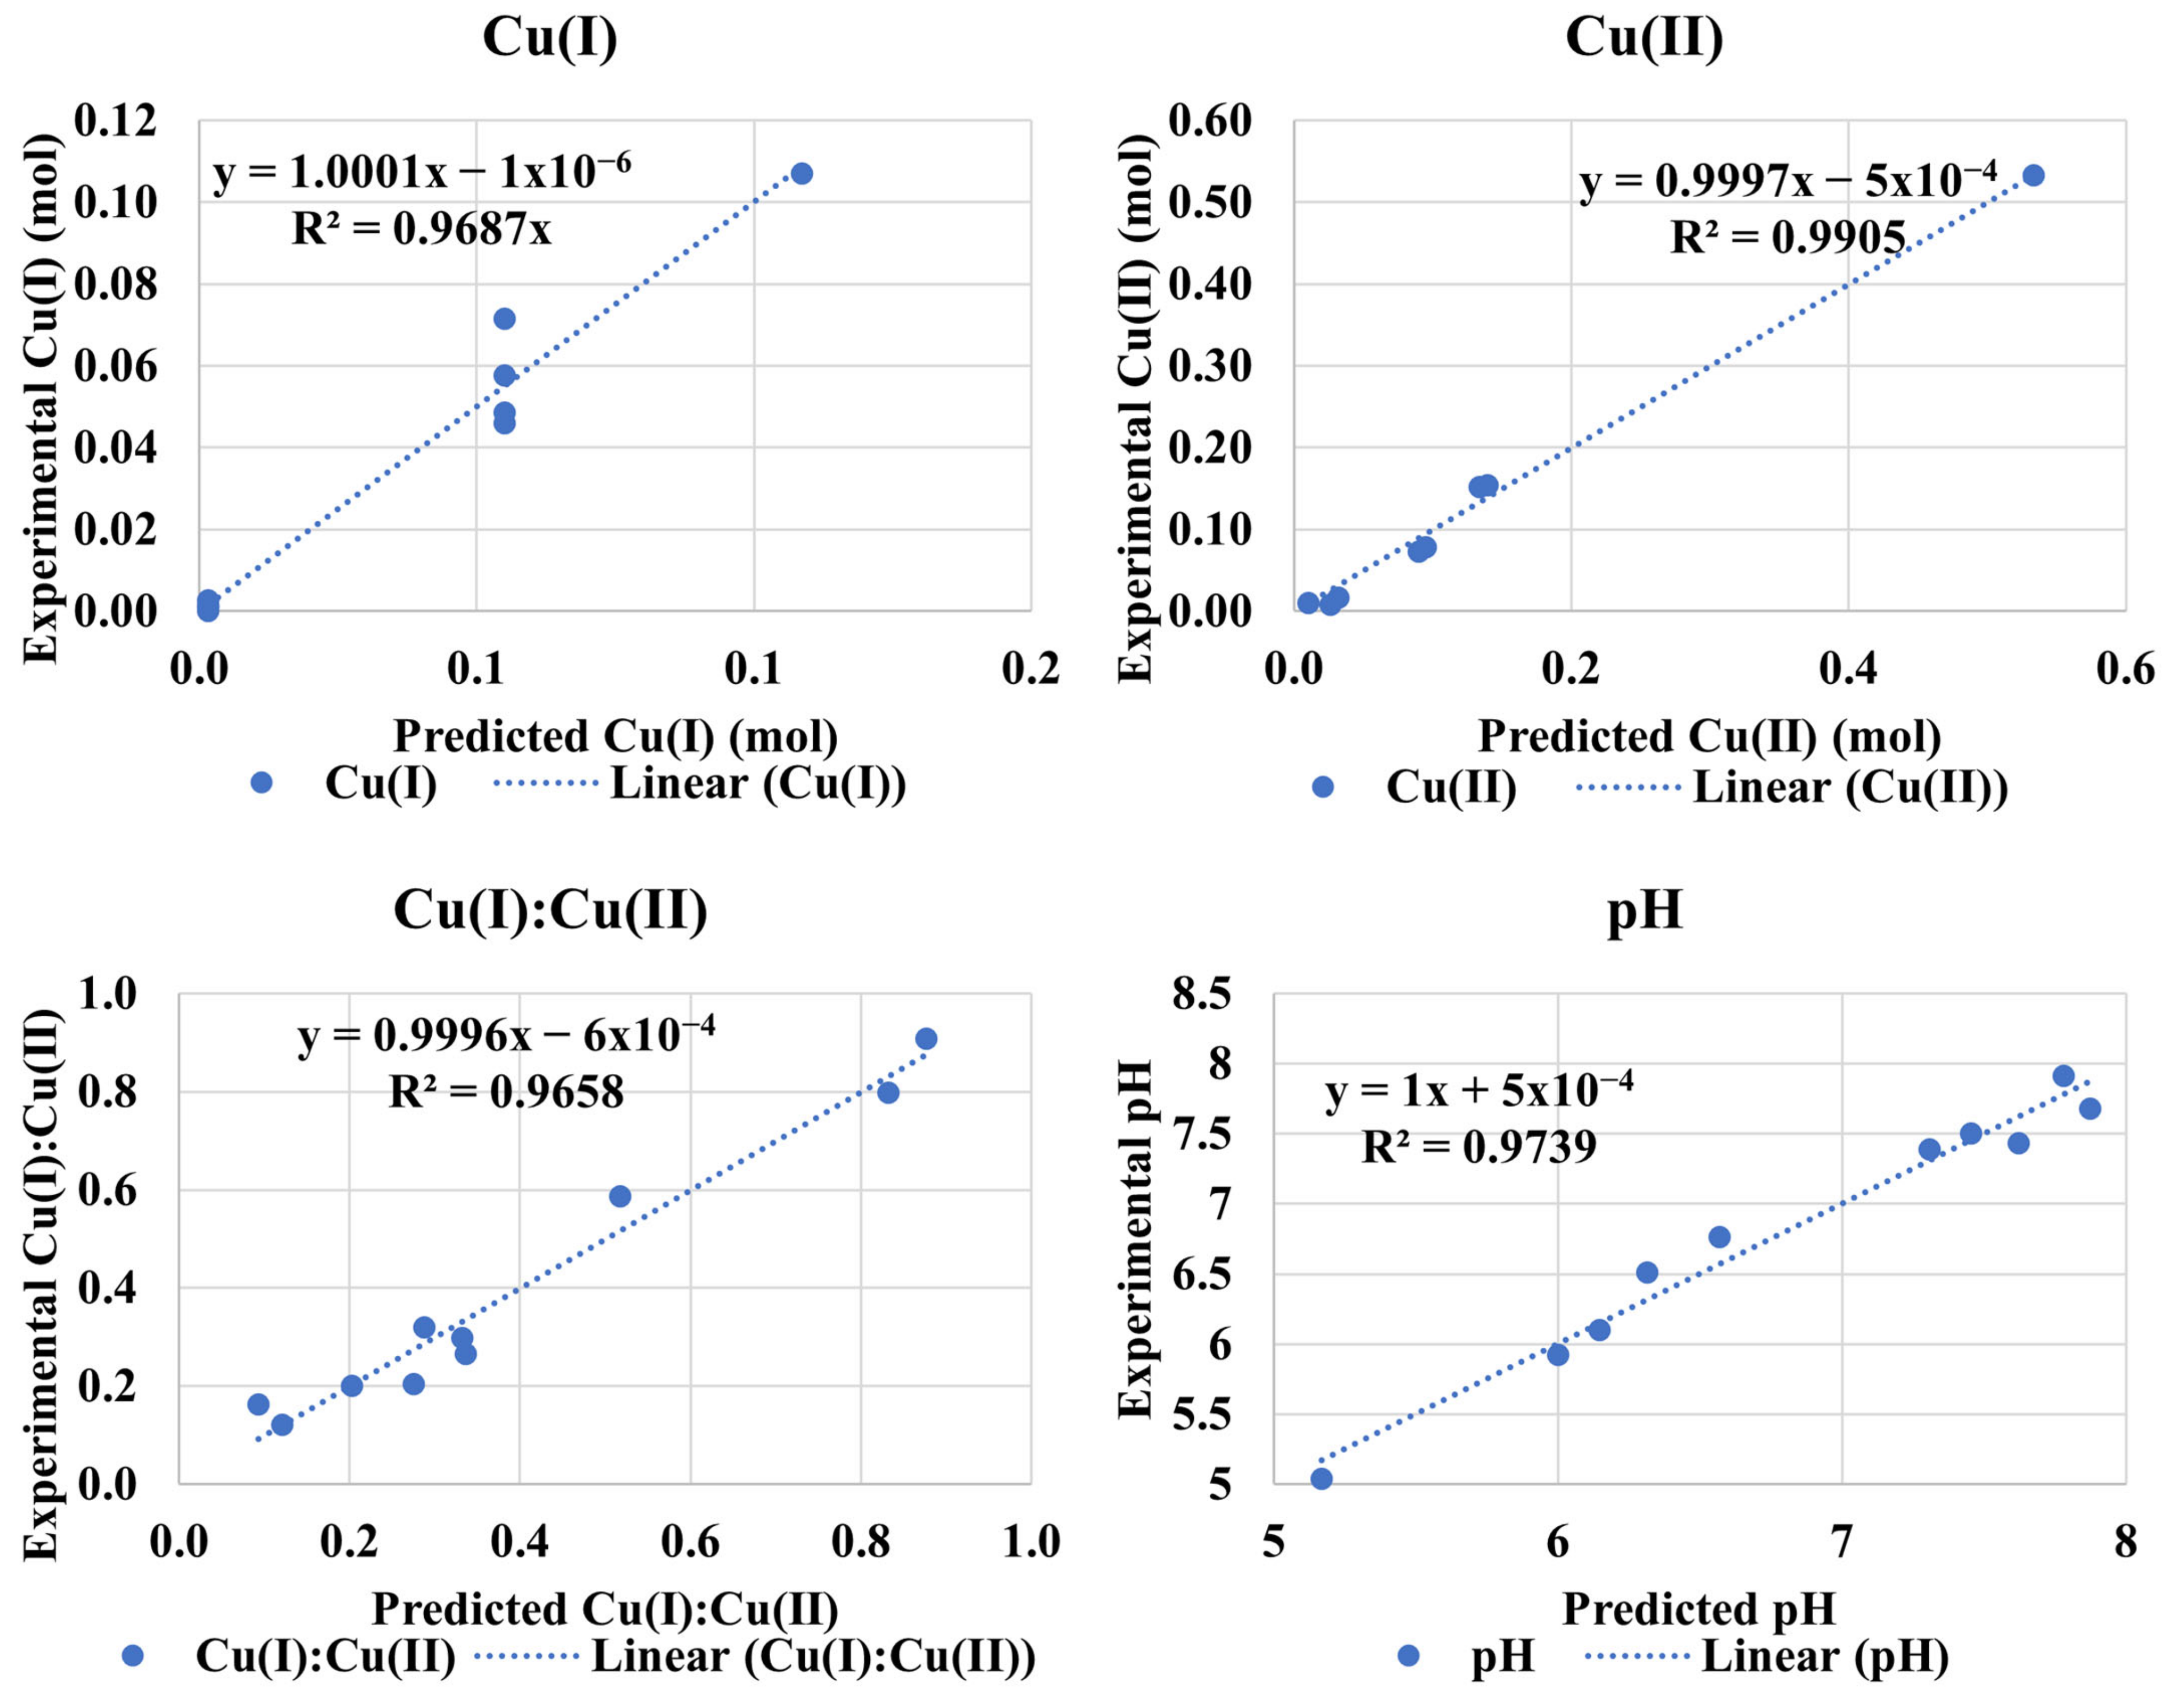
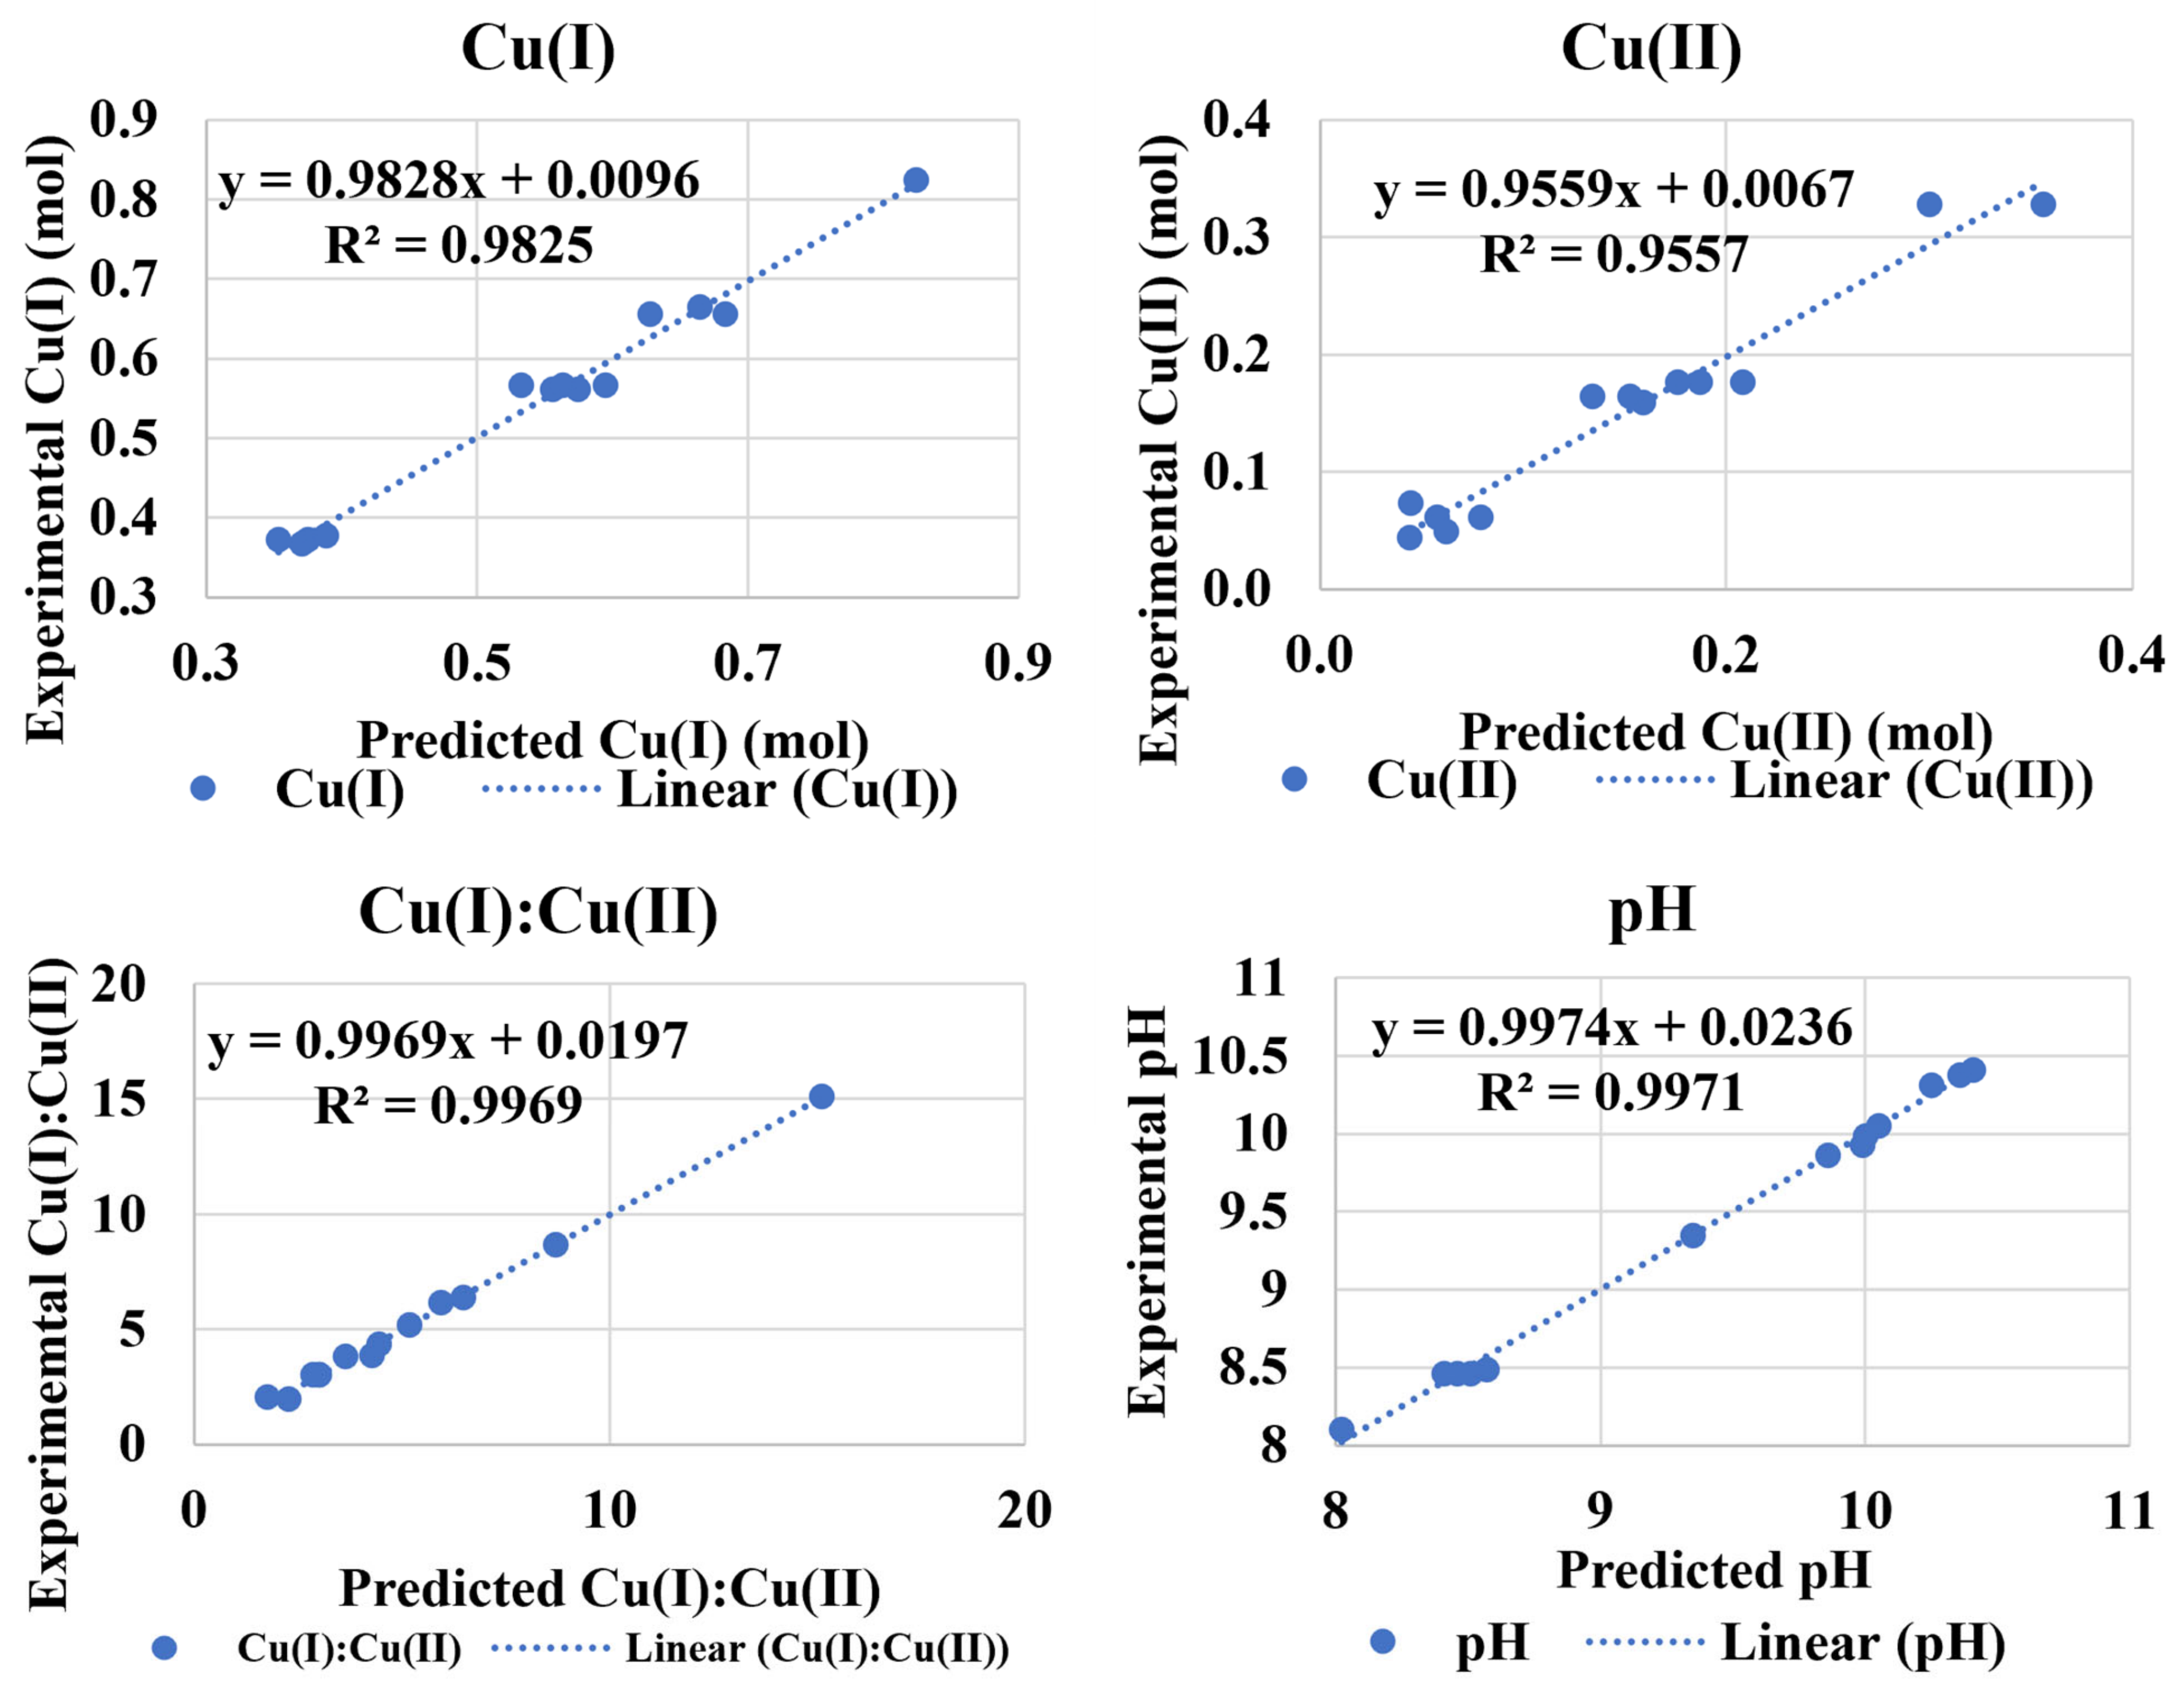
The predictive models (valid for ranges in Table 4) for Cu(I), Cu(II), Cu(I):Cu(II), and pH were obtained from statistical analysis of the data using the back elimination method to only include the significant variable with p < 0.05. The comparison of these models with experimental data (Figure 8) and higher Adj. R2 of Equations (17)–(20) support the goodness of models.
[Cu(I)] = −0.03413 + 0.03569[D] Adj. R2 = 96.48%
[Cu(II)] = −0.5743 + 1.541[A] − 0.5598[B] + 1.461[C] + 0.1744[D] − 2.076[A]2 − 1.116[C]2
                               Adj. R2 = 97.14%
Cu(I):Cu(II) = −0.107 + 0.528[A] − 0.669[B] − 0.499[C] + 1.229[D] − 0.1867[D]2 0.639[A][D] − 0.067[C][D]
                                       Adj. R2 = 84.60%
pH = 9.447 − 8.19[A] − 11.65[C] + 0.8708[D] + 11.94[A]2 + 9.05[C]2
                      Adj. R2 = 94.14%
where “[]” represents the concentration of the mentioned species A, B, C, and D in mol/L and A = Metallic Cu, B = CuSO4.5H2O, C = (NH4)2SO4, and D = NH4OH. These models are valid for ranges of Cu, CuSO4·5H2O, (NH4)2SO4, and NH4OH given in Table 4 at 25 °C.

3.4. Cu(I):Cu(II) at High pH (Experiment 2B)

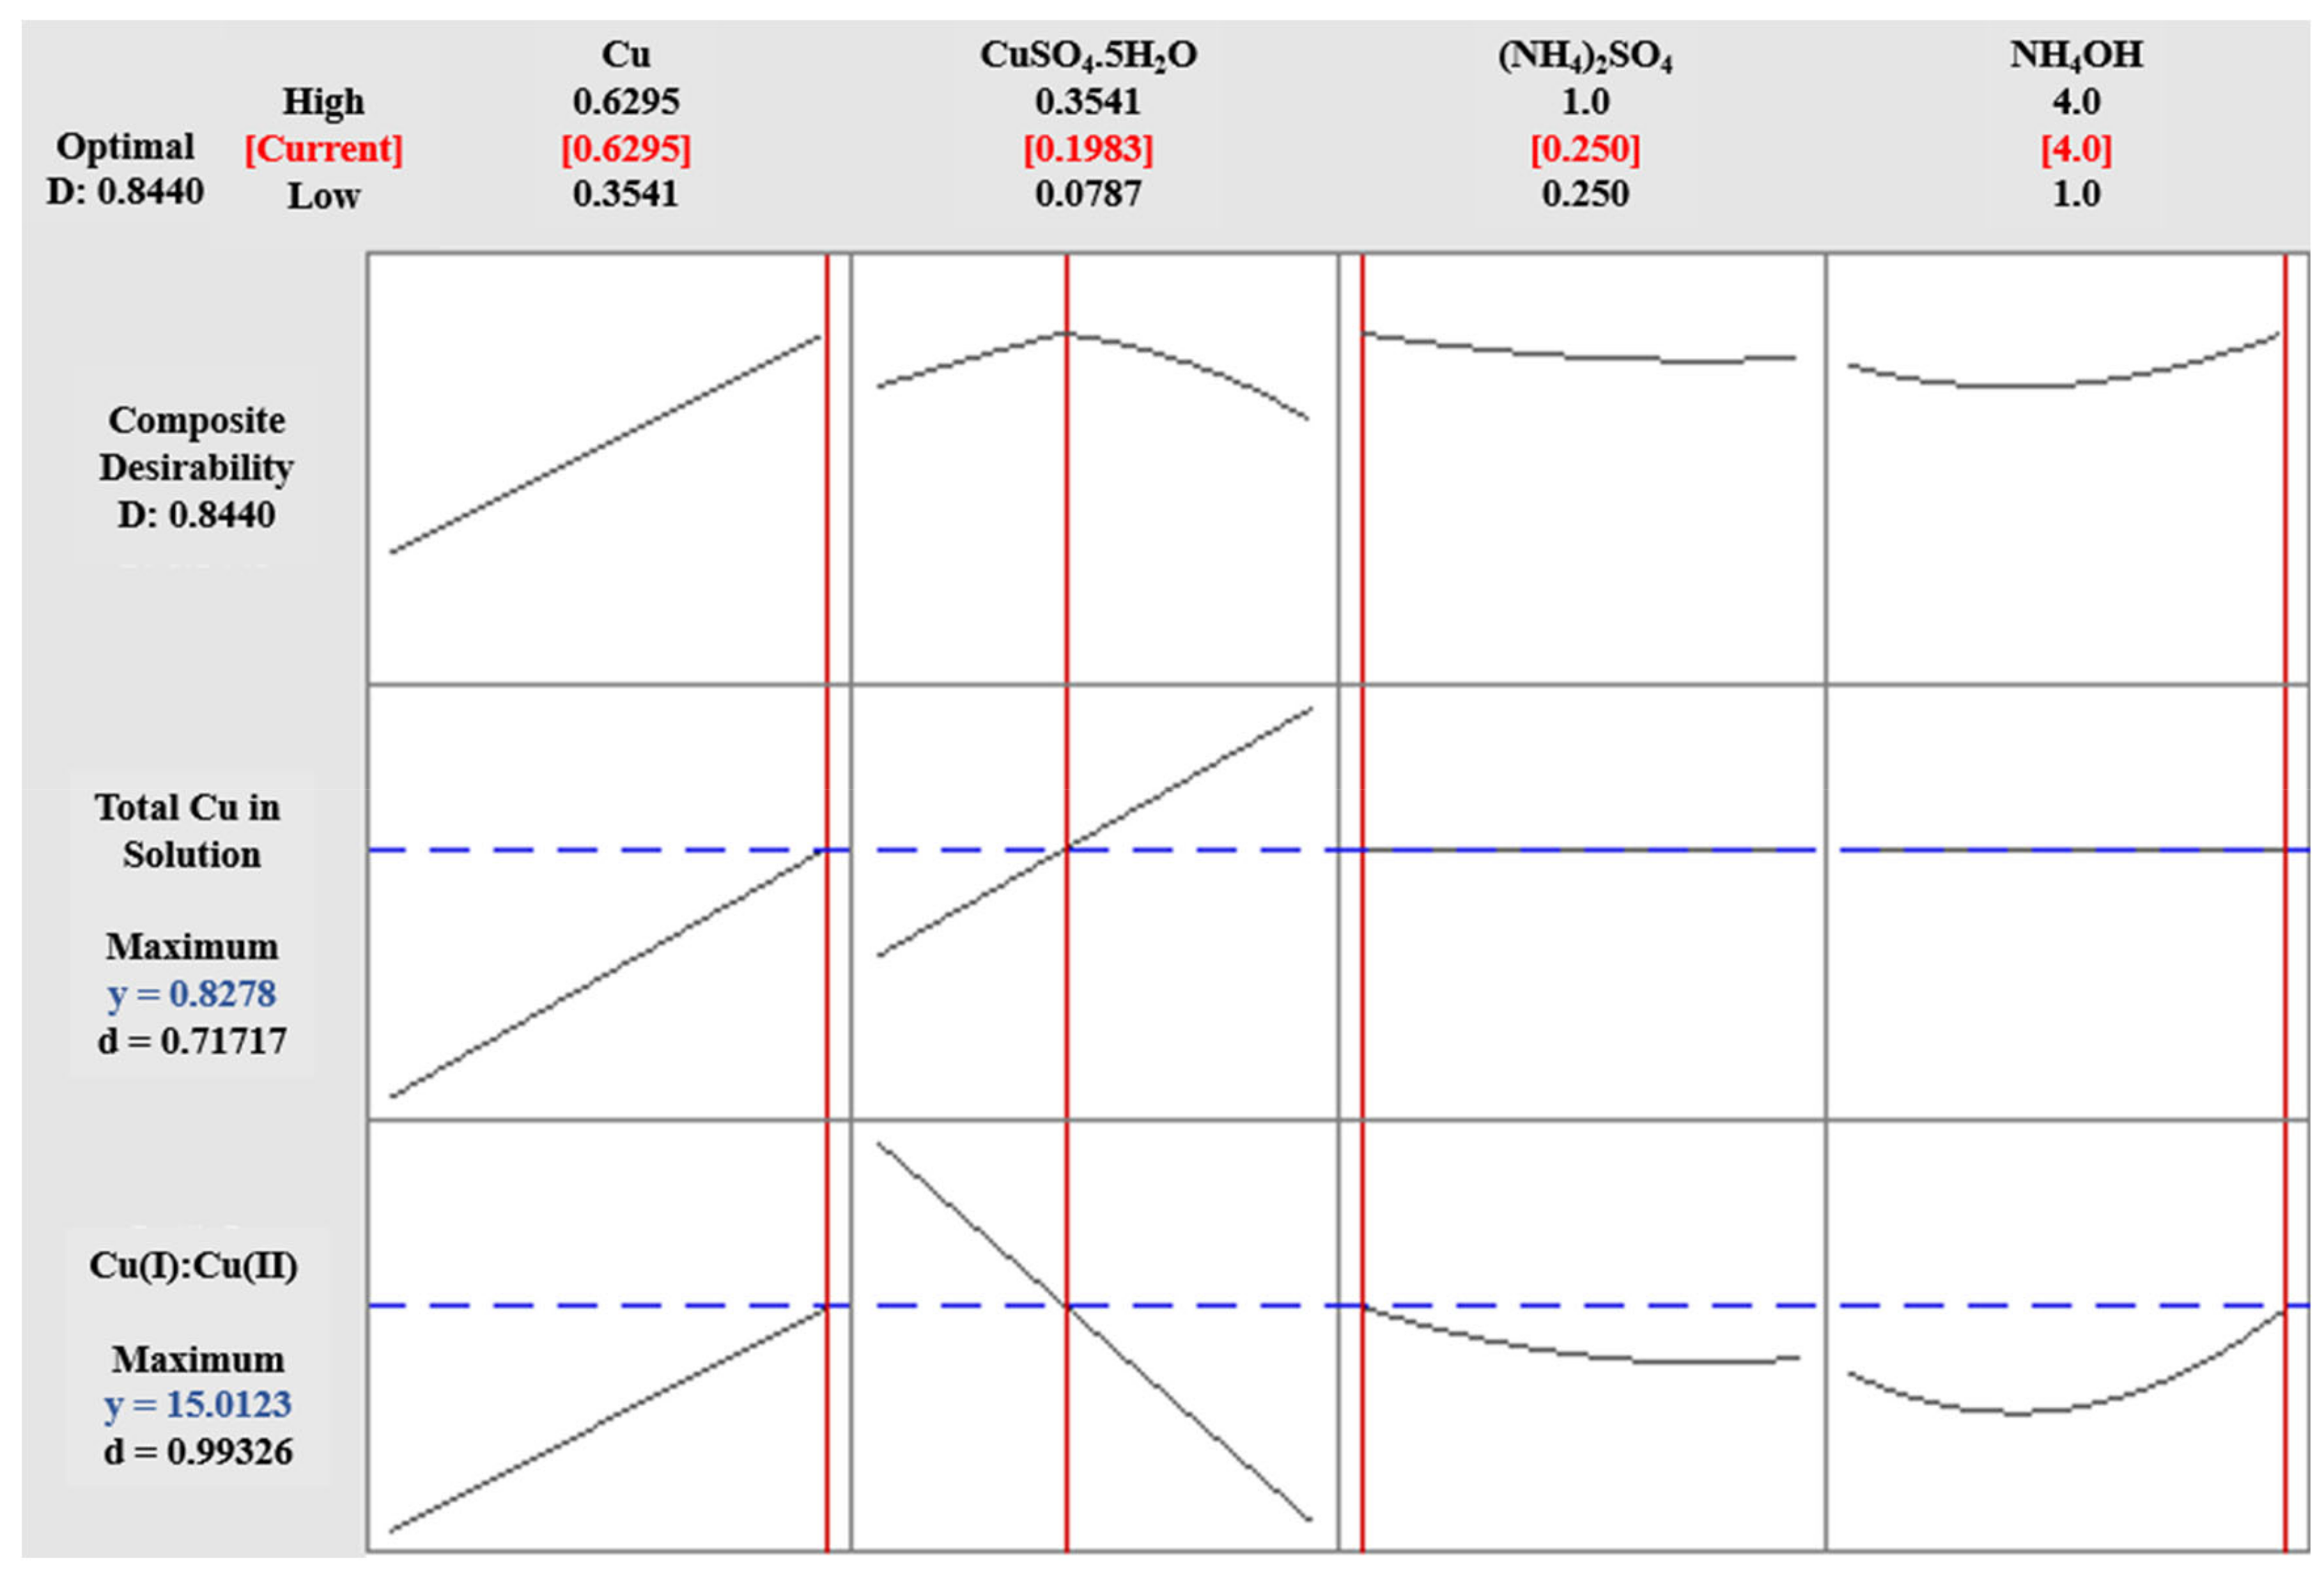
The added copper was completely dissolved in the high pH of Experiment 2B for the given range of concentrations for the electrolyte components (Table 5). The pH range for these experiments was 8.02–10.41, and higher pH showed a high Cu(I):Cu(II) ratio. The increasing concentration of the ammonium sulfate caused decrease in the Cu(I):Cu(II) for the given pH range, while the increasing ammonium hydroxide concentration resulted into the increased Cu(I):Cu(II) due to higher solubility of copper. The data was analyzed (Figure 9) to obtain optimum concentrations of electrolyte components. The maximum Cu(I):Cu(II) ratio can be obtained at 0.250 M and 4.0 M (NH4)2SO4 and NH4OH, respectively, and excessive metallic copper is required to achieve the maximum available Cu(II) reacted to form Cu(I).
At high alkaline pH (i.e., pH > 8, the solubility of copper increased significantly resulting in higher Cu(I):Cu(II) as reported by other researchers [9,10,16,20,21]. The higher concentration of soluble Cu(NH3)42+ reacts with the available metallic copper to produce a higher concentration of desired Cu(NH3)2+. The ammonium sulfate showed contrasting trends as reported in the literature [14], but this specific study was for a lower concentration of 0.05M copper. However, the negative impact of sulfide on copper solubility is because of the available sulfide forms copper sulfide with soluble copper. This trend is consistent with results reported by [17]. Based on the results, it is suggested that a higher alkaline pH is ideal for higher copper solubility, which ultimately results in higher Cu(I):Cu(II).
The predictive statistical models were obtained for Cu(I), Cu(II), Cu(I):Cu(II), and pH using the back elimination method. The back elimination method included only the statistically significant variables with p < 0.05. The comparison of statistical models with experimental data and the adjusted R2 values indicate the validity and goodness of these models. The comparison of statistical models with experimental data is presented in Figure 10, and models for Cu(I), Cu(II), Cu(I):Cu(II), and pH are given in Equations (21)–(24).
[Cu(I)] = 0.2468 + 0.220[A] + 1.652[B] − 0.1524[D] − 2.674[A][B] + 0.4210[A][D]
                            Adj. R2 = 96.99%
[Cu(II)] = −0.204 + 0.712[A] − 0.368[B] + 0.1264[D] + 2.224[A][B] − 0.3797[A][D]
                            Adj. R2 = 92.41%
Cu(I):Cu(II) = 4.61 + 32.35[A] + 35.50[B] − 3.489[C] − 7.463[D] + 0.922[D]2 − 141.93[A][B] + 5.69[A][D] + 10.11[B][C]
                                      Adj. R2 = 99.07%
pH = 13.903 − 4.435[A] + 3.190[B] − 6.876[C] − 1.713[D] + 5.084[B]2 + 0.1844[D]2 − 19.32[A][B] + 3.232[A][D]
                                        Adj. R2 = 99.13%
where “[]” represents the concentration of the mentioned species A, B, C, and D in mol/L and A = Metallic Cu, B = CuSO4.5H2O, C = (NH4)2SO4, and D = NH4OH. These models are valid for ranges of Cu, CuSO4·5H2O, (NH4)2SO4, and NH4OH given in Table 5 at 25 °C.

3.5. Equilibrium Constant (K)

To validate the suitability for use experimental data was compared to that produced by Visual MINTEQ for the equilibrium constant “K”. The equilibrium constants were calculated for each experiment using the Cu(I) and Cu(II) concentrations. These K values were less than 1 for low pH experiments, indicating that most species are unreacted and present as reactants. On the other hand, the high pH experiments showed K values slightly higher than 1, indicating that the reaction favors the formation of products [23]. The statistical predictive models for low and high pH are given in Equations (25) and (26), respectively, and a comparison of visual MINTEQ data with experimental data is presented in Figure 11.
K = −0.0896 + 0.0601[A] + 0.0297[C] + 0.1002[D] − 0.01073[D]2 − 0.0599[A][D] − 0.0291[C][D]
                                  Adj. R2 = 93.04%
K = −3.0 + 24.79[A] + 36.74[B] − 4.69[D] + 0.499[D]2 − 108.6[A][B] + 5.41[A][D]
                            Adj. R2 = 94.87%
where “[]” represents the concentration of the mentioned species A, B, C, and D in mol/L, and these models are valid for ranges of A = Cu, B = CuSO4·5H2O, C = (NH4)2SO4 and D = NH4OH given in Table 4 and Table 5 at 25 °C.

3.6. Cu(I):Cu(II) Using Visual MINTEQ

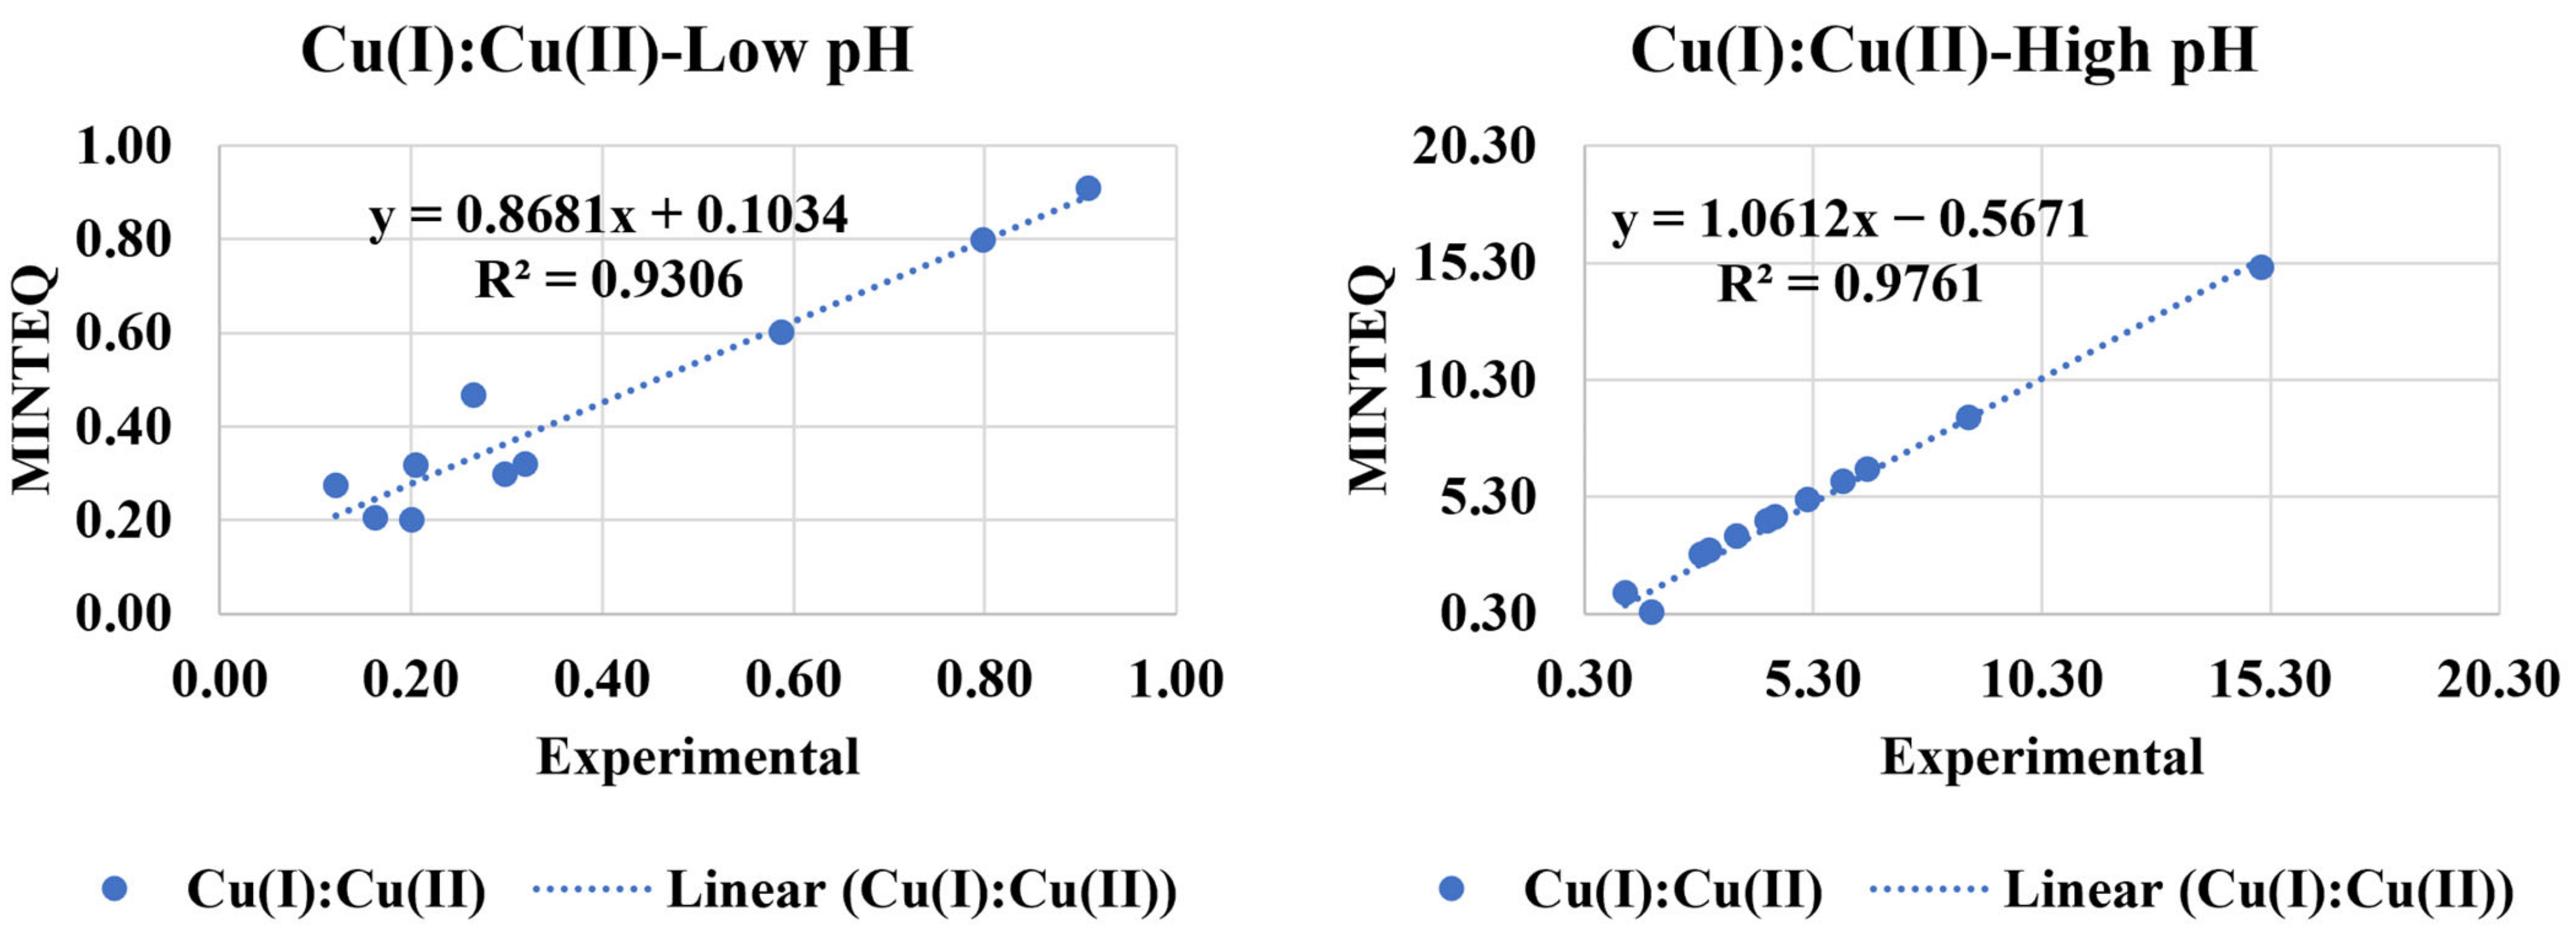
The comparison of Cu(I):Cu(II) ratio obtained experimentally and MINTEQ at varying metallic copper (Cu(0)) and copper sulfate (Cu+2) is shown in Figure 12. The results showed, as presented in Figure 12, R2 of 93.06% for maximum Cu(I):Cu(II) ratio against the pH range of 5–8 and R2 of 97.61% for the pH range of 8 and 10.5. The difference in the results can be attributed to software limitations and the anion and cation effects (activity) in the solution, which were not considered in our experiment plan and study scope. The ranges in our experimentation work match those reported by [14]. The obtained visual MINTEQ speciation agreed with the experimental data (Experiment 2A and 2B) for both high and low pH scenarios, as presented in Figure 12.

4. Conclusions

The Pourbaix diagram, a vital tool in this research, revealed the presence of copper-ammonia complexes in the electrolyte as Cu(NH3)42+, Cu(NH3)52+, and Cu(NH3)2+. This significant finding and the Eh-pH diagram, which clearly showed copper precipitation at pH less than 7 and greater than 11, depending on the Eh of the system, contribute to our understanding of copper behavior in electrolyte solutions. Notably, copper exists only as the soluble ammonia-copper complex between pH 7 and 11.
It was evident from this investigation the pH plays a crucial role in achieving maximum Cu(II) solubility. Specifically, the maximum Cu(II) can be achieved at 4.0M NH4OH and 0.25M (NH4)2SO4. The increase in the concentration of NH4OH led to an increase in the solubility of the copper in the electrolyte. However, the concentration of (NH4)2SO4 had a negative impact on the solubility of the copper after reaching a peak at 0.25M concentration of (NH4)2SO4, further highlighting the role of pH in the solubility of Cu(II).
For Experiment 2A, at a lower pH, a minimal amount of copper could dissolve in the solution. In this case, the highest Cu(I):Cu(II) ratio obtained was 0.91 against the 4.0M and 0.25M concentrations of NH4OH and (NH4)2SO4, respectively. For Experiment 2B at higher pH, a higher quantity of copper was dissolved in the solution, showing no precipitation, suggesting Cu(NH3)2+ and Cu(NH3)42+ species in the solution. In this case, the maximum Cu(I):Cu(II) ratio was 15.11 against the 0.25M (NH4)2SO4 and 4.0M NH4OH.
Equilibrium constants were calculated from the experimental data and compared using the MINTEQ for Experiment 2A (low pH) and Experiment 2B (high pH). K was less than 1 for the low pH experiments (2A) and greater than 1 for the high pH experiments (2B). As per the law of mass action, K > 1 makes the reaction favorable for forming products, i.e., the copper-ammonia complex. On the other hand, the K < 1 indicated the reaction that favors the formation of reactants.

5. Future Work

Based upon the results obtained and describe in this section, the following recommendations are made for future work:
  • A more detailed study focusing on the effects of NH4+ and SO4−2 on the solubility of copper in the copper-ammonia-sulfate system is still needed. This area presents promising research opportunities for future research work.
  • Most of the available speciation software databases lack different Cu+1 and Cu+2 complexes with ammonia. There is a need for detailed fundamental studies to determine the thermodynamic properties of respective different Cu+1 and Cu+2 complexes with ammonia in order to update the databases.

Supplementary Materials

The following supporting information can be downloaded at: https://www.mdpi.com/article/10.3390/waste2040022/s1, Table S1: Repeatability experiments for Cu(II) Solubility (Experiment 1); Table S2: Repeatability experiments for Cu(I):Cu(II) ratio (Experiment 2); Table S3: Design of experiment (DOE) for Cu(II) solubility experiments (Experiment 1). Table S4: Design of experiment (DOE) for low pH Cu(I):Cu(II) experiments (Experiment 2A); Table S5: Design of experiment (DOE) for high pH Cu(I):Cu(II) experiments (Experiment 2B) Table S6: Scoping tests for constant ammonium hydroxide and varying ammonium sulfate; Table S7: Scoping tests for constant ammonium sulfate and varying ammonium hydroxide.

Author Contributions

Conceptualization, J.M.W. and Z.A.A.; Methodology, J.M.W. and Z.A.A.; Software, Z.A.A.; Validation, Z.A.A.; Formal analysis, Z.A.A. and J.M.W.; Writing—original draft, Z.A.A.; Writing—review & editing, J.M.W.; Supervision, J.M.W.; Project administration, J.M.W.; Funding acquisition, J.M.W. All authors have read and agreed to the published version of the manuscript.

Funding

This material is based upon work supported by the National Science Foundation under Grant No. PFI 2044719.

Institutional Review Board Statement

Not applicable.

Informed Consent Statement

Not applicable.

Data Availability Statement

The original contributions presented in the study are included in the article/Supplementary Material, further inquiries can be directed to the corresponding author.

Conflicts of Interest

The authors have no conflict of interest.

References

  1. Lim, Y.; Kwon, O.H.; Lee, J.; Yoo, K. The ammonia leaching of alloy produced from waste printed circuit boards smelting process. Geosyst. Eng. 2013, 16, 216–224. [Google Scholar] [CrossRef]
  2. Oishi, T.; Koyama, K.; Alam, S.; Tanaka, M.; Lee, J.C. Recovery of high purity copper cathode from printed circuit boards using ammoniacal sulfate or chloride solutions. Hydrometallurgy 2007, 89, 82–88. [Google Scholar] [CrossRef]
  3. Ramos, A.; Miranda-Hernández, M.; González, I. Influence of Chloride and Nitrate Anions on Copper Electrodeposition in Ammonia Media. J. Electrochem. Soc. 2001, 148, C315. [Google Scholar] [CrossRef]
  4. Rudnik, E.; Pierzynka, M.; Handzlik, P. Ammoniacal leaching and recovery of copper from alloyed low-grade e-waste. J. Mater. Cycles Waste Manag. 2016, 18, 318–328. [Google Scholar] [CrossRef]
  5. Koyama, K.; Tanaka, M.; Miyasaka, Y.; Lee, J.C. Electrolytic copper deposition from ammoniacal alkaline solution containing Cu(I). Mater. Trans. 2006, 47, 2076–2080. [Google Scholar] [CrossRef]
  6. Oishi, T.; Koyama, K.; Konishi, H.; Tanaka, M.; Lee, J.C. Influence of ammonium salt on electrowinning of copper from ammoniacal alkaline solutions. Electrochim. Acta 2007, 53, 127–132. [Google Scholar] [CrossRef]
  7. Werner, J.; Bertucci, L.; Hubert, K.; Ali, Z. Extraction of Copper from a Feed Material for the Production of Metallic Copper; World Intellectual Property Organization: Alexandria, VA, USA, 2024. [Google Scholar]
  8. Sun, Z.H.I.; Xiao, Y.; Sietsma, J.; Agterhuis, H.; Visser, G.; Yang, Y. Selective copper recovery from complex mixtures of end-of-life electronic products with ammonia-based solution. Hydrometallurgy 2015, 152, 91–99. [Google Scholar] [CrossRef]
  9. Radmehr, V.; Koleini, S.M.J.; Khalesi, M.R.; Tavakoli Mohammadi, M.R. Ammonia Leaching: A New Approach of Copper Industry in Hydrometallurgical Processes. J. Inst. Eng. (India) Ser. D 2013, 94, 95–104. [Google Scholar] [CrossRef]
  10. Konishi, H.; Bitoh, T.; Ono, H.; Oishi, T.; Koyama, K.; Tanaka, M. Behavior of Copper Dissolution in an Ammonia Solution Containing Ammonium Chloride or Sulfate. J. Jpn. Soc. Exp. Mech. 2014, 14, s205–s209. [Google Scholar]
  11. Koyama, K.; Tanaka, M.; Lee, J.C. Copper leaching behavior from waste printed circuit board in ammoniacal alkaline solution. Mater. Trans. 2006, 47, 1788–1792. [Google Scholar] [CrossRef]
  12. Sun, Z.H.I.; Xiao, Y.; Sietsma, J.; Agterhuis, H.; Yang, Y. Complex electronic waste treatment—An effective process to selectively recover copper with solutions containing different ammonium salts. Waste Manag. 2016, 57, 140–148. [Google Scholar] [CrossRef] [PubMed]
  13. Lin, P.; Werner, J.; Ali, Z.A.; Bertucci, L.; Groppo, J. Kinetics and Modeling of Counter-Current Leaching of Waste Random-Access Memory Chips in a Cu-NH3-SO4 System Utilizing Cu(II) as an Oxidizer. Materials 2023, 16, 6274. [Google Scholar] [CrossRef] [PubMed]
  14. Velásquez-Yévenes, L.; Ram, R. The aqueous chemistry of the copper-ammonia system and its implications for the sustainable recovery of copper. Clean. Eng. Technol. 2022, 9, 100515. [Google Scholar] [CrossRef]
  15. Meng, X.; Han, K.N. Principles and applications of ammonia leaching of metals—A review. Miner. Process. Extr. Metall. Rev. 1996, 16, 23–61. [Google Scholar] [CrossRef]
  16. Sun, Z.; Cao, H.; Venkatesan, P.; Jin, W.; Xiao, Y.; Sietsma, J.; Yang, Y. Electrochemistry during efficient copper recovery from complex electronic waste using ammonia based solutions. Front. Chem. Sci. Eng. 2017, 11, 308–316. [Google Scholar] [CrossRef]
  17. Clarkson, A.H.; Paine, S.W.; Kendall, N.R. Evaluation of the solubility of a range of copper sources and the effects of iron & sulphur on copper solubility under rumen simulated conditions. J. Trace Elem. Med. Biol. 2021, 68, 126815. [Google Scholar] [CrossRef]
  18. Oishi, T.; Koyama, K.; Tanaka, M.; Lee, J.C. Influence of electrolyte on an energy-saving copper recycling process using ammoniacal alkaline solutions. Mater. Trans. 2006, 47, 2871–2876. [Google Scholar] [CrossRef]
  19. Guspita, D.; Ulianas, A. Optimization of complex NH3 with Cu2+ ions to determine levels of ammonia by UV-Vis spectrophotometer. J. Phys. Conf. Ser. 2020, 1481, 012040. [Google Scholar] [CrossRef]
  20. Nila, C.; Gonzfilez, I. The role of pH and Cu(II) concentration in the electrodeposition of Cu(II) in NH4Cl solutions. J. Electroanal. Chem. 1996, 401, 171–182. [Google Scholar] [CrossRef]
  21. Lin, P.; Ali, Z.A.; Werner, J. Investigation of the Bimodal Leaching Response of RAM Chip Gold Fingers in Ammonia Thiosulfate Solution. Materials 2023, 16, 4940. [Google Scholar] [CrossRef]
  22. Halpern, J. Kinetics of the Dissolution of Copper in Aqueous Ammonia. J. Electrochem. Soc. 1953, 100, 421. [Google Scholar] [CrossRef]
  23. Free, M. Hydrometallurgy: Fundamentals and Applications; John Wiley & Sons, Inc.: Hoboken, NJ, USA, 2013. [Google Scholar]
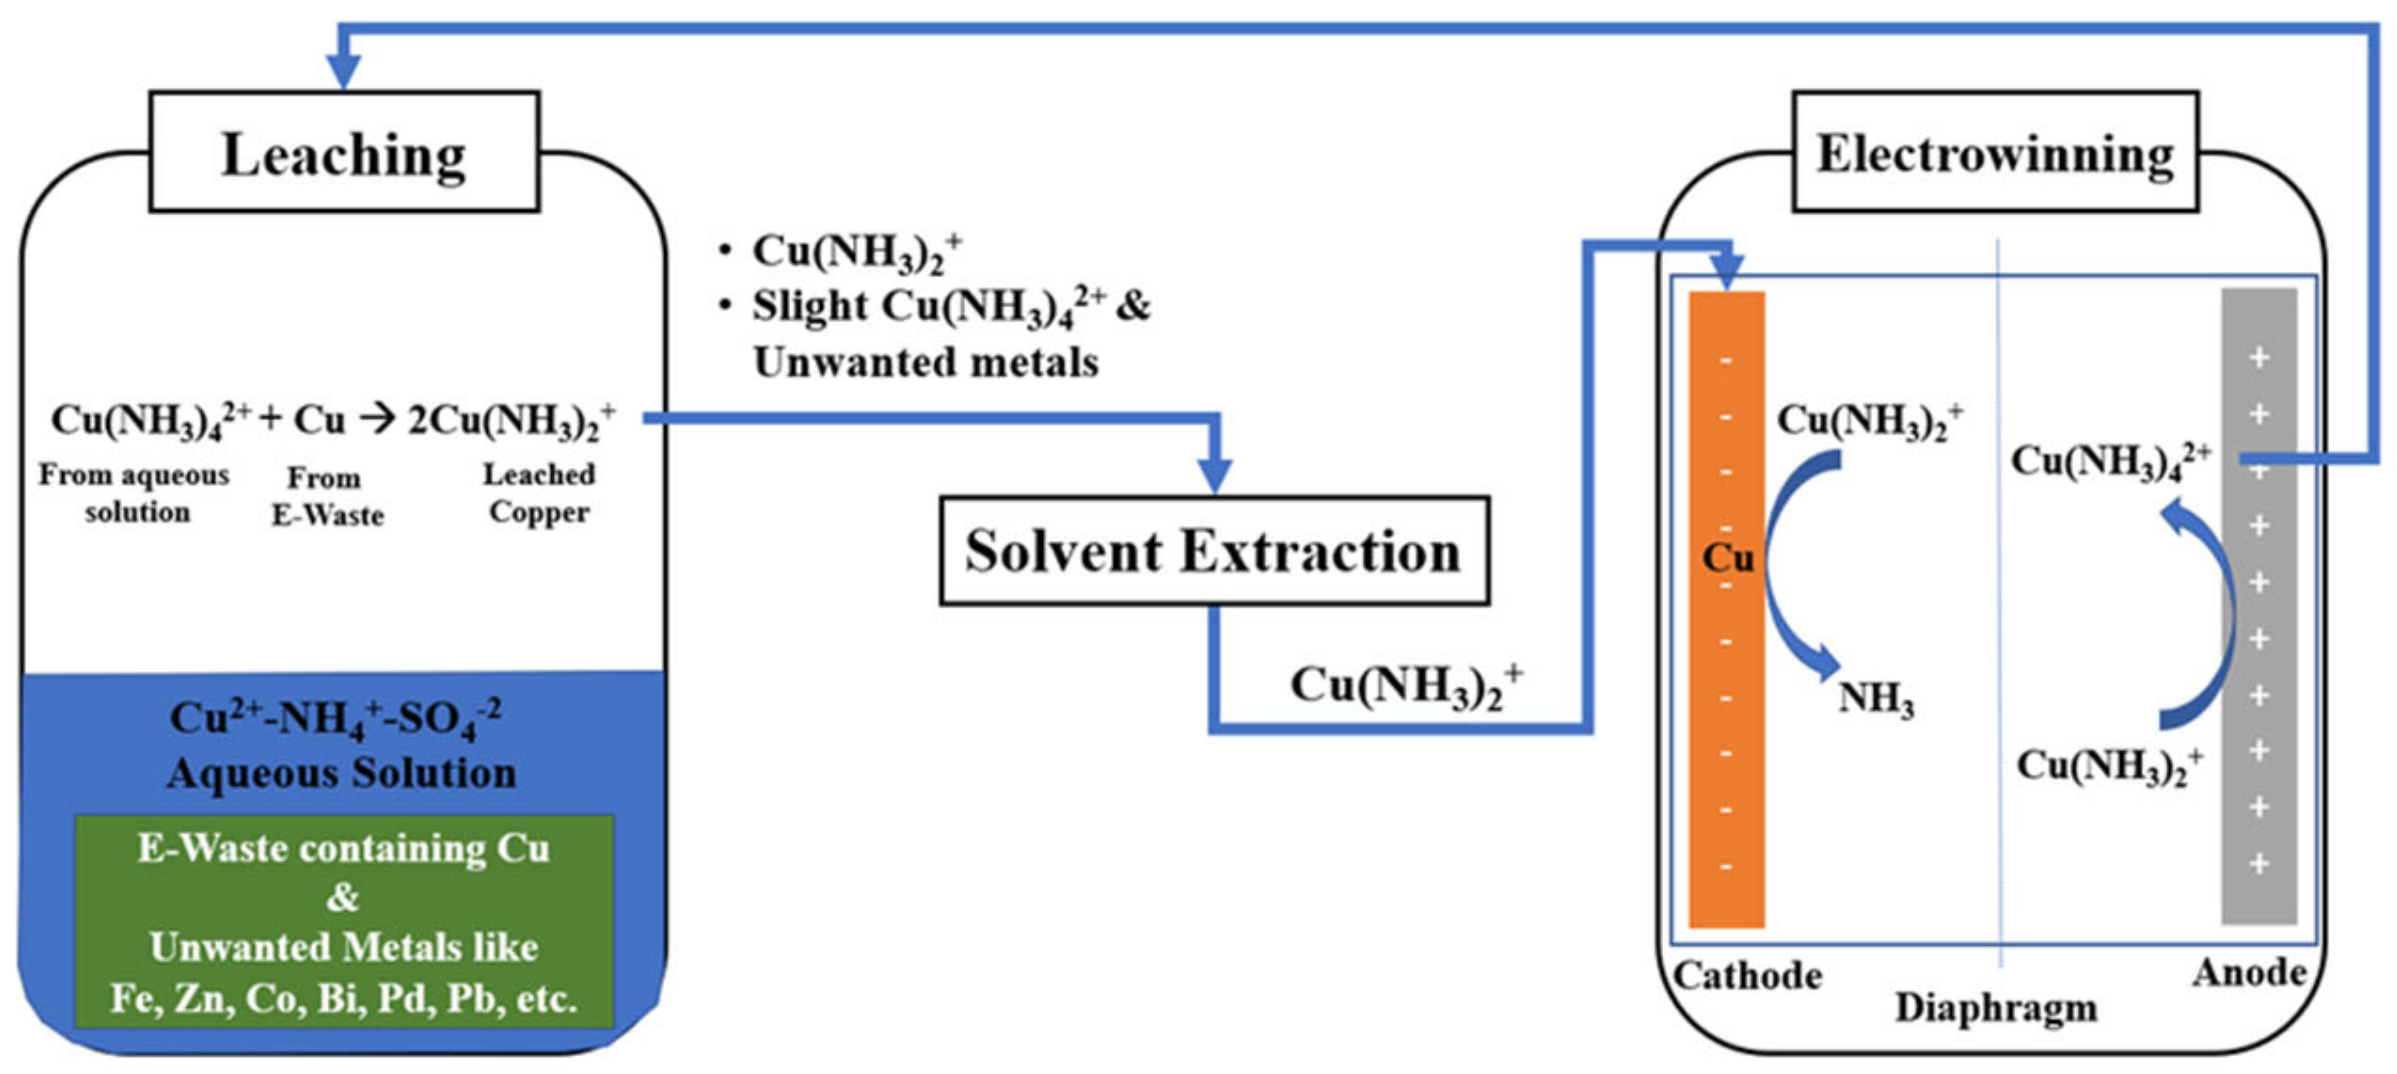
Figure 1. Schematic diagram of closed loop leaching-, solvent extraction and electrowinning circuit for ammonia based alkaline copper system.
Waste 02 00022 g001
Figure 2. Experiment structure and division for this study.
Waste 02 00022 g002
Figure 3. Leaching setup used to prepare Cu(II) and Cu(I) enriched electrolytes for the experimentation. The components include air flow meter, condenser, pH probe, sampling port and water bath.
Waste 02 00022 g003
Figure 4. Pourbaix diagram for copper solubility in ammonia and sulfate in water (0.25 M Cu, 5.0 M N and 1 M S). This diagram was created with HSC Chemistry 10.0.
Waste 02 00022 g004
Figure 5. Optimization plot for maximum CuSO4 solubility. (All concentrations are in mol/L, and D is the desirability function used for optimization with values between 0 and 1 and 1 being most desired. y represents the obtained value of desirability function. The blue line (dash line) represents the maximum and red line shows the optimum conditions).
Waste 02 00022 g005
Figure 6. Goodness of fit of statistical model with experimental data (A) pH and (B) Copper Concentration. The points are the experimental and prediction data and the dotted line depicts the goodness of fit which is represented by the R2 values along with the equation of line.
Waste 02 00022 g006
Figure 7. Optimization plot for Cu(I):Cu(II) ratio maximization at low pH (Experiment 2A). (All concentrations are in mol/L, and D is the desirability function used for optimization with values between 0 and 1 and 1 being most desired. y represents the obtained value of desirability function. The blue line (dash line) represents the maximum and red line shows the optimum conditions).
Waste 02 00022 g007
Figure 8. Experiment 2A—Comparison of statistical model predictive data with experimental data for Cu(I) and Cu(II) concentration, Cu(I):Cu(II) and pH. The points are the experimental and prediction data and the dotted line depicts the goodness of fit which is represented by the R2 values along with the equation of line.
Waste 02 00022 g008
Figure 9. Optimization plot for Cu(I):Cu(II) ratio maximization at low pH (Experiment 2B) (All concentrations are in mol/L, and D is the desirability function used for optimization with values between 0 and 1 and 1 being most desired. y represents the obtained value of desirability function. The blue line (dash line) represents the maximum and red line shows the optimum conditions).
Waste 02 00022 g009
Figure 10. Experiment 2B—Comparison of statistical model predictive data with experimental data for Cu(I) and Cu(II) concentration, Cu(I):Cu(II) and pH. The points are the experimental and prediction data and the dotted line depicts the goodness of fit which is represented by the R2 values along with the equation of line.
Waste 02 00022 g010
Figure 11. Comparison of visual MINTEQ and experimental equilibrium constant (K) for (A) Low pH (Experiment 2A) and (B) High pH (Experiment 2B). The points are the experimental and prediction data and the dotted line depicts the goodness of fit which is represented by the R2 values along with the equation of line.
Waste 02 00022 g011
Figure 12. Comparison of Cu(I):Cu(II) ratio of experimental data with Visual MINTEQ data. The points are the experimental and prediction data and the dotted line depicts the goodness of fit which is represented by the R2 values along with the equation of line.
Waste 02 00022 g012
Table 1. Possible copper-ammonia complexes and their logK values [14].
ReactionlogK
Cu2+ + NH3 → Cu(NH3)2+4.19
Cu2+ + 2NH3 → Cu(NH3)22+7.74
Cu2+ + 3NH3 → Cu(NH3)32+10.69
Cu2+ + 4NH3 → Cu(NH3)42+12.88
Cu2+ + 5NH3 → Cu(NH3)52+12.88
Cu+ + NH3 → Cu(NH3)+5.78
Cu+ + 2NH3 → Cu(NH3)2+10.56
Table 2. Thermodynamic data for copper-ammine complexes [15].
Species Δ G f 0 (J/mol) Δ H f 0 (J/mol)S0 (J/mol·K)
Cu(NH3)+−10,469 149.5
Cu(NH3)2+−65,285 242.5
Cu(NH3)2+15,578−38,94512.1
Cu(NH3)22+−30,486−142,378111.4
Cu(NH3)32+−73,199−245,812199.7
Cu(NH3)42+−111,390−348,827273.9
Table 3. Experimental parameters for Experiment 1-Cu(II) saturation.
ComponentUnitsLower LimitCenter PointUpper Limit
(NH4)2SO4(mol)0.250.6251.00
NH4OH(mol)1.002.54.00
Constant
CuSO4.5H2O(mol)0.6295
Temperature(°C)25.0 ± 1.0
Table 4. Experimental parameters for Experiment 2A-Low pH (Case 1, 2 & 3).
ComponentUnitsLower LimitCenter PointUpper Limit
(NH4)2SO4(mol)0.250.6251.00
NH4OH(mol)1.002.54.00
Metallic Copper(mol)0.07870.35410.6295
ConstantUnitsLower LimitUpper Limit
CuSO4.5H2O(mol)0.35410.6295
Temperature(°C)25.0 ± 1
Table 5. Experimental parameters for Experiment 2B-High pH (Case 4 & 6).
ComponentUnitsLower LimitCenter PointUpper Limit
(NH4)2SO4(mol)0.250.6251.00
NH4OH(mol)1.002.54.00
Cu-ComponentsUnitsLower LimitUpper Limit
CuSO4.5H2O(mol)0.07870.3541
Metallic Copper(mol)0.35410.6295
Temperature(°C)25.0 ± 1
Disclaimer/Publisher’s Note: The statements, opinions and data contained in all publications are solely those of the individual author(s) and contributor(s) and not of MDPI and/or the editor(s). MDPI and/or the editor(s) disclaim responsibility for any injury to people or property resulting from any ideas, methods, instructions or products referred to in the content.