1. Introduction
Sales forecasting in make-to-order (MTO) environments is particularly challenging for small- and medium-sized enterprises (SMEs). Unlike make-to-stock (MTS) production, MTO operations are characterized by high product customization and volatile demand, which conventional planning methods often fail to handle [
1].
Recent advancements in digitalization offer extensive data resources through ERP systems, diverse sales channels, and external sources such as social media and economic indicators. These data pools provide the potential for enhanced forecasting accuracy. However, conventional statistical methods typically utilize only limited influencing factors and are insufficient to handle the complexities associated with data-intensive forecasting tasks [
2].
To address these challenges, we combined machine learning (ML) methods with targeted data enrichment to improve sales forecasting in customer-specific MTO settings. The goal was to develop a data-driven approach that enables SMEs to apply advanced models despite limited data and infrastructure. This approach aimed to significantly reduce digital barriers for SMEs [
3,
4] and facilitate proactive production planning by integrating diverse internal and external data sources.
Specifically, we leveraged modern ML algorithms such as Long Short-Term Memory (LSTM) [
5] and Gated Recurrent Units (GRUs) [
6], which are capable of capturing complex, nonlinear demand patterns and dependencies within heterogeneous datasets. This allowed accurate forecasts even under conditions of high demand variability and sporadic order intake, which are common in SMEs as they often work in a contract-based manner [
7]. Additionally, we emphasized transparency and usability in a developed IT tool to ensure acceptance among users with varying technical expertise, thus promoting digital technology adoption among SMEs [
8].
This paper presents results from a cross-industry benchmark comparing statistical and ML forecasting methods in three sectors—electrical equipment, steel, and office supplies. It provides actionable insights into feasibility, accuracy, and resource needs for SMEs in volatile MTO environments. The subsequent sections of the paper are organized as follows:
Section 2 reviews the relevant literature and the theoretical foundations of forecasting methods in MTO settings.
Section 3 outlines the methodology and benchmarking framework employed in the PrABCast study.
Section 4 presents detailed results, followed by a critical discussion in
Section 5. Finally,
Section 6 provides a profound conclusion and outlook.
2. Related Work
2.1. Challenges in Sales Forecasting for SMEs in MTO Environments
SMEs in MTO environments face high product variability, limited historical data, and volatile demand, making traditional forecasting methods insufficient. At the same time, resource constraints and limited trust in complex models often hinder the adoption of advanced forecasting technologies [
9].
2.2. Overview of Forecasting Methods
Several forecasting methods have been explored in the literature to address these challenges. Traditional statistical methods, including ARIMA, SARIMA, and Holt–Winters, are widely applied due to their interpretability and effectiveness in forecasting stable and seasonal demand patterns [
10]. Machine learning (ML) approaches, particularly tree-based models like Random Forest, XGBoost, and LightGBM, have demonstrated superior adaptability to volatile market conditions, achieving strong results in various forecasting competitions, notably the M4- and M5-Forecasting competitions [
11,
12]. Neural networks, specifically Long Short-Term Memory (LSTM) and Gated Recurrent Units (GRUs), have shown significant potential in capturing complex, nonlinear dependencies within demand data [
13,
14]. Additionally, hybrid and ensemble methods combining different forecasting techniques have exhibited enhanced accuracy compared to standalone models [
15,
16]. Prophet, developed by Facebook, and Transformer-based models represent emerging methods suitable for highly seasonal and complex forecasting scenarios. However, their widespread adoption remains limited [
17,
18].
2.3. Data Sources for Enhanced Forecasting
Historical sales data serve as the primary foundation for forecasting, supplemented by sales information from related products and outstanding orders [
19,
20]. The integration of external market indicators, including stock market indices, commodity prices, and currency exchange rates, can significantly improve forecasting accuracy by providing early signals of economic changes [
20,
21,
22,
23]. Economic indicators such as business climate indices and purchasing managers’ indices (PMIs) also offer valuable insights into future demand conditions [
24,
25,
26]. Furthermore, qualitative data sources like expert opinions, customer sentiments, and marketing analytics can enrich predictive models, providing context beyond purely quantitative inputs [
21]. Other factors such as weather conditions, holidays, and external crises play critical roles in specific industry sectors, notably retail and food industries, and should be considered for comprehensive forecasting [
23].
2.4. Research Gap and Contribution of This Study
While prior research has extensively compared forecasting methods and the influence of different data sources on technical grounds such as accuracy, these studies often overlook practical constraints faced by SMEs, especially in MTO settings. Most evaluations assume ideal data conditions, perfect model tuning, and unlimited technical resources. In real-world industrial environments, however, trust, interpretability, ease of use, and robustness to imperfect data are often more decisive than marginal improvements in accuracy metrics. This paper addresses this gap by benchmarking classical and machine learning forecasting techniques not only across metrics, but across dimensions of usability, explainability, and contextual suitability in real-world MTO settings. The findings aim to support SMEs in finding the right configuration of forecasting methods and data sources that align with their operational realities, rather than abstract theoretical optima.
3. Methodology
Sales forecasting in MTO environments is challenged by diverse product configurations, infrequent orders, and limited data. This study uses a two-step empirical approach: (1) a univariate benchmark across three industries and (2) case studies with multivariate data enrichment. Beyond accuracy, the focus lies on practical applicability, interpretability, and implementation effort. The design balances generalizability and realism, with univariate models reflecting SME maturity and pilot studies testing the added value of external indicators.
3.1. Study Design and Benchmarking Approach
The core study involves a cross-industry benchmark of forecasting models conducted in collaboration with three companies from different manufacturing sectors:
Company A (High-End Lighting Systems): A global premium manufacturer of lighting solutions used in different setups. The company operates internationally with production and sales locations across Europe, North America, and Asia. Its product portfolio is characterized by modular systems and long-lifecycle components.
Company B (Consumer-Grade Durable Goods): A European producer of household items, known for robust and cost-sensitive product designs. The company serves both B2B and B2C channels and operates with large product variation and long product lifecycles.
Company C (Specialty Metal Distribution): A globally operating metals distributor focused on high-performance materials for special applications. Its operations are strongly influenced by raw material market fluctuations, and forecasting is used primarily to support procurement and inventory strategies.
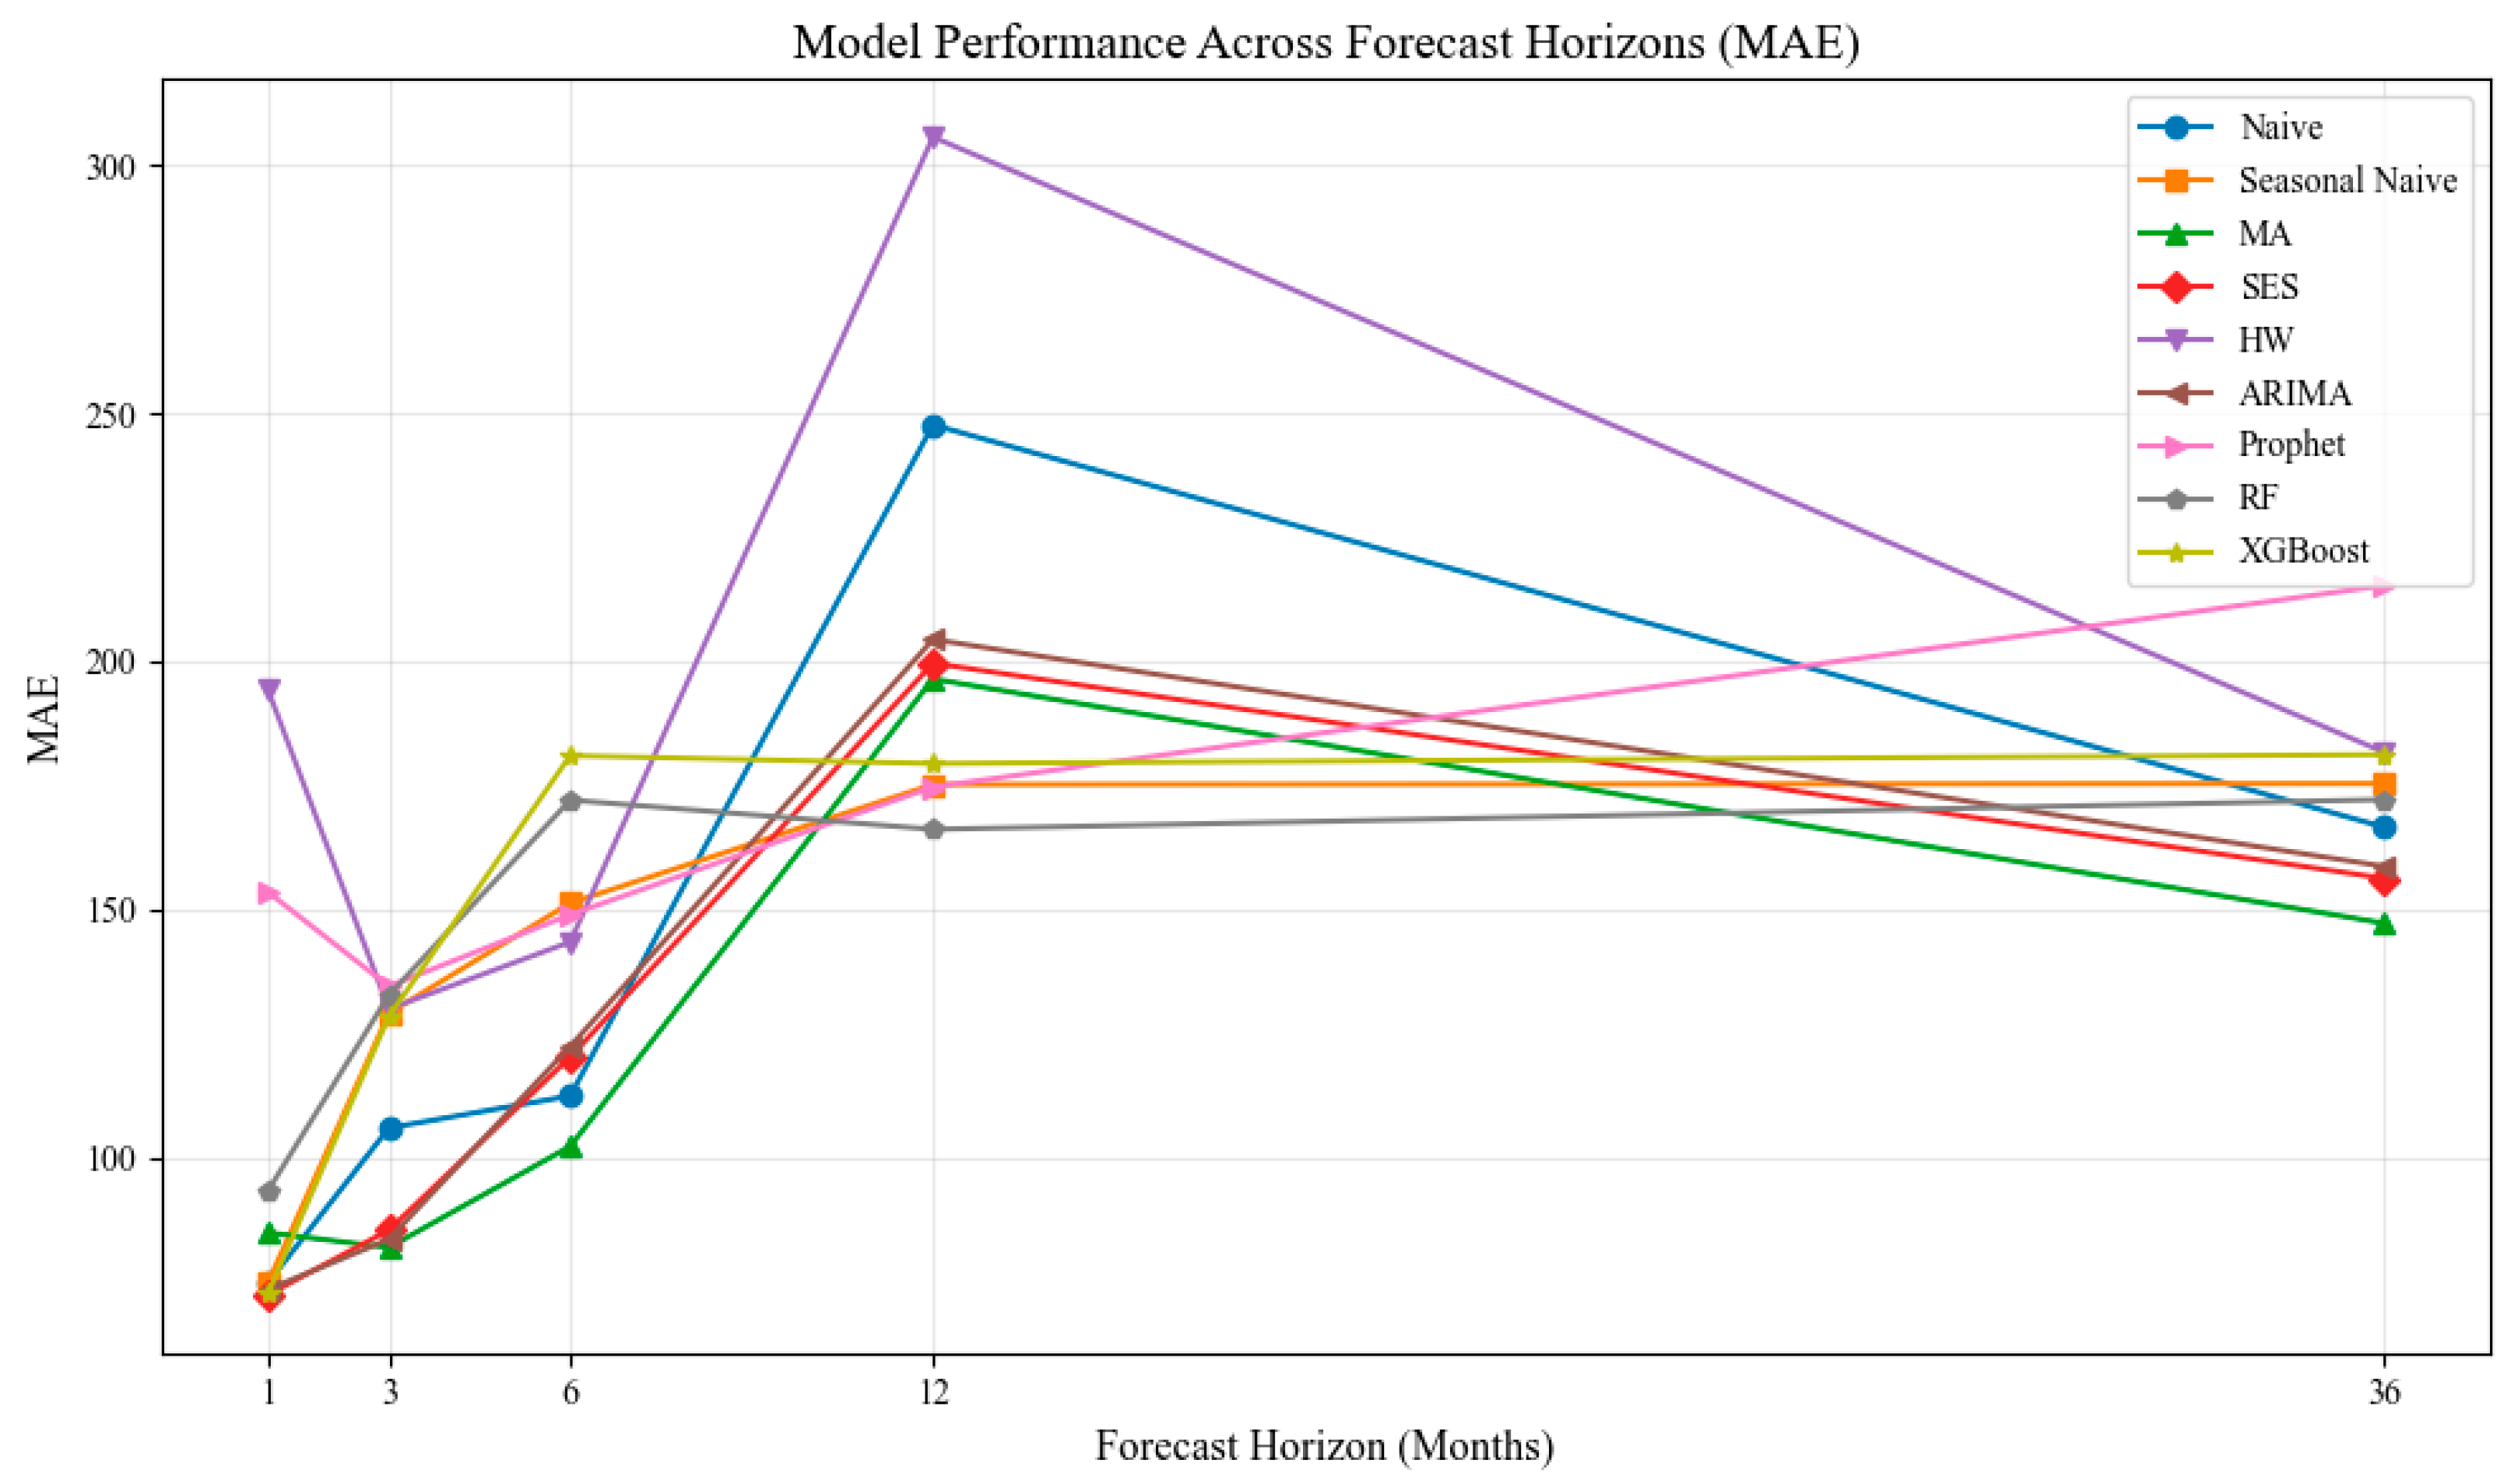
Each company provided product-level sales data, which was analyzed using a consistent univariate forecasting framework across multiple horizons (1, 3, 6, 12, and 36 months). Selected products were re-evaluated with multivariate models using external variables. The benchmark included both statistical and ML methods and was designed to reflect industrial conditions—e.g., incomplete data, minimal preprocessing, and limited tuning. Evaluation considered not only accuracy (MAE, RMSE, and sMAPE), but also robustness, runtime, complexity, and explainability to ensure practical relevance for SMEs.
3.2. Forecasting Models Evaluated
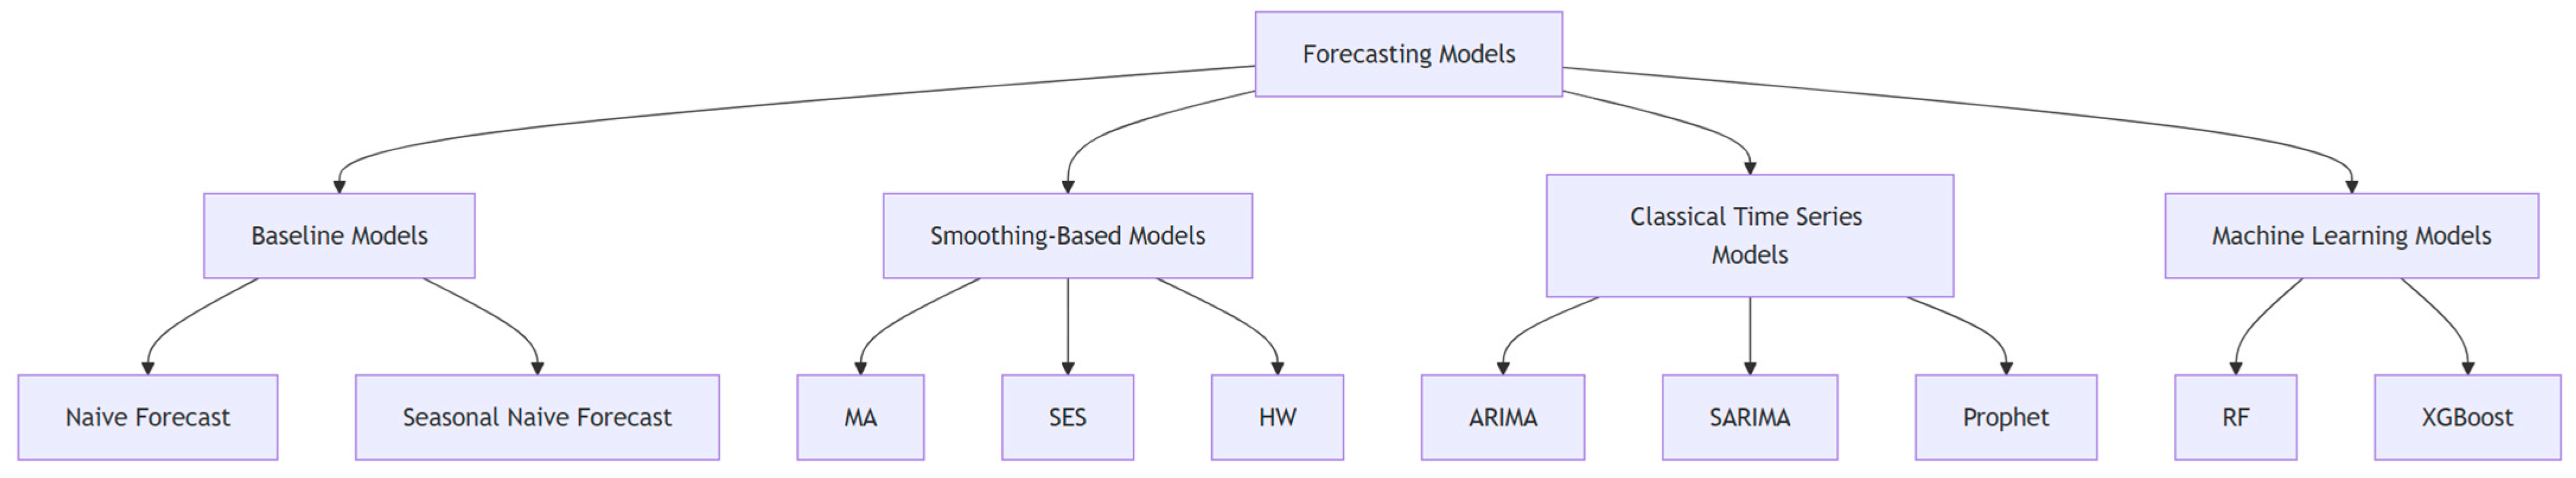
To reflect varying data availability and technical maturity in SMEs, the benchmark includes a broad set of forecasting models—ranging from simple statistical to advanced machine learning methods—grouped into four categories: baseline (Naive and Seasonal Naive), smoothing-based (Moving Average (MA), Seasonal Exponential Smoothing (SES), and Holt–Winters (HW)), classical time series (ARIMA, SARIMA, and Prophet), and machine learning (Random Forest and XGBoost).
All models (see
Figure 1) were implemented in Python 3.11 with minimal tuning to reflect SME constraints. The first step used univariate models based solely on historical sales. Selected products were later re-evaluated with multivariate models, incorporating external data and engineered features like lags and seasonality. This setup enabled a broad comparison of accuracy, robustness, runtime, and usability.
3.3. Evaluation Metrics and Criteria
Model performance was evaluated using MAE, RMSE, and sMAPE, capturing average, large, and scale-normalized errors. Additionally, runtime, memory usage, and interpretability were assessed qualitatively, with domain experts judging transparency and practical usability.
4. Results
4.1. Univariate Benchmark Results
Univariate results across all companies showed very high sMAPE values, often over 100%, reflecting the forecasting difficulty in MTO settings with volatile and inconsistent demand. These high errors often stemmed from a few SKUs with catastrophic model failures, distorting averages. This highlights the need for product-specific model assessment. The analysis therefore examines (1) average model accuracy and (2) SKU-level robustness. The following subsections present per-company results, horizon-wise breakdowns, and qualitative insights.
4.1.1. Setup and Scope
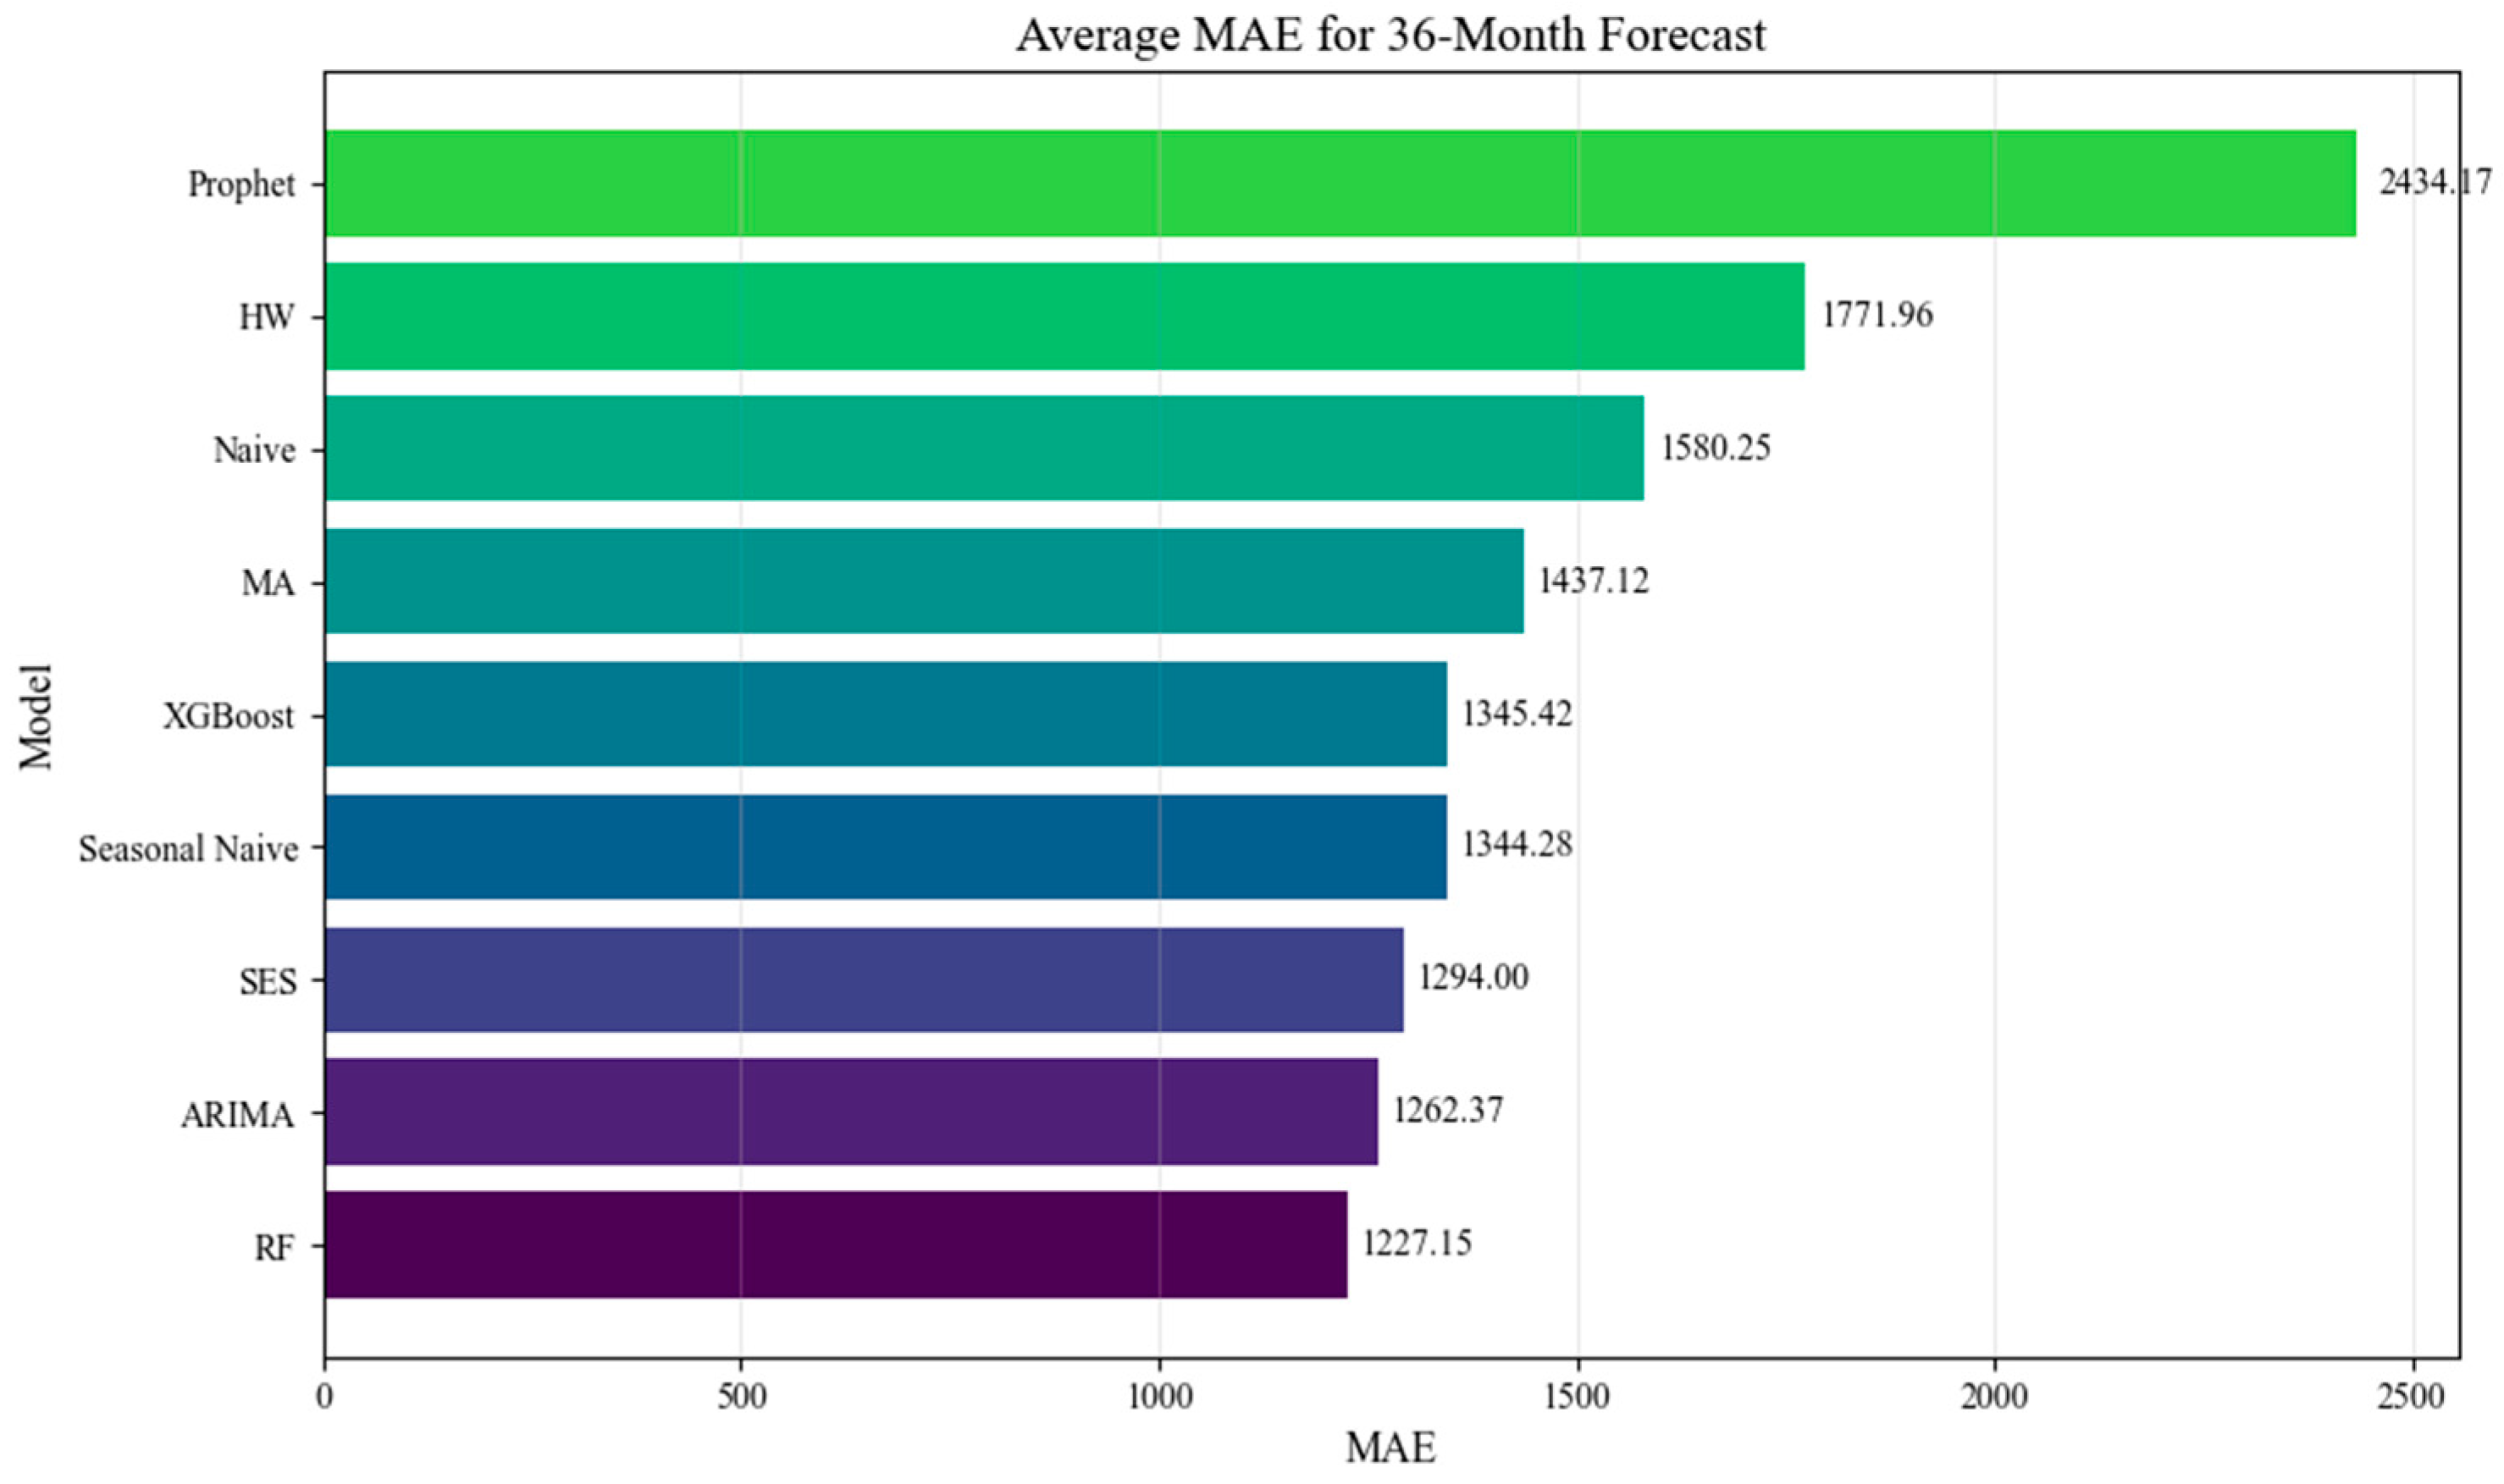
The study benchmarked univariate forecasting across three anonymized MTO companies (A: electronics; B: steel; C: lighting) using monthly SKU-level sales data from 2014 to 2023. After cleaning, only SKUs with ≥12 months of data and recent demand were included. Models included classical statistical methods (Naive, MA, SES, Holt–Winters, and ARIMA), ML models (RF and XGBoost), and Prophet by using Sklearn, Keras and statsmodels. Forecasts were evaluated via rolling-origin validation over five horizons (1–36 months) using MAE, RMSE, and sMAPE. While all models ran successfully (>900 runs for Company A), some failed practically on specific SKUs. Each SKU was also classified by demand pattern to assess robustness.
4.1.2. Company A—Electronic Equipment
Overview of Forecast Accuracy
Company A’s forecasting results highlight the volatility and structural complexity of demand in MTO environments, even within a highly engineered and modular product portfolio. The average forecast accuracy across all models and horizons is relatively low, with sMAPE values ranging from ~5% in short-term forecasts to over 50% in longer-term settings. Notably, even simple models such as ARIMA and Naive frequently outperform more sophisticated methods in both accuracy and consistency. Across all horizons, ARIMA is the top performer on average, particularly for short-term forecasts, where it achieved an sMAPE of just 5.01%. MA and Prophet consistently fall behind due to their inability to adapt to the nuanced contract-driven cycles and demand inflections. Importantly, many models exhibit signs of structural mismatch rather than data noise—for example, HW performs poorly even in seasonal settings due to the irregular impact of frame contracts that introduce pseudo-seasonality not well captured by fixed seasonal periods.
Key Observations
Company A’s results highlight the key challenges of univariate forecasting in MTO environments. While ARIMA achieved strong short-term performance (an sMAPE of ~5% in best cases), forecast quality declined sharply at longer horizons. This drop is largely due to structural breaks from frame contracts and irregular orders—patterns not captured by standard time series models. Even models like Holt–Winters and Prophet failed to reflect the pseudo-seasonality introduced by contract-driven cycles.
The modular and technically sophisticated product portfolio adds to the complexity, yet no model was able to detect recurring demand impulses tied to these contract dynamics. This underlines the limits of univariate models for strategic planning: they may support stable short-term decisions, but they lack sensitivity to external triggers or latent drivers. For Company A, enriching forecasts with contract calendars, customer-specific patterns, or macroeconomic indicators is essential for robust mid- and long-term planning.
4.1.3. Company B—Consumer Goods
Overview of Forecast Accuracy
For Company B, forecasting was particularly challenging, with average sMAPE values exceeding 120% across all horizons. Surprisingly, the best results came from the simplest models—SES and Seasonal Naive—followed by Moving Average and Random Forest. More complex methods did not outperform these baselines. SES was especially robust, with low variance across SKUs, indicating recurring or mean-reverting demand patterns in parts of the portfolio, well-suited to smoothing-based approaches.
Key Observations
Company B’s results highlight the heterogeneity of MTO sales patterns—even within a single firm. While simple models like Naive and SES often delivered solid average performance, product-level analysis revealed that complex models such as ARIMA, Prophet, or Random Forest occasionally outperformed in SKUs with irregular or nonlinear demand. This confirms that no model is universally optimal. Rigid, one-size-fits-all pipelines risk both under- and overfitting. Instead, forecasting strategies should be segmented—tailored per SKU or product group—and supported by robust evaluation mechanisms. These findings underscore the need for adaptive model configurations in MTO settings with diverse product lifecycles and demand drivers.
4.1.4. Company C—Specialty Metal Distribution
Overview of Forecast Accuracy
Company C, active in the distribution of specialty metals for sectors like oil and gas and aerospace, used sector-level aggregation to manage extreme volatility at the SKU level. Despite this, demand remained highly erratic. Naive forecasts performed best in nearly half of all cases, outperforming both statistical and machine learning models. Complex models like XGBoost or Prophet showed inconsistent results and high error variance. In contrast, simple models such as SES and Moving Average delivered robust performance, especially for groups with mean-reverting or cyclical demand.
Key Observations
Company C’s results highlight the limits of univariate forecasting in volatile, project-driven environments. Aggregating by target sector improved signal clarity but did not resolve core unpredictability. Naive models often performed best, reflecting weak learnable patterns. The sector-based grouping strategy proved valuable and points toward the need for multivariate models using industry-specific indicators (e.g., commodity prices) to improve forecastability beyond the scope of historical sales alone.
4.1.5. Cross-Industry Comparison
The cross-comparison reveals a central insight: forecasting performance in MTO environments is inherently product- and context-specific. While Naive models were frequently the best-performing option across all companies, this does not imply general superiority. Instead, their success reflects the lack of exploitable patterns in many demand series and highlights the limited forecastability of highly volatile or externally driven product segments.
A key new finding from this benchmark is the model consistency analysis across all companies: model robustness cannot be assumed even within one company and should be tested explicitly per use case. From a practical perspective, the results suggest the following:
No model is universally reliable—model selection must be tailored to each forecasting scenario.
For high-volume, high-runner SKUs, classical statistical models such as ARIMA, MA, or SES often provide competitive and stable results, particularly for short-term tactical planning.
However, inconsistent performance and structural volatility in many product groups indicate the need for a contextual enrichment of forecasts. This includes, e.g., sector-specific indicators (e.g., commodity prices) and contract-related information.
In summary, this study underscores that effective forecasting in MTO production is not about finding the “best” model but about configuring the right model for the right product in the right context. Future forecasting systems should enable modular, adaptive model configurations, ideally integrating external data sources to enhance signal strength—especially where historical sales alone are insufficient for reliable planning.
4.2. Experiments with Multivariate Data
While
Section 4.1 examined univariate models based solely on historical sales data, this section evaluates multivariate forecasting using external variables such as macroeconomic indicators, financial data, and commodity prices. The aim is to assess whether these inputs enhance accuracy or interpretability, particularly in volatile or data-scarce MTO settings. Multivariate pilots were conducted with Companies B and C based on data availability and project relevance. Although Company A was also analyzed, its complexity requires a separate publication. This section focuses on practical insights from B and C, showcasing both the potential and limitations of multivariate models in industrial forecasting.
4.2.1. Company B—Consumer Durables with Market Data Integration
Data Sources and Preparation
While no internal variables were available beyond historical sales, external data were incorporated, including the following:
Macroeconomic indicators from the FRED database (e.g., inflation, GDP, and unemployment in Germany, the EU, and the USA)
Financial data from Yahoo Finance (e.g., stock prices of industry peers, ETFs, and commodity prices potentially influencing production cost)
Correlation and Granger causality analyses revealed some weak-to-moderate signals—e.g., U.S. consumer stock prices showed minor predictive potential—but overall influence was limited. This suggests that external indicators may help explain variance, but they are not strongly causative in this setting.
Modeling and Evaluation
A 6-month forecast was conducted using both univariate and multivariate models. The best accuracy was achieved by simple univariate models such as SES and Seasonal Naive (MAE < 30; sMAPE ~1.15%), clearly outperforming multivariate XGBoost (sMAPE ~85%). However, from an operational viewpoint, the univariate SES model merely produced a smoothed average, missing short-term dynamics. In contrast, XGBoost captured local fluctuations clearly but introduced systematic overestimation (bias = +331). While error metrics penalized this deviation, the model’s ability to track demand curves could support resource planning. This highlights the trade-off between mean-level stability and temporal detail, suggesting that model choice must align with the planning purpose (e.g., purchasing vs. staffing decisions) and the right evaluation metric.
4.2.2. Company C—Forecasting Under Raw Material Volatility
Data Sources and Preparation
The dataset covered 2020–2024 but was constrained by missing and inconsistent sales data in 2022 due to IT changes. Forecasting was thus limited to 2023 and 2024. External variables included the following:
Base and precious metals (e.g., copper, nickel, and gold);
Energy commodities (e.g., crude oil and gas);
Agricultural products (e.g., coffee and wheat).
Correlation and causality analyses identified copper (r = 0.71;
p = 0.018) and coffee (r = 0.65;
p = 0.042) as significant predictors—potentially reflecting macroeconomic demand cycles (see
Table 1). This supports the use of sector-relevant indices as early indicators of sales trends, even if causality is not directly evident.
Modeling and Evaluation
Forecasts for a 3-month horizon revealed that multivariate models significantly outperformed univariate ones:
The large Q4 2023 spike followed by a sharp drop in 2024 was captured only by the ML models. This underlines their potential to exploit nonlinear relationships, especially when sales data alone offer limited structure.
Practical Impact
Company C perceived the analysis as valuable, particularly for highlighting hidden dependencies. Beyond predictive power, the pilot positively influenced the company’s openness to AI-based forecasting and emphasized the role of exploratory correlation analysis as a low-threshold entry point. The methodology will be used to support qualitative strategic forecasting with quantitative data.
5. Discussion
This benchmark study underscores the complexity of sales forecasting in MTO environments. Forecast accuracy proved to be highly context-dependent, influenced by time series structure, planning goals, forecast horizon, and data availability. No single model consistently outperformed across companies, product groups, and evaluation metrics.
These findings argue against universal forecasting pipelines and in favor of segment-specific configurations. Even within the same company, some SKUs benefited from advanced models, while others performed best with statistical baselines. This highlights the need for automated approaches that assign suitable models based on product characteristics rather than relying on average performance metrics.
Interpretability and operational usability also play a crucial role. While machine learning models like XGBoost and Random Forest demonstrated potential, their complexity and sensitivity to noise often reduced trust—especially in low-data environments. In contrast, simpler statistical models such as SES, ARIMA, and Moving Average offered greater transparency and ease of integration.
Multivariate approaches only proved valuable when external indicators were causally and temporally aligned with internal demand. In Company C, such data led to clear improvements; in Company B, the effect was limited and required refinement. Where relevant data is available, model tuning—particularly hyperparameter optimization—is essential to unlock performance potential. These insights suggest a structured forecasting process: starting with the identification of relevant data sources, followed by definition of the planning task, horizon, and evaluation metric; narrowing down suitable model classes; and concluding with rigorous model comparison and tuning. Overall, the study supports the development of adaptive, interpretable, and context-aware forecasting systems that prioritize robustness and usability over marginal accuracy gains.
6. Conclusions and Outlook
This study demonstrates that effective sales forecasting in MTO environments depends on tailored configurations rather than universally superior models. Simple statistical approaches often outperformed complex models in terms of robustness and usability, particularly in short-term or low-data contexts. Machine learning methods only proved beneficial when external drivers were clearly linked to demand. These findings call for modular forecasting systems that adapt to specific planning tasks, product characteristics, and data availability.
Author Contributions
Conceptualization, M.S.; methodology, M.S.; software, M.S.; validation, M.S.; formal analysis, M.S., L.P.; investigation, M.S., L.P.; resources, J.D.; data curation, M.S., L.P.; writing—original draft preparation, M.S.; writing—review and editing, L.P., J.D.; visualization, M.S.; supervision, J.D.; project administration, M.S., J.D.; funding acquisition, J.D., M.S. All authors have read and agreed to the published version of the manuscript.
Funding
The results were produced as part of the Industrial Collective Research (IGF) projects PrOPPlan (23010N) and PrABCast (22180N) and were funded by the Federal Ministry of Economic Affairs and Energy (BMWE).
Institutional Review Board Statement
Not applicable.
Informed Consent Statement
Informed consent was obtained from all subjects involved in the study.
Data Availability Statement
The datasets presented in this article are not publicly available due to confidentiality restrictions, as sales data are classified as highly sensitive according to ISO/IEC 27001 and are subject to strict data protection and non-disclosure agreements.
Acknowledgments
We would like to thank our project partners and study participants as well.
Conflicts of Interest
The authors declare no conflicts of interest.
References
- Olhager, J. The role of the customer order decoupling point in production and supply chain management. Comput. Ind. 2010, 61, 863–868. [Google Scholar] [CrossRef]
- Makridakis, S.; Spiliotis, E.; Assimakopoulos, V. Statistical and Machine Learning forecasting methods: Concerns and ways forward. PLoS ONE 2018, 13, e0194889. [Google Scholar] [CrossRef] [PubMed]
- Lichtblau, K.; Schleiermacher, T.; Goecke, H.; Schützdeller, P. Digitalisierung der KMU in Deutschland: Konzeption und empirische Befunde; IW Consults: Köln, Germany, 2018. [Google Scholar]
- BMWi. Wirtschaftsmotor Mittelstand: Zahlen und Fakten zu den deutschen KMU; Bundesministerium für Wirtschaft und Energie: Berlin, Germany, 2018. [Google Scholar]
- Hochreiter, S.; Schmidhuber, J. Long Short-term Memory. In Neural Computation; MIT-Press: Cambridge, MA, USA, 1997. [Google Scholar]
- Cho, K.; Merrienboer, B.; Gulcehre, C.; Bougares, F.; Schwenk, H.; Bengio, Y. Learning Phrase Representations using RNN Encoder-Decoder for Statistical Machine Translation. arXiv 2014. [Google Scholar] [CrossRef]
- Uuskoski, M.; Mittal, S.; Menon, K.; Kärkkäinen, H. Challenges, Mitigation and Benefits of Outcome-based Contracts in Small and Medium-sized Machine Manufacturers: A Qualitative Exploratory Study. Int. J. Math. Eng. Manag. Sci. 2023, 8, 1149–1170. [Google Scholar] [CrossRef]
- Schuh, G.; Anderl, R.; Dumitrescu, R.; Krüger, A.; Hompel, M.t. Der Industrie 4.0 Maturity Index in der betrieblichen Anwendung. In Aktuelle Herausforderungen, Fallbeispiele und Entwicklungstrends; acatech-Studienreihe: Munich, Germany, 2020. [Google Scholar]
- Hasija, A.; Esper, T.L. In artificial intelligence (AI) we trust: A qualitative investigation of AI technology acceptance. J. Bus. Logist. 2022, 43, 388–412. [Google Scholar] [CrossRef]
- Ahaggach, H.; Abrouk, L.; Lebon, E. Systematic Mapping Study of Sales Forecasting: Methods, Trends, and Future Directions. Forecasting 2024, 6, 502–532. [Google Scholar] [CrossRef]
- Makridakis, S.; Spiliotis, E.; Assimakopoulos, V. M5 accuracy competition: Results, findings, and conclusions. Int. J. Forecast. 2022, 38, 1346–1364. [Google Scholar] [CrossRef]
- Makridakis, S.; Spiliotis, E.; Assimakopoulos, V. The M4 Competition: 100,000 time series and 61 forecasting methods. Int. J. Forecast. 2020, 36, 54–74. [Google Scholar] [CrossRef]
- Mouthami, K.; Yuvaraj, N.; Pooja, R.I. Analysis of SARIMA-BiLSTM-BiGRU in Furniture Time Series Forecasting. In Hybrid Intelligent Systems; Abraham, A., Hong, T.-P., Kotecha, K., Ma, K., Manghirmalani Mishra, P., Gandhi, N., Eds.; Springer Nature: Cham, Switzerland, 2023; pp. 959–970. ISBN 978-3-031-27408-4. [Google Scholar]
- Rahman Mahin, M.P.; Shahriar, M.; Das, R.R.; Roy, A.; Reza, A.W. Enhancing Sustainable Supply Chain Forecasting Using Machine Learning for Sales Prediction. Procedia Comput. Sci. 2025, 252, 470–479. [Google Scholar] [CrossRef]
- Feizabadi, J. Machine learning demand forecasting and supply chain performance. Int. J. Logist. Res. Appl. 2022, 25, 119–142. [Google Scholar] [CrossRef]
- Liu, D.; Li, T. A Drug Sales Forecasting Method Based on Multiple Models and Parameter Optimization. In Proceedings of the 2023 International Conference on Advances in Electrical Engineering and Computer Applications (AEECA), Dalian, China, 18–19 August 2023; IEEE: New York, NY, USA, 2023; pp. 495–500, ISBN 979-8-3503-0808-2. [Google Scholar]
- Ghareeb, S.; Mahyoub, M.; Mustafina, J. A comparative Time Series analysis of the different categories of items based on holidays and other events. In Proceedings of the 2023 15th International Conference on Developments in eSystems Engineering (DeSE), Baghdad, Iraq, 9–12 January 2023; IEEE: New York, NY, USA, 2023; pp. 131–136, ISBN 979-8-3503-3514-9. [Google Scholar]
- Rajendran, M.; Hong, B. Autoregressive multimodal transformer for zero-shot sales forecasting of fashion products with exogenous data. Appl. Intell. 2025, 55, 108. [Google Scholar] [CrossRef]
- Tarallo, E.; Akabane, G.K.; Shimabukuro, C.I.; Mello, J.; Amancio, D. Machine Learning in Predicting Demand for Fast-Moving Consumer Goods: An Exploratory Research. IFAC-PapersOnLine 2019, 52, 737–742. [Google Scholar] [CrossRef]
- Kim, S. Innovating knowledge and information for a firm-level automobile demand forecast system: A machine learning perspective. J. Innov. Knowl. 2023, 8, 100355. [Google Scholar] [CrossRef]
- Abhishek, K.L.; Niranjanamurthy, M.; Ananda Babu, J.; Abhijeet. Enactment of Sales Forecasting Application using Artificial Intelligence Techniques. In Proceedings of the 2024 Second International Conference on Data Science and Information System (ICDSIS), Hassan, India, 17–18 May 2024; IEEE: New York, NY, USA, 2024; pp. 1–7, ISBN 979-8-3503-8166-5. [Google Scholar]
- Hellmers López, D.; Julia Kramer, K.; Schmidt, M. ML-basierte Absatzprognose mit Frühindikatoren. ZWF Z. Wirtsch. Fabr. 2023, 118, 324–329. [Google Scholar] [CrossRef]
- Syberg, M.; West, N.; Lenze, D.; Deuse, J. Framework for predictive sales and demand planning in customer-oriented manufacturing systems using data enrichment and machine learning. Procedia CIRP 2023, 120, 1107–1112. [Google Scholar] [CrossRef]
- Sagaert, Y.R.; Aghezzaf, E.-H.; Kourentzes, N.; Desmet, B. Tactical sales forecasting using a very large set of macroeconomic indicators. Eur. J. Oper. Res. 2018, 264, 558–569. [Google Scholar] [CrossRef]
- Verstraete, G.; Aghezzaf, E.-H.; Desmet, B. A leading macroeconomic indicators’ based framework to automatically generate tactical sales forecasts. Comput. Ind. Eng. 2020, 139, 106169. [Google Scholar] [CrossRef]
- Wang, C.-H.; Gu, Y.-W. Sales Forecasting, Market Analysis, and Performance Assessment for US Retail Firms: A Business Analytics Perspective. Appl. Sci. 2022, 12, 8480. [Google Scholar] [CrossRef]
| Disclaimer/Publisher’s Note: The statements, opinions and data contained in all publications are solely those of the individual author(s) and contributor(s) and not of MDPI and/or the editor(s). MDPI and/or the editor(s) disclaim responsibility for any injury to people or property resulting from any ideas, methods, instructions or products referred to in the content. |
© 2025 by the authors. Licensee MDPI, Basel, Switzerland. This article is an open access article distributed under the terms and conditions of the Creative Commons Attribution (CC BY) license (https://creativecommons.org/licenses/by/4.0/).

