
The Effect of Housing Environment on Egg Production, USDA Egg Size, and USDA Grade Distribution of Commercial White Egg Layers


Abstract
1. Introduction
2. Materials and Methods
3. Results
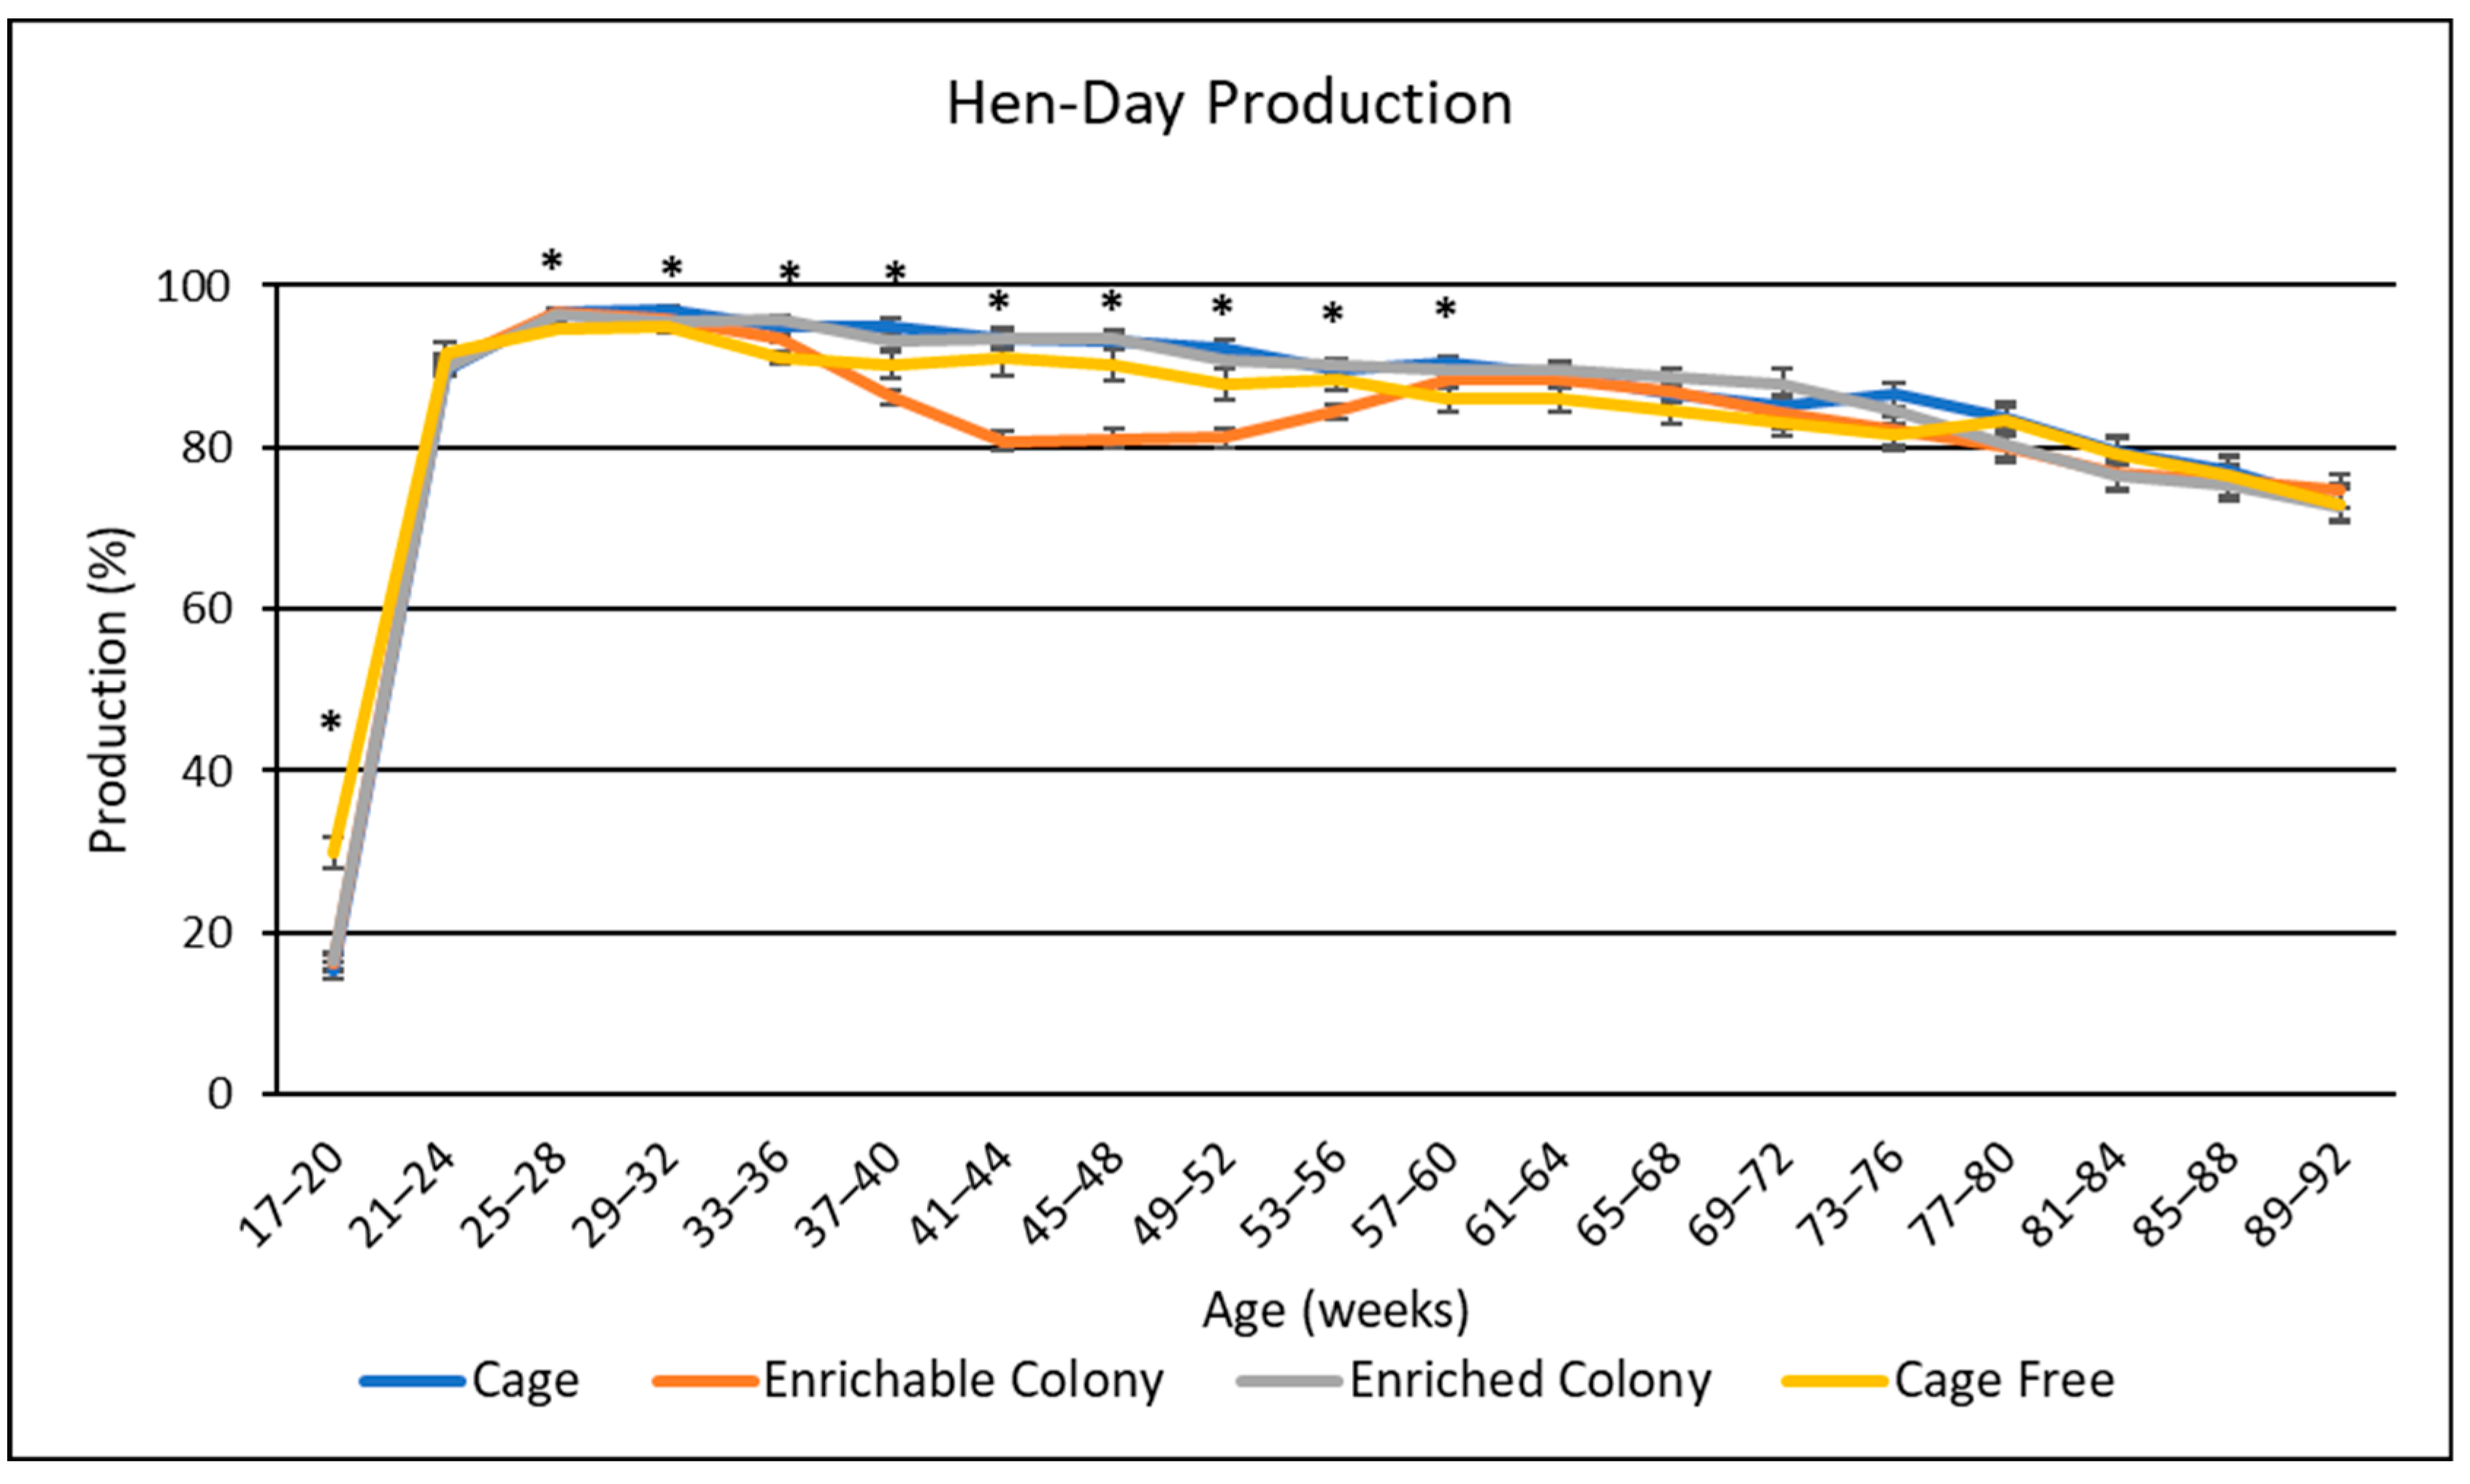
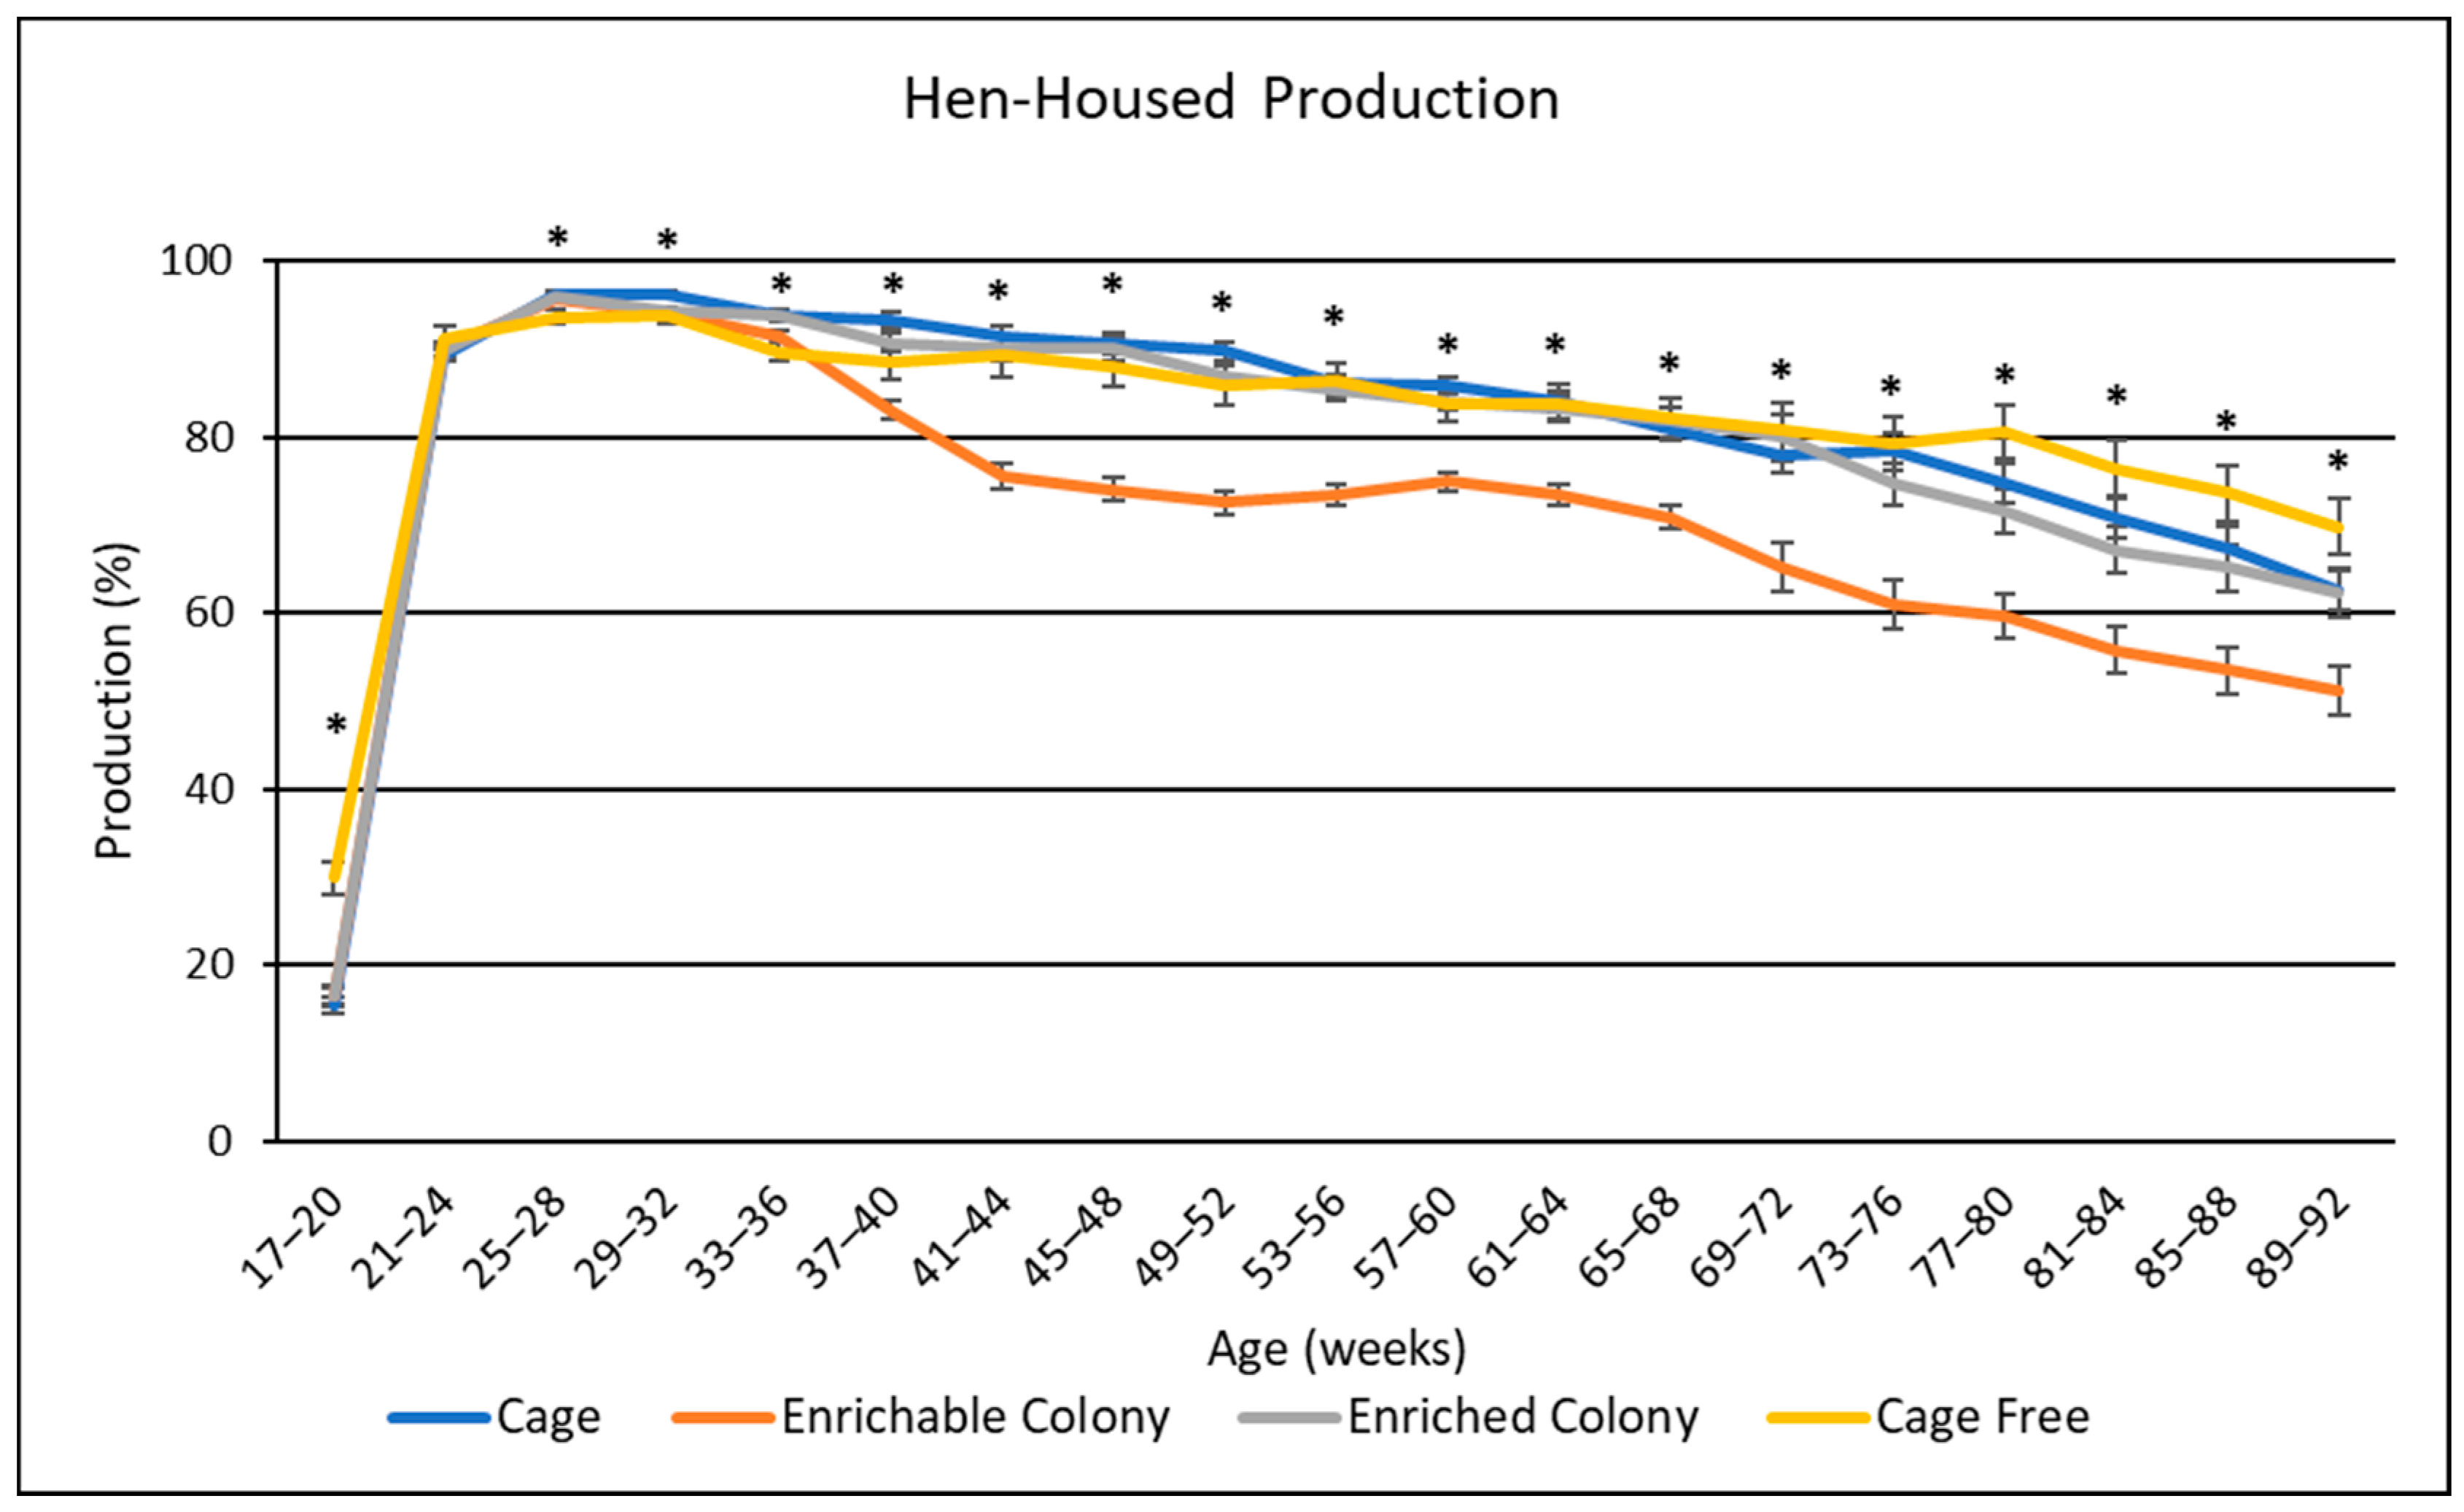
3.1. Egg Production
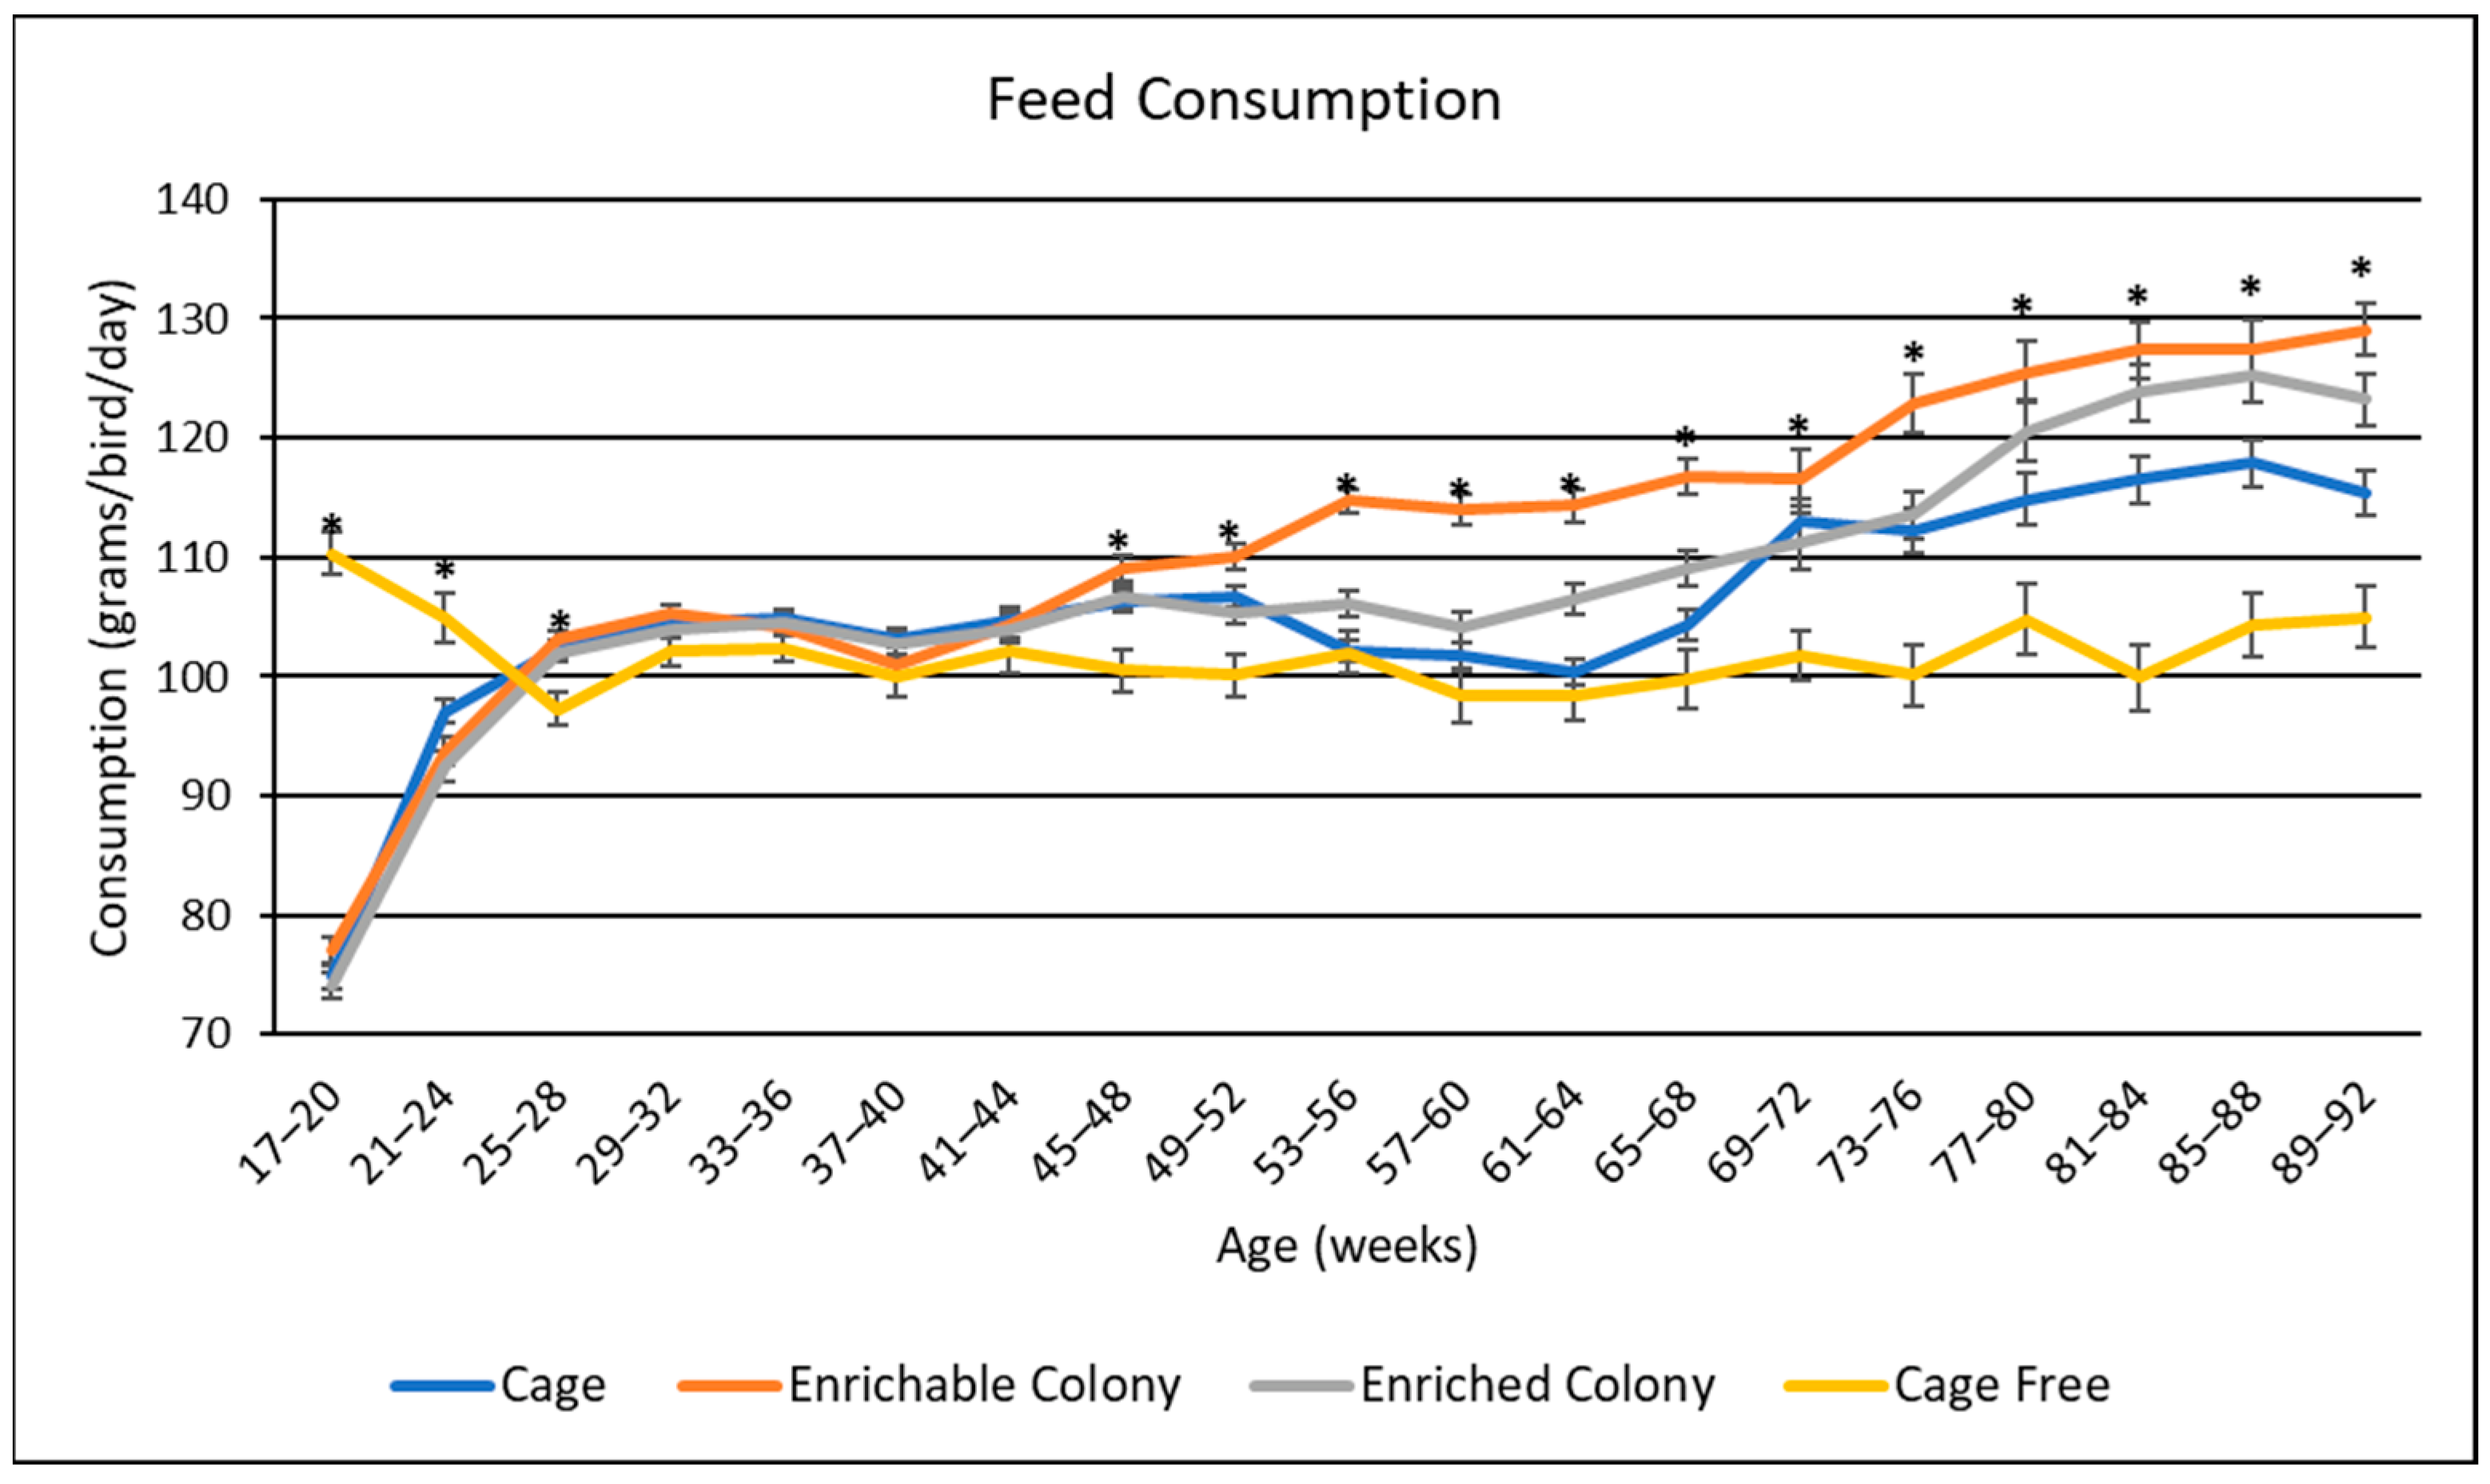
3.2. Feed Consumption
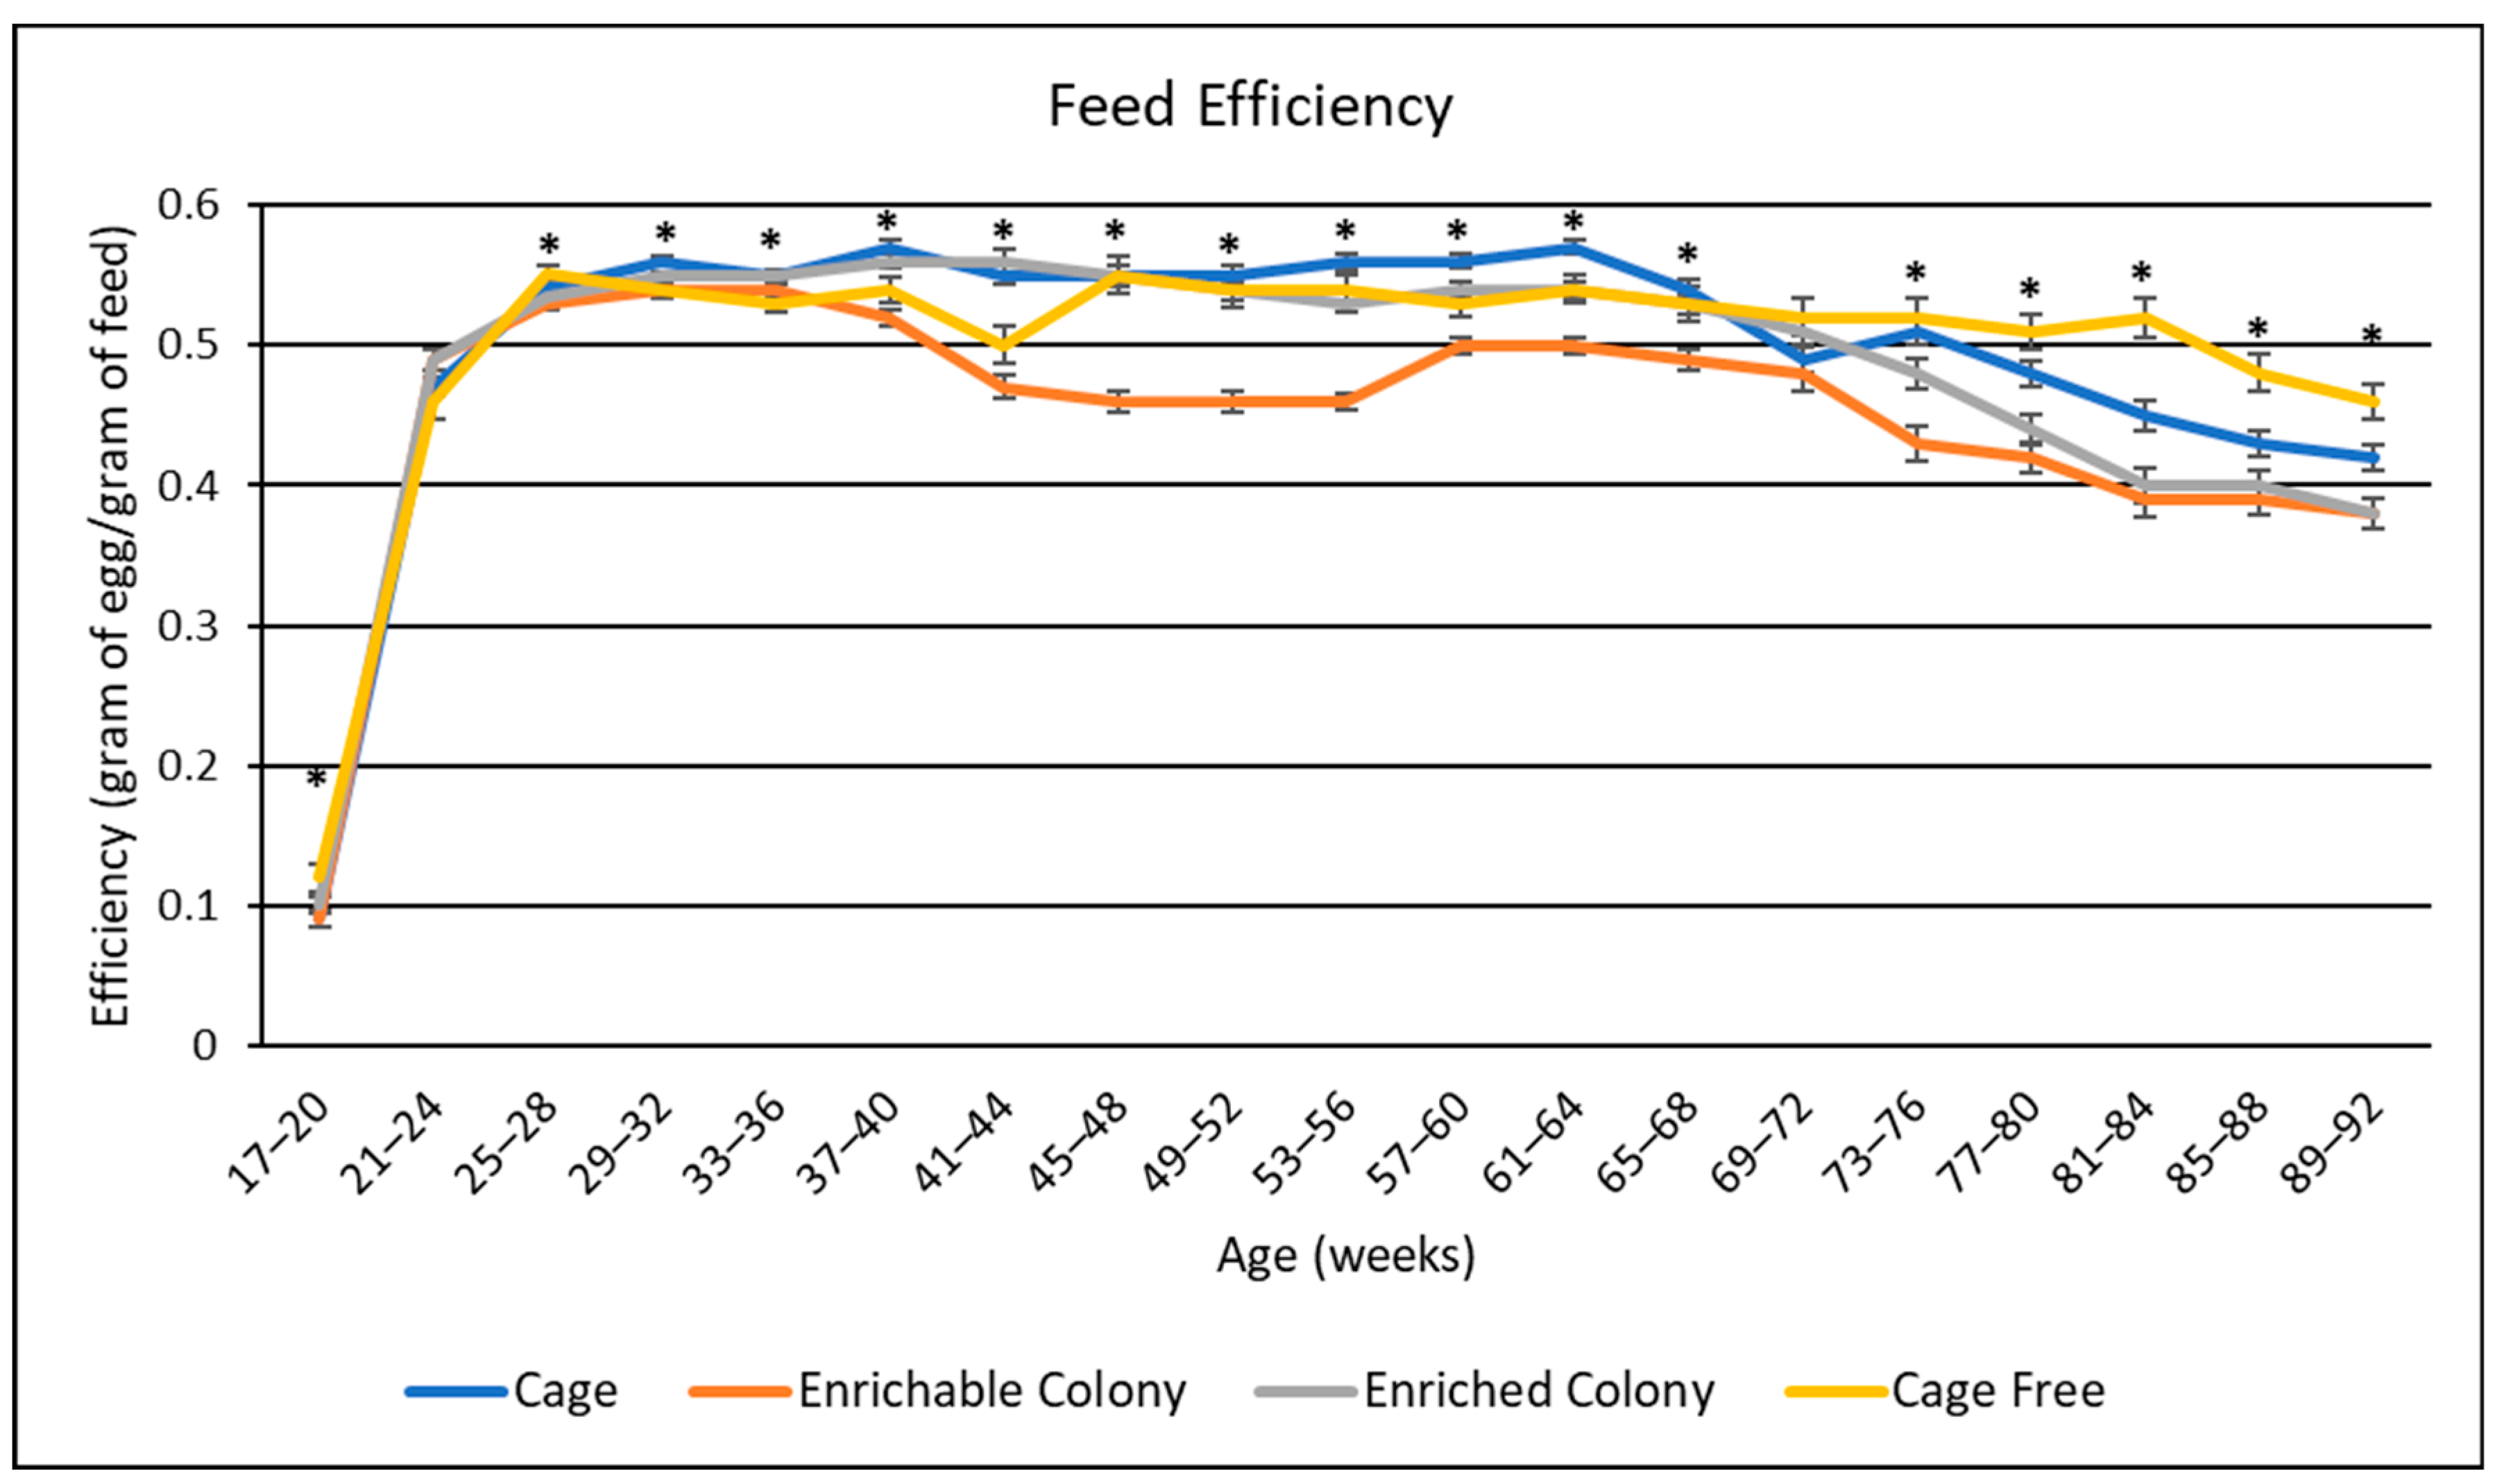
3.3. Feed Efficiency
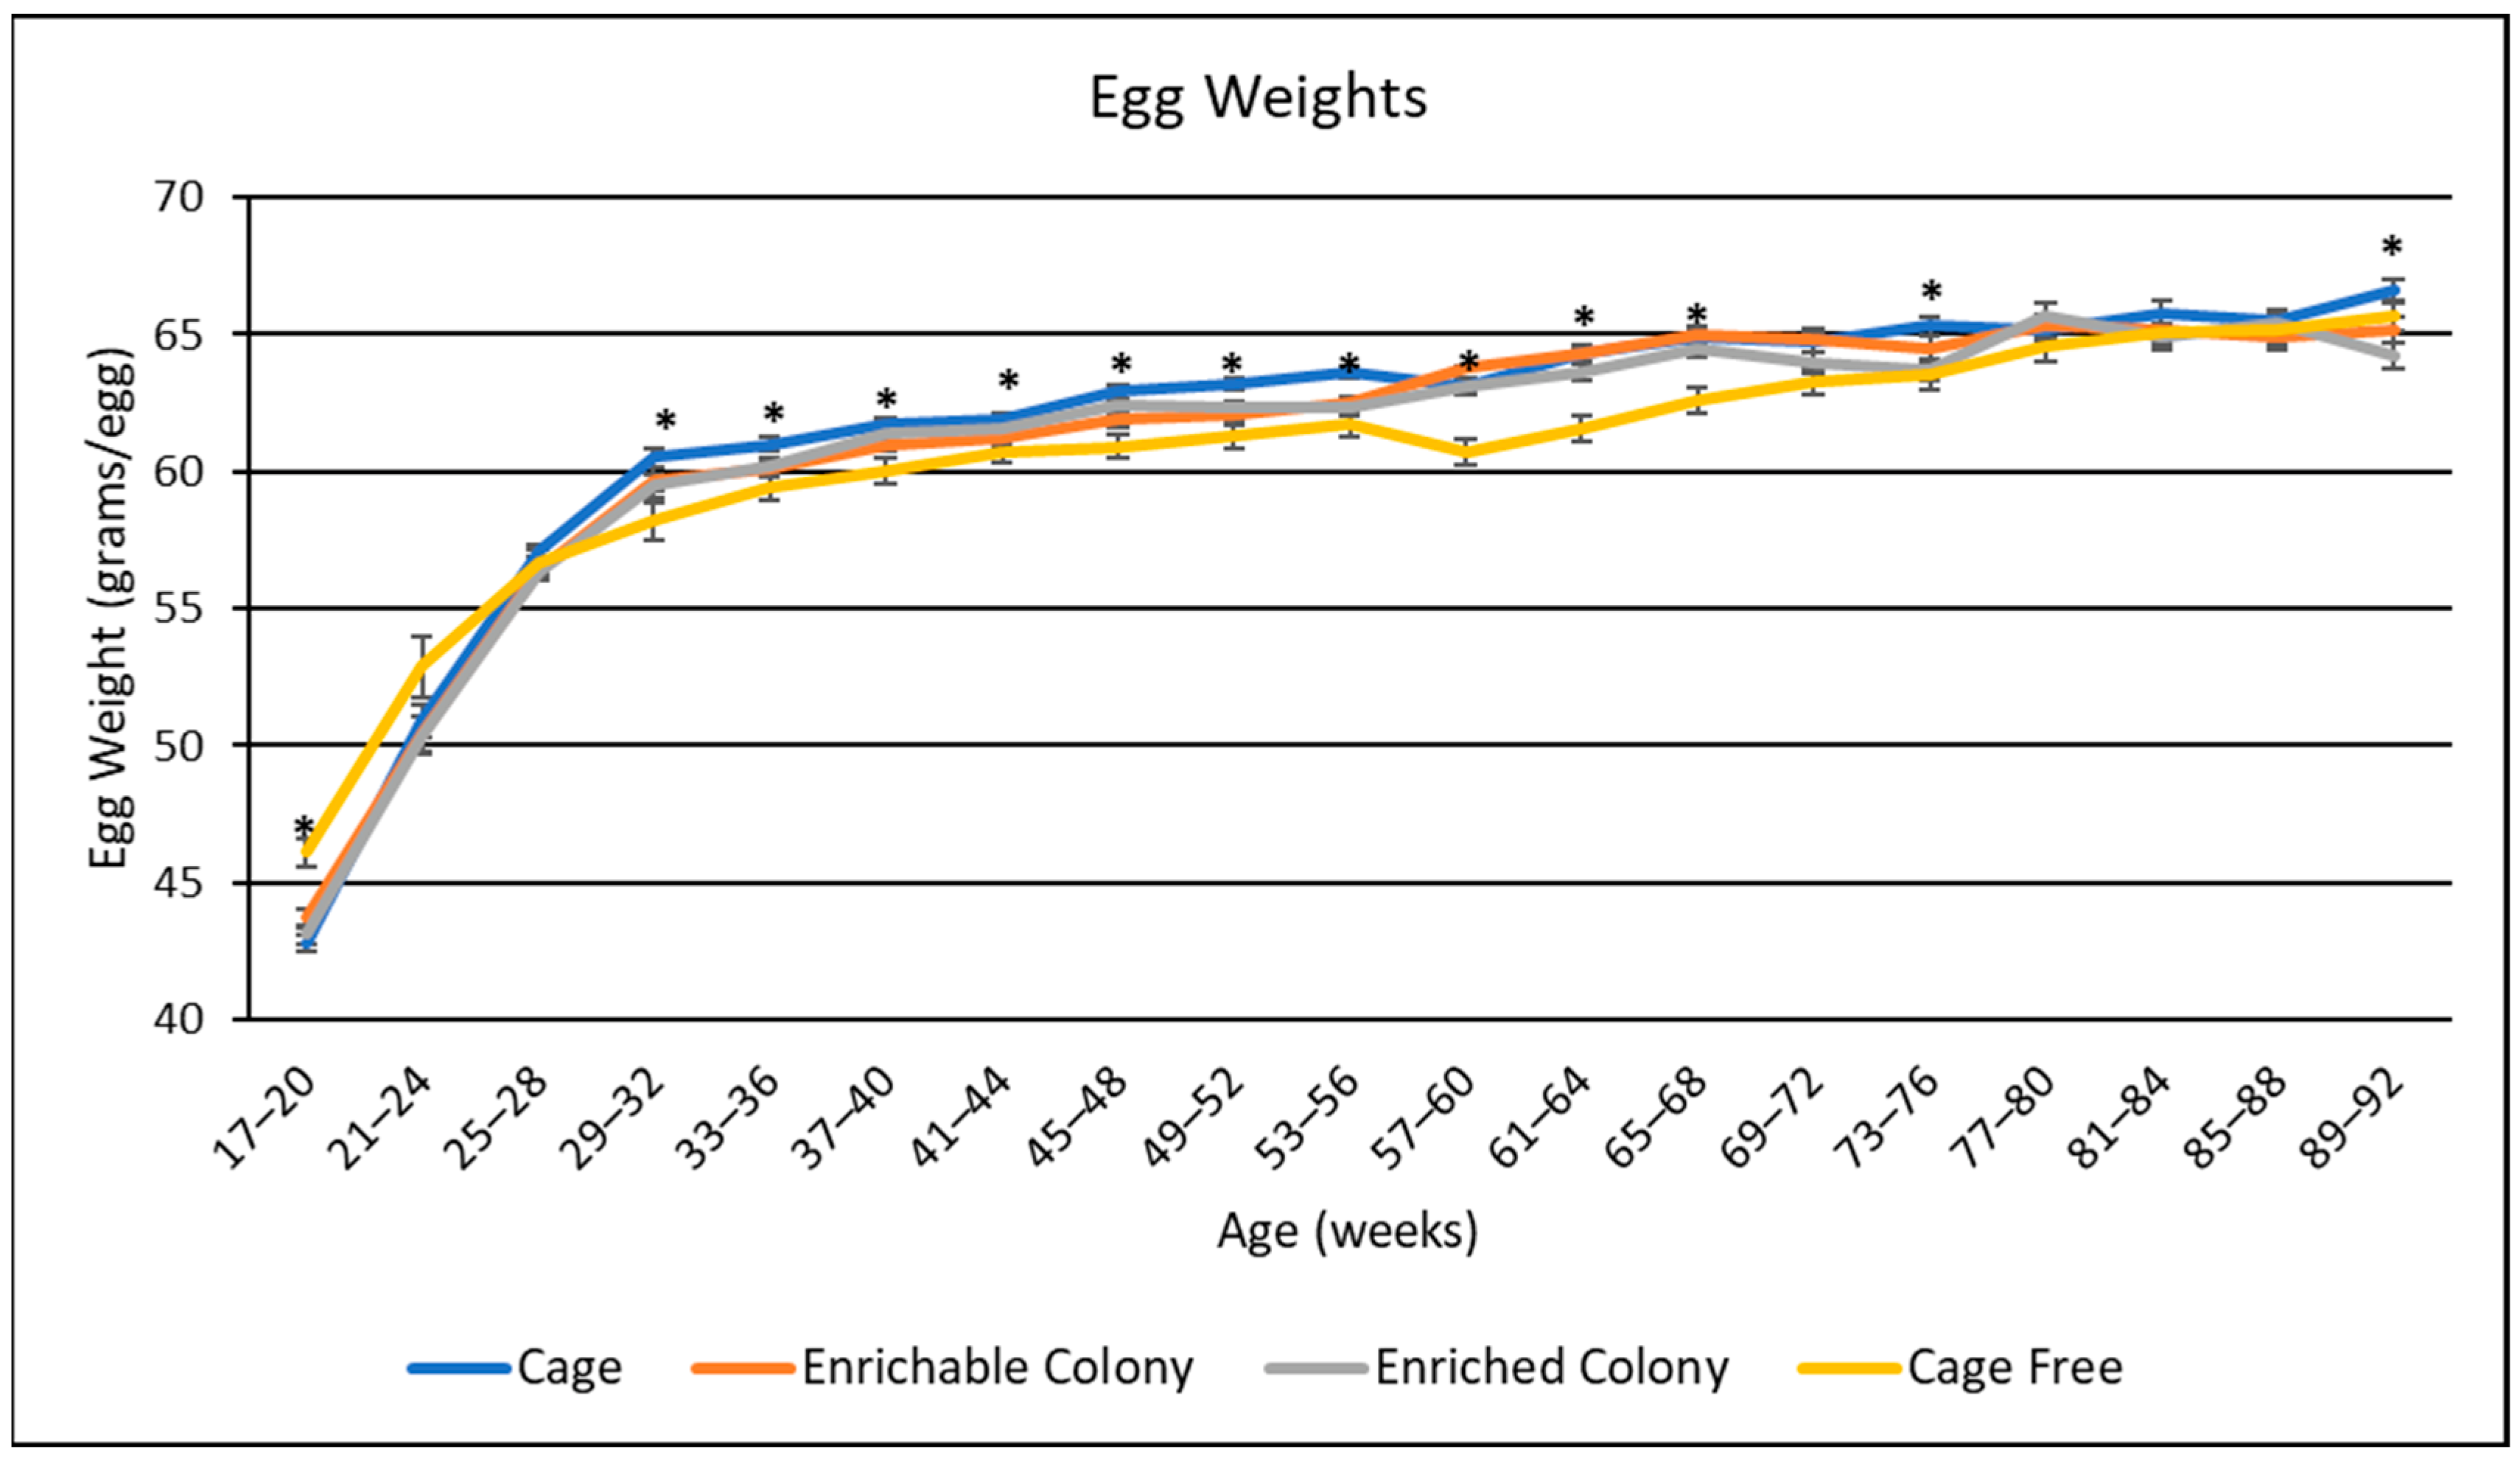
3.4. Egg Weights
3.5. Body Weight
3.6. Mortality
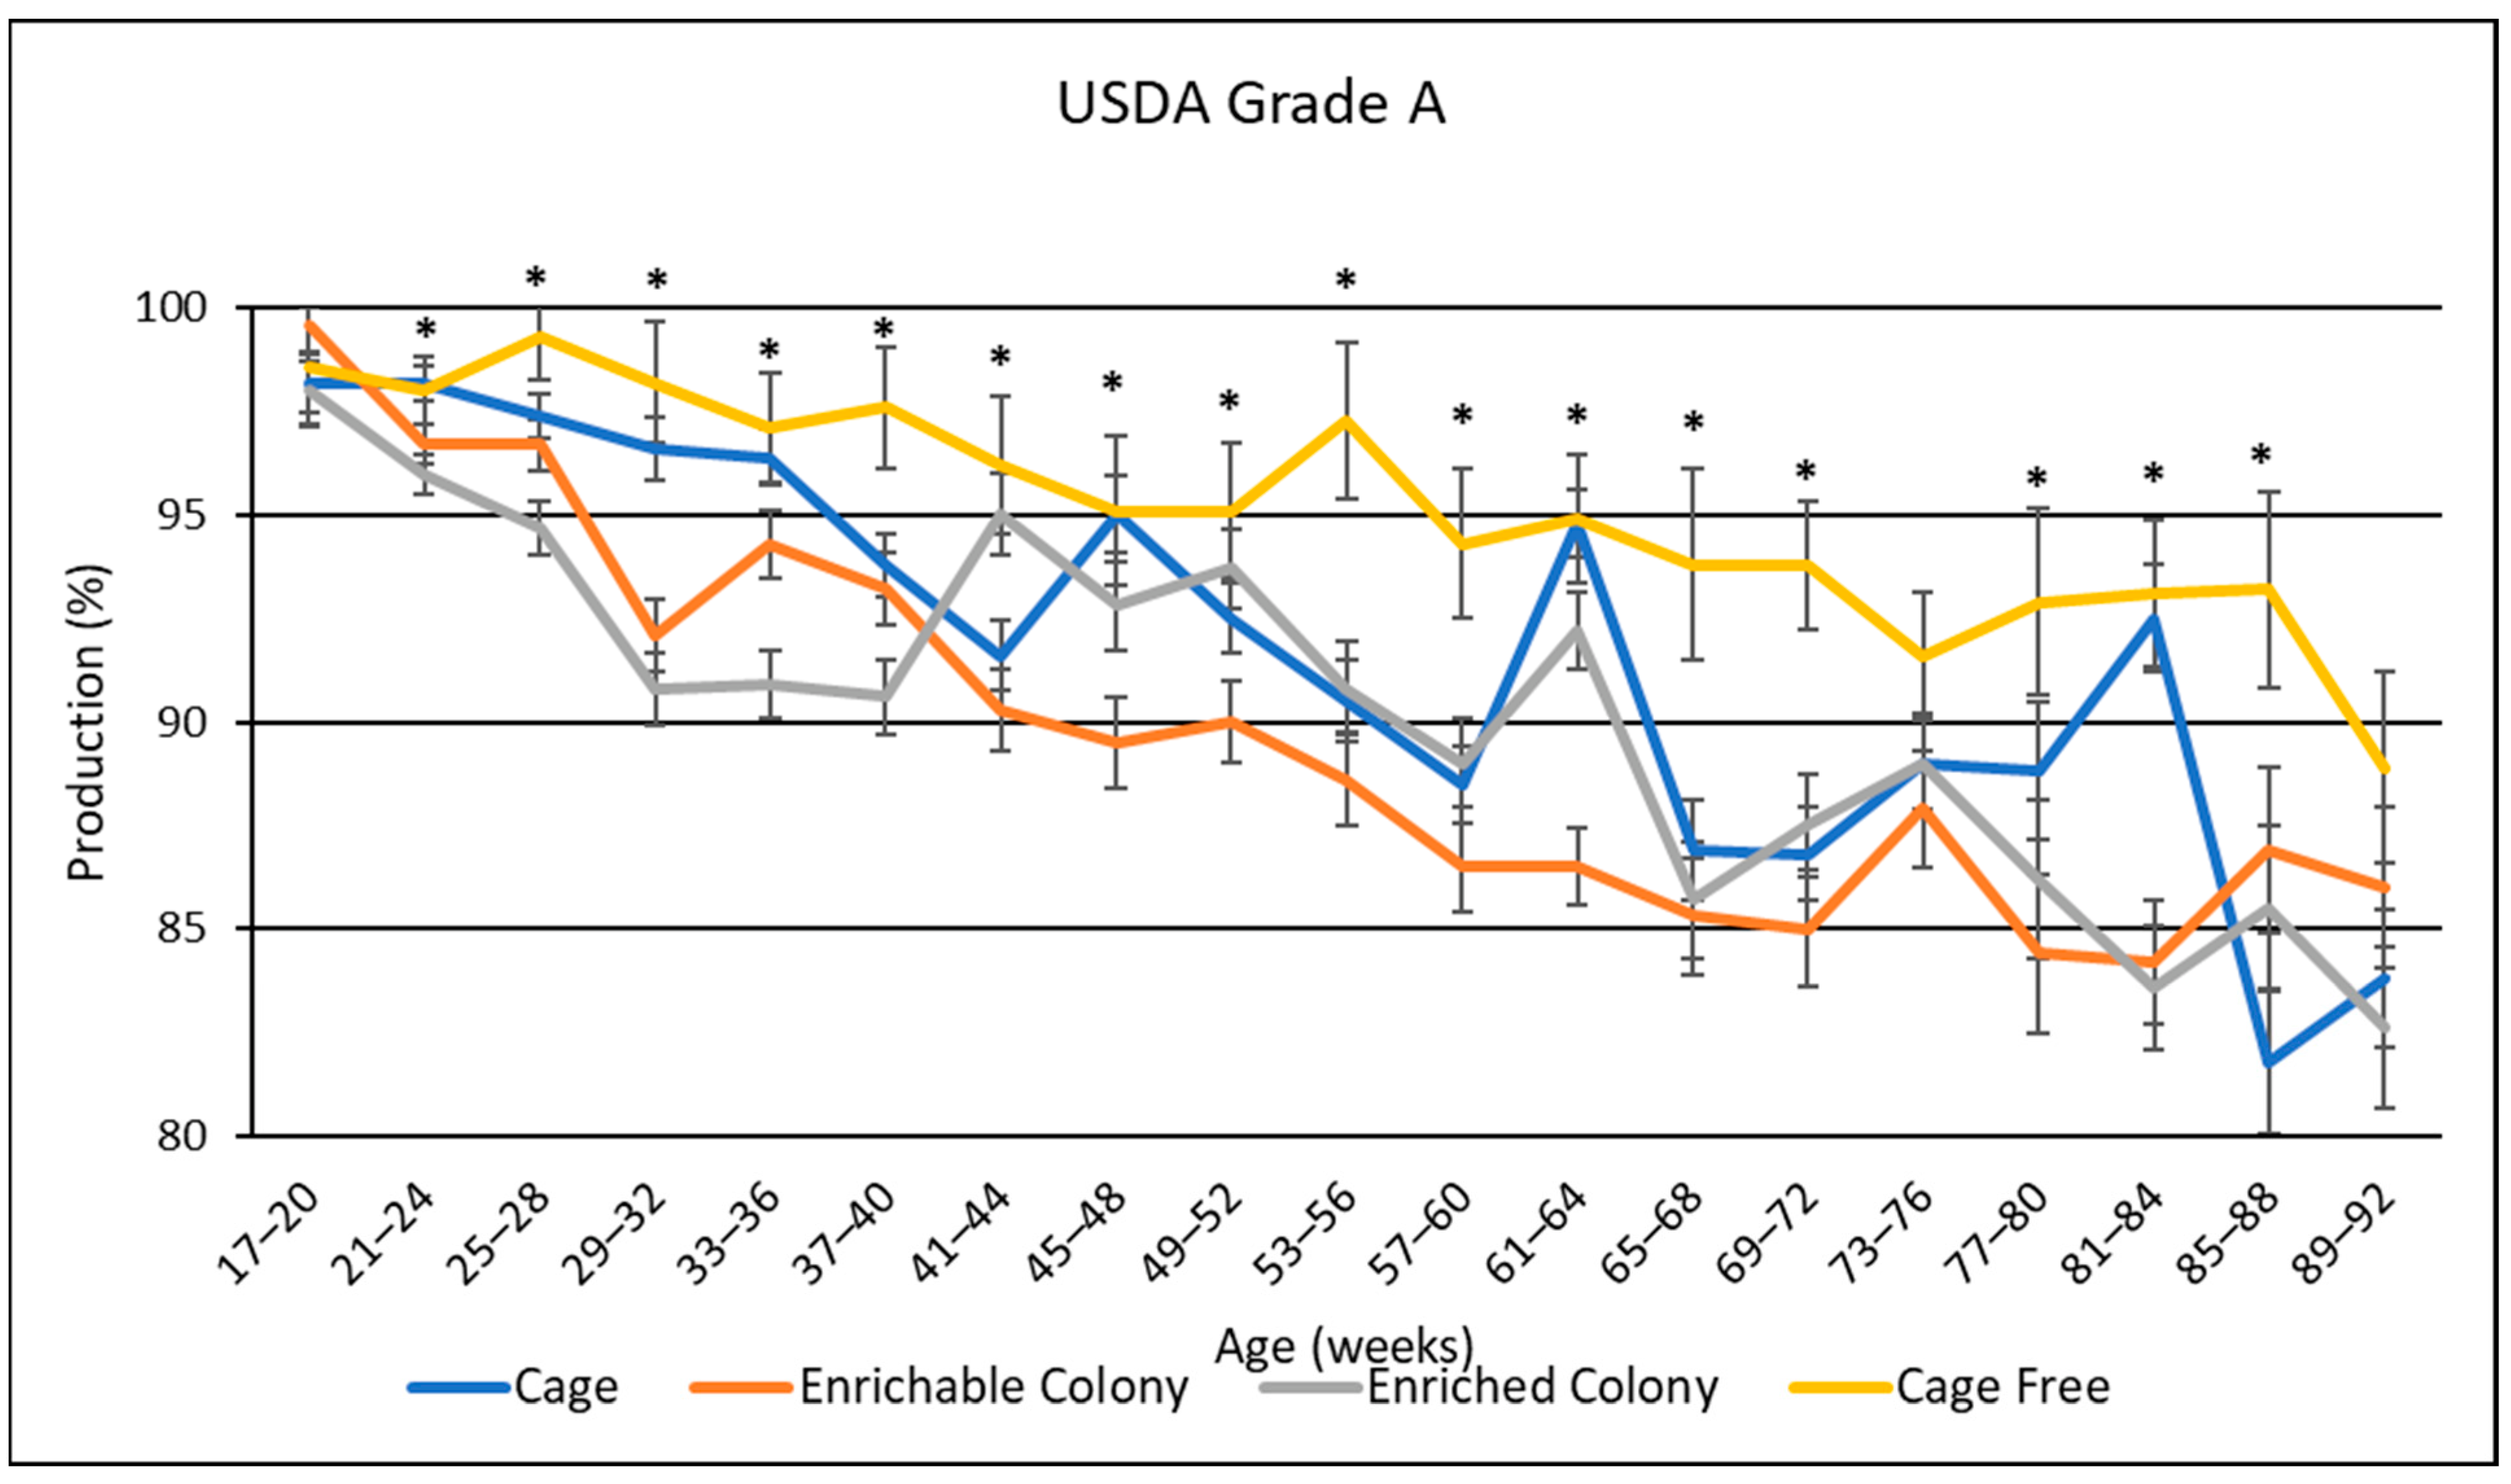
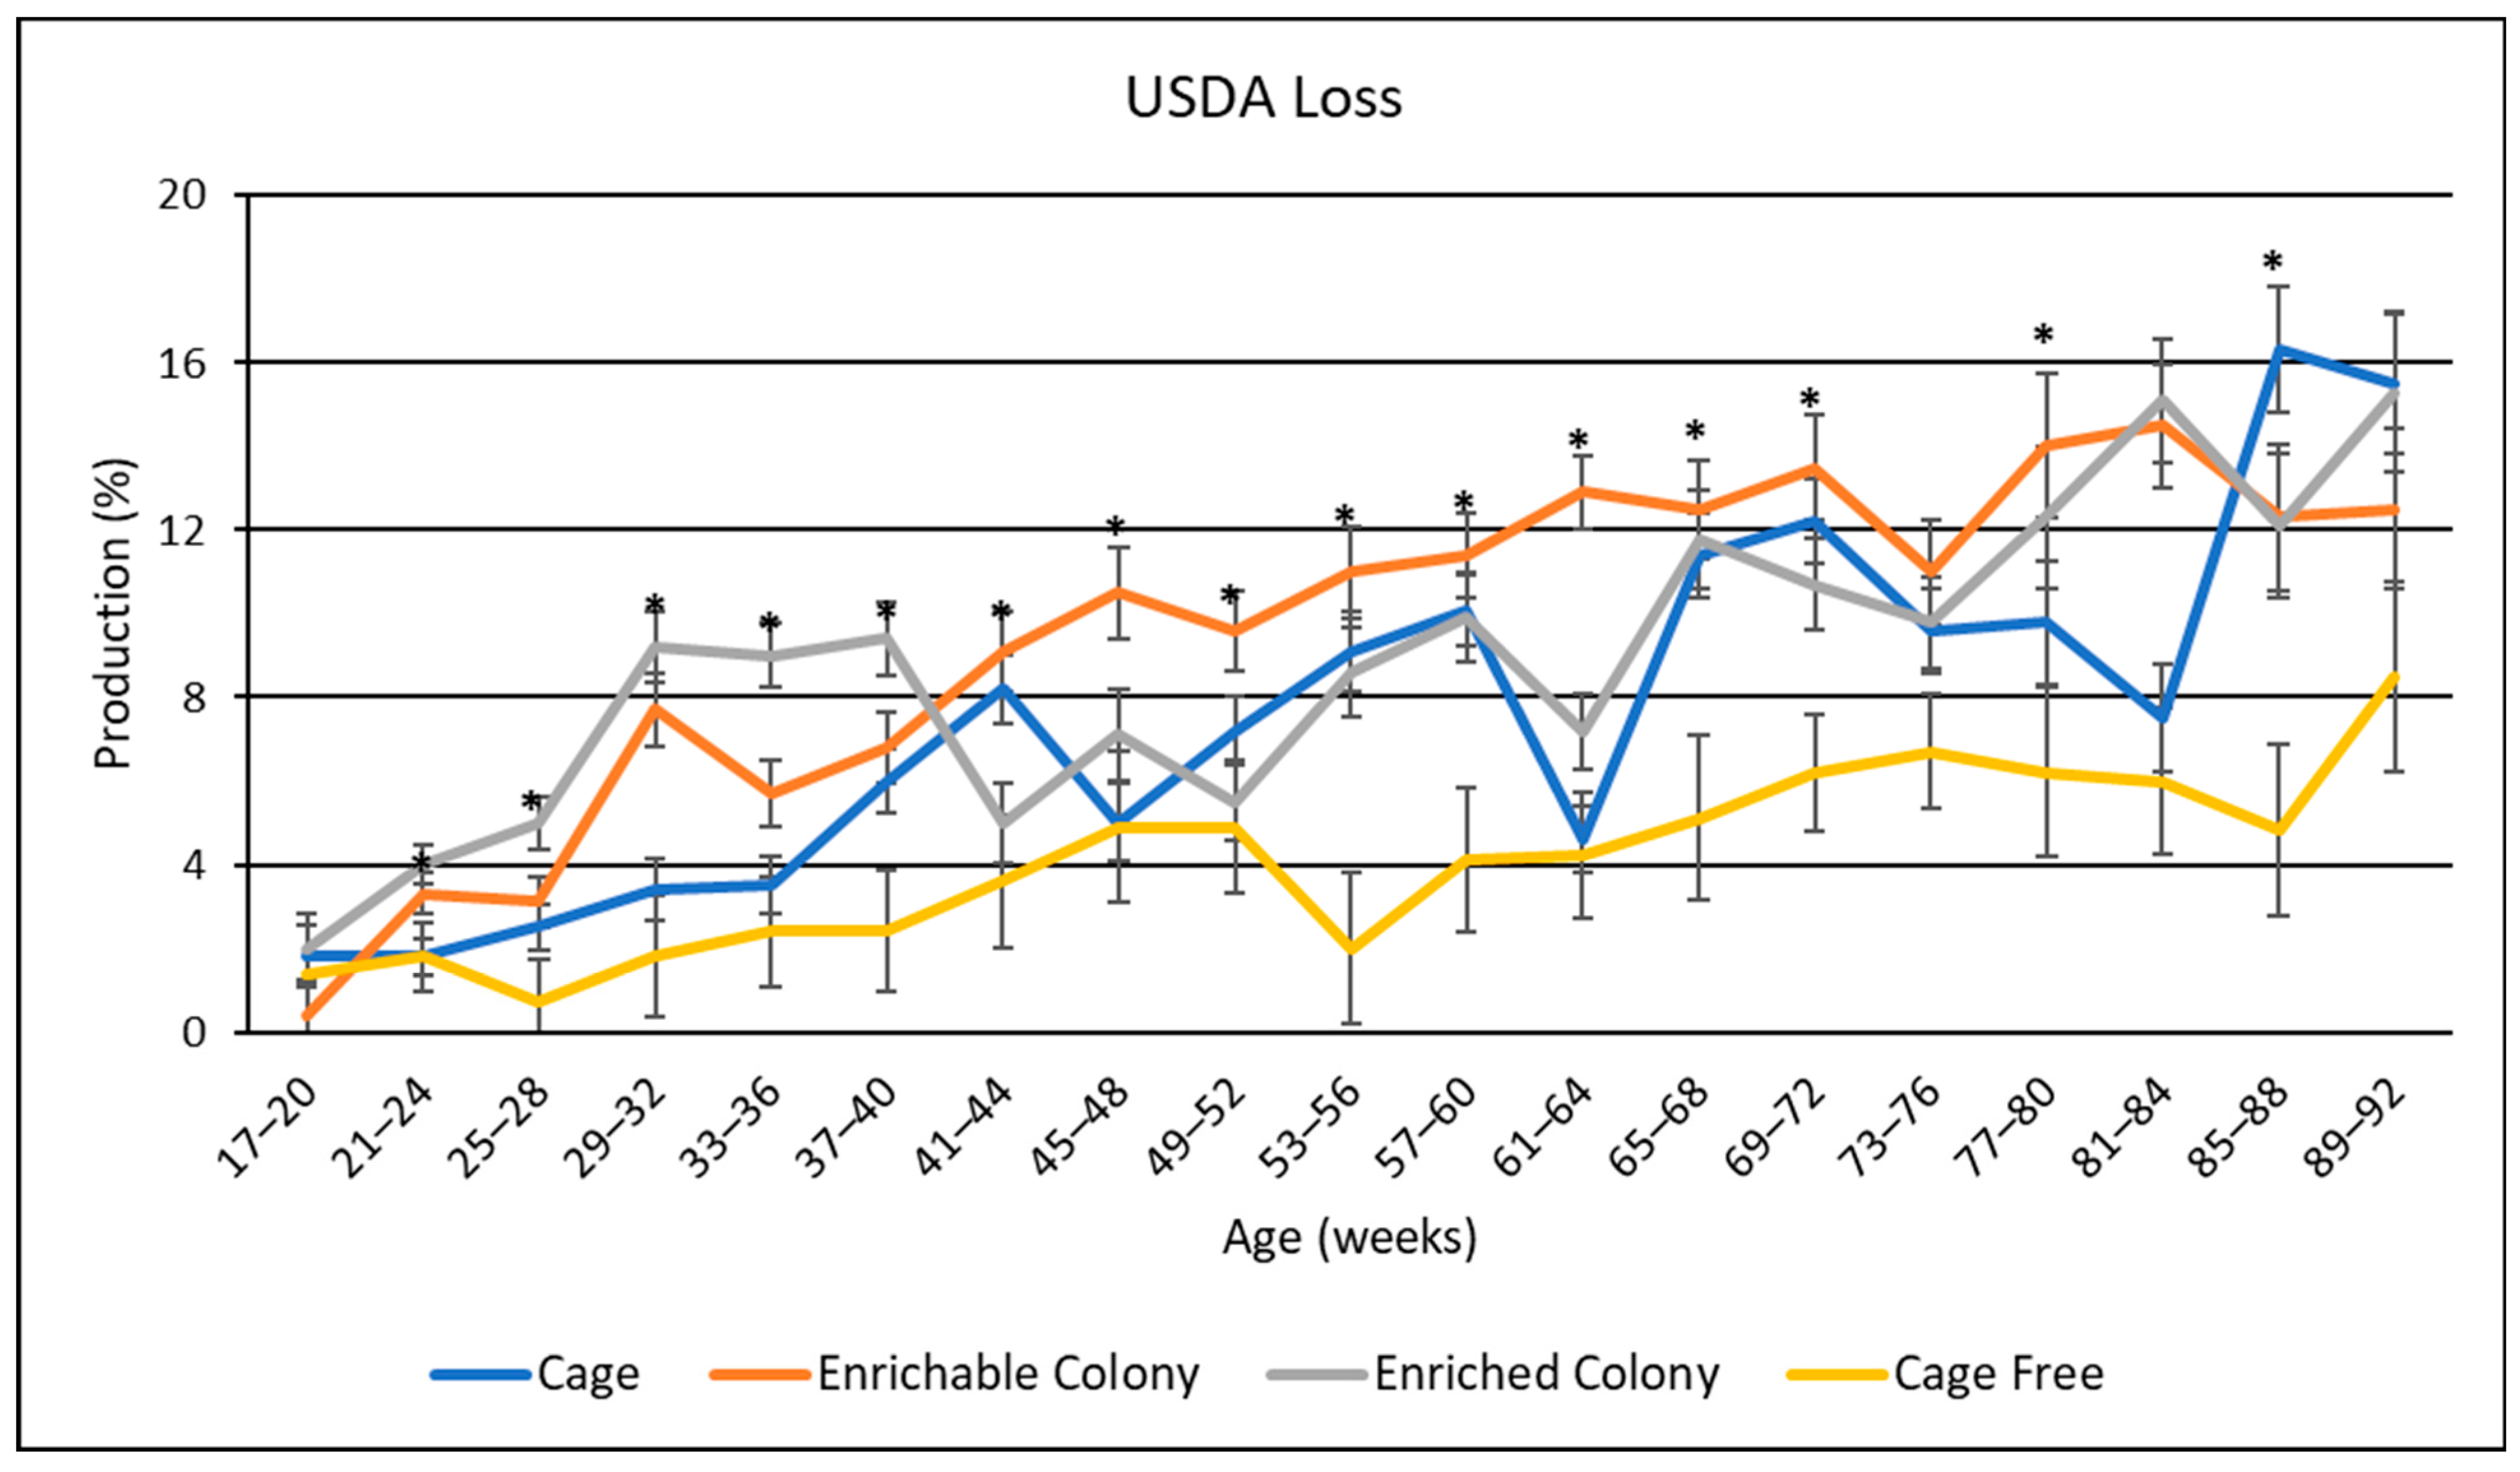
3.7. USDA Egg Grades
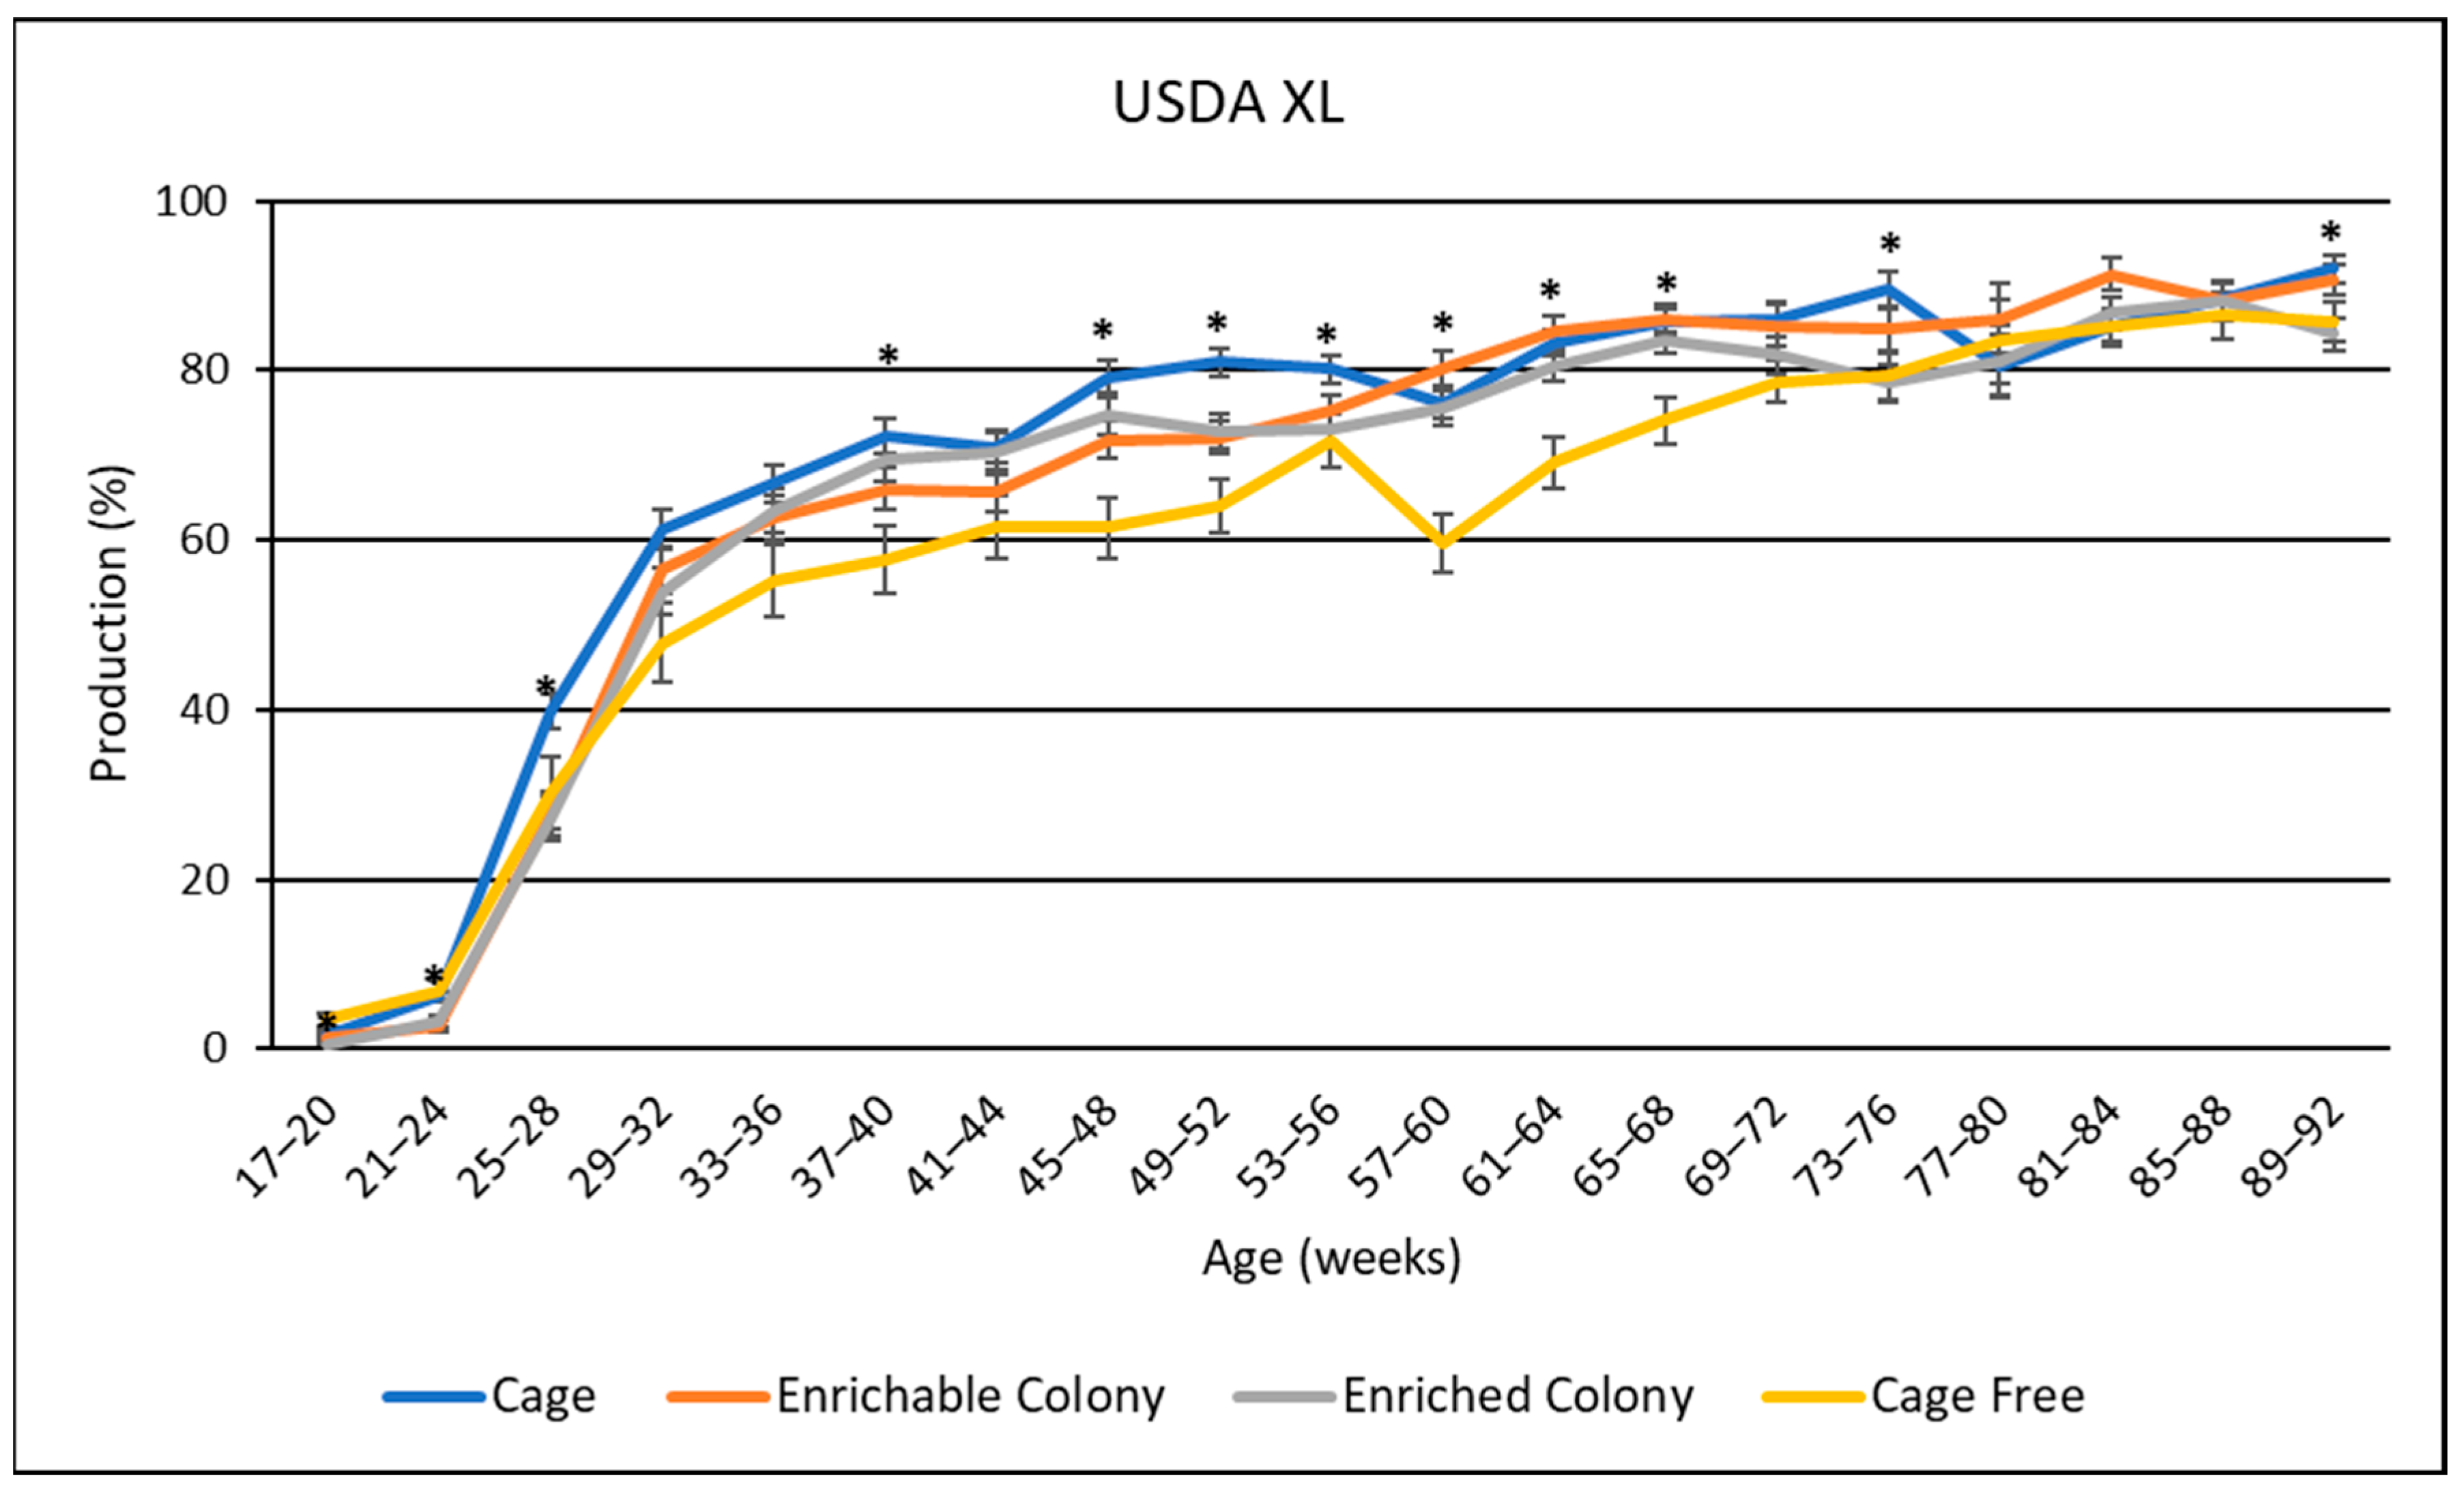
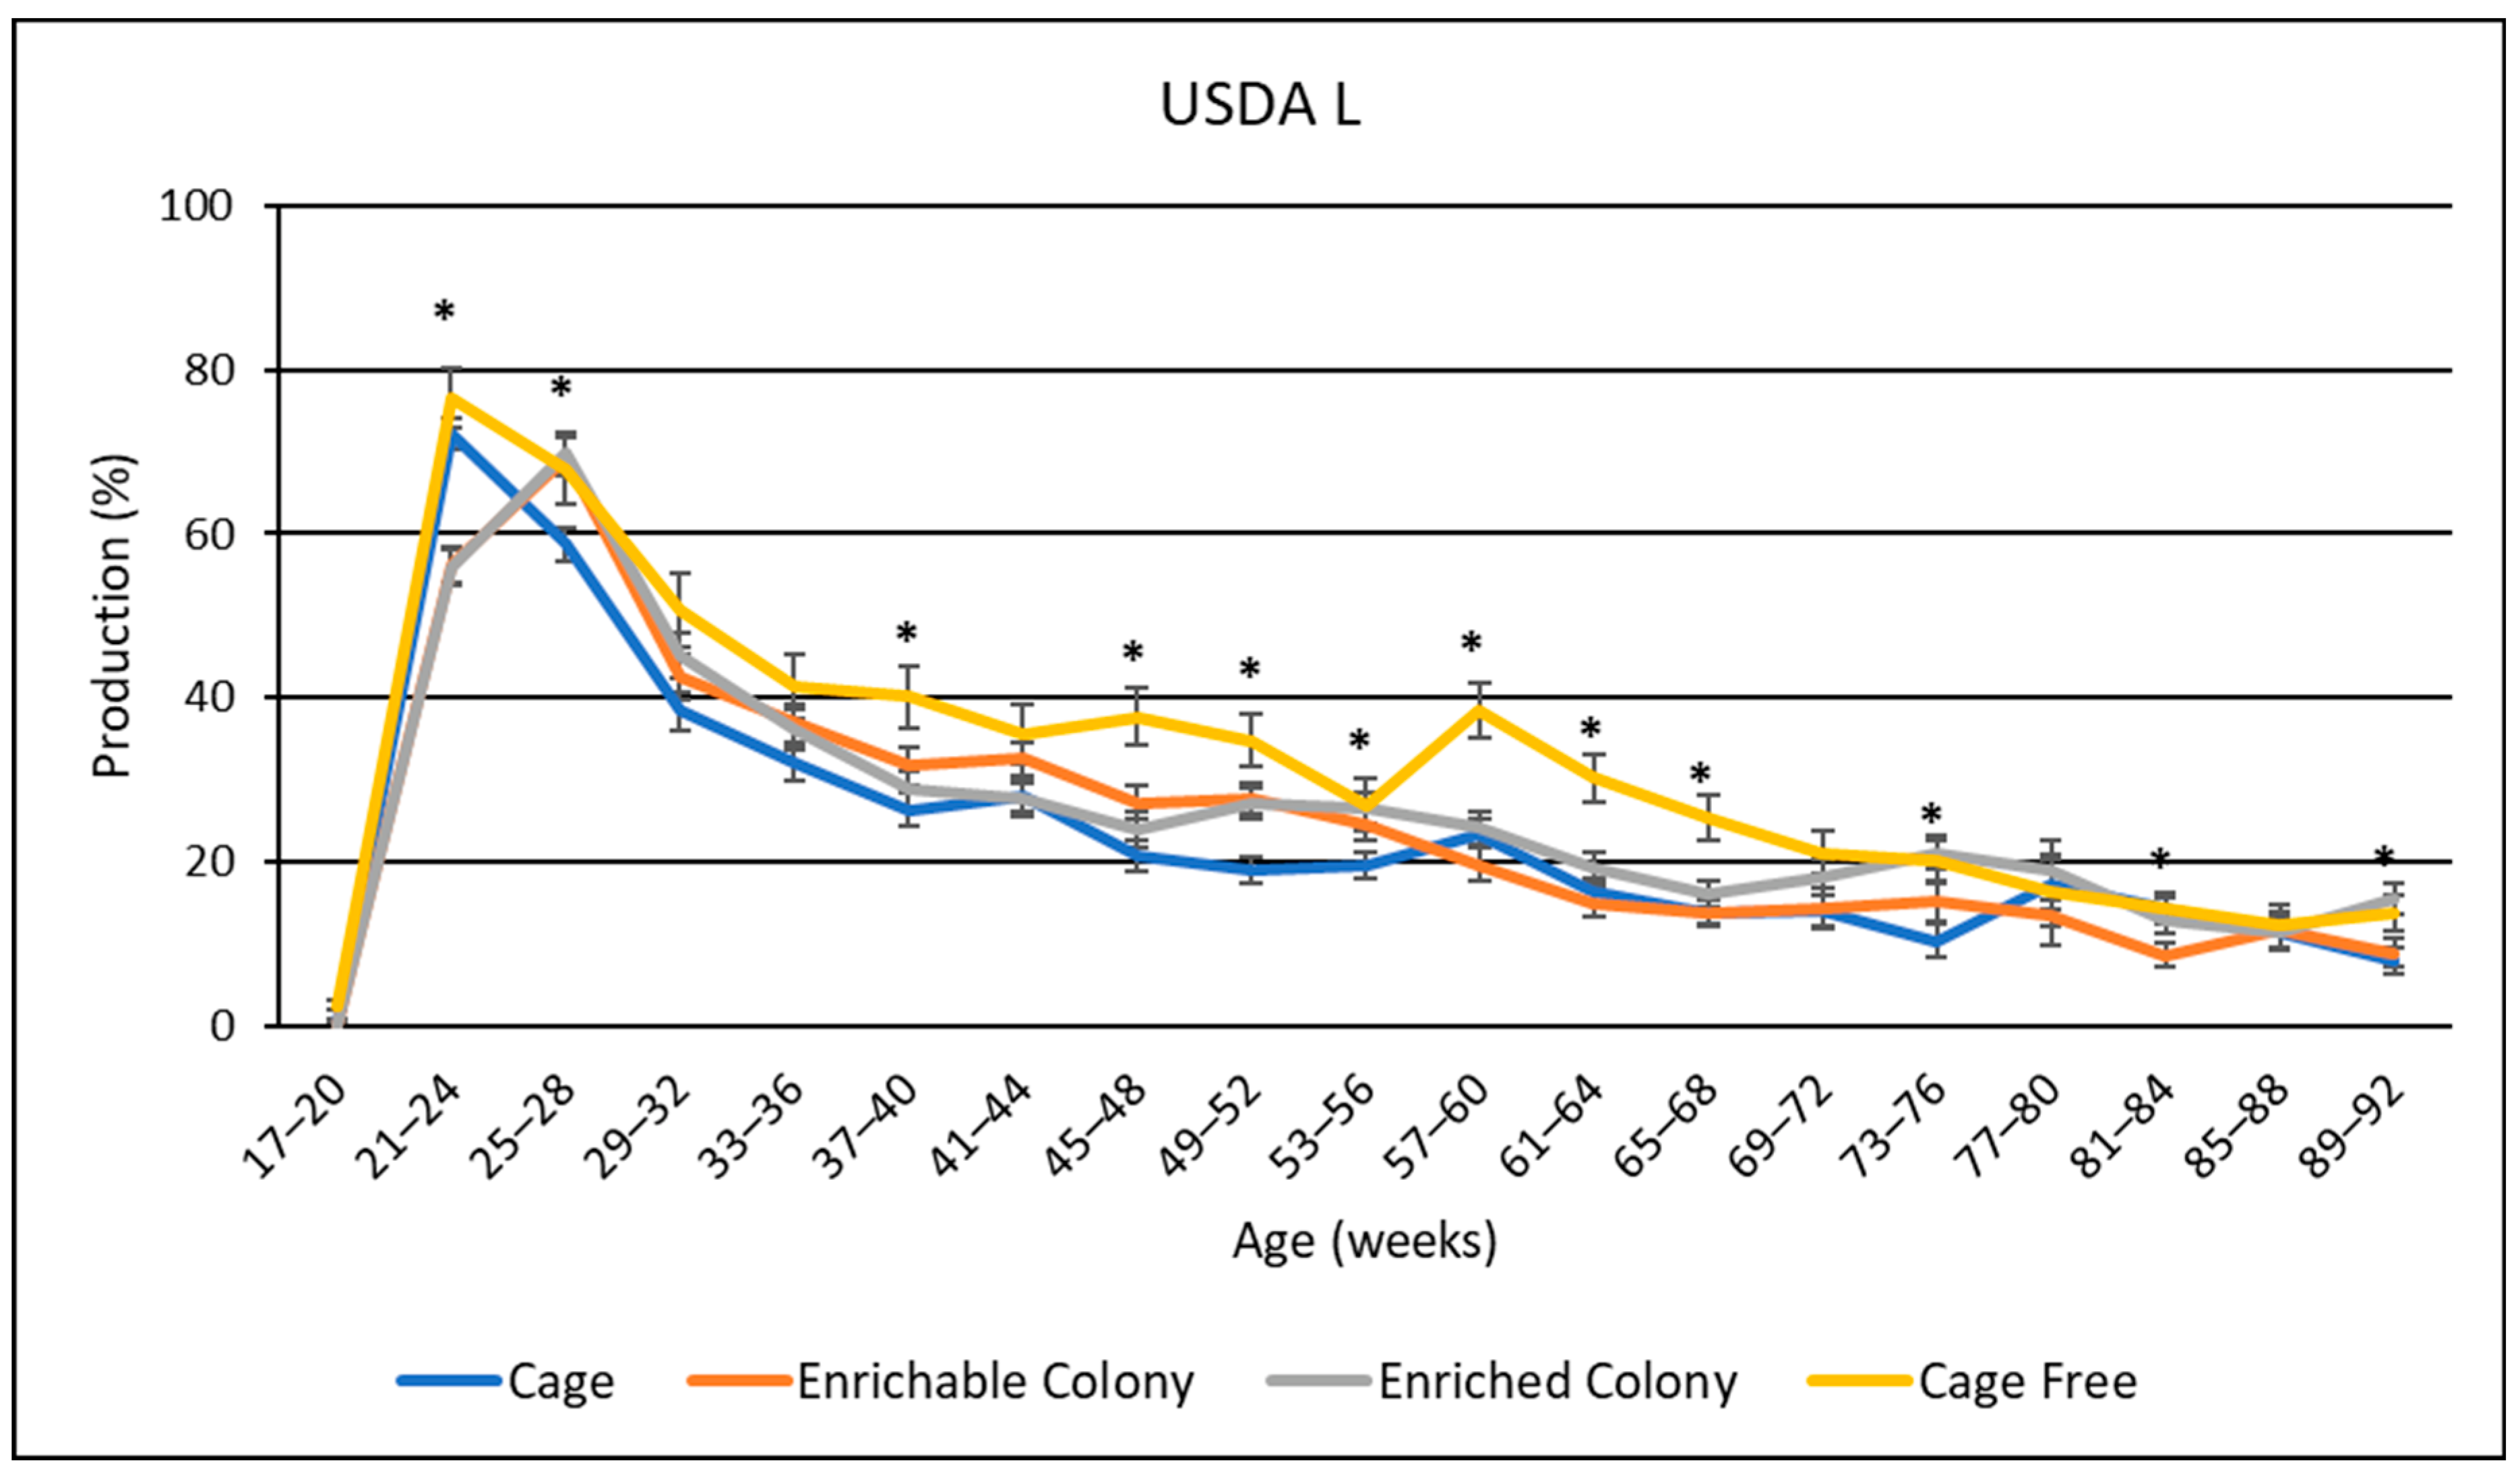
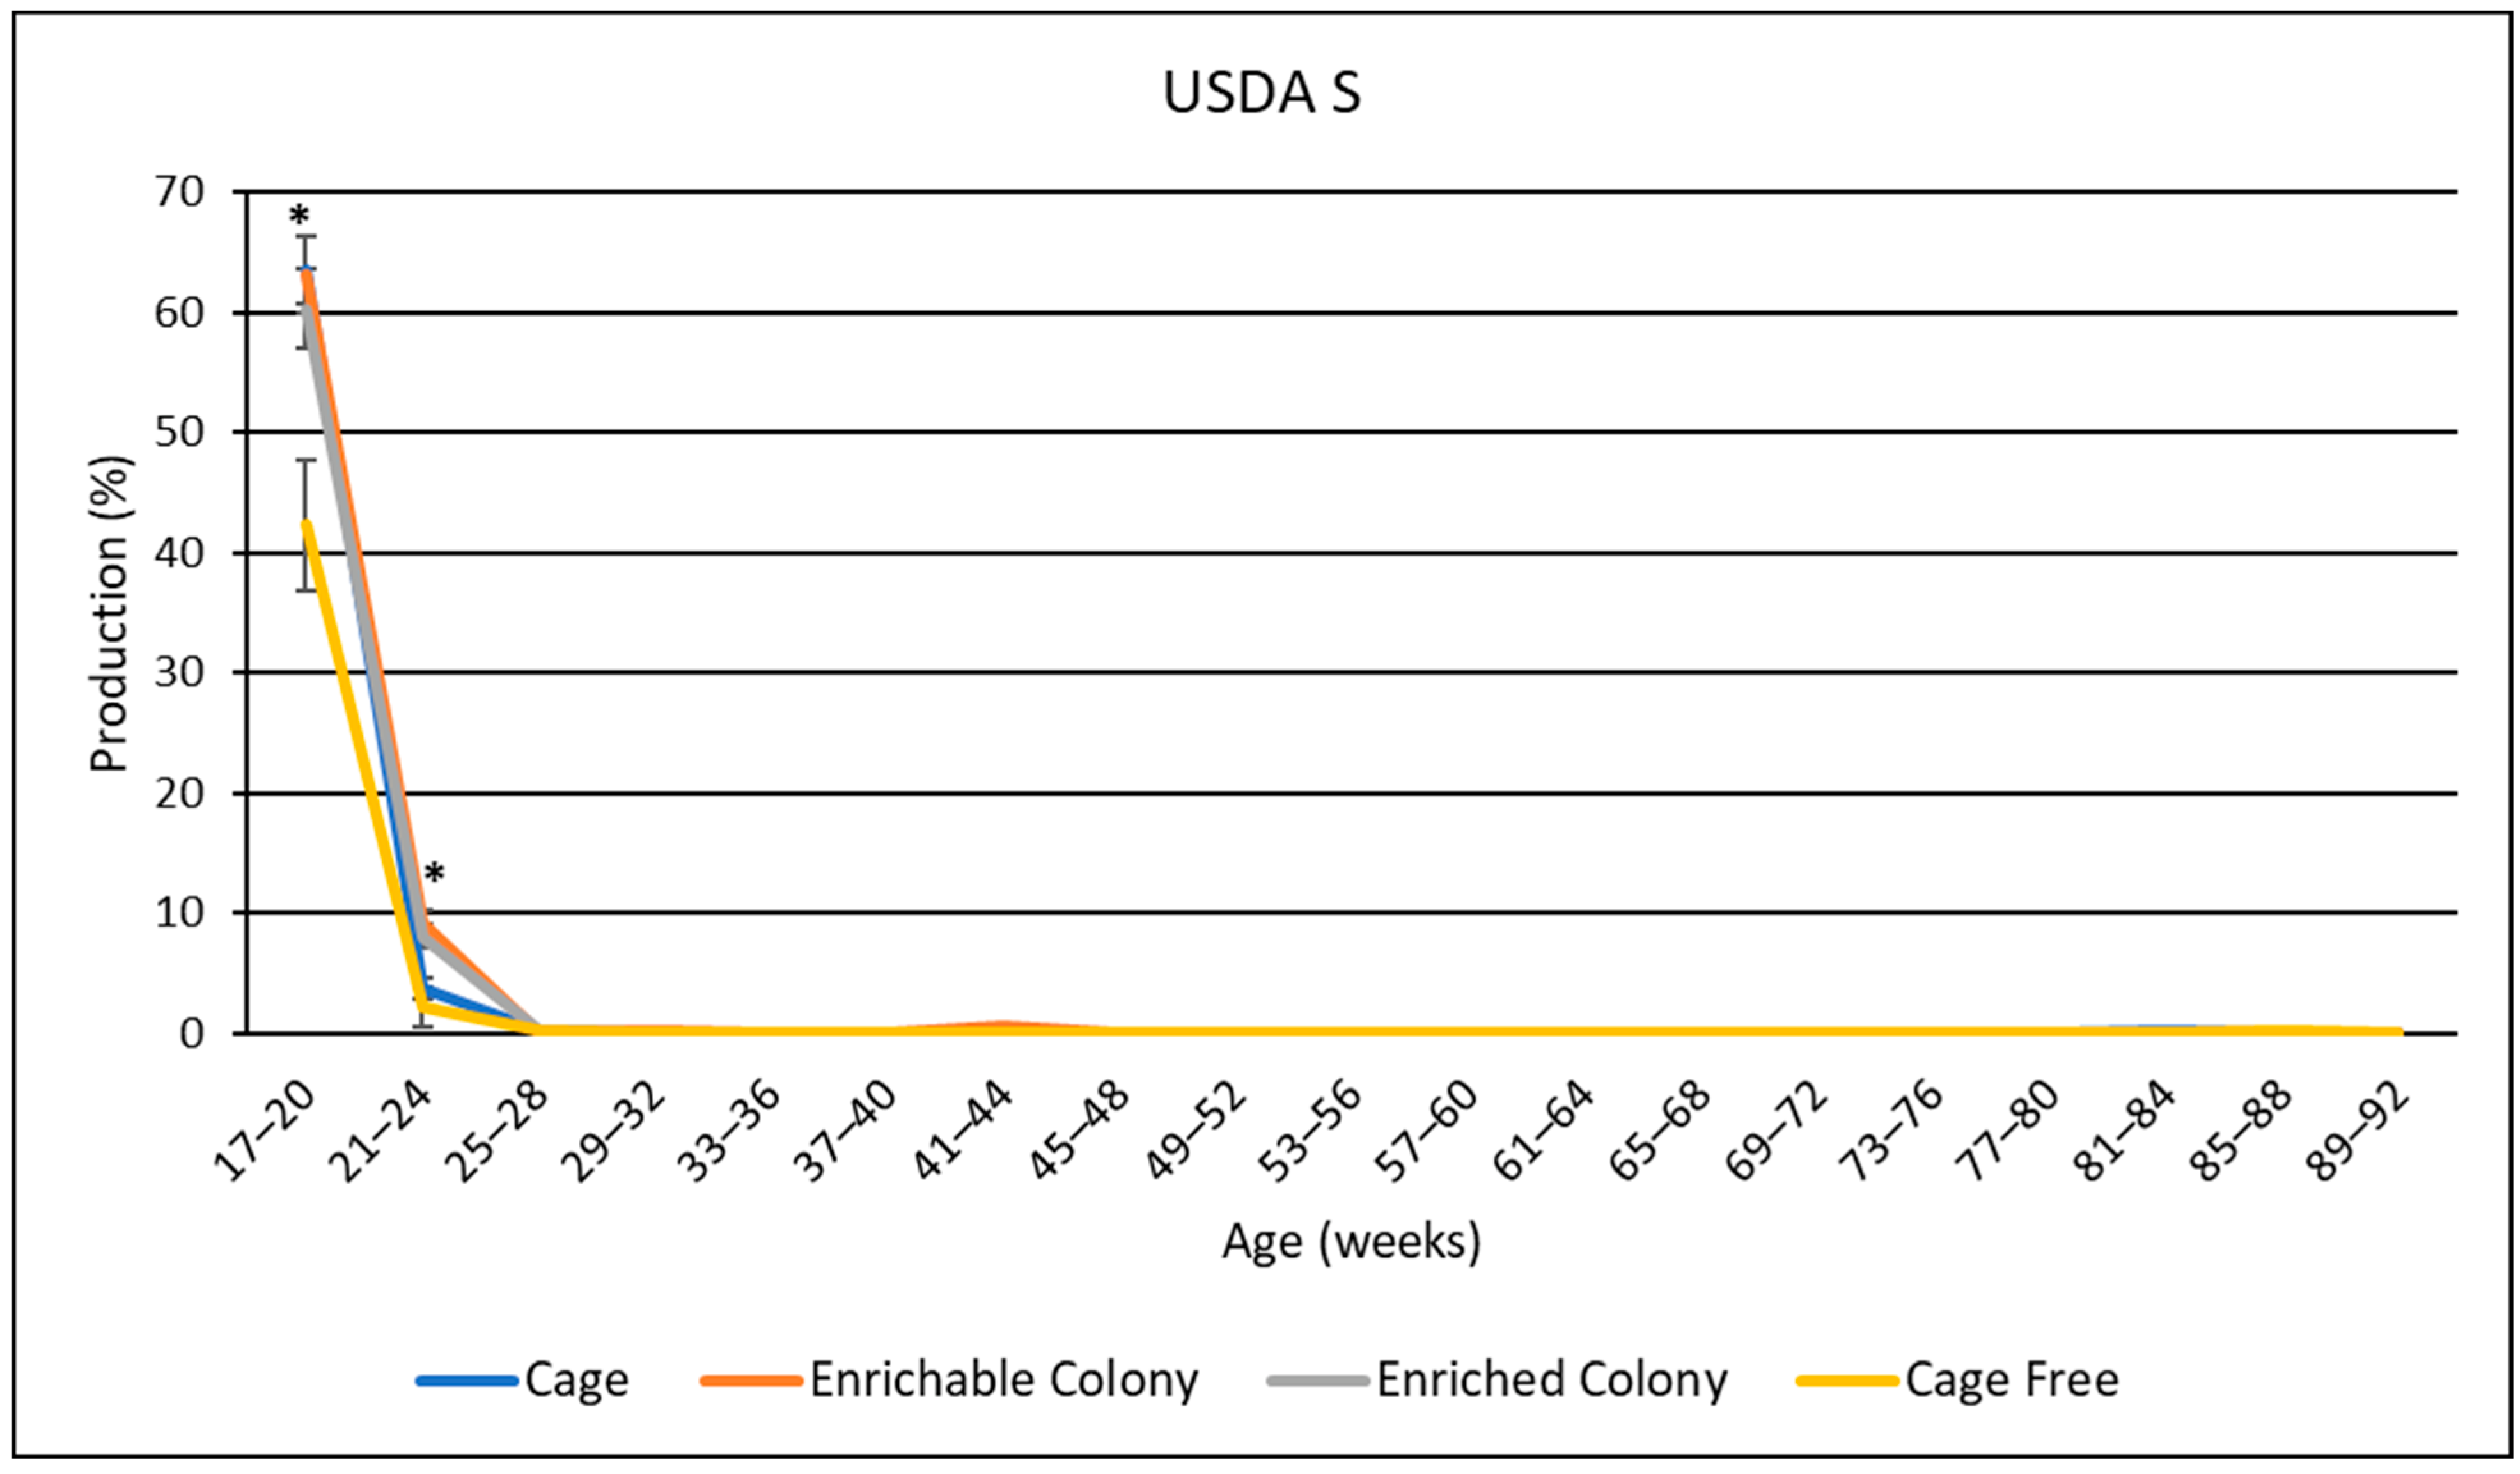
3.8. USDA Egg Size Distribution
4. Discussion
4.1. Egg Production
4.2. Feed Consumption
4.3. Egg Weight
4.4. Feed Efficiency
4.5. USDA Egg Grades
4.6. USDA Egg Sizes
4.7. Mortality
5. Conclusions
Author Contributions
Funding
Institutional Review Board Statement
Informed Consent Statement
Data Availability Statement
Acknowledgments
Conflicts of Interest
References
- Industry Data. Available online: https://www.incredibleegg.org/about-us/industry-data/ (accessed on 24 May 2022).
- USDA. Egg Markets Overview; USDA: Washington, DC, USA, 2022.
- Jargon, J.; Beilfuss, L. McDonald’s Continues Image Shift with Move to Cage-Free Eggs in North America; Fast-Food Chain Has Faced Pressure from Animal-Rights Advocates to Make Its Supply Chain More Humane. Wall Str. J. Online 2015. Available online: https://www.proquest.com/docview/1710208031/citation/57998D87B00E4F14PQ/10 (accessed on 14 April 2022).
- Bashas’, Fresh Market, Aldi Commit to Cage-Free Eggs. Supermark. News. 2016. Available online: https://www.proquest.com/docview/1775310721/abstract/86FC956A2A554A16PQ/1 (accessed on 9 May 2022).
- Gallagher, J. General Mills to Use Cage-Free Eggs. Supermark. News. 2011, 59, 38. [Google Scholar]
- Thurlow, E. Convenience Stores Going Cage-Free for Eggs. Cent. Penn Bus. J. 2018. Available online: https://www.proquest.com/docview/2060133650/citation/742976E6D5EB4E71PQ/1 (accessed on 9 May 2022).
- Kroger Joins Retailers Switching to Cage-Free Eggs. Supermark. News. 2016. Available online: https://www.proquest.com/docview/1771917481/abstract/FD827F5283534639PQ/1 (accessed on 9 May 2022).
- IKEA, U.S. Announces the Move to Cage-Free Eggs. Marketwired. 2016. Available online: https://www.proquest.com/docview/1822930581?pq-origsite=summon (accessed on 9 May 2022).
- Anonymous Costco Recommits to “cage-Free” Eggs. Poult. World 2016, 171, 13.
- Block, K. Breaking: Nevada Becomes 9th State to Ban Cages for Egg-Laying Hens. Available online: https://blog.humanesociety.org/2021/06/breaking-nevada-becomes-ninth-state-to-ban-cages-for-egg-laying-hens.html (accessed on 9 May 2022).
- HSUS Lands Cage-Free Act on California Ballot. Supermark. News 2008, 56, 35.
- Lusk, J.L. Consumer preferences for cage-free eggs and impacts of retailer pledges. Agribusiness 2019, 35, 129–148. [Google Scholar] [CrossRef]
- Rahmani, D.; Kallas, Z.; Pappa, M.; Gil, J.M. Are Consumers’ Egg Preferences Influenced by Animal-Welfare Conditions and Environmental Impacts? Sustainability 2019, 11, 6218. [Google Scholar] [CrossRef]
- Bailey, B.B.; Quisenberry, J.H.; Taylor, J. A Comparison of Performance of Layers in Cage and Floor Housing. Poult. Sci. 1959, 38, 565–568. [Google Scholar] [CrossRef]
- Yilmaz Dikmen, B.; Ipek, A.; Şahan, Ü.; Petek, M.; Sözcü, A. Egg production and welfare of laying hens kept in different housing systems (conventional, enriched cage, and free range). Poult. Sci. 2016, 95, 1564–1572. [Google Scholar] [CrossRef]
- Tauson, R. Management and housing systems for layers—Effects on welfare and production. World’s Poult. Sci. J. 2005, 61, 477–490. [Google Scholar] [CrossRef]
- Anderson, K.; Havenstein, G.; Jenkins, P.; Osborne, J. Changes in commercial laying stock performance, 1958–2011: Thirty-seven flocks of the North Carolina random sample and subsequent layer performance and management tests. World’s Poult. Sci. J. 2013, 69, 489–514. [Google Scholar] [CrossRef]
- Rexroad, C.; Vallet, J.; Matukumalli, L.K.; Reecy, J.; Bickhart, D.; Blackburn, H.; Boggess, M.; Cheng, H.; Clutter, A.; Cockett, N.; et al. Genome to Phenome: Improving Animal Health, Production, and Well-Being—A New USDA Blueprint for Animal Genome Research 2018–2027. Front. Genet. 2019, 10, 327. [Google Scholar] [CrossRef]
- Anderson, K.E. Final Report of the Fortieth North Carolina Layer Performance and Management Test; North Carolina State University: Raleigh, NC, USA, 2019. [Google Scholar]
- Anderson, K.E. Report on Pullet Rearing Period of the Fourtieth North Carolina Layer Performance and Management Test and Alternative Management Test; North Carolina Cooperative Extention: Raleigh, NC, USA, 2016; p. 26. [Google Scholar]
- Dale, N. National Research Council Nutrient Requirements of Poultry, 9th ed.; The National Academies Press: Washington, DC, USA, 1994; Volume 3, p. 101.
- JMP. JMP®, Version 14; SAS Institute Inc.: Cary, NC, USA, 1989–2021. [Google Scholar]
- Egg Grading Manual; United States Department of Agriculture: Washington, DC, USA, 2000.
- Neijat, M.; House, J.; Guenter, W.; Kebreab, E. Production performance and nitrogen flow of Shaver White layers housed in enriched or conventional cage systems. Poult. Sci. 2011, 90, 543–554. [Google Scholar] [CrossRef] [PubMed]
- Wang, X.L.; Zheng, J.X.; Ning, Z.H.; Qu, L.J.; Xu, G.Y.; Yang, N. Laying performance and egg quality of blue-shelled layers as affected by different housing systems. Poult. Sci. 2009, 88, 1485–1492. [Google Scholar] [CrossRef] [PubMed]
- Karcher, D.M.; Jones, D.R.; Abdo, Z.; Zhao, Y.; Shepherd, T.A.; Xin, H. Impact of commercial housing systems and nutrient and energy intake on laying hen performance and egg quality parameters. Poult. Sci. 2015, 94, 485–501. [Google Scholar] [CrossRef] [PubMed]
- Tactacan, G.B.; Guenter, W.; Lewis, N.J.; Rodriguez-Lecompte, J.C.; House, J.D. Performance and welfare of laying hens in conventional and enriched cages. Poult. Sci. 2009, 88, 698–707. [Google Scholar] [CrossRef] [PubMed]
- Onbaşılar, E.E.; Ünal, N.; Erdem, E.; Kocakaya, A.; Yaranoğlu, B. Production Performance, Use of Nest Box, and External Appearance of Two Strains of Laying Hens Kept in Conventional and Enriched Cages1 1This Study Was Supported by Ankara University (Grant No. BAP-10A3338005). Poult. Sci. 2015, 94, 559–564. [Google Scholar] [CrossRef]
- Campbell, D.L.M.; de Haas, E.N.; Lee, C. A review of environmental enrichment for laying hens during rearing in relation to their behavioral and physiological development. Poult. Sci. 2019, 98, 9–28. [Google Scholar] [CrossRef]
- Ross, M.; Garland, A.; Harlander-Matauschek, A.; Kitchenham, L.; Mason, G. Welfare-improving enrichments greatly reduce hens’ startle responses, despite little change in judgment bias. Sci. Rep. 2019, 9, 11881. [Google Scholar] [CrossRef]
- Shini, S.; Shini, A.; Huff, G.R. Effects of chronic and repeated corticosterone administration in rearing chickens on physiology, the onset of lay and egg production of hens. Physiol. Behav. 2009, 98, 73–77. [Google Scholar] [CrossRef]
- Shimmura, T.; Hirahara, S.; Azuma, T.; Suzuki, T.; Eguchi, Y.; Uetake, K.; Tanaka, T. Multi-factorial investigation of various housing systems for laying hens. Br. Poult. Sci. 2010, 51, 31–42. [Google Scholar] [CrossRef]
- Zita, L.; Jeníková, M.; Härtlová, H. Effect of housing system on egg quality and the concentration of cholesterol in egg yolk and blood of hens of native resources of the Czech Republic and Slovakia. J. Appl. Poult. Res. 2018, 27, 380–388. [Google Scholar] [CrossRef]
- Joseph, N.S.; Robinson, F.E.; Renema, R.A.; Zuidhof, M.J. Effects of Age at Photostimulation on Reproductive Efficiency in Three Strains of Broiler Breeders Varying in Breast Yield. J. Appl. Poult. Res. 2002, 11, 308–319. [Google Scholar] [CrossRef]
- Zuidhof, M.J.; Renema, R.A.; Robinson, F.E. Reproductive Efficiency and Metabolism of Female Broiler Breeders as Affected by Genotype, Feed Allocation, and Age at Photostimulation. 1. Pullet Growth and Development. Poult. Sci. 2007, 86, 2278–2286. [Google Scholar] [CrossRef]
- Van Krimpen, M.M.; Binnendijk, G.P.; Anker, I.V.D.; Heetkamp, M.J.W.; Kwakkel, R.P.; Brand, H.V.D. Effects of ambient temperature, feather cover, and housing system on energy partitioning and performance in laying hens1. J. Anim. Sci. 2014, 92, 5019–5031. [Google Scholar] [CrossRef] [PubMed]
- Jones, D.R.; Karcher, D.M.; Abdo, Z. Effect of a commercial housing system on egg quality during extended storage. Poult. Sci. 2014, 93, 1282–1288. [Google Scholar] [CrossRef]
- O’Connor, E.; Parker, M.; Davey, E.; Grist, H.; Owen, R.; Szladovits, B.; Demmers, T.; Wathes, C.; Abeyesinghe, S. Effect of low light and high noise on behavioural activity, physiological indicators of stress and production in laying hens. Br. Poult. Sci. 2011, 52, 666–674. [Google Scholar] [CrossRef]
- Ahammed, M.; Chae, B.J.; Lohakare, J.; Keohavong, B.; Lee, M.H.; Lee, S.J.; Kim, D.M.; Lee, J.Y.; Ohh, S.J. Comparison of Aviary, Barn and Conventional Cage Raising of Chickens on Laying Performance and Egg Quality. Asian-Australas. J. Anim. Sci. 2014, 27, 1196–1203. [Google Scholar] [CrossRef] [PubMed]
- USDA. Egg Market News Report; National Egg Review; U.S. Department of Agriculture: Agricultural Marketing Service: Washington, DC, USA, 2022.
- Fossum, O.; Jansson, D.S.; Etterlin, P.E.; Vågsholm, I. Causes of mortality in laying hens in different housing systems in 2001 to 2004. Acta Veter. Scand. 2009, 51, 3. [Google Scholar] [CrossRef] [PubMed]
- Matur, E.; Eraslan, E.; Akyazi, I.; Ergul Ekiz, E.; Eseceli, H.; Keten, M.; Metiner, K.; Aktaran Bala, D. The effect of furnished cages on the immune response of laying hens under social stress. Poult. Sci. 2015, 94, 2853–2862. [Google Scholar] [CrossRef]


| Strain | Conventional Cages | Enrichable Colony Cages | Enriched Colony Cages | Cage-Free |
|---|---|---|---|---|
| Dekalb | 8 (4) | 6 (3) | 6 (3) | 2 (2) |
| Babcock | 8 (4) | 6 (3) | 6 (3) | 2 (2) |
| W-36 | 8 (4) | 6 (3) | 6 (3) | 2 (2) |
| LSL-Lite | 8 (4) | 6 (3) | 6 (3) | 2 (2) |
| Lohman Nick Chick | 8 (4) | 6 (3) | 6 (3) | 2 (2) |
| NovoWhite | 8 (4) | 6 (3) | 6 (3) | 2 (2) |
| Tetrawhite | 8 (4) | 6 (3) | 6 (3) | 2 (2) |
| Total | 56 (28) | 42 (21) | 42 (21) | 14 (14) |
| Rate of Production | Feed Consumption kg/100 Birds/Day | Diet Fed |
|---|---|---|
| Pre-production | <9.52 | Pre-Lay |
| <10.43 | Pre-Lay | |
| Pre-peak and >90% | 10.43–12.20 | Pre-Peak |
| >12.20 | Layer 1 | |
| <11.29 | Layer 1 | |
| 90–80% | 11.29–12.20 | Layer 2 |
| >12.20 | Layer 3 | |
| <11.29 | Layer 3 | |
| 70–80% | 11.29–12.20 | Layer 4 |
| >12.20 | Layer 5 | |
| <11.29 | Layer 5 | |
| <70% | 11.29–12.20 | Layer 6 |
| >12.20 | Layer 7 1 |
| Ingredients | Pre-Lay | Pre-Peak | Layer 1 | Layer 2 | Layer 3 | Layer 4 | Layer 5 | Layer 6 |
|---|---|---|---|---|---|---|---|---|
| (%) | (%) | (%) | (%) | (%) | (%) | (%) | (%) | |
| Corn | 48.7 | 58.3 | 60.1 | 62.0 | 68.0 | 66.5 | 65.8 | 65.2 |
| Soybean Meal | 35.2 | 28.2 | 26.7 | 25.3 | 25.0 | 22.0 | 20.9 | 18.9 |
| Wheat Midds | - | - | - | - | - | - | 5.70 | 12.9 |
| Fat (Lard) | 0.55 | 0.50 | - | - | 0.83 | - | - | - |
| Soybean Oil | 2.54 | 1.29 | 1.81 | 1.25 | 0.095 | - | - | - |
| Lysine 78.8% | - | - | - | - | - | 0.11 | 0.005 | - |
| D.L. Methionine | 0.17 | 0.15 | 0.12 | 0.10 | 0.095 | 0.078 | 0.062 | 0.057 |
| Ground Limestone | 6.87 | 6.12 | 6.08 | 5.53 | - | 5.78 | 5.96 | 6.18 |
| Course Limestone | 3.87 | 3.50 | 3.5 | 3.75 | 3.97 | 3.75 | 3.75 | 3.75 |
| Bicarbonate | 0.11 | 0.10 | 0.10 | 0.15 | 0.11 | 0.10 | 0.10 | 0.10 |
| Phosphate mono/D | 1.21 | 1.07 | 0.90 | 1.30 | 1.26 | 1.09 | 0.99 | 0.82 |
| Salt | 0.39 | 0.32 | 0.29 | 0.25 | 0.31 | 0.26 | 0.26 | 0.24 |
| Vit. Premix 1 | 0.05 | 0.05 | 0.05 | 0.05 | 0.05 | 0.05 | 0.05 | 0.05 |
| Min. Premix 2 | 0.05 | 0.05 | 0.05 | 0.05 | 0.05 | 0.05 | 0.05 | 0.05 |
| HyD3 Broiler (62.5 mg/lb) | - | - | 0.025 | - | - | - | - | - |
| Prop Acid 50% Dry | 0.055 | 0.05 | 0.05 | 0.05 | 0.053 | 0.05 | 0.05 | 0.05 |
| T-Premix | 0.055 | 0.05 | 0.05 | 0.05 | 0.053 | 0.05 | 0.05 | 0.05 |
| 0.06% Selenium Premix 3 | 0.055 | 0.05 | 0.05 | 0.05 | 0.053 | 0.05 | 0.05 | 0.05 |
| Choline Cl 60% | 0.090 | 0.097 | 0.080 | 0.050 | 0.046 | 0.026 | 0.005 | - |
| Avizyme | 0.055 | 0.050 | - | - | - | - | - | - |
| Ronozyme P-CT 540% | 0.022 | 0.020 | 0.020 | - | - | - | - | - |
| Calculated Values | ||||||||
| Crude Protein % | 19.43 | 18.1 | 17.5 | 17 | 16.37 | 15.87 | 15.49 | 14.93 |
| Calcium % | 4.1 | 4.05 | 4 | 3.95 | 3.95 | 4 | 4.05 | 4.1 |
| A. Phos. % | 0.45 | 0.44 | 0.4 | 0.38 | 0.35 | 0.33 | 0.31 | 0.28 |
| Total Lysine % | 1.1 | 1 | 0.96 | 0.91 | 0.87 | 0.91 | 0.8 | 0.75 |
| Total Sulfur Amino Acids % | 0.8 | 0.74 | 0.69 | 0.66 | 0.63 | 0.6 | 0.58 | 0.56 |
| ME kcal/kg | 2926 | 2904 | 2860 | 2843 | 2843 | 2822 | 2800 | 2778 |
| Parameter Measured | Mathematical Formula |
|---|---|
| Hen-housed Egg Production (%) | ((Egg produced)/(hens housed × 28)) × 100 |
| Hen Day Egg Production (%) | ((Eggs produced)/(period hen days)) × 100 |
| Feed consumption (g/bird/day) | (Total grams of feed consumed)/(hen days) |
| Feed efficiency (egg g/feed g) | (Egg production × average egg weight grams)/(feed consumption) |
| Mortality (%) | ((Hens housed–hens remaining)/(hens housed)) × 100 |
| Transformed mortality | ASIN(SQRT(mortality%/100)) + 1 |
| Egg weight (g) | (Total grams of eggs weighed)/(number of eggs weighed) |
| USDA grade/size (%) | ((Number of grade/size eggs)/(total number of sampled eggs)) × 100 |
| Housing Environment | Hen-Day Prod. (%) | Hen-Housed Prod. (%) | Feed Cons. (g/Bird/Day) | Feed Conv. (Egg g/Feed Cons) | Egg Weight (g) | Bird Body Weight (kg) | Mortality (%) |
|---|---|---|---|---|---|---|---|
| Conventional Cages | 84.6 a ± 0.2 | 80.2 a ± 0.3 | 105.4 c ± 0.3 | 0.50 a ± 0.002 | 61.6 a ± 0.1 | 1.76 b ± 0.01 | 15.3 bc ± 2.6 |
| Enrichable Colony Cages | 81.3 c ± 0.3 | 70.0 b ± 0.3 | 111.4 a ± 0.3 | 0.45 c ± 0.002 | 61.2 b ± 0.1 | 1.76 b ± 0.012 | 31.3 a ± 3.0 |
| Enriched Colony Cages | 84.2 ab ± 0.3 | 79.1 a ± 0.3 | 107.4 b ± 0.3 | 0.48 b ± 0.002 | 60.9 b ± 0.1 | 1.70 c ± 0.12 | 15.6 b ± 3.0 |
| Cage-free | 83.4 b ± 0.4 | 79.2 a ± 0.5 | 101.8 d ± 0.5 | 0.50 a ± 0.003 | 60.5 c ± 0.1 | 1.82 a ± 0.017 | 5.2 c ± 3.6 |
| p-Value | 0.0001 | 0.0001 | 0.0001 | 0.0001 | 0.0001 | 0.0001 | 0.0001 |
| Housing Environment | Grade A% | Grade B% | Loss% | XL% | L% | M% | S% |
|---|---|---|---|---|---|---|---|
| Conventional Cages | 91.7 b ± 0.2 | 0.6 ± 0.1 | 7.7 b ± 0.2 | 70.1 a ± 0.5 | 22.7 c ± 0.5 | 3.6 ± 0.2 | 3.6 a ± 0.2 |
| Enrichable Colony Cages | 89.7 c ± 0.3 | 0.8 ± 0.1 | 9.6 a ± 0.3 | 67.3 b ± 0.5 | 24.7 b ± 0.5 | 4.1 ± 0.3 | 3.8 a ± 0.2 |
| Enriched Colony Cages | 90.3 c ± 0.3 | 0.8 ± 0.1 | 8.9 a ± 0.3 | 65.8 b ± 0.5 | 26.2 b ± 0.5 | 4.4 ± 0.3 | 3.6 a ± 0.2 |
| Cage-free | 95.2 a ± 0.4 | 0.7 ± 0.1 | 4.1 c ± 0.4 | 61.1 c ± 0.8 | 31.9 a ± 0.8 | 4.6 ± 0.4 | 2.4 b ± 0.3 |
| p-Value | 0.0001 | 0.0606 | 0.0001 | 0.0001 | 0.0001 | 0.0675 | 0.0024 |
Disclaimer/Publisher’s Note: The statements, opinions and data contained in all publications are solely those of the individual author(s) and contributor(s) and not of MDPI and/or the editor(s). MDPI and/or the editor(s) disclaim responsibility for any injury to people or property resulting from any ideas, methods, instructions or products referred to in the content. |
© 2023 by the authors. Licensee MDPI, Basel, Switzerland. This article is an open access article distributed under the terms and conditions of the Creative Commons Attribution (CC BY) license (https://creativecommons.org/licenses/by/4.0/).
Share and Cite
Alig, B.N.; Ferket, P.R.; Malheiros, R.D.; Anderson, K.E. The Effect of Housing Environment on Egg Production, USDA Egg Size, and USDA Grade Distribution of Commercial White Egg Layers. Poultry 2023, 2, 204-221. https://doi.org/10.3390/poultry2020017
Alig BN, Ferket PR, Malheiros RD, Anderson KE. The Effect of Housing Environment on Egg Production, USDA Egg Size, and USDA Grade Distribution of Commercial White Egg Layers. Poultry. 2023; 2(2):204-221. https://doi.org/10.3390/poultry2020017
Chicago/Turabian StyleAlig, Benjamin N., Peter R. Ferket, Ramon D. Malheiros, and Kenneth E. Anderson. 2023. "The Effect of Housing Environment on Egg Production, USDA Egg Size, and USDA Grade Distribution of Commercial White Egg Layers" Poultry 2, no. 2: 204-221. https://doi.org/10.3390/poultry2020017
APA StyleAlig, B. N., Ferket, P. R., Malheiros, R. D., & Anderson, K. E. (2023). The Effect of Housing Environment on Egg Production, USDA Egg Size, and USDA Grade Distribution of Commercial White Egg Layers. Poultry, 2(2), 204-221. https://doi.org/10.3390/poultry2020017