Article

The Cost of Cutbacks: How Reduction in Development Assistance for Health May Affect Progress Made in HIV/AIDS Control in Africa

by
Richmond Nketia
1,2,*,
Daniel Atta-Nyarko
2,3,
Ebenezer Gyamfi
2,4,
Rostand Dimitri Messanga Bessala
1,5,
Naomi Adotei
2,6,
Benjamin Asare-Kyei
2,7,
Faustina Ameyaa Marfo
1,8,
Prosper Tonwisi Luri
2,9,
Charles Limula
1,10,
Abubakr Ahmed Farhan
1,11,
Michele Castelli
12 and
Austin Gideon Adobasom-Anane
2,13
1
Department of Research and Data Analytics, Sub-Saharan Africa Research for Sustainable Development (SSARSD) Project, Berekum BB-0663-3578, Ghana
2
Department of Global Health Policy and Development, Sub-Saharan Africa Research for Sustainable Development (SSARSD) Project, Berekum BB-0663-3578, Ghana
3
Allied Health Professions Council (AHPC), Ministry of Health, Accra GA-221-9798, Ghana
4
Department of Medicine, Methodist Hospital, Wenchi BW-0017-7604, Ghana
5
Department of Internal Medicine, Faculty of Medicine and Biomedical Sciences, University of Yaounde I, Yaounde P.O. Box 3077, Cameroon
6
Department of Paediatrics, St. Luke Hospital, Kasei AJ-1798-9833, Ghana
7
Administrative Unit, College of Health Yamfo, Yamfo B2-2129-4216, Ghana
8
Department of Health Sciences, Faculty of Sport, Technology and Health Sciences, St. Mary’s University, Twickenham TW1 4SX, UK
9
Department of Surgery, Salaga Municipal Hospital, Salaga N4-00012-2664, Ghana
10
Skerne Medical Group (NHS), Harbinson House, Front St, Sedgefield TS21 3BN, UK
11
Department of Clinical Care, Savannah Regional Health Directorate, Damango SW-00000-1451, Ghana
12
Department of Statistics and Quantitative Methods, University of Milano Bicocca, 20133 Milan, Italy
13
Global Health and Infectious Diseases Research Group, Kumasi Centre for Collaborative Research, Kwame Nkrumah University of Science and Technology, Kumasi AK-312-1059, Ghana
*
Author to whom correspondence should be addressed.
Venereology 2025, 4(2), 8; https://doi.org/10.3390/venereology4020008
Submission received: 10 April 2025 / Revised: 15 May 2025 / Accepted: 22 May 2025 / Published: 29 May 2025

Abstract

Background/Objectives: The recent Executive Order suspending the United States Agency for International Development (USAID) programmes, including Development Assistance for Health (DAH), has sparked serious debates about the sustainability of ongoing HIV/AIDS control programmes, particularly in Africa. In this study, we examined HIV/AIDS-specific DAH allocation to Africa from 1990 to 2022, and the potential effects of funding cutbacks on disease outcomes. Methods: We nested 54 countries within five sub-regions of Africa and applied linear mixed-effects models to estimate the effects of DAH on HIV/AIDS incidence and mortality rates, accounting for clustering by sub-region and potential variability due to baseline incidence and mortality and other sources of heterogeneity. Results: Total DAH allocated to Africa increased from US$534,343 in 1990 to US$5,273,264 in 2022. The United States (U.S.) public sector contributed nearly two-thirds (US$58,399,088; 63.01%) of the total funding. Most of these funds were disbursed to Southern and Eastern Sub-Saharan Africa (SSA), particularly countries with the highest HIV/AIDS burdens, including South Africa and Kenya. The fixed effects results and predicted margins indicate that, in addition to having a direct effect, U.S. public sector-specific DAH moderates the effectiveness of other international donor funding and domestic general government health spending (GHES) on HIV/AIDS incidence and mortality. Conclusions: Based on the historical trends and funding interactions, the cutback in U.S. DAH could be associated with weakening of the overall effectiveness of other donor funding and GHES. However, any future effects are contingent on African countries’ resilience to evolving challenges and resource allocation.

Graphical Abstract

1. Introduction

The global fight against HIV/AIDS has historically relied on a diverse combination of funding flows, and the United States (U.S.) Government has played a very crucial role through its international development policies and programmes [1,2,3,4]. Since its inception in 2003, the U.S. President’s Emergency Plan for AIDS Relief (PEPFAR) has provided over $100 billion in the fight against HIV/AIDS, making the U.S. public sector the single largest contributor to global HIV/AIDS control funding over the last two decades [5,6]. A substantial portion of these funds has been channelled to Sub-Saharan Africa (SSA), which carries the highest disease burden globally, to support programmes aimed at HIV/AIDS prevention, treatment, and healthcare services [1,4,7]. Several studies have examined the direct effect of these initiatives and other international Development Assistance for Health (DAH) on HIV/AIDS outcomes in Africa. Some data indicate that DAH has contributed to enhancing access to antiretroviral treatment, strengthening healthcare services, and reducing HIV/AIDS-related mortality [1,4,8,9,10]. In a recent systematic review based on 102 studies, Xie and colleagues found that increasing international aid was associated with significant improvements in life expectancy and several other health outcomes, albeit with some inconsistencies [11].
However, the reliance on international aid raises serious concerns about the sustainability of the gains and progress made thus far, particularly in an era of changing political priorities, emerging socio-economic challenges among donor countries, and global events (e.g., the COVID-19 pandemic)—all of which have the potential to redirect or reduce funding [7,12,13,14,15,16]. On 20 January 2025, the U.S. President Donald Trump issued an Executive Order to evaluate and possibly realign U.S. foreign aid to meet contemporary and emerging needs. This order imposed a three-month (90 days) suspension on new obligations and disbursements, followed by a stop-work order for most existing programmes, including DAH, freezing service delivery in many countries worldwide [17]. This sudden shift in the U.S. foreign aid policies has raised concerns about the future of HIV/AIDS control and its broader implications, particularly in Africa.
Amidst the disruption and debates, questions have arisen regarding the synergy between U.S. DAH and other funding sources. Some researchers argue that this funding cutback will not only affect HIV/AIDS outcomes directly but will also alter the synergistic benefits derived from domestic health investments and other international donor funding. However, it remains unclear whether the cut in U.S. DAH flows will weaken existing beneficial synergies or if the remaining funding streams can compensate for the suspended U.S. DAH initiatives. Without addressing these concerns, the world risks sacrificing the potential benefits of integrated funding efforts and, ultimately, the long-established progress and success in global HIV/AIDS control.
Our study, utilising historical data, sought to address these intriguing questions by examining the direct effect of U.S. DAH, other international DAH, and domestic general GHES on HIV/AIDS incidence and mortality rates and, most importantly, their interactions. The findings of this study are intended to inform policy discussions on domestic and international donor funding reforms and to contribute novel evidence on donor-specific initiatives and integrated funding streams that reinforce successful HIV/AIDS control in Africa.

2. Materials and Methods

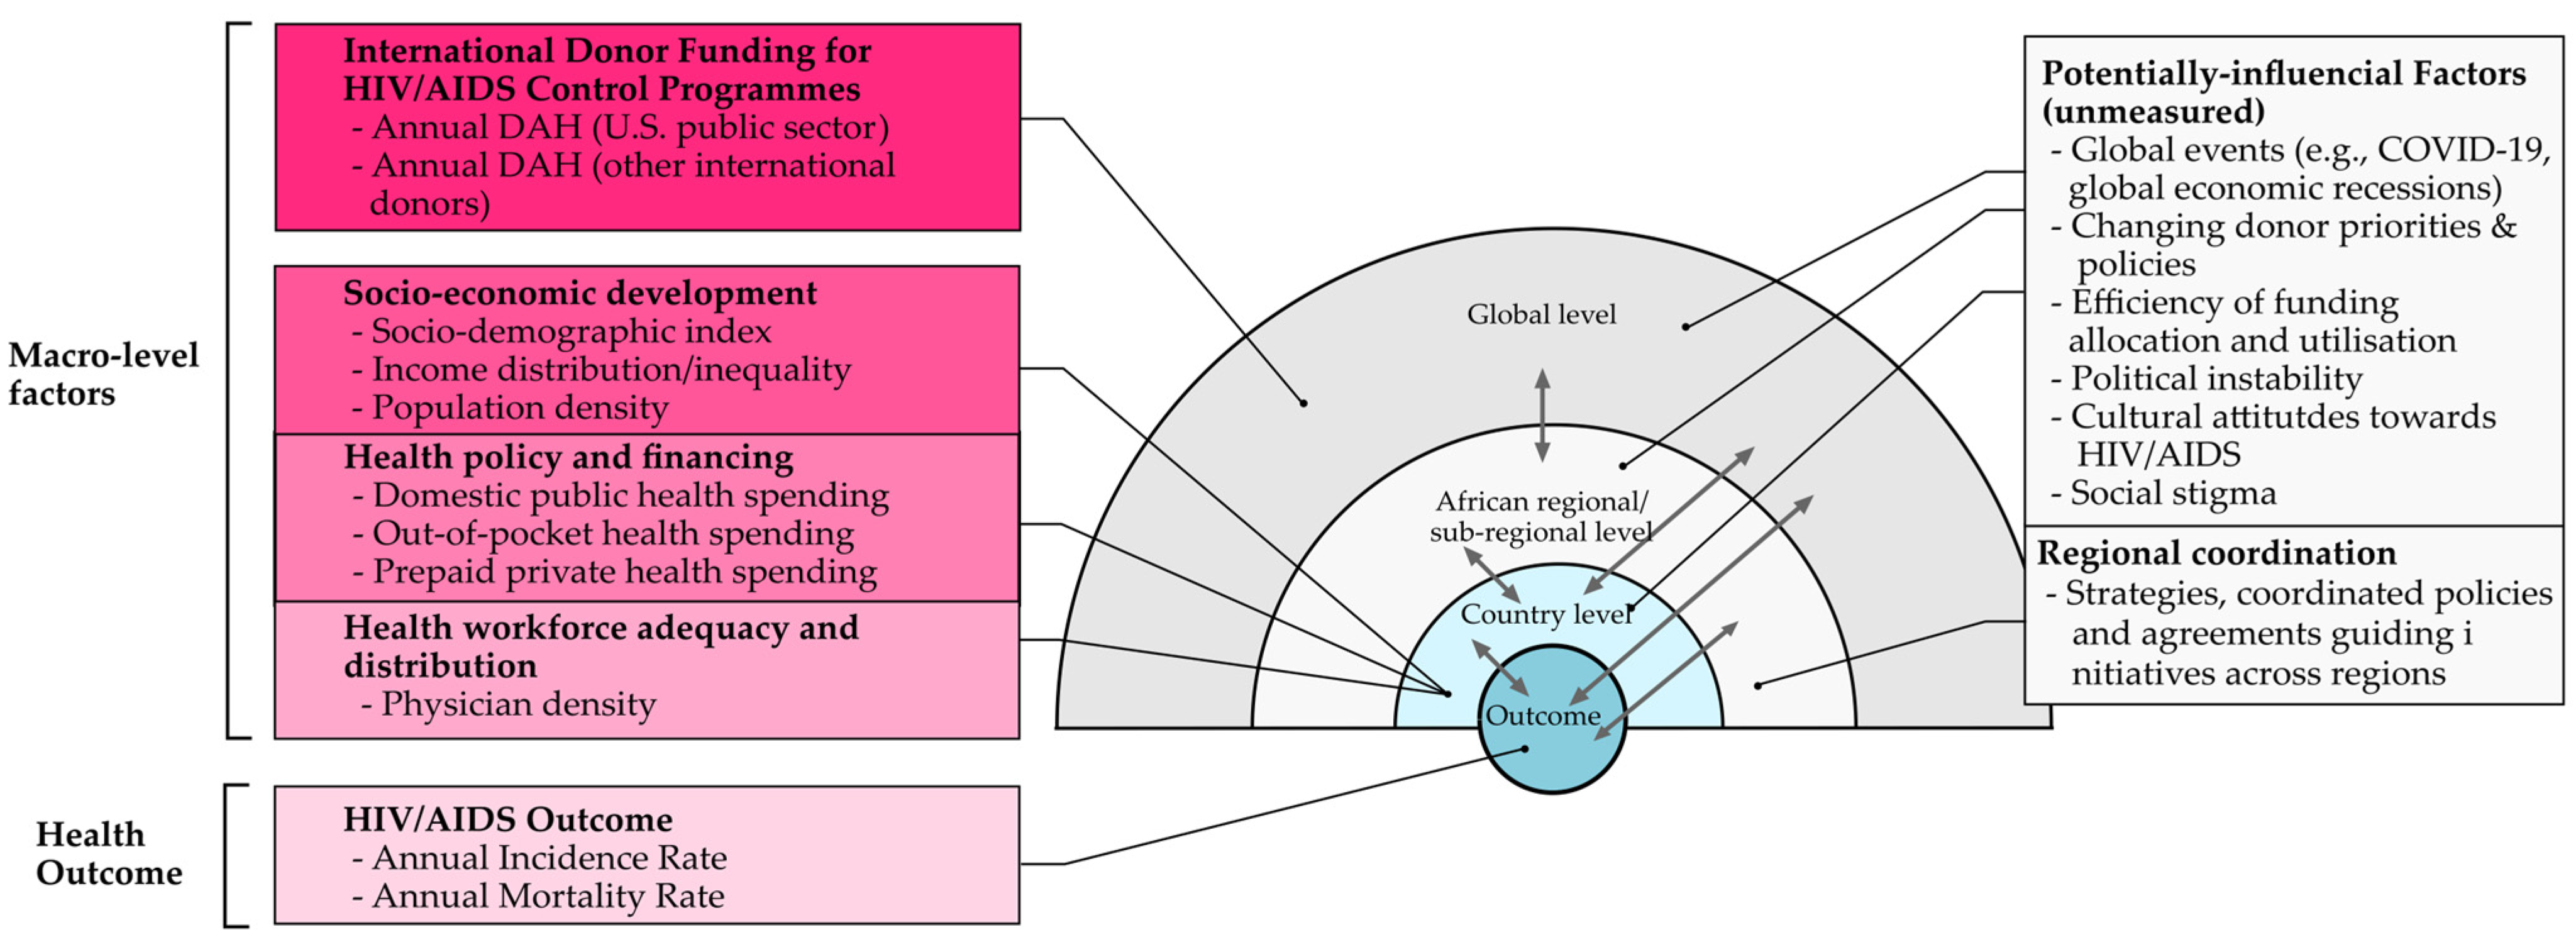
2.1. Conceptual Framework

The conceptual framework for this study was developed from prior literature [2,4,8,9,10,18,19,20,21,22,23] and theoretical models and constructs including Bronfenbrenner’s ecological system model [24], the Dahlgren-Whitehead model of health determinants [25], and the World Health Organisation’s (WHO) framework on social determinants of health [26], illustrating the effect of macro-level factors on HIV/AIDS outcomes (Figure 1). The outermost circle represents the global domain where donor funding plays a crucial role in the fight against HIV/AIDS. Within this sphere, the U.S. public sector-specific DAH is highlighted as a pivotal factor that not only exerts a direct effect but also moderates the effect of other donor funding streams. Moving inward, the African regional circle captures policies and cross-country agreements that shape the health landscape in the region, while the innermost circle represents country-level elements, including socio-economic indicators, health policy, and workforce capacity. At the core, HIV/AIDS outcomes, specifically incidence and mortality rates, are determined by the interaction among the layers of factors through continuous feedback loops.
Within this framework, three critical questions were addressed: (1) How were international donor funds for HIV/AIDS control disbursed across the African sub-regions and countries during the last 32 years, and what trends can be observed in the evolution of these allocation patterns? (2) How did the U.S. public sector-specific DAH interact with other donor funding and GHES in shaping HIV/AIDS control efforts in Africa? (3) What might these historical associations imply for future trends, assuming that resource allocation and disease patterns continue as they have in previous periods? Although we use the terms disbursement and allocation interchangeably throughout this paper, we are specifically referring to disbursement, the actual release and transfer of funds, as validated by our data sources.

2.2. Target Region and Countries

This serial cross-sectional ecological study was conducted as part of the Sub-Saharan Africa Research for Sustainable Development (SSARSD) Project initiatives. The goals and objectives of this project are published elsewhere [27]. Our study focused on the African continent, a high-burden HIV/AIDS region, and a major beneficiary of DAH [1,4,7]. Africa is one of the six global continents and the second most populous region after Asia. It is divided into five sub-continents: Central, Eastern, Northern, Southern, and Western Africa, which comprise 54 sovereign states, each with unique socio-cultural and economic characteristics [28]. In terms of land size, Algeria is the largest country; however, Nigeria has the largest population in the region [29]. With approximately 1.4 billion people, Africa accounts for about 18% of the global population, with projections indicating it will become the most populous continent by 2060 [30]. The region’s population is predominantly youthful, with a median age of about 19 years. Despite recent progress, Africa faces significant health challenges, including infectious diseases such as tuberculosis (TB), malaria, and HIV/AIDS. Availability and access to quality health services also vary widely, with many populations still lacking access to essential healthcare services. Efforts to strengthen health systems have recently focused on universal health coverage (UHC), community-based care, and tackling social determinants of health to improve outcomes [31]. Most African countries are currently transitioning from centrally planned economies to liberal market-based economies [29]. The complete list of countries is presented in Table 1.

2.3. Variables and Data Source

We assembled a comprehensive, aggregate-level dataset from reputable sources, including the Institute for Health Metrics and Evaluation (IHME) and the World Inequality Data (WID) lab, to examine the effect of HIV/AIDS-specific DAH on HIV/AIDS incidence and mortality across Africa (Table S1). We chose to use data from these sources because of their consistent provision of high-quality, regularly updated, and standardised datasets that were essential for our serial, cross-sectional ecological study. While alternative data sources exist, many lack the same level of completeness, methodological transparency, and standardisation required for our study. To date, IHME remains the most comprehensive source of global health data, with well-documented and standardised health financing and epidemiological indicators [32]. Similarly, for about a decade, the WID has consistently produced high-quality, nationally comparable data on the various dimensions of inequality through evidence-based research, making the WID the most comprehensive open-access source of global inequality data [33]. These combined strengths made IHME and WID the superior choice for our study to ensure that our results are both reliable and reproducible.
Our outcome variables were aggregate-level, sex-specific age-standardised HIV/AIDS incidence and mortality rates per 100,000 population. For the predictors, we focused on three key funding streams: U.S. DAH, other international donor DAH, and GHES per capita. In the context of this study, U.S. DAH was defined as the U.S. public sector-specific DAH for HIV/AIDS control and excludes all other sources of DAH from the U.S. (those were added to other international donor DAH). It included funds for HIV/AIDS counselling and testing, treatment and support, health system strengthening and capacity building, human resource development, support for orphans and vulnerable children, prevention of mother-to-child transmission (MTCT), and prevention of new infections and drug resistance. Differentiating between funding sources allowed for a granular assessment of how different funding streams individually and jointly relate to HIV/AIDS outcomes.
We also incorporated several socio-economic and health system variables—income inequality (Gini coefficient), socio-demographic index (SDI), sex, physician density, out-of-pocket health spending (OOP), and pre-paid private health spending (PPPS)—as covariates to account for potential confounding and country-level sources of heterogeneity in our mixed-effects analysis. These variables were carefully selected based on our conceptual framework. The period 1990 to 2022 was chosen to capture a transformative era marked by notable growth in international DAH and other HIV/AIDS control initiatives in Africa [3,11,34] and the availability of standardised, comparable, and high-quality data that were essential for our study [35]. This dual emphasis on theoretical relevance and data quality ensured a robust assessment of the effect of the predictors on HIV/AIDS outcomes in Africa. The Supplementary Material (Table S1) provides a detailed description of the variables and data sources.

2.4. Data Analysis

Data on HIV/AIDS-specific DAH funding allocation and distribution patterns in Africa were summarised using median, interquartile range (IQR), and changes over time. To answer our second and third research questions, we employed a multi-level linear mixed-effects model to test the associations between the set of predictors and the outcomes (HIV/AIDS incidence and mortality), as shown in our conceptual model, accounting for clustering by sub-region and potential variability due to baseline HIV/AIDS incidence and mortality and other sources of heterogeneity at the sub-region and country levels. We nested 54 countries within the five sub-regions of Africa, according to the United Nations (UN) country groupings. In line with best practice guidance for linear mixed-effects modelling [36], different models were developed and compared to determine the best-fitting model for the study data (Figure S1).
The primary model, with an unstructured covariance matrix, included fixed effects for: U.S. DAH, other international donor DAH (Other DAH), GHES, interaction terms between U.S. DAH, Other DAH, and GHES, income inequality (Gini), SDI, physician density, OOP, and PPPS, allowing for random intercepts at sub-region and CompID (composite ID group defined by country and sex) levels and random slopes for U.S. DAH at CompID level. Interactions and random slopes were explored using marginal plots and Best Linear Unbiased Prediction (BLUP), respectively. Given the need for model comparison, and our large sample size, the maximum likelihood estimation (MLE) method was chosen over restricted maximum likelihood (RMLE) [37]. Akaike (AIC) and Bayesian Information Criteria (BIC) indices were used to compare models. In cases of conflicting results, BIC was used, given its robustness for identifying the correct model structure in mixed modelling [38].
Estimates were reported with their 95% confidence interval (CI) and p-values. All p-values were two-tailed and considered significant at a 5% significance level. All variables were log-transformed (natural log) given their positive skewness, and all predictors were mean-centered so that zero represents the average (mean) funding level, allowing the effects and interactions to be interpreted relative to typical conditions in the countries examined [37]. For positively skewed variables containing zero values (U.S. DAH, Other DAH, and PPPS), we applied a [log(x + 1)] transformation [39]. All preliminary assumptions relating to linearity, normal distribution, independence, and constant variance of the errors were met.

2.5. Robustness Assessment

One major challenge in analytical ecological studies is the potential effect of unmeasured confounding on the study results [40]. To address this concern, our mixed-effects models were carefully designed to account for key confounders and covariates. Specifically, we included adjustments for SDI (a composite measure of national socio-economic development), OOP, PPPS, income inequality, physician density, and other relevant factors (Table S1). Including these variables ensured that our analysis accurately captured the complex relationships among predictors, covariates, and HIV/AIDS outcomes.
To further test the validity of our findings, we conducted a series of robustness assessments, including a Monte Carlo simulation-based sensitivity analysis [41]. Specifically, we simulated a hypothetical confounder, U, drawn from a standard normal distribution, assuming it is associated with our primary predictors (U.S. DAH, Other DAH, and GHES) via a range of plausible lambda (λ) values (0.1 to 0.9), capturing the strength of these associations. For each plausible λ value, we generated new values for U, refitted the full mixed-effects model with U included as a covariate, and recorded the corresponding coefficient for U.S. DAH, Other DAH, and GHES. This procedure yielded a distribution of estimates that quantified the potential bias introduced by omitted variable confounding, allowing us to assess the robustness of our findings across a range of plausible λ values [42].
Also, we applied a jackknife (leave-one-country-out) procedure in our primary mixed-effects model to ensure that key interaction effects were not driven by any single country, especially those receiving high funding [43,44]. In addition, we computed and compared estimates across two sample periods—the full sample (1990–2021) and a restricted pre-COVID sub-sample (1990–2019)—to ensure the stability of the relationships between the funding streams and HIV/AIDS outcomes.
Moreover, we employed a comprehensive multi-method econometric strategy to address concerns about potential endogeneity and reverse causality. Our primary, complementary approaches included fixed-effects Instrumental Variable (IV) estimation [45,46,47], dynamic panel data modelling using the Arellano-Bond/System Generalised Method of Moments (GMM) [48,49], and a control function approach [50,51], with endogenous variables instrumented using their lagged values and instrument validity assessed via Hansen tests [52]. The analysis was performed using Stata v18 [53].

3. Results

3.1. HIV/AIDS-Specific Development Assistance for Health Allocation to Africa

We began by exploring how HIV/AIDS-specific DAH was disbursed among African countries during the last 32 years (between 1990 and 2022). Our findings indicate a substantial increase in funding, rising from US$534,343 in 1990 to US$5,273,264 in 2022 (≈887% growth). The total funding allocation from 1990 to 2022 was US$92,676,296, and the U.S. public sector contributed nearly two-thirds of the total amount (US$58,399,088; 63.01%). Southern and Eastern SSA countries received most of these funds (17.41% and 58.97%, respectively), aligning with their high HIV/AIDS burden. Specifically, South Africa, Kenya, Uganda, Mozambique, Zambia, and Zimbabwe were among the top beneficiaries, highlighting targeted support where it is most needed. In contrast, Northern African nations received comparatively lower DAH, consistent with their lower HIV/AIDS burden (Table 1).

3.2. Association Between DAH and HIV/AIDS Incidence and Mortality

In addition to the funding distribution patterns, we addressed two critical questions: (1) How U.S. DAH interacted with other donor funding and GHES in shaping HIV/AIDS control efforts in Africa during the last 32 years; (2) What these historical associations imply for future trends, assuming that resource allocation and disease patterns continue as they have in previous periods.
Accordingly, we report our mixed-effects test results focusing on the three key funding streams: U.S. DAH, Other DAH, and GHES. It is important to note that in our analysis, all predictors were mean-centred so that zero (0) represents the average (mean) funding level, one standard deviation below the mean (−1 SD) represents a low funding level, and one SD above the mean (+1 SD) represents a high funding level. The fixed effects results show that increased U.S. DAH was associated with a decrease in incidence rate (β = −0.047, p = 0.006). A similar inverse relationship was observed between Other DAH and HIV/AIDS incidence (β = −0.046, p < 0.001). Their interaction (U.S. DAH and Other DAH) was also significantly associated with lower incidence (β = −0.013, p < 0.001). In contrast, increased GHES correlated with a surge in HIV/AIDS incidence (β = 0.108, p < 0.001). However, this relationship was mitigated by the interaction between U.S. DAH and GHES (β = −0.093, p < 0.001). The interaction between Other DAH and GHES showed a significant positive association (β = 0.016, p < 0.001).
As illustrated in Figure 2A, when U.S. DAH was low (−1 SD), the effect of other international DAH on HIV/AIDS incidence was negligible. However, at average levels of U.S. DAH (Mean = 0), an increase in other international donor DAH (+1 SD) was associated with a significant decrease in incidence, a reduction that became even more pronounced when U.S. DAH was high (+1 SD). Similarly, when U.S. DAH was high, increased GHES (+1 SD) correlated with a significant reduction in HIV/AIDS incidence. Predicted margins computed over 27 combinations of funding levels confirmed this synergy; for example, the combination of high U.S. DAH (+1 SD), high other-donor DAH (+1 SD), and high domestic spending (+1 SD) yielded the lowest predicted log HIV/AIDS incidence (Figure 3). In real-world terms, where GHES and Other DAH were held high—specifically, with Other DAH around $100,000 and GHES at a value of 200 per capita (measured in purchasing power parity (PPP))- an increase in U.S. funding from approximately $56 to about $16,200 was associated with a decrease in HIV/AIDS incidence from roughly 181 to around 50 per 100,000 people, reflecting a 73% decline. In contrast, in situations where U.S. DAH was fixed at a low level (roughly $56) and Other DAH stayed high (about $100,000), the predicted margins revealed a counterintuitive result: as governments increased health spending from 11 per capita to about 200 per capita (in PPP), the estimated HIV/AIDS incidence rate rose from roughly 53 to around 181 per 100,000 people, potentially reflecting reactive government spending.
For HIV/AIDS mortality, although the main effects of U.S. DAH and Other DAH were not significant individually, their interaction was associated with a significantly lower mortality rate (β = −0.025, p < 0.001). In contrast, increased GHES was significantly associated with higher mortality (β = 0.133, p < 0.001). However, this effect was mitigated when GHES interacted with U.S. DAH (β = −0.142, p < 0.001). As shown in Figure 2, at low U.S. DAH (−1 SD), a one-unit increase in other international donor funding was associated with a 0.063 (95% CI: 0.05 to 0.077) unit increase in mortality. However, at high U.S. DAH (+1 SD), that same increase corresponded to a 0.078 (95% CI: −0.097 to −0.067) unit decrease in mortality. GHES showed similar margins, with a strong positive association at low U.S. DAH and a negative association at high levels. The predicted margins supported these findings. A scenario where Other DAH is maintained at a high level (a mean-centred value of 3.64, which back-transforms to roughly $100,000), two patterns were observed: First, when GHES is also high (mean-centred value of 1.43, or about 200 spending per capita in PPP), an increase in U.S. DAH from a low level (mean-centred value of –2.83, approximately $56) to a high level (mean-centred value of 2.83, roughly $16,200) was associated with a decline in predicted mortality from about 112 to 28 per 100,000 people—a reduction of roughly 75%. In a separate scenario, holding U.S. DAH low (–2.83, about $56 per capita) and Other DAH high (roughly $100,000), an increase in domestic government spending from low (mean-centred value of –1.43, around 11 per capita in PPP) to high (mean-centred value of 1.43, approximately 200 per capita in PPP) was associated with an increase in predicted mortality from roughly 27 to about 112 per 100,000 people.
The random effects analysis reveals some variability in the effect of U.S. DAH on HIV/AIDS outcomes across Africa. In many countries, the population-specific estimates (BLUPs) of the random slopes show high variability (Figure S2). This heterogeneity indicates that the effect of U.S. DAH is context-dependent, likely reflecting country-level variations in funding implementation, effectiveness of public health initiatives, and local epidemiological situations.

3.3. Additional Results

For HIV/AIDS incidence, dynamic system GMM results showed a statistically significant positive association between GHES and incidence, suggestive of reactive spending (an indication of reverse causality). The control function approach clarified this finding: when the endogenous (‘reverse causal’) component of GHES was isolated via residuals, it showed a significantly negative association with incidence, implying that once reverse causality is addressed, higher government spending would correlate with lower incidence. In contrast, for HIV/AIDS mortality, both fixed-effects IV and control function methods consistently yielded non-significant effects of GHES, suggesting that reverse causality was not a driving factor. Overall, the evidence points to a nuanced role of reverse causality in the incidence relationship, where reactive spending could obscure the true beneficial effects of GHES, while for mortality, there is little indication that reverse causality biased the estimates.
Regarding donor funding, the fixed-effects IV approach found no evidence that changes in HIV/AIDS mortality drove U.S. DAH funding, which contrasts with the mixed-effects model results (Table 2). The dynamic panel data model showed that U.S. DAH was largely influenced by past funding levels rather than current mortality rates. Similarly, the control function approach negligible residual endogeneity. Collectively, these findings indicate that reverse causality was not a major concern in explaining U.S. DAH, reinforcing the view that funding levels were reactive to contemporaneous changes in HIV/AIDS mortality.
Regarding whether donors rewarded countries with lower past HIV/AIDS incidence, again, we focused exclusively on U.S. DAH, which was previously characterised by clearly defined, performance-based metrics and consistent reporting standards, in contrast to Other DAH flowing from multiple sources with varied priorities, making them less directly comparable for assessing the targeted resource allocation. Under the premise that lower past incidence, a proxy for improved HIV/AIDS control, signalled programme effectiveness and merited further support, our primary specification (Option 1) found that a one-unit decrease in lagged HIV/AIDS incidence was associated with a 0.56-unit increase in subsequent U.S. DAH (p = 0.058). This negative association, alongside a significant, persistent effect of U.S. DAH (coefficient 1.55, p < 0.001), is consistent with the notion that donors might reward better-performing countries. However, the extremely low Hansen test p-value (p < 0.001) raised concerns about instrument validity and potential overidentification. The alternative specification (Option 2), which addressed the instrument validity concern, did so at the expense of precision. Thus, our findings underscore the trade-offs inherent in dynamic panel estimation and highlight the need for cautious interpretation.

4. Discussion

4.1. DAH Allocation and Its Effects on HIV/AIDS Incidence and Mortality

This study examined international aid disbursement for HIV/AIDS control and evolving funding patterns among African countries from 1990 to 2022. It further investigated how U.S. DAH interacted with other donor funding and domestic general government health expenditure, and explored what these historical associations might imply for future trends. The results show a substantial growth in HIV/AIDS-specific DAH in Africa over the 33 years examined, reflecting global efforts to combat the HIV/AIDS epidemic in the region. The U.S. public sector contributed nearly two-thirds of the overall funding. Most of these funds were channeled to Southern and Eastern SSA countries, specifically, those with high HIV/AIDS burdens, including South Africa, Zimbabwe, and Kenya. The concentration of DAH in these countries seems consistent with the priority of addressing the most affected regions. This targeted funding approach reflects the principles of health equity, which advocates for the allocation of resources to where they are most needed to maximise health gains [7,16,54]. The U.S. government’s significant investment in HIV/AIDS programmes also highlights its pivotal role in global health initiatives, particularly through programmes such as PEPFAR, which has made substantial contributions to HIV/AIDS prevention, capacity building, and treatment efforts in Africa [5,6].
The results of our mixed-effects models indicate that reductions in U.S. DAH were associated with a diminished overall effectiveness of both domestic government health spending and other international donor funding for HIV/AIDS control. The fixed effect estimates and predicted margins revealed that the effects of international donor DAH and GHES on HIV/AIDS incidence and mortality were conditional on U.S. DAH. Notably, in scenarios where U.S. DAH was low, even with increased funding from other international donors and domestic governments, HIV/AIDS incidence remained relatively high, compared with when all funding streams were high. Similarly, when U.S. DAH was low but the other two funding streams were high, the predicted mortality rate was substantially high. In contrast, when high U.S. DAH was paired with high levels of international donor funding and domestic spending, the predicted HIV/AIDS mortality dropped considerably, suggesting a beneficial synergy between the three funding streams.
These empirical findings can be understood by considering the comprehensive role of the U.S. health aid in the global fight against HIV/AIDS. Previously, when the U.S. public sector programmes like PEPFAR were running at full capacity, with adequate funding, well-trained personnel, and effective management, they provided not only financial support for countries in Africa, but also essential technical expertise, close monitoring, and coordinated programmatic support that ensured sustainable, systemic improvements in HIV/AIDS prevention and care [5]. In its absence, alternative funding streams are likely to be deployed reactively, addressing immediate crises rather than supporting long-term capacity building, leading to fragmented service delivery and inefficiencies [55]. For example, the Joint United Nations Programme on HIV/AIDS (UNAIDS) case analyses and reports from countries in SSA, including Eswatini, South Africa, Nigeria, Kenya, and Zimbabwe, have linked the recent reductions in U.S. aid to disruptions in antiretroviral supply chains and gaps in prevention services (including pre-exposure prophylaxis and early infant diagnosis), thereby amplifying the epidemic despite increased levels of domestic and non-U.S. donor expenditures [56,57].
Regarding the ‘beneficial’ synergy between the funding streams, our research finds resonance with earlier studies emphasising the role of integrated financing in optimising system-wide efficiency and improvement in health outcomes. For instance, Atun et al. [58] demonstrated how integrating targeted health interventions into broader health systems can lead to more sustainable outcomes, while Lagomarsino and colleagues [16] provided evidence that diversified health financing—via comprehensive health insurance reforms— enhances system performance and resilience in low-resource settings. An integrated funding stream has proven effective in several African countries, where strategic regional partnerships and collaborations with multilateral organisations have mitigated the adverse effects of donor policy realignment [54,59]. These alternative health financing strategies not only provide essential resources for HIV/AIDS services, but also offer opportunities for a more integrated, sustainable financing models that bolster health systems and improve resilience [14]. By broadening the donor base, countries can reduce dependency on a single funding source and ensure continuity of vital HIV/AIDS services [11,12,60].
The considerable heterogeneity observed, with populations in Angola showing mitigation or reversal of the fixed protective effect, while those in the Democratic Republic of Congo, Burundi, and Zimbabwe experience amplified benefits, highlights the context-dependent nature of donor funding effects. These disparities suggest that locally specific factors such as health system strength, policy environments, and socio-economic conditions influence the success of external funding interventions. Moreover, the political economy of health—emphasising how power dynamics, governance structures, and economic policies shape resource allocation and policy priorities—might play a crucial role in determining how donor funding policies and terms of conditions affect national health systems and the delivery of essential services [60].

4.2. Policy Implications and Recommendations

Consistent with the literature [1,2,3,4], our study has shown that the U.S. public sector has been a driving force behind the global fight against HIV/AIDS, channelling large sums of money to the African region. Strategically, these funding initiatives have targeted critical areas of HIV/AIDS control, including counselling and testing, clinical care and support for patients, health system strengthening, human resource development, prevention of MTCT, support for orphans and vulnerable children, and prevention of new infections and drug resistance. As shown in the mixed-effects modelling, in addition to exerting a direct effect on HIV/AIDS incidence, U.S. DAH also enhances the effect of domestic government funding and other international donor DAH on HIV/AIDS incidence and mortality. Based on these historical trends and funding interactions, any cutbacks in U.S. DAH could be associated with a weakening in the overall effectiveness of Other DAH and GHES, contingent on African countries’ resilience to evolving challenges, disease patterns, and the allocation of other resources in the future.
Our findings also indicate that African governments tend to increase health spending reactively in response to rising HIV/AIDS incidence, rather than mortality. One possible explanation is that spikes in new infections generate considerable political and media pressure, leading to immediate initiatives and budget reallocations—as seen in parts of South Africa and Uganda, where governments rapidly scaled up treatment and preventive campaigns in the early 2000s when incidence numbers surged [61,62,63,64,65,66]. In contrast, mortality data—often delayed or underreported—may fail to create the same urgency, and the substantial donor funding directed toward treatment may further diminish the domestic political will and government motivation to adjust spending in response to death rates [67]. While uncertainties remain regarding the resumption of USAID programmes and funding initiatives, we recommend that African policymakers actively explore alternative and diversified health financing opportunities tailored to local needs. In doing so, it is crucial to engage closely with other international donors and regional development partners including the World Health Organisation and the World Bank, to build a broader funding base while simultaneously increasing domestic public health spending to reduce reliance on any single funding source. Moreover, it is important to consider integrating HIV/AIDS programmes into broader health systems to optimise resource allocation and programme efficacy. Strengthening coordination among governments, donors, and local communities will enhance resource utilisation and build a resilient, sustained response to HIV/AIDS across the continent.

4.3. Robustness of the Results

Our simulation-based sensitivity analysis indicates that our main results are robust to unmeasured confounding. For HIV/AIDS incidence, the adjusted coefficients for U.S. DAH and other international donor funding remained consistently negative with only modest fluctuations under plausible confounder strengths (λ between 0.1 and 0.5), indicating a robust inverse relationship with incidence. However, GHES consistently shows a positive effect, reflecting reactive spending in response to a higher epidemic burden. For HIV/AIDS mortality, whereas Other DAH retained a consistently negative association even under extreme confounding (λ = 0.9), GHES continued to show a stable positive relationship. Similarly, U.S. DAH was consistently associated with higher mortality. However, while our analysis supports the stability of this positive association between U.S. DAH and HIV/AIDS mortality, the fact that the primary model did not yield a statistically significant result means that this should be interpreted with caution. The simulation does not prove a causal relationship but rather suggests that the observed non-significant association is not merely an artefact of omitted variable bias within the tested range and assumptions.
The jackknife analysis, in which each composite country–sex unit was sequentially removed, revealed that the key three-way interaction effect among U.S. DAH, other donor DAH, and GHES was remarkably stable, even when excluding high-funding countries such as Kenya and South Africa. Moreover, comparisons between the full sample (1990–2021) and the pre-COVID sub-sample (1990–2019) showed that the primary funding (U.S. DAH, Other DAH, and GHES) effects and interactions persisted across both periods, further reinforcing the robustness of our findings.

4.4. Strengths and Limitations

One of the major strengths of this study is its comprehensive analysis of DAH flows to Africa over the last 33 years. Utilising multi-level mixed-effects models with post-estimation BLUP enhanced the robustness of our study by providing precise, unbiased estimates of the effects of diversified funding on HIV/AIDS outcomes. Our simulation-based sensitivity analyses and further robustness checks reinforced the validity of our findings. Incorporating social and ecological concepts into our discussion also provided a theoretically grounded exploration of how diverse funding streams may individually and jointly influence HIV/AIDS outcomes. Thus, our study extends existing knowledge by demonstrating the direct effects and moderating role of U.S. DAH in shaping HIV/AIDS incidence and mortality in Africa.
Despite these valuable insights, our study is not without limitations. Although not the aim of this study, measurement errors in funding allocations and the inherent constraints of ecological designs restrict our ability to draw causal inferences. Moreover, the ecological fallacy in aggregated study designs means that country-level associations may not accurately reflect individual-level risks. To mitigate this, we carefully confined our interpretations to population-level inferences rather than extending them to individual causality. It is important to also note that the validity of our simulation-based sensitivity analysis rests on two key assumptions: first, that the hypothetical confounder, U, is drawn from a standard normal distribution; and second, that U is associated with our primary predictors (U.S. DAH, Other DAH, and GHE) via a range of plausible lambda values (0.1 to 0.9), capturing the strength of these associations. However, we acknowledge that these idealised assumptions may oversimplify the inherent complexity and variability found in real-world situations.
Future epidemiological research focusing on Africa would benefit from incorporating sub-national data and qualitative methodologies to further explore the mechanisms underlying funding synergy. A critical evaluation of locally embedded challenges could enhance our understanding of how DAH impacts different contexts, ultimately informing more effective resource allocation strategies.

5. Conclusions

Our study examined international aid disbursement for HIV/AIDS control and evolving patterns among African countries, from 1990 to 2022. It also investigated how U.S. DAH interacted with other donors and domestic general government health funding, and further explored what these historical associations might imply for future trends. As with previous studies, our findings indicate that the U.S. public sector has contributed largely to the fight against HIV/AIDS in Africa through its international DAH initiatives. Returning to the initial questions posed, it is now possible to state that in addition to exerting a direct effect, the U.S. public sector-specific DAH moderates the effect of other international donor funding and domestic government health spending on HIV/AIDS incidence and mortality. Learning from these historical trends and funding interactions, we conclude that the cut in U.S. DAH flow through suspension of the USAID programmes, if not counterbalanced with alternative funding or increases in domestic funding and other donor interventions, risks eroding the long-established progress in HIV/AIDS control in Africa, especially in areas already vulnerable to systemic challenges. However, any future effects are contingent on the allocation of other resources and the resilience of African countries to evolving challenges, including disease patterns.

Supplementary Materials

The following supporting information can be downloaded at: https://www.mdpi.com/article/10.3390/venereology4020008/s1, Figure S1: Data analysis flowchart; Figure S2: Flipped two-way scatter plot showing population-specific random slope for the United States public sector-specific development assistance for health (DAH); Figure S3: Line plots of simulated adjusted coefficients for three health financing measures against varying levels of λ, which represent assumptions about the strength of an unmeasured confounder of the association between the predictors and HIV/AIDS outcomes; Table S1: List of variables and sources of data used to write this study.

Author Contributions

Conceptualisation, R.N., M.C. and A.A.F.; methodology, R.N., C.L., D.A.-N. and A.A.F.; Investigation, M.C., R.N. and R.D.M.B.; software, R.N. and R.D.M.B.; validation, D.A.-N., M.C., A.G.A.-A., A.A.F., R.D.M.B., N.A., F.A.M., E.G., B.A.-K. and C.L.; formal analysis, R.N.; resources, R.N., P.T.L., N.A., E.G. and F.A.M.; data curation, R.N.; writing—original draft preparation, R.N.; writing—review and editing, D.A.-N., A.G.A.-A., R.D.M.B., F.A.M., E.G., M.C., A.A.F., C.L., B.A.-K. and P.T.L.; visualisation, R.N., N.A., C.L., A.A.F., R.D.M.B., E.G., B.A.-K. and A.G.A.-A.; supervision, M.C., D.A.-N., P.T.L., A.G.A.-A., B.A.-K. and A.A.F.; project administration, R.N. and N.A. All authors have read and agreed to the published version of the manuscript.

Funding

This research received no external funding.

Institutional Review Board Statement

Not applicable.

Informed Consent Statement

Not applicable.

Data Availability Statement

The original data presented in the study are openly available in publicly accessible repositories (See Table S1).

Acknowledgments

We would like to express our sincere gratitude to the Global Burden of Disease (GBD) Collaborative Network, the Institute for Health Metrics and Evaluation (IHME), the World Bank, and the World Inequality Lab for providing the comprehensive dataset used to write this study. Their dedication to collecting and curating global health and socio-economic data has been invaluable to our research and the wider public health community.

Conflicts of Interest

The authors declare no conflicts of interest.

Abbreviations

The following abbreviations are used in this manuscript:
AHPCAllied Health Professions Council
AICAkaike Information Criterion
BICBayesian Information Criterion
BLUPBest Linear Unbiased Prediction
CARCentral African Republic
CIConfidence Interval
COVID-19Coronavirus Disease 2019
DAHDevelopment Assistance for Health
DRCDemocratic Republic of the Congo
GBDGlobal Burden of Disease
GHESDomestic General Government Health Expenditure per capita
GMMGeneralised Method of Moments
HIV/AIDSHuman Immunodeficiency Virus/Acquired Immunodeficiency Syndrome
ICCInterclass Correlation
IHMEInstitute for Health Metrics and Evaluation
IQRInterquartile Range
IVInstrumental Variable
MLEMaximum Likelihood Estimation
MTCTMother-to-Child Transmission
OOPOut-of-Pocket Health Expenditure
PEPFARPresident’s Emergency Plan for AIDS Relief
PPPPurchasing Power Parity
PPPSPre-paid Private Health Spending
RMLERestricted Maximum Likelihood Estimation
SDStandard Deviation
SDISocio-Demographic Index
SEStandard Error
SSASub-Saharan Africa
SSARSDSub-Saharan Africa Research for Sustainable Development
TBTuberculosis
UHCUniversal Health Coverage
UNUnited Nations
UNAIDSJoint United Nations Programme on HIV/AIDS
U.S.United States
USAIDUnited States Agency for International Development
WIDWorld Identity Database

References

  1. Chang, A.Y.; Cowling, K.; Micah, A.E.; Chapin, A.; Chen, C.S.; Ikilezi, G.; Sadat, N.; Tsakalos, G.; Wu, J.; Younker, T.; et al. Past, Present, and Future of Global Health Financing: A Review of Development Assistance, Government, out-of-Pocket, and Other Private Spending on Health for 195 Countries, 1995–2050. Lancet 2019, 393, 2233–2260. [Google Scholar] [CrossRef] [PubMed]
  2. Micah, A.E.; Su, Y.; Bachmeier, S.D.; Chapin, A.; Cogswell, I.E.; Crosby, S.W.; Cunningham, B.; Harle, A.C.; Maddison, E.R.; Moitra, M.; et al. Health Sector Spending and Spending on HIV/AIDS, Tuberculosis, and Malaria, and Development Assistance for Health: Progress towards Sustainable Development Goal 3. Lancet 2020, 396, 693–724. [Google Scholar] [CrossRef] [PubMed]
  3. The Global Fund Annual Financial Report. The Global Fund: Geneva, Switzerland, 2023; pp. 1–65.
  4. Dieleman, J.L.; Schneider, M.T.; Haakenstad, A.; Singh, L.; Sadat, N.; Birger, M.; Reynolds, A.; Templin, T.; Hamavid, H.; Chapin, A.; et al. Development Assistance for Health: Past Trends, Associations, and the Future of International Financial Flows for Health. Lancet 2016, 387, 2536–2544. [Google Scholar] [CrossRef] [PubMed]
  5. U.S. President’s Emergency Plan for AIDS Relief Monitoring, Evaluation, and Reporting Indicator Reference Guide; PEPFAR: Washington, DC, USA, 2022; Volume 2.6.1, pp. 154–196.
  6. Bendavid, E. Past and Future Performance: PEPFAR in the Landscape of Foreign Aid for Health. Curr. HIV/AIDS Rep. 2016, 13, 256–262. [Google Scholar] [CrossRef]
  7. Bekker, L.G.; Alleyne, G.; Baral, S.; Cepeda, J.; Daskalakis, D.; Dowdy, D.; Dybul, M.; Eholie, S.; Esom, K.; Garnett, G.; et al. Advancing Global Health and Strengthening the HIV Response in the Era of the Sustainable Development Goals: The International AIDS Society—Lancet Commission. Lancet 2018, 392, 312–358. [Google Scholar] [CrossRef]
  8. Viriyathorn, S.; Sachdev, S.; Wanwong, Y.; Patcharanarumol, W.; Tangcharoensathien, V. The Impact of HIV Spending on Health Outcomes in Thailand. World J. AIDS 2021, 11, 85–100. [Google Scholar] [CrossRef]
  9. Kim, S.; Tadesse, E.; Jin, Y.; Cha, S. Association between Development Assistance for Health and Disease Burden: A Longitudinal Analysis on Official Development Assistance for HIV/AIDS, Tuberculosis, and Malaria in 2005–2017. Int. J. Environ. Res. Public Health 2022, 19, 14091. [Google Scholar] [CrossRef]
  10. Hsiao, A.J.; Emdin, C.A. The Association between Development Assistance for Health and Malaria, HIV and Tuberculosis Mortality: A Cross-National Analysis. J. Epidemiol. Glob. Health 2015, 5, 41–48. [Google Scholar] [CrossRef]
  11. Xie, S.; Du, S.; Huang, Y.; Luo, Y.; Chen, Y.; Zheng, Z.; Yuan, B.; Xu, M.; Zhou, S. Evolution and Effectiveness of Bilateral and Multilateral Development Assistance for Health: A Mixed-Methods Review of Trends and Strategic Shifts (1990-2022). BMJ Glob. Health 2025, 10, e017818. [Google Scholar] [CrossRef]
  12. Neel, A.H.; Rodríguez, D.C.; Sikazwe, I.; Pillay, Y.; Barron, P.; Pereira, S.K.; Makakole-Nene, S.; Bennett, S.C. HIV Programme Sustainability in Southern and Eastern Africa and the Changing Role of External Assistance for Health. Health Policy Plan. 2024, 39, I107–I117. [Google Scholar] [CrossRef]
  13. Dzinamarira, T.; Rwibasira, G.; Mwila, L.; Moyo, E.; Mangoya, D.; Moyo, P.; Oladele, E.; Akinjeji, A.; Chimene, M.; Muvunyi, C.M. Advancing Sustainable HIV Services Through Integration in Primary Healthcare in Sub-Saharan Africa: A Perspective on Practical Recommendations. Healthcare 2025, 13, 192. [Google Scholar] [CrossRef] [PubMed]
  14. World Health Organisation. Building Health System Resilience to Public Health Challenges Guidance for Implementation in Countries; World Health Organisation: Geneva, Switzerland, 2024; pp. 1–58. [Google Scholar]
  15. Elsey, H.; Agyepong, I.; Huque, R.; Quayyem, Z.; Baral, S.; Ebenso, B.; Kharel, C.; Shawon, R.A.; Onwujekwe, O.; Uzochukwu, B.; et al. Rethinking Health Systems in the Context of Urbanisation: Challenges from Four Rapidly Urbanising Low-Income and Middle-Income Countries. BMJ Glob. Health 2019, 4, e001501. [Google Scholar] [CrossRef] [PubMed]
  16. Lagomarsino, G.; Garabrant, A.; Adyas, A.; Muga, R.; Otoo, N. Moving towards Universal Health Coverage: Health Insurance Reforms in Nine Developing Countries in Africa and Asia. Lancet 2012, 380, 933–943. [Google Scholar] [CrossRef]
  17. The White House Presidential Actions—Reevaluating and Realigning United States Foreign AID. Available online: https://www.whitehouse.gov/presidential-actions/2025/01/reevaluating-and-realigning-united-states-foreign-aid/ (accessed on 22 March 2025).
  18. Kobayashi, Y.; Heinrich, T.; Bryant, K.A. Public Support for Development Aid during the COVID-19 Pandemic. World Dev. 2021, 138, 105248. [Google Scholar] [CrossRef]
  19. Deng, P.; Chen, M.; Si, L. Temporal Trends in Inequalities of the Burden of HIV/AIDS across 186 Countries and Territories. BMC Public Health 2023, 23, 981. [Google Scholar] [CrossRef]
  20. Ataguba, J.E.O.; Birungi, C.; Cunial, S.; Kavanagh, M. Income Inequality and Pandemics: Insights from HIV/AIDS and COVID-19—A Multicountry Observational Study. BMJ Glob. Health 2023, 8, e013703. [Google Scholar] [CrossRef]
  21. Oladosu, A.O.; Chanimbe, T.; Anaduaka, U.S. Effect of Public Health Expenditure on Health Outcomes in Nigeria and Ghana. Health Policy OPEN 2022, 3, 100072. [Google Scholar] [CrossRef]
  22. Madigan, E.A.; Curet, O.L.; Zrinyi, M. Workforce Analysis Using Data Mining and Linear Regression to Understand HIV/AIDS Prevalence Patterns. Hum. Resour. Health 2008, 6, 2. [Google Scholar] [CrossRef]
  23. Odugbesan, J.A.; Rjoub, H. Relationship among HIV/AIDS Prevalence, Human Capital, Good Governance, and Sustainable Development: Empirical Evidence from Sub-Saharan Africa. Sustainability 2019, 11, 1348. [Google Scholar] [CrossRef]
  24. Bronfenbrenner, U. Toward an Experimental Ecology of Human Development. Am. Psychol. 1977, 32, 513–531. [Google Scholar] [CrossRef]
  25. Dahlgren, G.; Whitehead, M. The Dahlgren-Whitehead Model of Health Determinants: 30 Years on and Still Chasing Rainbows. Public Health 2021, 199, 20–24. [Google Scholar] [CrossRef] [PubMed]
  26. Sola, O.; Irwin, A. A Conceptual Framework for Action on the Social Determinants of Health. In Social Determinants of Health Discussion Paper 2 (Policy and Practice); World Health Organisation: Geneva, Switzerland, 2010; pp. 1–76. [Google Scholar]
  27. Nketia, R. The Sub-Saharan Africa Research for Sustainable Development (SSARSD) Project. Available online: https://ssarsdproject.org/ (accessed on 27 January 2025).
  28. Appiah, E.K.; Arko-Achemfuor, A.; Adeyeye, O.P. Appreciation of Diversity and Inclusion in Sub-Sahara Africa: The Socioeconomic Implications. Cogent Soc. Sci. 2018, 4, 1521058. [Google Scholar] [CrossRef]
  29. The World Bank. The World Bank In Africa: Overview. Available online: https://www.worldbank.org/en/region/afr/overview (accessed on 25 July 2024).
  30. United Nations Development Programme. The Rise of the South: Human Progress in a Diverse World. Human Development Report 2013; United Nations Development Programme: New York, NY, USA, 2013; pp. 1–28. [Google Scholar]
  31. World Health Organisation Regional Office for Africa. Atlas of African Health Statistics 2022: Health Situation Analysis of the WHO African Region—Country Profiles; WHO Regional Office for Africa: Brazzaville, Congo, 2022; pp. 1–99. [Google Scholar]
  32. Naghavi, M.; Ong, K.L.; Aali, A.; Ababneh, H.S.; Abate, Y.H.; Abbafati, C.; Abbasgholizadeh, R.; Abbasian, M.; Abbasi-Kangevari, M.; Abbastabar, H.; et al. Global Burden of 288 Causes of Death and Life Expectancy Decomposition in 204 Countries and Territories and 811 Subnational Locations, 1990–2021: A Systematic Analysis for the Global Burden of Disease Study 2021. Lancet 2024, 403, 2100–2132. [Google Scholar] [CrossRef]
  33. Chancel, L.; Piketty, T.; Saez, E.; Zucman, G.; Duflo, E.; Banerjee, A. Global Inequality Report. 2022. Available online: https://wir2022.wid.world/ (accessed on 22 January 2025).
  34. Dieleman, J.; Campbell, M.; Chapin, A.; Eldrenkamp, E.; Fan, V.Y.; Haakenstad, A.; Kates, J.; Liu, Y.; Matyasz, T.; Micah, A.; et al. Evolution and Patterns of Global Health Financing 1995–2014: Development Assistance for Health, and Government, Prepaid Private, and out-of-Pocket Health Spending in 184 Countries. Lancet 2017, 389, 1981–2004. [Google Scholar] [CrossRef]
  35. Mathers, C.D. History of Global Burden of Disease Assessment at the World Health Organisation. Arch. Public Health 2020, 78, 77. [Google Scholar] [CrossRef]
  36. Meteyard, L.; Davies, R.A.I. Best Practice Guidance for Linear Mixed-Effects Models in Psychological Science. J. Mem. Lang. 2020, 112, 104092. [Google Scholar] [CrossRef]
  37. Harrison, X.A.; Donaldson, L.; Correa-Cano, M.E.; Evans, J.; Fisher, D.N.; Goodwin, C.E.D.; Robinson, B.S.; Hodgson, D.J.; Inger, R. A Brief Introduction to Mixed Effects Modelling and Multi-Model Inference in Ecology. PeerJ 2018, 6, e4794. [Google Scholar] [CrossRef]
  38. Huang, P.H. Asymptotics of AIC, BIC, and RMSEA for Model Selection in Structural Equation Modelling. Psychometrika 2017, 82, 407–426. [Google Scholar] [CrossRef]
  39. West, R.M. Best Practice in Statistics: The Use of Log Transformation. Ann. Clin. Biochem. 2022, 59, 162–165. [Google Scholar] [CrossRef]
  40. Morgenstern, H. Ecologic Studies in Epidemiology: Concepts, Principles, and Methods. Annu. Rev. Public Health 1995, 16, 61–81. [Google Scholar] [CrossRef]
  41. Thomopoulos, N.T. Generating Random Variates. In Essentials of Monte Carlo Simulation; Thomopoulos, N.T., Ed.; Springer: New York, NY, USA, 2013; pp. 15–26. [Google Scholar]
  42. D’Agostino McGowan, L. Sensitivity Analyses for Unmeasured Confounders. Curr. Epidemiol. Rep. 2022, 9, 361–375. [Google Scholar] [CrossRef]
  43. Belotti, F.; Peracchi, F. Fast Leave-One-out Methods for Inference, Model Selection, and Diagnostic Checking. Stata J. 2020, 20, 785–804. [Google Scholar] [CrossRef]
  44. Barber, R.F.; Candès, E.J.; Ramdas, A.; Tibshirani, R.J. Predictive Inference with the Jackknife+. Ann. Stat. 2021, 49, 486–507. [Google Scholar] [CrossRef]
  45. Imbens, G.W. Instrumental Variables: An Econometricians’s Perspective. Stat. Sci. 2014, 29, 323–358. [Google Scholar] [CrossRef]
  46. Cui, G.; Norkute, M.; Sarafidis, V.; Yamagata, T. Two-Stage Instrumental Variable Estimation of Linear Panel Data Models with Interactive Effects. Econom. J. 2022, 25, 340–361. [Google Scholar] [CrossRef]
  47. Ullah, S.; Zaefarian, G.; Ullah, F. How to Use Instrumental Variables in Addressing Endogeneity? A Step-by-Step Procedure for Non-Specialists. Ind. Mark. Manag. 2021, 96, A1–A6. [Google Scholar] [CrossRef]
  48. Kruiniger, H. GMM Estimation and Inference in Dynamic Panel Data Models with Persistent Data. Econom. Theory 2009, 25, 1348–1391. [Google Scholar] [CrossRef]
  49. Bun, M.J.G.; Sarafidis, V. Dynamic Panel Data Models; UvA-Econometrics Discussion Paper; University of Amsterdam: Amsterdam, The Netherlands, 2013; pp. 1–36. [Google Scholar]
  50. Yu, P.; Liao, Q.; Phillips, P.C.B. New Control Function Approaches in Threshold Regression with Endogeneity. Econom. Theory 2023, 40, 1065–1119. [Google Scholar] [CrossRef]
  51. Wooldridge, J.M.W. Control Function Methods in Applied Econometrics. J. Hum. Resour. 2018, 50, 420–445. [Google Scholar] [CrossRef]
  52. Kiviet, J.F.; Kripfganz, S. Instrument Approval by the Sargan Test and Its Consequences for Coefficient Estimation. Econ. Lett. 2021, 205, 109935. [Google Scholar] [CrossRef]
  53. StataCorp. Stata Statistical Software: Release 18. StataCorp LLC: College Station, TX, USA, 2023. [Google Scholar]
  54. Kutzin, J. Health Financing for Universal Coverage and Health System Performance: Concepts and Implications for Policy. Bull. World Health Organ. 2013, 91, 602–611. [Google Scholar] [CrossRef] [PubMed]
  55. Amiri, M.M.; Kazemian, M.; Motaghed, Z.; Abdi, Z. Systematic Review of Factors Determining Health Care Expenditures. Health Policy Technol. 2021, 10, 100498. [Google Scholar] [CrossRef]
  56. The Joint United Nations Programme on HIV/AIDS Impact of US Funding Cuts on the Global AIDS Response—28 March 2025 Update. Available online: https://www.unaids.org/en/resources/presscentre/featurestories/2025/march/20250328_sitrep (accessed on 11 May 2025).
  57. Ndjeka, N.; Kubjane, M.; Abdullah, F.; Mohr-Holland, E.; Subrayen, P.; Loveday, M.; Dube, M.; Boffa, J. Impact of US Funding Cuts and Stop Work Orders on TB Services and Research in South Africa. IJTLD Open 2025, 2, 241–243. [Google Scholar] [CrossRef]
  58. Atun, R.; De Jongh, T.; Secci, F.; Ohiri, K.; Adeyi, O. Integration of Targeted Health Interventions into Health Systems: A Conceptual Framework for Analysis. Health Policy Plan. 2010, 25, 104–111. [Google Scholar] [CrossRef]
  59. Biesma, R.G.; Brugha, R.; Harmer, A.; Walsh, A.; Spicer, N.; Walt, G. The Effects of Global Health Initiatives on Country Health Systems: A Review of the Evidence from HIV/AIDS Control. Health Policy Plan. 2009, 24, 239–252. [Google Scholar] [CrossRef]
  60. Sparkes, S.P.; Bump, J.B.; Özçelik, E.A.; Kutzin, J.; Reich, M.R. Political Economy Analysis for Health Financing Reform. Health Syst. Reform 2019, 5, 183–194. [Google Scholar] [CrossRef]
  61. Carlisle, D. AIDS Will Affect Us All Eventually, Mandela Tells London Audience. BMJ 2003, 327, 122. [Google Scholar] [CrossRef]
  62. The Joint United Nations Programme on HIV/AIDS. The Media and HIV/AIDS: Making a Difference; UNAIDS: Geneva, Switzerland, 2004; pp. 1–25. [Google Scholar]
  63. Stein, J. HIV/AIDS and the Media: A Literature Review; The Centre for AIDS Development, Research and Evaluation (Cadre): Johannesburg, South Africa, 2001; pp. 1–18. [Google Scholar]
  64. Lacroix, J.M.; Snyder, L.B.; Huedo-medina, T.B.; Johnson, B.T. Effectiveness of Mass Media Interventions for HIV Prevention, 1986–2013: A Meta-Analysis. J. Acquir. Immune Defic. Syndr. 2014, 66, S329–S340. [Google Scholar] [CrossRef]
  65. Peltzer, K.; Parker, W.; Mabaso, M.; Makonko, E.; Zuma, K.; Ramlagan, S. Impact of National HIV and AIDS Communication Campaigns in South Africa to Reduce HIV Risk Behaviour. Sci. World J. 2017, 2012, 384608. [Google Scholar] [CrossRef]
  66. Jones, P.S. “A Test of Governance”: Rights-Based Struggles and the Politics of HIV/AIDS Policy in South Africa. Polit. Geogr. 2005, 24, 419–447. [Google Scholar] [CrossRef]
  67. Lu, C.; Schneider, M.T.; Gubbins, P.; Leach-Kemon, K.; Jamison, D.; Murray, C.J. Public Financing of Health in Developing Countries: A Cross-National Systematic Analysis. Lancet 2010, 375, 1375–1387. [Google Scholar] [CrossRef] [PubMed]
Figure 1. Conceptual Framework. This figure was developed based on insights drawn from relevant sources, ensuring that it reflects key factors influencing HIV/AIDS outcomes in Africa. The concentric circles illustrate the various macro- and structural-level factors shaping HIV/AIDS outcomes in Africa. The outermost ring represents upstream factors at the global level, emphasising development assistance for health (DAH) from the United States (U.S.) Public Sector and other international donors. The middle ring encapsulates mid-stream factors at the regional and sub-regional levels, including strategies, coordinated policies, and agreements guiding initiatives across African sub-regions. The innermost ring reflects downstream factors at the country level, encompassing socio-economic determinants (e.g., socio-demographic index, income distribution/inequality, population density), health policy and financing (including domestic public health spending, out-of-pocket health spending, and prepaid private health spending), as well as the adequacy and distribution of the health workforce (physician density). Additionally, unmeasured confounders such as political stability, cultural attitudes towards HIV/AIDS, and social stigma play a crucial role. At the core of this framework lie HIV/AIDS incidence and mortality outcomes, quantified by annual incidence and mortality rates per 100,000 people. The bidirectional arrows denote feedback loops, illustrating how factors across different levels of the causal chain interact, influencing one another and ultimately shaping the outcome. Due to data availability constraints, only variables highlighted in the pink boxes were included in the statistical analysis.
Venereology 04 00008 g001
Figure 2. Interaction Plots showing Marginal Effects of Domestic Government Health Spending and Development Assistance for Health (DAH) Funding from International Donors (Excluding the United States (U.S.) Public Sector) on HIV/AIDS Incidence and Mortality Rates at Different Levels of U.S. Public Sector-Specific DAH among African Countries. (A) Effects of Other International Donor DAH (Green) and GHES (Red) on HIV/AIDS incidence rate at different levels of the U.S. Public Sector-specific DAH funding; (B) Effects of Other International Donor DAH (Green) and GHES (Red) on HIV/AIDS mortality rate at different levels of U.S. Public Sector-specific DAH. As illustrated in (A), for example, in countries where U.S. DAH is low (–1 standard deviation (SD)), the effect of other international DAH on HIV/AIDS incidence is negligible. However, at average levels of U.S. DAH (Mean = 0), an increase in other international DAH (+1 SD) is associated with a significant decrease in HIV/AIDS incidence, and this reduction is even more pronounced when U.S. DAH is high (+1 SD). Similar patterns were observed for domestic spending, with a strong positive effect (coefficient) at low U.S. DAH and a negative effect at high levels.
Venereology 04 00008 g002
Figure 3. Predicted HIV/AIDS incidence and mortality rates at different levels of the United States (U.S.) public sector-specific Development Assistance for Health (DAH), other International Donor funding (Other DAH) and Domestic General Government Health Spending (GHES). (A) Predicted HIV/AIDS incidence rate when Other DAH is low and U.S. DAH and GHES are varied from low to high; (B) Predicted HIV/AIDS incidence rate when Other DAH is at its average and U.S. DAH and GHES are varied from low to high; (C) Predicted HIV/AIDS incidence rate when Other DAH is high and U.S. DAH and GHES are varied from low to high; (D) Predicted HIV/AIDS mortality rate when Other DAH is low and U.S. DAH and GHES are varied from low to high; (E) Predicted HIV/AIDS mortality rate when Other DAH is at its average and U.S. DAH and GHES are varied from low to high; (F) Predicted HIV/AIDS mortality rate when Other DAH is high and U.S. DAH and GHES are varied from low to high. For example, the combination of high U.S. DAH (+2.83), high other donor DAH (+3.64), and high GHES (+1.43) corresponds to the lowest predicted HIV/AIDS incidence rate (C), while the combination of low U.S. DAH (−2.83), high Other DAH, and high GHES yields relatively higher predicted mortality rate (F).
Venereology 04 00008 g003
Table 1. Sources and distribution of HIV/AIDS-specific development assistance for health (DAH) across Africa, 1990–2022.
United States Public SectorOther International Donors
Region/Country19902022Total (1990–2022)MedianInterquartile Range (IQR)19902022Total (1990–2022)MedianIQR
Central Africa
Angola22017,048292,4509848647–15,0898210,796259,79649611622–12,693
Cameroon296101,689622,5475524223–27,6088847,896579,14618,300579–30,458
Central African Republic6910,19286,471195475–30611915,485247,0696393345–12,523
Chad1598899111,4481428342–6892257714,342329,34869652975–15,469
Congo50415242,420111739–192287841145,8673695515–7563
Democratic Republic of Congo980103,0101,065,90717,5411038–61,34410,01555,5021,262,14244,1852738–67,400
Equatorial Guinea2103381010–1033260834,0811232,143
Gabon2169815,85322512–8312333961,981154422–2921
Sao Tome and Principe8202313,8851176–6211489853,72866825–2647
Sub-region1805247,8142,254,79170339–552412,795162,7072,973,1582975302–11,262
Eastern Africa
Burundi20524,949233,8864201205–12,2599616,753426,65815,111882 - 20,138
Comoros1185113,67118533–6971361557,257733157–2807
Djibouti2661133,65062826–177463291117,9033516179–6146
Eritrea131417797,4582739143–4186157617260,5227617856–12,507
Ethiopia2426146,9343,492,49282,3874055–187,851376488,8652,396,74670,53614,179–88,865
Kenya3409324,1096,430,490161,95914,219–372,81018,973109,0572,033,82067,56520,892–98,800
Madagascar195401578,6172533212–3476307807200,7635402232–9378
Malawi1308209,9162,013,29035,21911,341–90,054209584,2572,111,73871,71412,147–114,210
Mauritius104289717165–4111321948,4542369–2972
Mozambique1992382,5584,042,44863,9902166–244,6193336108,2941,957,06363,0165461–108,294
Rwanda313,90386,0282,069,01263,4903504–86,66799,98734,1891,397,18834,1895200–59,871
Seychelles00188600–100968600–72
Somalia132410344,58970693–2240167497142,6123141118–7933
South Sudan15454,466240,929294112–14,3016030,362205,6051098257–11,904
Tanzania0314,0375,071,245112,1607850–314,03726,79064,9872,349,79264,22917,352–119,253
Uganda2307310,4915,398,838176,2548763–299,376221393,2881,824,54057,25121,022–86,849
Zambia1733270,5984,107,366112,26111,847–228,169280368,1151,678,90654,3449346–76,743
Zimbabwe1439194,9291,778,47634,5907816–97,34611,17281,3412,275,02564,96018,686–115,723
Sub-region329,3812,333,20035,158,0603520.5205–70,262171,358812,55419,494,27892341166–57,740
Northern Africa
Algeria10389425750–1370177030,25113612–1544
Egypt16351722,8442809–10210581959,7491093361–2999
Libya3018500–30128228,053779–1282
Morocco46512131,9355553–135007463122,77834901905–5514
Sudan22212,410203,0262567159–12,2444118,314385,0039045508–17,907
Tunisia27145913,007290–5530304744,7144206–2139
Sub-region32422,896275,254440–8644137,695670,548126245–3371
Southern Africa
Botswana77534,1981,341,18134,198843–56,66210705879304,50864941280–15,802
Eswatini053,531673,23782420–39,47606507325,2526797400–16,379
Lesotho41065,370577,3173342293–30,31322515,984408,95412,6021291–22,882
Namibia70771,0821,347,38332,218707–71,08213858678486,84212,0002737–21,966
South Africa3677522,5978,135,678164,48715,185–468,2933164112,3592,538,44694,2038647–112,496
Sub-region5569746,77812,074,79624,625544–60,3035844149,4074,064,00211,3562123–23,821
Western Africa
Benin20011,866144,0163649262–75834412,585317,88612,137746–15,581
Burkina Faso27111,716172,9282995504–82408513,410643,46016,0767933–29,425
Cabo Verde057186011150–482068029,4716800–1535
Cote d’Ivoire67771,6961,512,83133,287526–85,71021025,708531,34413,5103966–25,473
Gambia0311453,61120210–279003825145,7754973286–7306
Ghana41330,709604,77319,4966904–28,54010832,464941,25431,3521830–45,967
Guinea11415,583132,54538481495–51483720,816230,98965481951–10,859
Guinea-Bissau55512055,44855555–34322798668164,0062834752–8668
Liberia10710,480127,521195979–7275519827248,5367661266–12,708
Mali15813,360204,60969012386–892413718,257343,61611,9541439–16,381
Mauritania11185016,7713459–7613529770,1621224131–3620
Niger148952557,4251687148–24614516,178226,4028384657–11,350
Nigeria1999216,9355,061,49390,1651999–274,701144194,4712,286,51052,8679432–112,113
Senegal20212,1662,51,02583372129–12,1666716,173358,76710,8323704–16,506
Sierra Leone15518,8331,37,7821956112–76413217,635302,1038566192–15,796
Togo14415,17194,8081784102–42583315,524234,9416387490–11,908
Sub-region4654448,6958,636,1872311170–804225723,11,5187,075,2226392752–15,499.5
Overall (Africa)341,7333,799,38358,399,088167993–12,672192,6101,473,88134,277,2085194676–18,036
Table 2. Results of multi-level linear mixed-effects models showing the association between various funding streams and HIV/AIDS incidence and mortality rate in Africa.
EffectsHIV/AIDS IncidenceHIV/AIDS Mortality
CoefficientSE95% CIpCoefficientSE95% CIp
Fixed Effects
U.S._DAH−0.0470.017−0.081 to−0.0130.006 *0.0270.024−0.019 to 0.0730.254
Other_DAH−0.0460.006−0.057 to −0.035<0.001 *−0.0070.007−0.022 to 0.0070.301
U.S._DAH#Other_DAH−0.0130.001−0.015 to −0.010<0.001 *−0.0250.002−0.028 to −0.022<0.001 *
GHES0.1080.0210.066 to 0.150<0.001 *0.1330.0280.079 to 0.187<0.001 *
U.S._DAH#GHES−0.0930.004−0.102 to −0.084<0.001 *−0.1420.006−0.154 to −0.131<0.001 *
Other_DAH#GHES0.0160.0040.009 to 0.023<0.001 *0.0010.005−0.008 to 0.0100.842
U.S._DAH#Other_DAH#GHES0.00010.001−0.001 to 0.0010.8380.0040.0010.002 to 0.006<0.001 *
Physician density0.0240.039−0.054 to 0.1010.550−0.1000.051−0.199 to −0.0010.049 *
Gini coefficient0.4680.1540.167 to 0.7700.002 *0.2270.198−0.161 to 0.6160.251
SDI−1.4920.073−1.635 to −1.349<0.001 *−1.7550.094−1.940 to −1.571<0.001 *
Pre-paid private spending−0.0100.008−0.025 to 0.0040.1660.0280.0100.009 to 0.0470.004 *
Out-of-pocket spending0.2170.0230.172 to 0.262<0.001 *0.2430.0300.185 to 0.301<0.001 *
Sex
FemaleRef - -
Male−0.1580.303−0.751 to 0.4350.601−0.1360.353−0.828 to 0.5560.700
Intercept4.6380.9472.782 to 6.495<0.001 *4.0160.9362.181 to 5.852<0.001 *
Random effects
Sub-region level
Intercept4.2252.8221.141 to 15.641 4.0262.7461.058 to 15.328
Country level
var(U.S._DAH)0.0310.0050.023 to 0.041 0.0580.0090.043 to 0.077
var(intercept)2.4660.3461.873 to 3.247 3.4200.4832.594 to 4.510
cov(U.S._DAH, intercept)0.0010.034−0.064 to 0.067 −0.0620.053−0.166 to 0.042
var(Residual)0.0530.0020.050 to 0.056 0.0880.0020.083 to 0.093
Nsite5 5
Nmix108 108
ICC0.94 0.94
N2700 2700
DAH: development assistance for health. U.S._DAH: U.S. public-sector specific DAH. Other_DAH: DAH from other international donors (excluding U.S. public sector funds). GHES: Domestic general government health spending. SDI: Socio-demographic index. SE: Standard error. CI: Confidence interval. var(U.S._DAH): Variance of the country-level random slope associated with U.S._DAH. cov(U.S._DAH, intercept): Covariance between random slope (U.S._DAH) and random intercept. var(Residual): Variance of the residuals. All variables were log-transformed (natural log), and all predictors were mean-centred. Nsite: Number of sub-region identity (ID) groups. Nmix: Number of CompID clusters (composite ID groups defined by country and sex). ICC: Unconditional (intercept-only) interclass correlation attributable to CompID nested within sub-region ID. N (Observation): Total sample size in the full model. # Interaction term. * Statistically significant at p < 0.05.
Disclaimer/Publisher’s Note: The statements, opinions and data contained in all publications are solely those of the individual author(s) and contributor(s) and not of MDPI and/or the editor(s). MDPI and/or the editor(s) disclaim responsibility for any injury to people or property resulting from any ideas, methods, instructions or products referred to in the content.

