Article

Effect of the Cooling Rate on the Solidification Structure and Phase of a 2:17 Samarium–Cobalt Alloy

1
Metallurgical Technology Institute, Central Iron and Steel Research Institute Co., Ltd., Beijing 100081, China
2
Division of Functional Materials, Central Iron and Steel Research Institute Co., Ltd., Beijing 100081, China
*
Authors to whom correspondence should be addressed.
Alloys 2025, 4(4), 23; https://doi.org/10.3390/alloys4040023
Submission received: 1 August 2025 / Revised: 27 August 2025 / Accepted: 9 October 2025 / Published: 21 October 2025

Abstract

Understanding the way samarium–cobalt alloys solidify at varying cooling rates and the regularities in alloying element distribution is crucial for optimizing subsequent homogenization and annealing processes, leading to an enhancement in the overall quality of the product. The study investigates the effects of rapid water-cooled copper mold (600 °C/min), medium-speed copper mold (100 °C/min), and slow furnace cooling (10 °C/min) on the microstructural evolution, element distribution, and phase transformation of samarium–cobalt (Sm-Co) alloys. The results of the research show that the phase transition temperatures obtained via differential scanning calorimetry (DSC) closely matched those observed in situ by high-temperature laser scanning confocal microscopy (HT-LSCM). Higher cooling rates resulted in notable dendritic refinement and reduced precipitate size. Elemental analysis revealed that Co and Fe exhibited negative segregation, whereas Sm, Cu, and Zr showed positive segregation, with segregation intensity increasing alongside the cooling rate. The principal phases identified included Cu-rich and Zr-rich constituents, the matrix phase, and a gray phase morphologically distinct from the matrix. These correspond to the (Sm, Co, Fe, Cu, Zr)5 phase, (Sm, Zr)(Co, Fe, Cu)3 phase, Sm2(Co, Fe, Cu, Zr)17 phase, and Sm(Co, Fe, Cu, Zr)7 phase. The phase constitution remained consistent across different cooling rates.

1. Introduction

The 2:17 SmCo permanent magnet is extensively employed in aerospace, computing, consumer electronics, electrical engineering, and automotive sectors owing to its superior magnetic performance, high Curie temperature, and excellent corrosion resistance [1,2,3]. Predominant fabrication techniques include powder metallurgy (sintering) [4,5], reduction-diffusion (R/D) processes [6,7], and bonding methods [8,9]. Among these methods, the powder metallurgy method is widely used for the preparation of samarium–cobalt permanent magnets because of its mature process. This method includes steps such as alloy melting, grinding, pressing, sintering, and heat treatment [10]. The resulting magnets demonstrate exceptional magnetic properties and mechanical strength. However, the initial melting process plays a pivotal role in determining the quality and performance of the final product. Consequently, a comprehensive understanding of the melting behavior of an alloy is highly important.
The 2:17 SmCo magnet is a multicomponent alloy developed from a binary Sm-Co system through partial substitution with Fe, Cu, and Zr [11,12,13]. Owing to the limited diffusivity of solute atoms in such complex systems, the solidification behavior of 2:17 SmCo magnets is inherently intricate. The as-cast microstructure is characterized by pronounced elemental segregation, which adversely impacts the uniformity of powder preparation and solid solution treatments, thereby influencing the final material quality. This segregation arises from the disparate solubility characteristics of alloying elements in the liquid and solid phases. During solidification, as the solubility of these elements decreases, solute atoms are expelled from the solidifying front and concentrate in inter-dendritic regions, promoting the formation of segregated microstructures and distinct dendritic morphologies [14,15]. Therefore, investigating the solidification behavior of 2:17 SmCo alloys, identifying the nature of their microstructural features, elucidating phase transformation pathways, and characterizing the segregation tendencies of Sm, Co, Fe, Cu, and Zr are essential steps toward producing compositionally uniform SmCo alloys.
Scholars have conducted extensive research related to the initial melting process of samarium–cobalt magnets. Wang and colleagues [16] employed vacuum induction melting to fabricate samarium–cobalt-based permanent magnet master alloys. To mitigate challenges related to volatilization and oxidation during smelting, they conducted homogenization annealing on the alloys post-melting. Their study examined the influence of the charging vacuum rate and melting power on the vacuum melting process of samarium–cobalt alloys, ultimately identifying the optimal parameters for alloy preparation. Li et al. [17] and others employed a single-factor experimental method to study the degree of overheating during the melting of Sm2Fe17 alloys. Studies on the volatilization and phase precipitation of samarium revealed that overheating markedly enhances samarium volatilization. Furthermore, this increased volatilization significantly influences the phase composition, resulting in a greater proportion of the Fe phase. Yan et al. [18] performed metallographic and compositional analyses on ingots cast with two types of cooling molds—bullet shaped and disk shaped. Three precipitated phases were identified in the ingots: iron-rich cobalt, samarium-rich copper, and zirconium-rich phases. The spatial relationships and distribution patterns of these phases were also characterized. While these studies contribute to the understanding of samarium–cobalt alloys, research remains limited regarding the effects of varying cooling rates on the solidification microstructure and phase transformations.
Research indicates that the cooling rate significantly influences the solidification segregation behavior of alloys. Therefore, this study employed a 2:17-type SmCo alloy ingot system to investigate microstructural evolution during solidification under different cooling rates. Using high-temperature laser scanning confocal microscopy (HT-LSCM), real-time observations were made to monitor variations in dendrite size, microstructural features, and solidification patterns at cooling rates of 10 °C/min, 100 °C/min, and 600 °C/min. Furthermore, elemental segregation was assessed, and the morphological evolution of the microstructure throughout the solidification process was characterized.

2. Experiments

Test materials
The samarium–cobalt alloy used in this work was melted in a vacuum induction melting furnace (VIM) and cast using a water-cooled copper mold. The chemical composition of the ingots analyzed after melting the samarium–cobalt alloy is shown in Table 1.
Experimental Procedure
To directly observe the solidification process of the samarium–cobalt alloy under different cooling rates, in situ observations were conducted via high-temperature laser scanning confocal microscopy (HT-LSCM, VL2000DX-SVF18SP, Lasertec, Yokohama, Japan). HT-LSCM offers the advantage of enabling real-time and continuous observation of melting or crystallization processes on free surfaces at high temperatures. The samples were extracted from the middle of the experimental ingot and processed into cylindrical shapes with a diameter of 7 mm and a height of 3 mm. Before in situ observation, the samples underwent mirror polishing, were placed in an aluminum oxide crucible, and then were inserted into the HT-LSCM chamber. Following several rounds of gas removal with a vacuum pump, the sample chamber was flushed with ultrapure argon gas to avoid surface oxidation of the samples. The experiment was conducted over three solidification processes. The sample was warmed from ambient temperature to 1400 °C, held at this temperature for 1 min to ensure complete melting, then cooled at a rate of 100 °C/min to 1250 °C, followed by further cooling at rates of 10 °C/min, 100 °C/min, and 600 °C/min to reach 1000 °C. Finally, the furnace was shut off at 1000 °C, allowing the sample to cool to room temperature (with a cooling rate of approximately 600 °C/min during this stage). The temperature control program is shown in Figure 1. Real-time video and images were recorded throughout the entire process.
Characterization methods
Samples of samarium cobalt were subjected to DSC testing using the STA-449C-Jupiter model (STA-449C-Jupiter, NETZSCH Inc., Waldkraiburg, Germany). The samples were heated from room temperature at a constant rate of 10 °C/min to 1400 °C and then cooled at a rate of 10 °C/min back to room temperature. Endothermic and exothermic reactions during heating or cooling were identified to determine the phase transition temperatures. The samples observed in situ using a high-temperature laser confocal microscopy (HT-LSCM) were ground and mechanically polished. The samples were etched for 60 s in a solution of 100 mL distilled water + 2 mL glacial acetic acid + 0.5 mL nitric acid, revealing their dendritic structure [19]. The microstructure was analyzed using an optical microscope (OM, Axio Vert. A1, Zeiss, Oberkochen, Germany) and a field-scanning electron microscope (FESEM, 100X, SUPRA 55, ZEISS Inc., Oberkochen, Germany) combined with energy-dispersive X-ray spectroscopy (EDS).

3. Results and Discussion

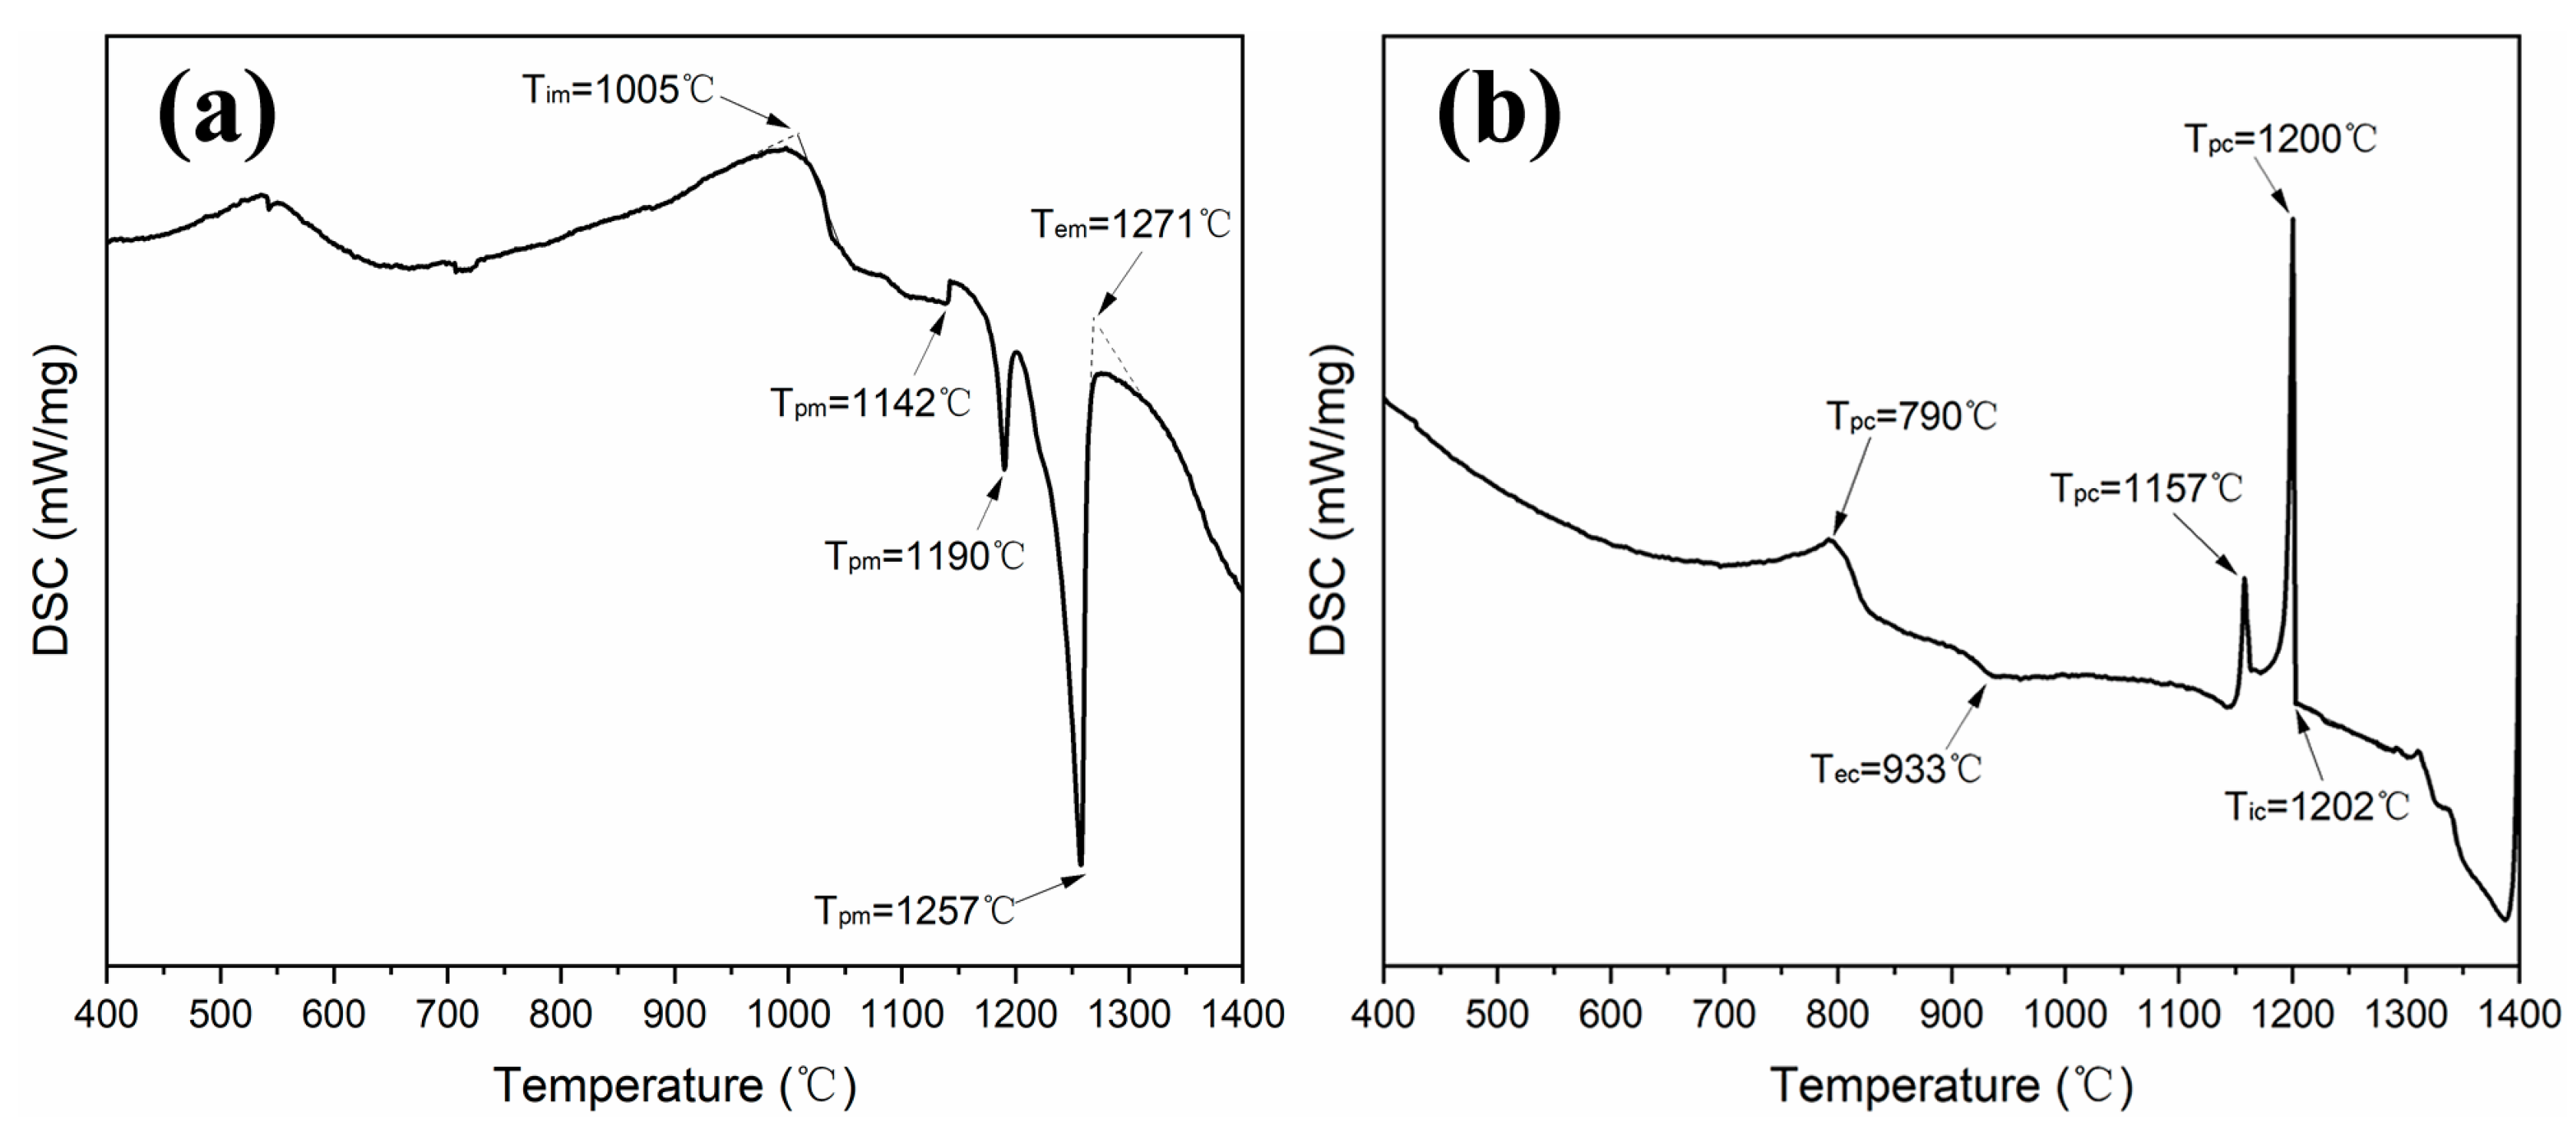
Figure 2 presents the DSC curves of the samarium–cobalt alloy samples during the heating and cooling cycles. The extrapolated initial melting temperature (Tim) indicates the onset of melting, whereas the extrapolated final melting temperature (Tem) marks the completion of phase melting. The temperature corresponding to the endothermic peak is denoted as Tpm. Similarly, during cooling, Tic, Tec, and Tpc represent the extrapolated initial cooling temperature, the extrapolated final cooling temperature, and the temperature of the exothermic peak, respectively. Upon heating to about 1005 °C, a broad endothermic peak emerges, likely attributable to the early melting of a non-uniform secondary phase enriched with low-melting-point elements. As the temperature increases further, three distinct endothermic peaks are observed at 1142 °C, 1150 °C, and 1257 °C, which correspond to the melting of three separate precipitated phases. The complete melting of the sample was achieved at 1271 °C, as indicated by the DSC signal returning to the baseline. During the cooling phase, the formation of the primary solid solution initiates at about 1202 °C, leading to the release of substantial latent heat of crystallization and resulting in a pronounced exothermic peak. Two additional exothermic peaks subsequently appeared at 1200 °C and 1157 °C, reflecting the sequential precipitation of distinct phases. As the temperature continues to decrease, solidification concludes at 933 °C. This suggests that the phase composition remains relatively stable throughout the cooling process. Finally, another distinct exothermic peak appears as the temperature decreases to about 790 °C, which may be due to a phase transition occurring during cooling, corresponding to the relatively broad endothermic peak observed during heating.
Figure 3 presents real-time in situ observations of microstructural changes in the samarium–cobalt alloy during melting and subsequent solidification at a cooling rate of 600 °C/min. During the heating phase, the second-phase regions on the sample surface gradually darken. Melting initiates at about 980 °C, indicating the onset of liquefaction in the second phase. Complete melting is achieved at 1400 °C, as shown in Figure 3d. After this temperature is maintained for 60 s, the molten alloy is cooled at a rate of 600 °C/min. Solidification begins once the temperature decreases below the melting point, with initial nucleation observed at 1223 °C—designated the crystallization temperature. As the temperature increased to 1211 °C, the number of nuclei increased significantly, and early-stage crystal growth began. By 1186 °C, these nuclei develop into dendritic structures, with the remaining liquid phase segregating between dendrites, as illustrated in Figure 3i. When the temperature reaches 1160 °C, only traces of liquid persist, making further structural observations challenging.
Figure 4 depicts the crystallization (liquidus) temperatures of the SmCo alloy at various cooling rates, derived from in situ HT-LSCM measurements. The results demonstrate that higher cooling rates delay the onset of crystallization, lowering the crystallization temperature and increasing the degree of undercooling. This enhanced undercooling accelerates nucleation more rapidly than crystal growth, resulting in a finer dendritic structure. Therefore, increased cooling rates lead to deeper undercooling, lower crystallization temperatures, and finer microstructural features. By fitting and analyzing the experimental data, the relationship between the crystallization temperature and cooling rate was obtained, as shown in Equation (1):
y = 8.15 l n ( V ) + 1280
where y is the crystallization temperature, °C, and V is the cooling rate.
Figure 5 displays metallographic images of Sm-Co alloy samples etched after solidification at various cooling rates. After etching, the samples reveal a characteristic dendritic microstructure typical of as-cast alloys. As shown in Figure 5a, the sample solidified at a slow cooling rate of 10 °C/min exhibited pronounced dendritic segregation, forming a continuous, network-like structure with relatively broad dendrite arms. In contrast, Figure 5b,c, corresponding to cooling rates of 100 °C/min and 600 °C/min, respectively, show a progressive refinement of the dendritic structure. As the cooling rate increased, the dendrites became narrower and more uniformly distributed, indicating a clear dependence of the dendritic morphology on the cooling rate.
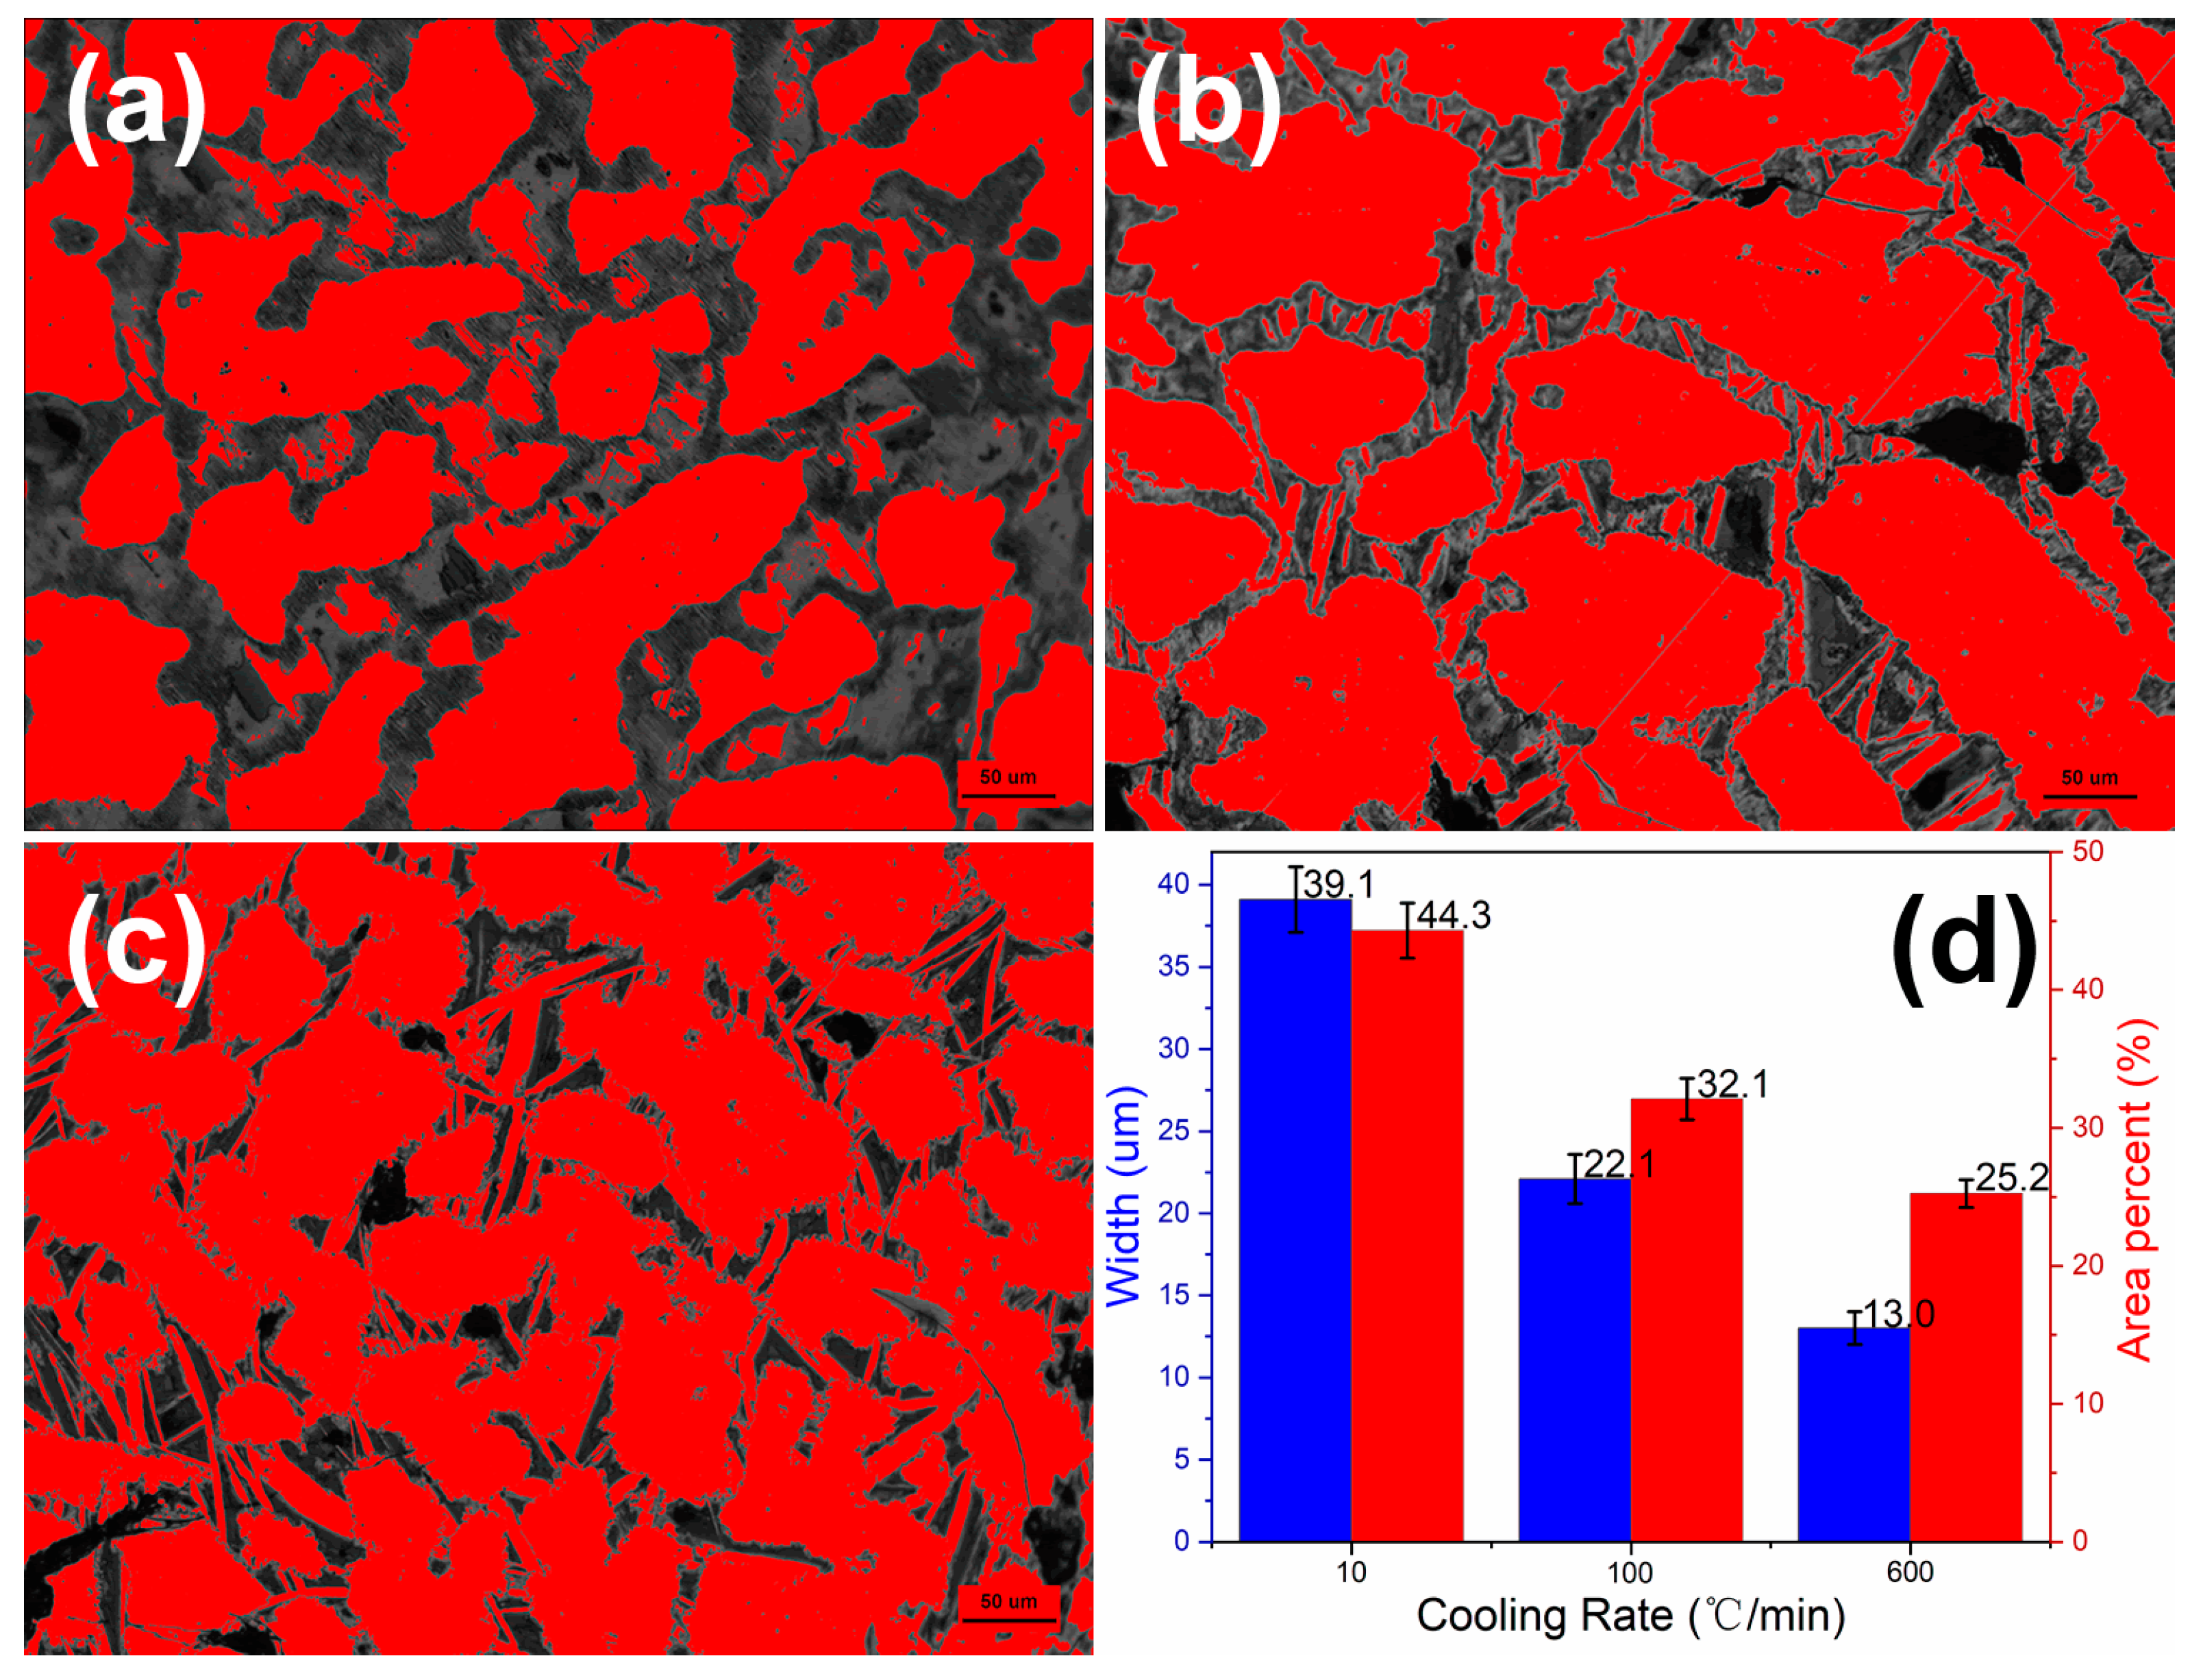
Figure 6 presents metallographic images of the Sm-Co alloy samples after etching, captured at various cooling rates. In the analysis, the matrix regions were highlighted in red using ImageJ (2.0) software, whereas the dendritic structures remained unmarked. Quantitative measurements of the dendritic width and area were conducted. At a cooling rate of 10 °C/min, the average dendrite width was 39.1 μm, which was 44.3% of the total area. When the cooling rate was increased to 100 °C/min, the average dendrite width decreased to 22.1 μm, with the area fraction decreasing to 32.086%. At the highest cooling rate of 600 °C/min, the dendrites were further refined, exhibiting an average width of 13 μm and occupying only 25.2% of the area. These results clearly demonstrate that increasing the cooling rate leads to a significant reduction in both the dendrite size and area fraction.
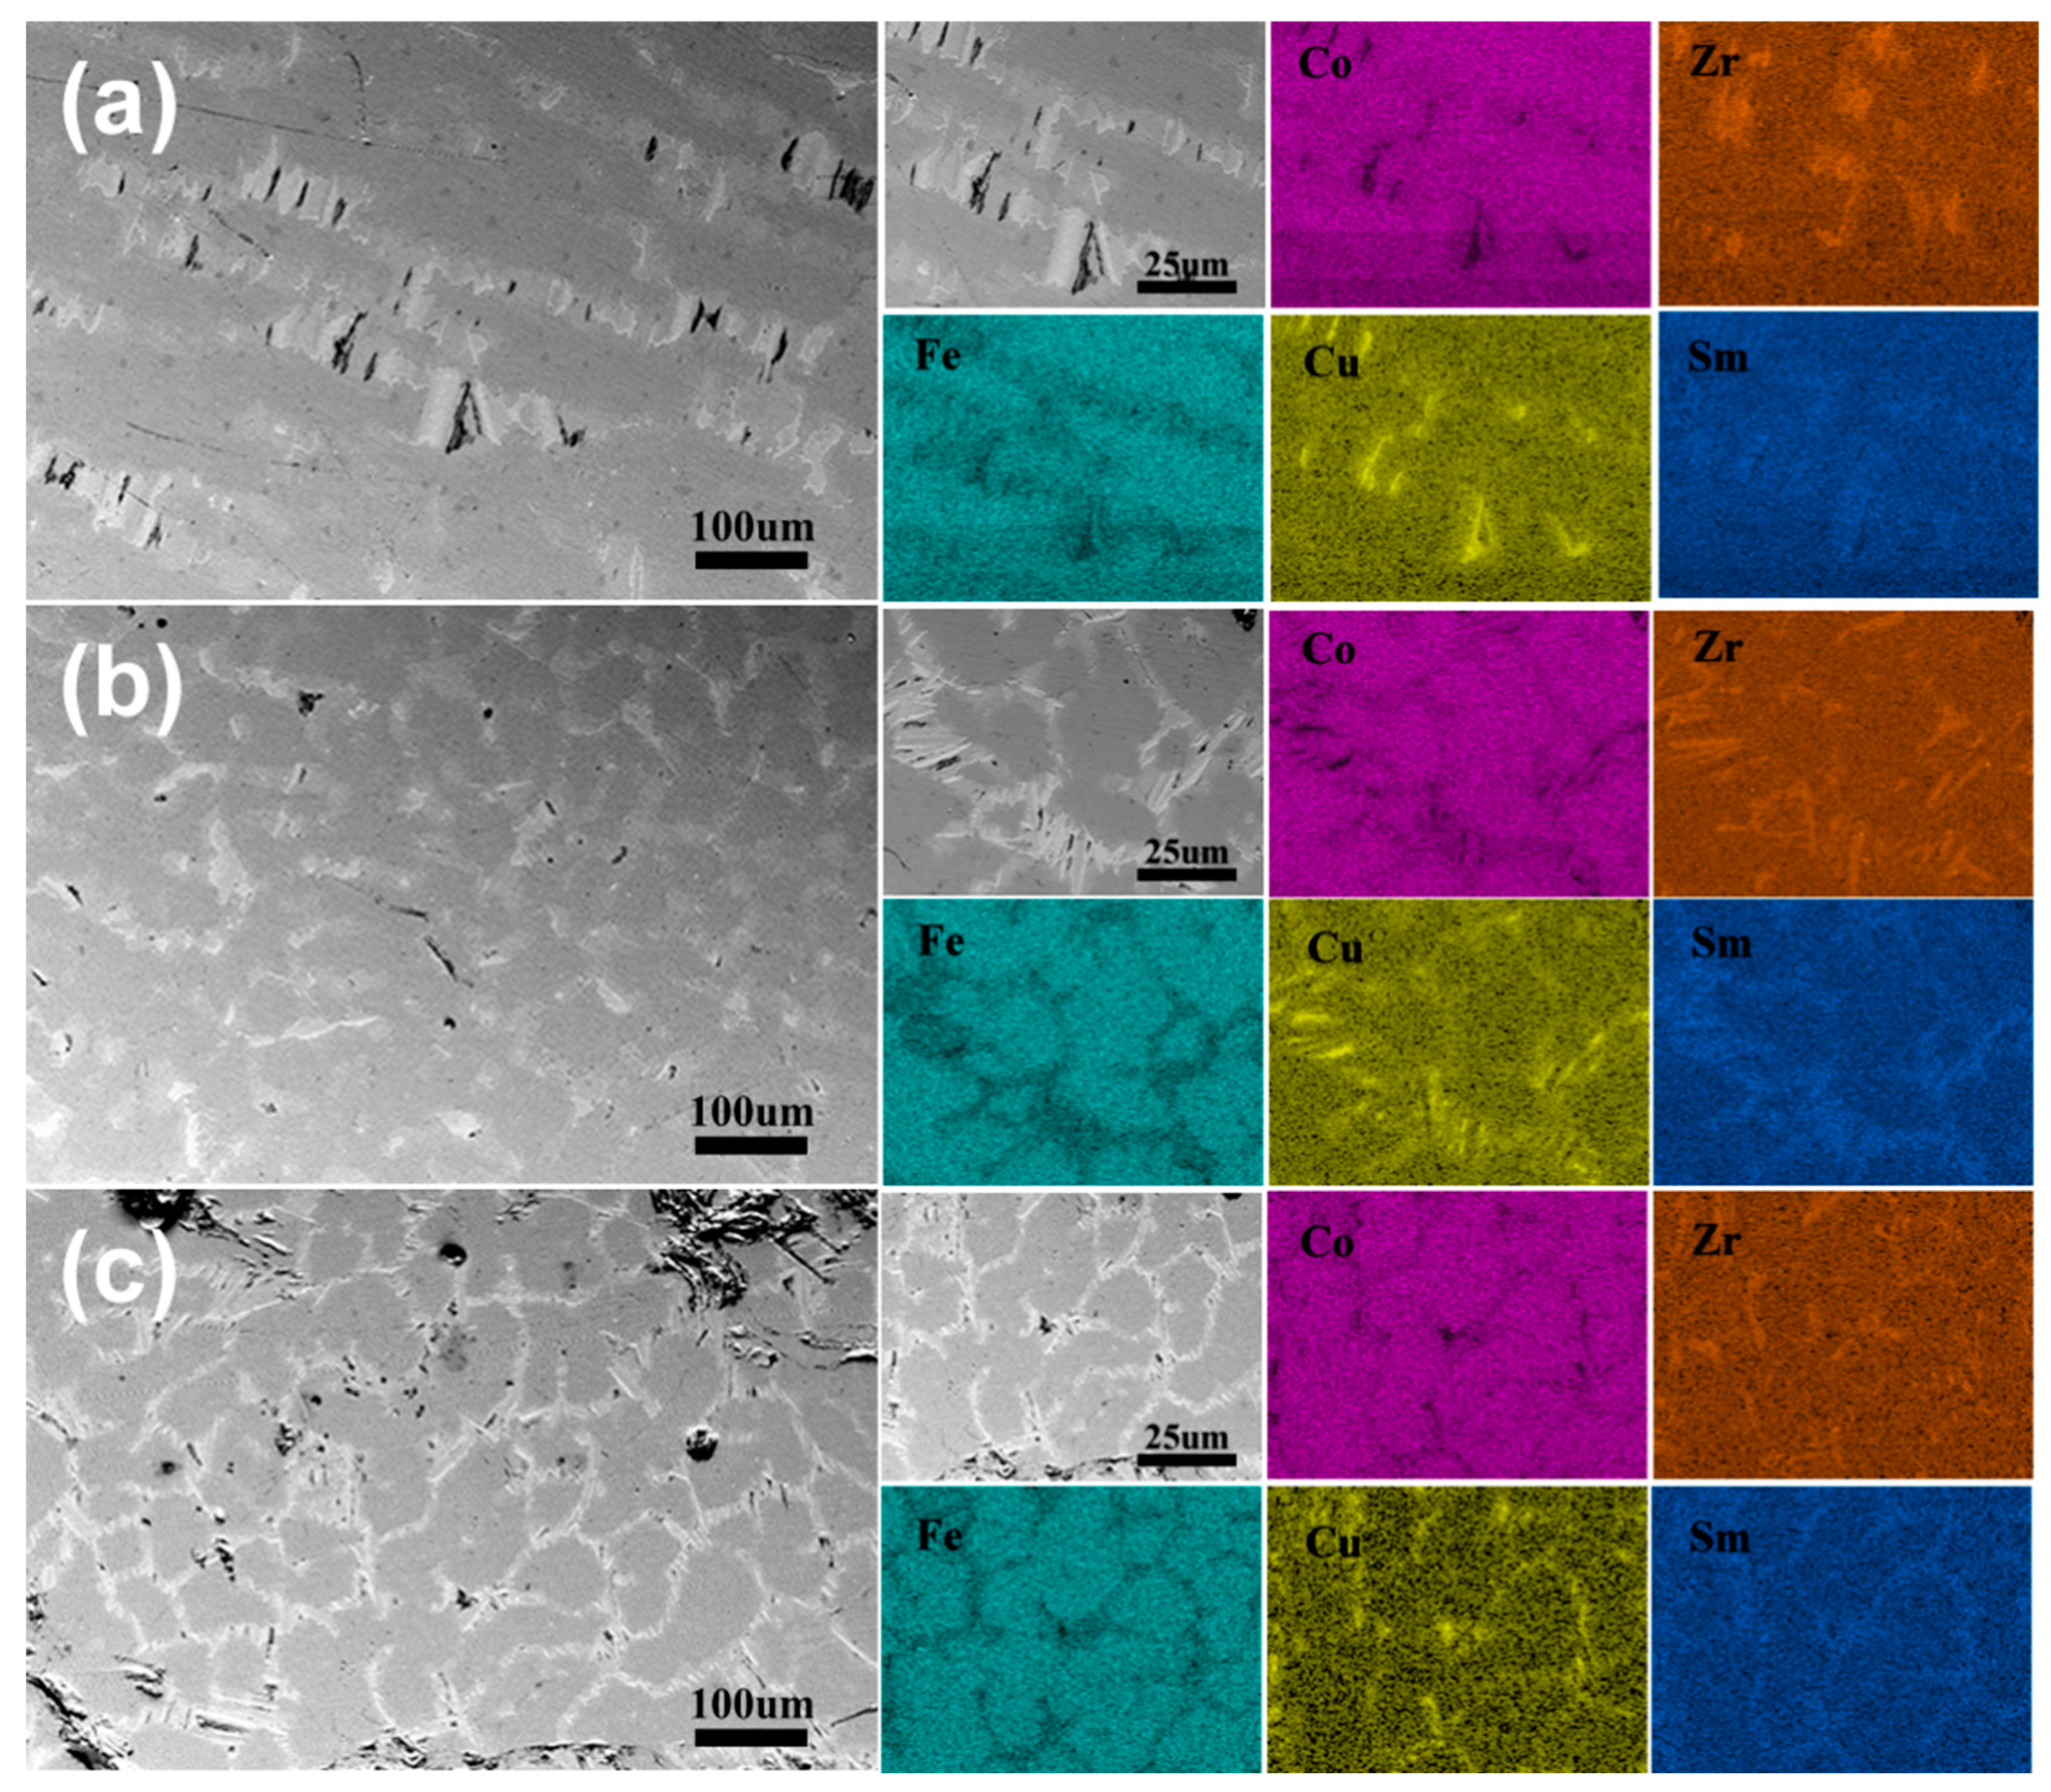
It is well established that solute redistribution occurs during non-equilibrium solidification, leading to element segregation. Figure 7 presents the distribution of major solute elements between dendrites, as determined by SEM surface scanning at different cooling rates. A pronounced disparity is observed in the distribution of solute elements between the dendritic cores and inter-dendritic regions. Notably, Sm, Cu, and Zr are predominantly concentrated in the inter-dendritic regions and are scarcely present within the dendrites, indicating a strong tendency for positive segregation. Conversely, Co and Fe, which exhibit negative segregation behavior, are depleted in these inter-dendritic zones. To further evaluate the degree of elemental segregation, EDS was employed to analyze the chemical composition of both dendrites and inter-dendritic regions under various cooling rates. As the cooling rate increased, large Sm-, Cu-, and Zr-rich particles progressively refined, with the most significant refinement observed at 600 °C/min. At this rate, all three elements exhibit fine, strip-like distributions embedded within the matrix, reflecting enhanced microstructural uniformity and reduced segregation.
To further investigate the degree of element segregation, the average concentration of dendrites was measured using EDS between the core and dendrites at different cooling rates. The degree of segregation can be described by the degree of element segregation [20,21,22], as shown in Formula (2):
K = Ci/Cd
where Ci represents the concentration of element i in the solid phase, specifically in the initially solidified region, namely, the dendrite nucleus. Cd denotes the concentration of element i in the liquid phase, corresponding to the last region to solidify, which is the dendrite interstice. When K < 1, the element tends to segregate into the liquid phase, leading to enrichment in the dendrite interstices. When K > 1, the element preferentially segregates into the solid phase, accumulating in the dendrite nucleus.
The second phase precipitates in the regions between dendrites. The segregation of elements, particularly Sm, Zr, and Cu, is the primary factor responsible for the formation of these precipitated phases. The degree of elemental segregation can be quantified using the segregation coefficient K. Therefore, EDS was employed to measure the concentrations of elements in both the inter-dendritic regions and the dendrite stems. The calculated segregation coefficients are presented in Table 2.
By averaging the EPMA quantitative analysis results of six points at the center of the dendrites, the changes in the contents of the five alloy elements (Sm, Co, Fe, Cu, and Zr) under different cooling rates can be obtained. The results are presented in Figure 8. In general, during practical solidification, elements exhibiting positive segregation tend to accumulate progressively in the residual liquid at the solid–liquid interface. Considering the limited diffusivity of alloying elements in the solid phase and the diffusion behavior of solute atoms, the actual segregation concentration in the liquid phase typically lies between the predictions of the Scheil model (Non-equilibrium model) and those of the Lever rule (equilibrium model) [23,24]. In this study, the concentrations of Sm, Cu, and Zr in the inter-dendritic regions are notably higher than those in the dendrite stems, reflecting positive segregation behavior, with segregation coefficients following the order KCu > KZr > KSm. Conversely, the concentrations of Co and Fe are lower in the inter-dendritic regions than in the dendrite cores, indicating negative segregation, with coefficients KCo > KFe, both ranging between 0.6 and 0.9.
Figure 9 displays back-scattered electron (BSE) images of Sm-Co alloy samples solidified at different cooling rates: (a) 10 °C/s, (b) 100 °C/s, and (c) 600 °C/s. Four distinct phases are identified in the microstructure, labeled Phase A, Phase B, Phase C, and Phase D, each exhibiting differences in morphology, size, and composition. Elemental mapping confirmed that all the phases contained varying amounts of Sm, Co, Fe, Cu, and Zr. Compared with the other phases, Phase A, which dominates the matrix region, is notably richer in Co and Fe. Phase B is characterized by a distinct protruding boundary and is primarily composed of Zr. Adjacent to it, Phase C is significantly enriched in Cu. Phase D, which has a dark gray elongated structure, contains a smaller quantity of Cu. The cooling rate plays a critical role in defining the morphology of the precipitated phases. As the cooling rate increases, Phases B, C, and D exhibit progressive refinement, becoming smaller and more uniformly distributed. The phase composition determined by point scanning (the results listed in Table 3) suggests that Phase A corresponds to the Sm2(Co, Fe, Cu, Zr)17 phase, Phase B corresponds to (Sm, Zr)(Co, Fe, Cu)3, Phase C corresponds to Sm(Co, Fe, Cu, Zr)5, and Phase D corresponds to Sm(Co, Fe, Cu, Zr)7.

4. Conclusions

The shape and evolution of the solid–liquid interface are significantly influenced by the applied cooling rate. With an increase in the cooling rate, the microstructure underwent significant refinement, and the dendrite spacing decreased accordingly. The crystallization temperature of samarium–cobalt alloys under various cooling conditions can be described using a corresponding empirical relationship.
During the solidification process, Sm, Cu, and Zr tend to segregate into the inter-dendritic regions, whereas Co and Fe are predominantly concentrated within the dendritic cores. As the cooling rate increases, the degree of segregation for Sm, Cu, and Zr becomes more pronounced, indicating an intensifying segregation tendency.
Across different cooling rates, samarium–cobalt alloys consistently form four distinct phase structures: Sm2(Co, Fe, Cu, and Zr)17, (Sm, Zr)(Co, Fe, and Cu)3, Sm(Co, Fe, Cu, and Zr)5, and Sm(Co, Fe, Cu, and Zr)7. The presence of these phases remains unchanged regardless of variations in the cooling rate. This is crucial for optimizing subsequent homogenization and annealing treatments.

Author Contributions

Z.Z.: writing—original draft, visualization, methodology. Y.F., W.W.: writing—review and editing, supervision, funding acquisition, conceptualization. B.Z.: supervision, investigation. All authors have read and agreed to the published version of the manuscript.

Funding

This research was funded by the National key research and development program of China (Nos. 2021YFB3503101) and by the Major Program of Central Iron and Steel Research Institute R&D special fund (Shi. 23160360ZD, Shi. 24160770Z).

Data Availability Statement

The original contributions presented in this study are included in the article. Further inquiries can be directed to the corresponding author.

Conflicts of Interest

Authors Zhi Zhu, Yikun Fang, Wei Wu and Bo Zhao were employed by the Central Iron and Steel Research Institute Co., Ltd. The remaining authors declare that the research was conducted in the absence of any commercial or financial relationships that could be construed as a potential conflict of interest.

References

  1. Yang, L.; Zuo, S.L.; Guan, C.S.; Liu, Z.H.; Hu, M.Y.; Kang, D.Z.; Zhao, M.J.; Liu, B.J.; Liu, J.H.; Peng, Y.; et al. Effect of interfacial stress on microchemistry and coercivity in 2:17-type SmCo sintered magnets. Acta Mater. 2024, 264, 119580. [Google Scholar] [CrossRef]
  2. Ghorbani, Y.; Ilankoon, I.M.S.K.; Dushyantha, N.; Nwaila, G.T. Rare earth permanent magnets for the green energy transition: Bottlenecks, current developments and cleaner production solutions. Resour. Conserv. Recycl. 2025, 212, 107966. [Google Scholar] [CrossRef]
  3. Islama, R.; Verob, K.; Borah, J.P. Historical overview and recent advances inpermanent magnet materials. Mater. Today Commun. 2024, 41, 110538. [Google Scholar] [CrossRef]
  4. Zhou, X.L.; Liu, Y.; Jia, W.T.; Song, X.; Xiao, A.D.; Yuan, T.; Wang, F.; Fan, J.P.; Ma, T.Y. Revisiting the pinning sites in 2:17-type Sm-Co-Fe-Cu-Zr permanent magnets. J. Rare Earths 2021, 39, 1560–1566. [Google Scholar] [CrossRef]
  5. Fang, M.X.; Gao, C.M.; Liu, S.P.; Wang, J.B.; Zhang, Y.; Liu, L.; Zuo, W.L.; Li, J.; Ma, T.Y.; Ding, Y.; et al. Understanding of the enhanced coercivity and energy product in Sm(CobalFe0.27Cu0.05Zr0.02)z permanent magnets with lower z value. J. Alloys Compd. 2025, 1014, 178691. [Google Scholar] [CrossRef]
  6. Liu, D.H.; Lan, Q.F.; Zhang, X.L.; Niu, F.; Yang, Y.M. Preparation and Magnetic Properties of 2:17-Type SmCo Alloy by Transition Metal-Induced Calciothermic Reduction. JOM 2021, 73, 3885–3893. [Google Scholar] [CrossRef]
  7. Zhang, Y.L.; Zhang, Y.J.; Li, Y.P.; Miao, X.F.; Shao, Y.Y.; Liu, C.Y.; Xu, F. Tunable microstructure and microwave absorption properties of the SmCo5/Sm2Co17 binary-phase magnetic absorbent prepared via a reduction diffusion method. J. Alloys Compd. 2024, 973, 172843. [Google Scholar] [CrossRef]
  8. Tian, J.J.; Tao, S.W.; Qu, X.H.; Zhang, S.G. 2:17-type SmCo magnets prepared by powder injection molding using a water-based binder. J. Magn. Magn. Mater. 2008, 320, 2168–2171. [Google Scholar] [CrossRef]
  9. Cui, J.; Ormerod, J.; Parker, D.S.; Ott, R.; Palasyuk, A.; McCall, S.; Paranthaman, M.P.; Kesler, M.S.; Mcguire, M.A.; Nlebedim, C.; et al. Manufacturing Processes for Permanent Magnets: Part II—Bonding and Emerging Methods. JOM 2022, 74, 2492–2506. [Google Scholar] [CrossRef]
  10. Huang, J.Y.; Zuo, S.L.; Zhang, Q.; Dai, H.Y.; Yang, L.; Liu, J.H.; Jiang, C.B. 2:17-type SmCo permanent magnets with controllable remanence temperature coefficients via substitution of heavy rare earth elements. Rare Met. 2024, 43, 3990–3996. [Google Scholar] [CrossRef]
  11. Li, Q.F.; Wang, C.; Chen, H.S.; Fang, Y.K.; Wang, L.; Zheng, M.; Xiao, Y.F.; Zhang, Y.; Hadjipanayis, G.C.; Zhu, M.G.; et al. Influence of 1:7 H phase stability on the evolution of cellular microstructure in Fe-rich Sm-Co-Fe-Cu-Zr magnets. J. Alloys Compd. 2023, 959, 170604. [Google Scholar] [CrossRef]
  12. Zhou, B.; Dai, B.D.; Liu, L.; Hu, F.Q.; Sun, Y.L.; Ding, Y.; Yan, A.R. Study on the evolution of magnetic and mechanical properties in Sm2Co17 magnets at high temperatures. J. Magn. Magn. Mater. 2025, 628, 173162. [Google Scholar] [CrossRef]
  13. Dong, C.H.; Hu, F.Q.; Wang, J.B.; Wang, S.D.; Zhou, B.; Liu, L.; Sun, Y.L.; Ding, Y.; Yan, A.R. Study on correlation between mechanical properties and micro/nano-structure of Sm2Co17-type permanent magnets. Mater. Charact. 2025, 223, 114936. [Google Scholar] [CrossRef]
  14. Oliveira, P.H.F.; Mancilha, P.H.S.; Reyes, R.A.V.; Gouveia, G.L.D.; Bolfarini, C.; Spinelli, J.E.; Coury, F.G. Influence of the cooling rate on the solidification path and microstructure of a AlCoCrFeNi2.1 alloy. Mater. Charact. 2023, 203, 113121. [Google Scholar] [CrossRef]
  15. Li, Y.N.; Zou, D.N.; Chen, W.W.; Zhang, Y.B.; Zhang, W.; Xu, F.H. Effect of Cooling Rate on Solidifcation and Segregation Characteristics of 904L Super Austenitic Stainless Steel. Met. Mater. Int. 2022, 28, 1907–1918. [Google Scholar] [CrossRef]
  16. Wang, W.T.; Wang, S.H.; Liu, K.; Zhang, Y.K. SmFe12-based permanent magnet master alloy prepared efficiently by vacuum induction melting. China Metall. 2023, 33, 81–89. [Google Scholar]
  17. Li, B.H.; Wang, S.H.; Song, C.Y.; Liu, K. Effects of Superheat Degree on Smelting of Sm-Fe Alloy. Rare Met. Cem. Carbides 2019, 47, 35–38. [Google Scholar]
  18. Yan, Y.; Bao, S.X.; Lai, W.M.; Zhang, X.W.; Wang, Z.W.; Shen, A.G.; Zhang, M. Studies on ingot casting of Sm2Co17 type permanent magnet materials. J. Magn. Mater. Devices 2014, 45, 44–47. [Google Scholar]
  19. Lai, W.M.; Bao, S.X.; Zhang, X.W.; Wang, Z.W.; Cheng, L.L.; Zhang, M. Studies on corrosion conditions of metallographic sample of Sm2Co17 permanent magnet materials. J. Magn. Mater. Devices 2012, 4, 63–65. [Google Scholar]
  20. Jia, L.; Cui, H.; Yang, S.F.; Lv, S.M.; Xie, X.F.; Qu, J.L. Effect of the cooling rates on the microstructure and segregation characteristics in directionally solidified GH4151 superalloy. Mater. Charact. 2024, 209, 113735. [Google Scholar] [CrossRef]
  21. Wang, H.Z.; Long, H.B.; Sun, M.; Yang, G.; Wei, H.; Mao, S.C.; Zhang, Z.; Han, X.D. Effect of directional solidification methods on solid solution window in Ni-based single-crystal superalloy. J. Mater. Res. Technol. 2023, 24, 8307–8319. [Google Scholar] [CrossRef]
  22. Dai, Z.J.; Shen, C.L.; Wang, Y.; Xu, C.Y.; Tian, X.Y.; Xu, M.Q.; Yi, J.J. Designing TixZrNbMoV refractory high entropy alloys with improved properties by reducing intermetallic compound and dendritic segregation. J. Alloys Compd. 2025, 1036, 181913. [Google Scholar] [CrossRef]
  23. Gao, Y.; Han, J.; Ge, F.Y.; Zhang, X.; Cai, Y.C.; Cui, Y. Design of eutectic high-entropy alloys in the Co-Cr-Ni-V-Ti-Al system using Scheil solidification path optimization. J. Alloys Compd. 2024, 1002, 175327. [Google Scholar] [CrossRef]
  24. Liu, Z.D.; Sun, W.W. Enhancing classical Scheil–Gulliver model calculations by predicting generated phases and corresponding compositions through machine learning techniques. Addit. Manuf. 2024, 95, 104516. [Google Scholar] [CrossRef]
Figure 1. Temperature curves of the heating and cooling experiments.
Alloys 04 00023 g001
Figure 2. DSC curves of the samarium–cobalt alloy samples: (a) heating and (b) cooling.
Alloys 04 00023 g002
Figure 3. In situ observation of the melting and solidification process of samarium–cobalt alloy (600 °C/min) at different temperatures: (a) 30 °C, (b) 800 °C, (c) 980 °C, (d) 1400 °C, (e) 1223 °C, (f) 1211 °C, (j) 1186 °C, (h) 1184 °C, and (i) 1160 °C.
Alloys 04 00023 g003
Figure 4. Crystallization temperature of the SmCo alloy at different cooling rates.
Alloys 04 00023 g004
Figure 5. Optical micrographs of typical as-cast alloy microstructures produced with various cooling rates: (a) 10 °C/min, (b) 100 °C/min, and (c) 600 °C/min, (a-1c-1) are respectively the enlarged views of (ac).
Alloys 04 00023 g005
Figure 6. Optical micrographs of typical as-cast alloy microstructures at different cooling rates: (a) 10 °C/min, (b) 100 °C/min, (c) 600 °C/min, and (d) dendrite size and area diagram.
Alloys 04 00023 g006
Figure 7. Scanning electron micrographs of dendrites and intergranular main solute elements at different cooling rates: (a) 10 °C/s, (b) 100 °C/s, and (c) 600 °C/s.
Alloys 04 00023 g007
Figure 8. Segregation coefficient K of the elements at the different cooling rates.
Alloys 04 00023 g008
Figure 9. Back-scattered electron (BSE) images of the samarium–cobalt alloy at different cooling rates: (a) 10 °C/s, (b) 100 °C/s, and (c) 600 °C.
Alloys 04 00023 g009
Table 1. Chemical composition (wt%) of the VIM samarium–cobalt alloy after melting.
ElementSmCoFeCuZrTotal
wt%2548.5194.82.7100
Table 2. Element segregation analysis of different cooling rates between the dendrite core and inter-dendritic regions.
SampleSegregation ParameterSmCoFeCuZr
10Dendrite/wt.%22.146.520.47.33.7
Inter-dendrite/wt.%25.842.814.712.14.6
K1.160.920.721.661.24
100Dendrite/wt.%2248.620.36.42.7
Inter-dendrite/wt.%24.644.517.510.43
K1.120.920.861.631.11
600Dendrite/wt.%21.945.7227.82.6
Inter-dendrite/wt.%27.840.515.113.33.3
K1.270.890.691.711.30
Table 3. SEM-EDS analysis of precipitated phases in samarium–cobalt alloys with different cooling rates.
IDPhaseElement/wt%
CoSmFeCuZr
1Sm2(Co, Fe, Cu, Zr)1748.322.120.47.31.9
2(Sm, Zr)(Co, Fe, Cu)346.919.412.42.518.8
3Sm(Co, Fe, Cu, Zr)536.9933.59.3616.014.15
4Sm(Co, Fe, Cu, Zr)742.827.5414.7112.12.86
5Sm2(Co, Fe, Cu, Zr)1748.621.620.16.43.3
6(Sm, Zr)(Co, Fe, Cu)344.827.612.53.811.3
7Sm(Co, Fe, Cu, Zr)53334.710.117.44.8
8Sm(Co, Fe, Cu, Zr)74525.417.19.33.1
9Sm2(Co, Fe, Cu, Zr)1748.821.620.36.42.8
10(Sm, Zr)(Co, Fe, Cu)345.923.312.1315.6
11Sm(Co, Fe, Cu, Zr)540.232.711.510.45.1
12Sm(Co, Fe, Cu, Zr)740.527.815.114.32.3
Disclaimer/Publisher’s Note: The statements, opinions and data contained in all publications are solely those of the individual author(s) and contributor(s) and not of MDPI and/or the editor(s). MDPI and/or the editor(s) disclaim responsibility for any injury to people or property resulting from any ideas, methods, instructions or products referred to in the content.