Article

Tether Force Estimation Airborne Kite Using Machine Learning Methods

by
Akarsh Gupta
1,
Yashwant Kashyap
1 and
Panagiotis Kosmopoulos
2,*
1
National Institute of Technology Karnataka, Surathkal, Mangalore 575025, India
2
Institute for Environmental Research and Sustainable Development, National Observatory of Athens, 15236 Athens, Greece
*
Author to whom correspondence should be addressed.
Submission received: 20 October 2024 / Revised: 23 January 2025 / Accepted: 28 January 2025 / Published: 5 February 2025

Abstract

:
This paper explores the potential of Airborne Wind Energy Systems to revolutionize wind energy generation, demonstrating advancements over current methods. Through a series of controlled field experiments and the application of classical machine learning techniques, we achieved significant improvements in tether force estimation. Our XGBoost model, for example, demonstrated a notable reduction in error in predicting the tether force that can be extracted at a particular location, with a root mean square error of 52.3 Newtons and a mean absolute error of 32.1 Newtons, coupled with a R 2 error, which measures the proportion of variance explained by the model, achieved an impressive value of 0.93. These findings not only validate the effectiveness of our proposed methods but also illustrate their potential to optimize the deployment of Airborne Wind Energy Systems, thereby maximizing energy output and contributing to a sustainable, low-carbon energy future. By analyzing key input features such as wind speed and kite dynamics, our model predicts optimal locations for Airborne Wind Energy System installation, offering a promising alternative to traditional wind turbines.

1. Introduction

In recent years, the urgent need to mitigate the adverse effects of fossil fuel combustion on the environment has intensified the global focus on renewable energy generation and utilization [1]. As a critical component of sustainable development, renewable technologies are essential for reducing greenhouse gas emissions, enhancing energy security, and fostering cleaner, greener economic growth. However, the widespread adoption of renewable energy sources encounters several significant barriers [2], including technological limitations, high initial capital costs, and regulatory challenges that can hinder implementation. Among the various renewable options, wind energy has emerged as a particularly compelling alternative for decarbonizing the energy sector. Its abundance, scalability, and increasingly competitive cost structure make it a viable solution for meeting global energy demands while addressing climate change [3,4]. By overcoming the existing obstacles and leveraging advancements in technology, wind energy can play a pivotal role in the transition to a sustainable energy future.
The generation of electric power from wind began in the 1970s [5,6], marking the start of a transformative journey in renewable energy technology. Since then, wind turbine technology has undergone remarkable advancements [7,8]. Modern wind turbines, particularly Horizontal Axis Wind Turbines (HAWT) [9], have evolved into massive, highly efficient machines capable of producing megawatts of power [10]. These turbines dominate the wind power industry and have been optimized for performance through increased rotor sizes, improved aerodynamic designs, and higher hub heights, enabling them to capture stronger and more consistent winds at elevated altitudes.
As urbanization and industrialization drive the increasing demand for energy, the focus on sustainable and cost-effective solutions has intensified. While traditional wind turbines have played a pivotal role in harnessing renewable energy, the advent of Airborne Wind Energy Systems (AWES) is reshaping the landscape of wind energy generation. AWES presents a promising alternative, addressing several limitations of conventional wind turbines and offering significant advantages in terms of setup and maintenance. Unlike traditional wind turbines, which require massive towers and foundations, AWES operate with tethered airborne devices such as kites or drones that capture wind energy at higher altitudes. This eliminates the need for extensive groundwork and heavy infrastructure, making AWES far easier and quicker to deploy. The reduced material requirements not only lower the initial setup costs but also make these systems more adaptable to remote or challenging terrains where traditional wind turbines may be impractical. One of the standout advantages of AWES is its significantly lower maintenance cost. Traditional wind turbines involve complex mechanical systems and towering structures that demand regular and often expensive servicing, particularly in offshore installations. In contrast, AWES relies on lightweight and modular designs, with components that are easily accessible and simpler to repair or replace. This simplicity dramatically reduces the operational costs over the system’s lifecycle [11]. Moreover, AWES can reach altitudes where wind speeds are stronger and more consistent, ensuring higher energy yields. This capability not only improves efficiency but also reduces the number of systems required to achieve a specific energy output, further enhancing their cost-effectiveness [12].
Airborne Wind Energy Systems (AWESs) offer an innovative alternative to traditional wind turbines, addressing some of the economic and logistical challenges associated with scaling up Horizontal Axis Wind Turbines (HAWTs). Taller HAWTs incur higher installation costs and demand increasingly complex engineering solutions, limiting their feasibility in optimal locations. AWESs, on the other hand, achieve higher altitudes with significantly reduced material and installation costs by using tethered flying devices, such as kites or drones, to harness stronger, more stable high-altitude winds. These systems present a promising pathway for sustainable energy generation while requiring fewer resources compared to conventional wind turbines.
However, AWESs are not without challenges. Their performance is highly sensitive to atmospheric wind dynamics, turbulence, and variations in wind speed and direction, particularly for lightweight soft kites. Accurate wind measurements are critical for optimizing these systems, but existing methods, such as mounting sensors on kites, often suffer from noise, reliability issues, and the complexities of tether dynamics. Advanced techniques like sensor fusion and state estimation models, such as Kalman filters, have shown promise in overcoming these limitations by integrating data from multiple sensors and accounting for tether sag and kite control unit dynamics. With ongoing technological advancements and refined deployment strategies, AWESs have the potential to complement or even surpass conventional turbines, especially in areas with variable wind conditions or limited space for traditional setups [13,14,15].
A notable implementation of Airborne Wind Energy Systems (AWES) involves the use of a kite in a pumping cycle to generate electricity. This innovative method employs a rigid or foil kite attached to a drum connected to a generator [16]. The kite generates power as it ascends and descends in a controlled manner, converting the kinetic energy of high-altitude winds into mechanical energy, which is then transformed into electricity [17,18]. Unlike traditional wind turbines, which rely on heavy towers and large blades, AWES eliminates the need for massive support structures, enabling cost-effective deployment and operational efficiency. The pumping cycle consists of two primary phases: the power phase and the recovery phase. During the power phase, the kite is flown at high altitudes where wind speeds are stronger and more consistent, pulling a tether connected to the drum. This motion drives the generator, producing electricity. In the recovery phase, the kite’s position is adjusted, reducing aerodynamic drag, and the tether is reeled back in using minimal energy. This cyclic process ensures a continuous flow of electricity, capitalizing on the potential of high-altitude winds, which are significantly stronger and steadier than those at lower levels. This development has only increased the interest in harnessing this abundunt source of energy using various methods.
Research into harnessing airborne wind energy has increasingly leveraged machine learning techniques to optimize energy output and system efficiency [19]. Among these efforts, a key focus has been the application of neural network architectures trained on curated datasets to predict the tether force generated by kite systems, particularly under the unique environmental conditions of India’s coastal regions. While neural networks excel at capturing complex, non-linear relationships, the results in this context have fallen short of expectations. Performance metrics such as Mean Absolute Error (MAE) and Root Mean Square Error (RMSE) revealed significant inaccuracies, raising concerns about the reliability of these predictions. This gap in predictive accuracy underscores a critical limitation in the current methodologies. One of the primary challenges lies in the structured nature of the dataset. Tabular data, characterized by its organized rows and columns, is inherently better suited to models like support vector regression or XGBoost regression, which are designed to exploit the inherent relationships between features. Neural networks, while powerful, are less efficient at processing such structured data unless extensive feature engineering is undertaken. This misalignment between the data’s structure and the chosen model architecture has hampered the accuracy and trustworthiness of the predictions, highlighting the importance of tailoring machine learning models to the characteristics of the dataset.
The implications of this shortfall extend beyond academic curiosity. Airborne Wind Energy Systems (AWES) represent a transformative solution for sustainable energy generation, with the potential to harness high-altitude winds efficiently and cost-effectively. However, for AWES to reach their full potential, accurate prediction of tether forces is essential. This is critical not only for system design and safety but also for identifying optimal locations along coastlines where these systems can be deployed effectively. Subpar predictive performance introduces uncertainty, undermining confidence in the technology and slowing its adoption.
Recognizing the significant gap in the accuracy of tether force predictions for Airborne Wind Energy Systems (AWES), our research seeks to refine machine learning models in order to improve predictive precision and minimize error metrics such as Mean Absolute Error (MAE) and Root Mean Square Error (RMSE). The suboptimal performance of existing models has raised concerns about the reliability of AWES for large-scale deployment, particularly in identifying optimal locations along India’s extensive coastline for installation. For AWES to be viable and effective, accurate tether force predictions are essential, not just for system design and safety, but also for pinpointing ideal sites that can maximize energy output. By enhancing prediction accuracy, we aim to overcome these challenges, paving the way for the strategic deployment of AWES and, ultimately, contributing to the global shift towards renewable and sustainable energy sources.
To achieve this, our approach will integrate classical machine learning techniques with a comprehensive training dataset that incorporates a diverse set of input features, such as wind speed and direction, as well as the orientation and dynamics of the kite system. By analyzing both historical and real-time data, our model will identify key patterns and correlations that reveal locations with the highest potential for generating tether force. This data-driven, predictive methodology is crucial for making informed decisions about where to deploy AWES, ensuring they are installed in regions where wind conditions are most favorable for efficient and consistent energy production.
Ultimately, this work will enhance the overall efficiency and effectiveness of AWES, ensuring that these systems are deployed in the most optimal conditions for power generation. As we move forward, improving the accuracy of tether force predictions will significantly advance the role of AWES in contributing to a sustainable, low-carbon energy infrastructure. By optimizing the siting and performance of these systems, we aim to unlock the full potential of AWES as a reliable and scalable solution for clean energy, driving the future of renewable energy innovation. The pipeline that was used is showed in the Figure 1.
The remainder of this paper is organized as follows. In Section 2, we discuss the various tether force estimation methods employed in our study. Section 3 presents the results of all models used, showcasing their performance and effectiveness. In Section 4, we provide a detailed discussion, comparing our experimental results with findings from other papers in the literature. Finally, Section 5 concludes the paper, summarizing our main findings and suggesting possible directions for future research.

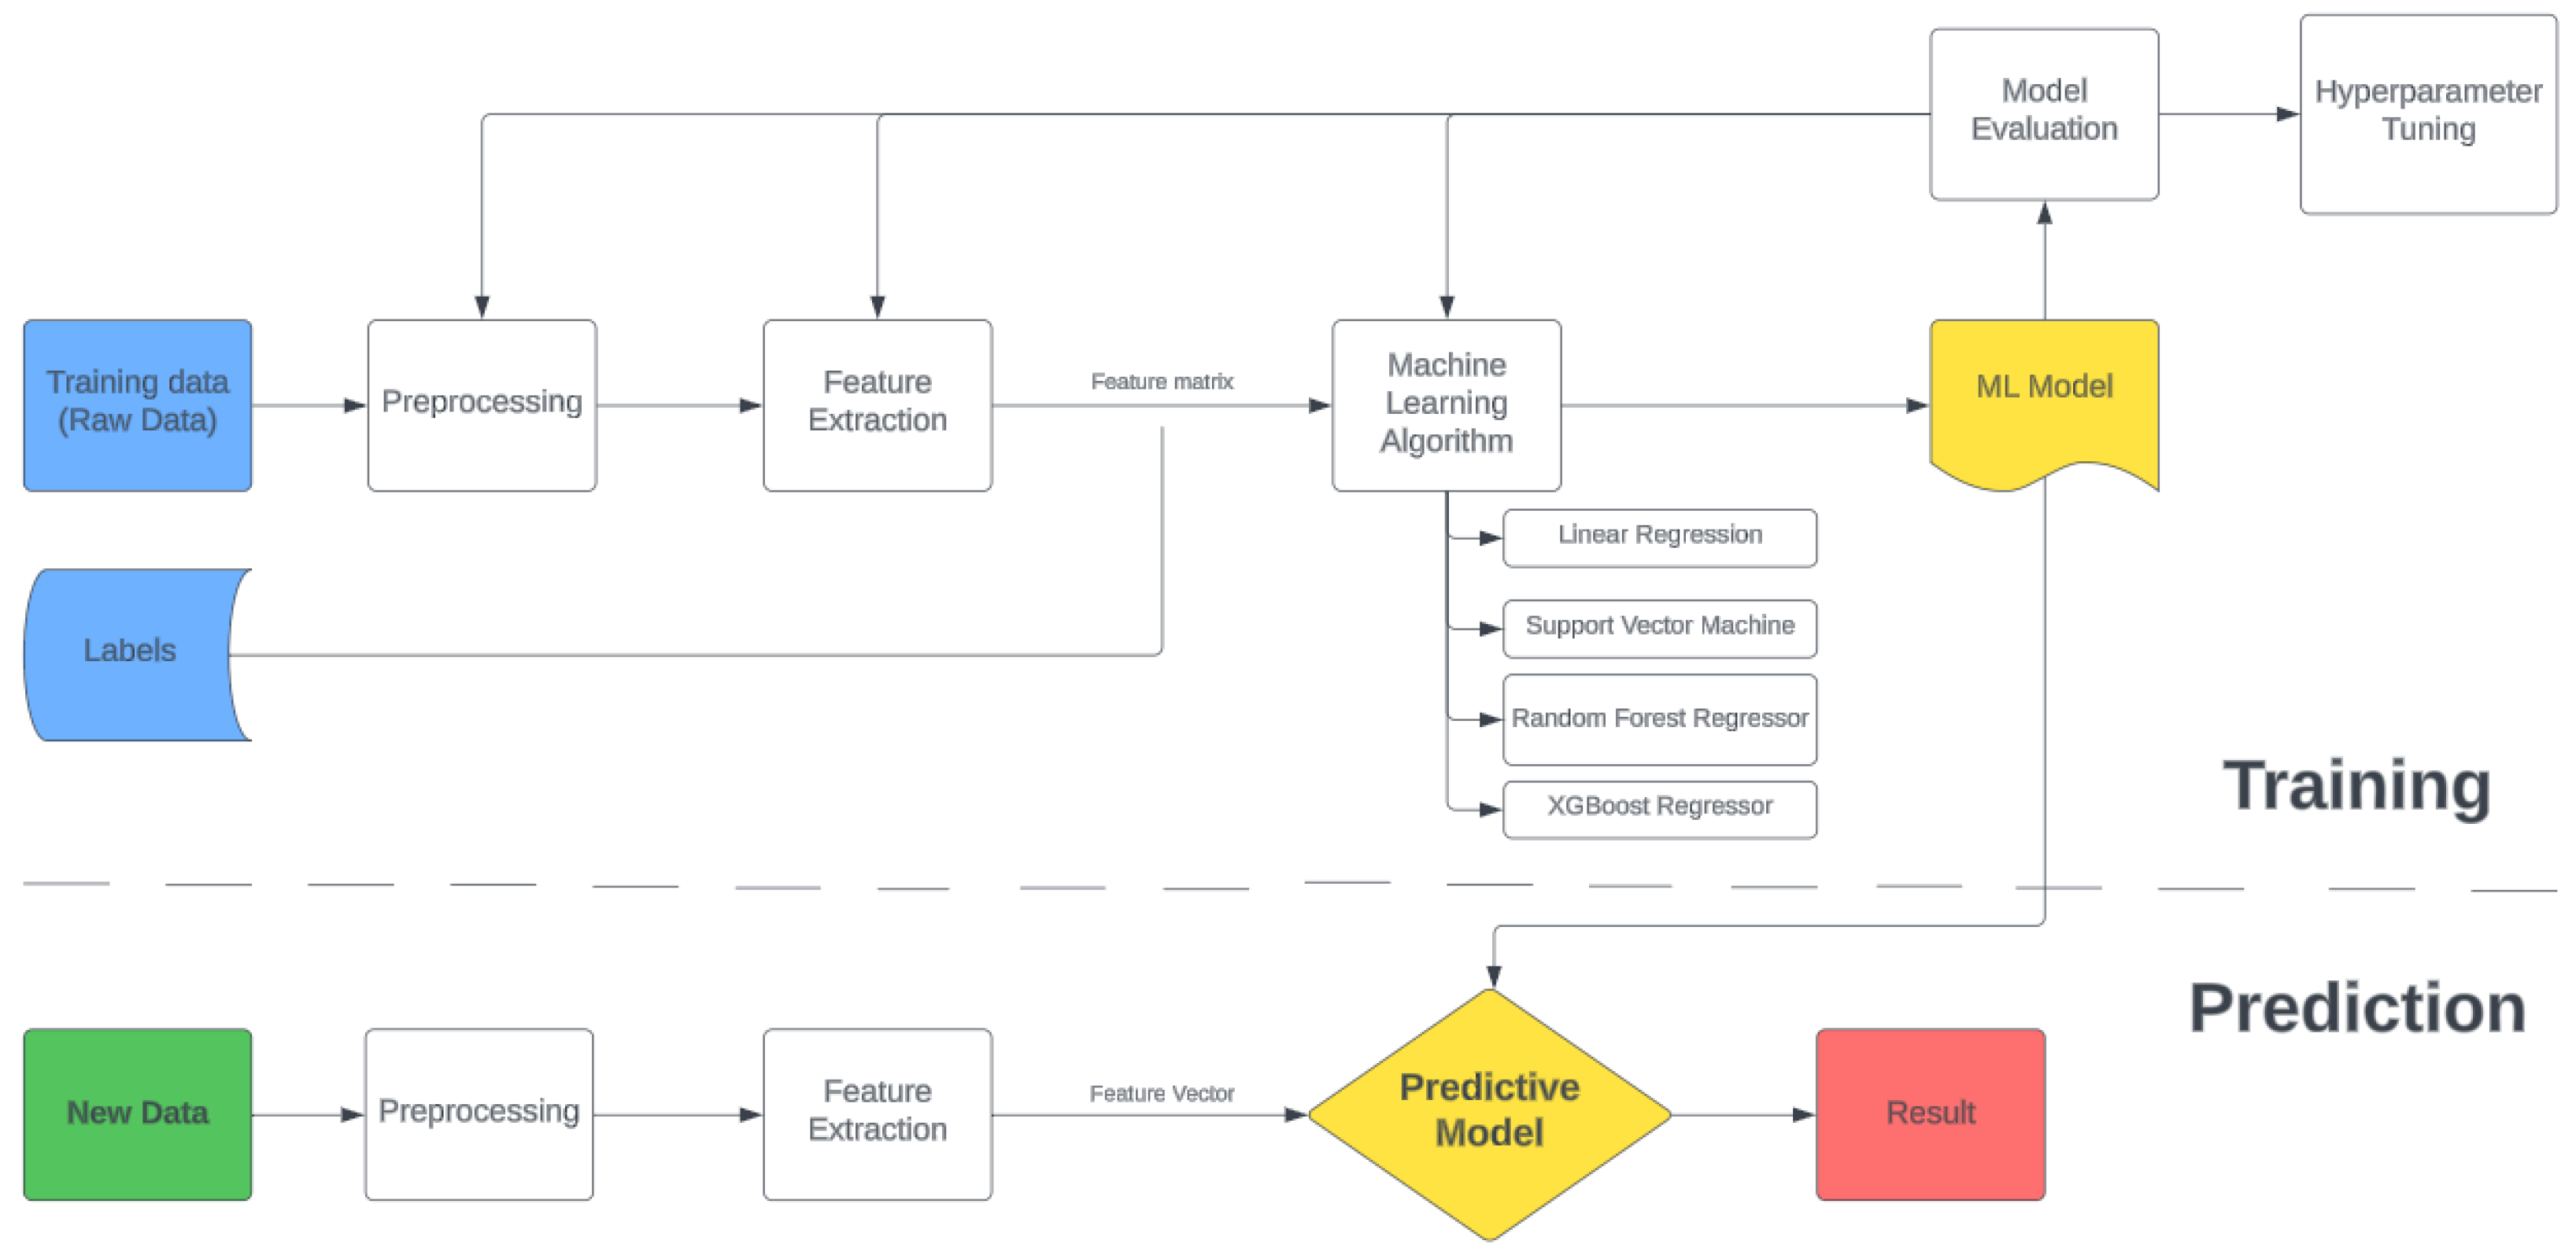
2. Tether Force Estimation Methods

2.1. Field Data Collection

The models are trained on data recorded from the multiple field tests as shown in Table 1. A number of tests were conducted as to get a multiude of values with the trajectory of the kite [19] seen in Figure 2. Some of the important features of the input dataset include Yaw, Pitch, Roll and Altitude. Some of the important features in the dataset are as follow:
  • Yaw
    The Yaw for a kite refers to its horizontal rotation around a vertical axis, similar to how an aircraft changes direction, but in this case, it is about the kite’s “nose”, which is usually the front tip, turning left or right in the air. The reason Yaw is important, is because when wind hits the kite unevenly or when the tension in the string shifts, the kite may yaw, causing it to swing or drift laterally. If not maintained, the kite can spiral out of control, which will not allow it to generate the most power at that moment.
  • Pitch
    The Pitch of a kite is about the kite’s rotation around its lateral axis, essentially the side-to-side movement, reflecting whether the front of the kite tilts upward or downward. A positive pitch occurs when the nose of the kite tilts upward, causing the kite to climb higher in the air. A negative pitch, where the nose dips, often results in the kite descending or even nosediving. Proper pitch control is essential for achieving and maintaining a stable altitude. This often happens when the wind hits one side more strongly or when the kite string pulls unevenly. Excessive roll can cause instability, leading to the kite wobbling, spinning, or even crashing.
  • Roll
    The Roll of the kite pertains to the tilting motion along its longitudinal axis, from the front to the tail, where one side of the kite tilts higher than the other. This often happens when the wind hits one side more strongly or when the kite string pulls unevenly. Excessive roll can cause instability, leading to the kite wobbling, spinning, or even crashing.

2.2. Tether Force Estimation for Kite Setup

The force that experienced by the tethered kite is directly related to the orientation of the kite [19]. The orientation data received by their experiments were converted from quaternion form to their respective YRP values. The tether force that will be experienced by the kite at a particular wind speed can be broadly divided into two important components: drag and lift. The drag component acts parallel to the direction of the wind, at the same time the lift component acts perpendicularly to the direction of the wind. Wind velocity and the orientation of the kite play vital roles for the lift and drag components.
After which the paper explored using a physical model and deep learning models (ANN and LSTM) to predict the tether forces for the kite. The metrics such as the score of the model and the errors were good but could have been improved, this is where we started our analysis with the data [19].

2.2.1. Data Exploration

Dimensional constraints in the data, such as variations in environmental factors, kite dynamics, and sensor calibration, could limit the generalizability of the model. To address this, it is crucial to ensure that the data used for model training encompasses a broad range of conditions, including diverse wind speeds, directions, and altitudes, as well as varying kite orientations and tension forces. By incorporating this variability, the model becomes more robust and adaptable, allowing it to function effectively across different geographical and atmospheric conditions. Additionally, continually optimizing the kite system’s performance with new data from real-world applications can help refine the model further. This dynamic approach will not only improve wind energy production but also contribute to a deeper understanding of the interplay between kite dynamics and environmental conditions, facilitating the integration of such technologies into the global energy mix under diverse operating scenarios on Earth.
Before proceeding with the training of our various models, we performed an exploratory data analysis to better understand the relationships between the different features in the dataset. One of the key steps in this process was determining the correlation between each pair of features.
Correlation measures the strength and direction of a linear relationship between two variables. It takes values in between −1 to 1, where a value above 0.5 to 1 usually indicates a positive linear relationship between the features. Whereas a value between 0.5 and 0.5 explains a neutral linear relationship, and finally a value below 0.5 to 1 will have a negative linear relationship. That being said the way to calculate the correlation is given by the common formula of:
r = i = 1 n ( X i X ^ ) ( Y i Y ^ ) i = 1 n ( X i X ^ ) 2 i = 1 n ( Y i Y ^ ) 2
where,
  • X i and Y i are the individual data points of variables X and Y respectively.
  • X ^ and Y ^ are the means of X and Y respectively.
  • n is the size of our data pool.
By calculating these correlations, we gained insights into which features were more strongly related, which helped inform the selection of features for our models. The correlation matrix, visualized as a heatmap, is shown in Figure 3. In this graph, each color intensity represents the degree of correlation, allowing us to quickly spot any multicollinearity or important feature relationships.
After which, we knew how each column related to each other, We had to scale our data. For normalization, there are two main ways: Standard Scaler and Min−Max Scaler. Standard Scaler, which standardizes the features by subtracting or removing the mean and then taking step values of the standard deviation, is often preferred when the distribution of the features is approximately Gaussian and the algorithm assumes a zero−centered dataset. This scaler has been seen to be especially effective in cases where the features have varying scales. On the contrary, Min−Max Scaler scales the input features to a distinct and fixed range, typically between 0 and 1. Based on a research paper [20], standard scaler was chosen.
After the normalization, the train test split was done in a 80, 20 split. For better understanding of the data, 4 different random seeds were taken, namely−101, 42, 77, 87.

2.2.2. Random Seeds

Random Seeds play a crucial role in ensuring consistency and reproducibility across different runs of an experiment. A random seed is essentially an initialization point for the random number generator used by algorithms that involve stochastic processes, such as the random splitting of data into training and testing sets, shuffling of datasets, or the initialization of weights in neural networks. By setting a random seed, we fix the starting point of the random number generation process, ensuring that any randomness in the model training process can be controlled and reproduced. Without setting a specific random seed, different runs of the same code could yield varying results, making it difficult to evaluate model performance in a reliable and consistent manner.
In the context of the experiment, four specific random seeds were utilized: 101, 42, 77, and 87. The primary reason for employing random seeds here is to ensure the reproducibility of results across different training and testing splits of the dataset. By setting a seed before splitting the data, it is ensured that every time the model is trained and evaluated, the same rows of data are used for training and testing, allowing us to reproduce the same outcomes consistently. This is particularly important for research purposes, where ensuring the reliability and stability of the model’s performance is a key objective. If another researcher were to replicate our study, they would be able to obtain identical results simply by using the same random seeds in the data splitting and model training process.
Furthermore, we used four distinct seeds to explore how the model performs when faced with different training and testing splits of the data. Although the dataset remains the same, the random seed dictates how the data is divided, meaning that each seed could result in different rows being assigned to the training or testing set. This allows us to examine the model’s robustness and generalization across varying partitions of the dataset, effectively testing how well it adapts to different subsets of data. If the model can maintain stable performance across multiple random seeds, it indicates that it is not overly reliant on a specific configuration of training data and is more likely to generalize well to unseen data.

2.2.3. Linear Regression

The Linear regression algorithm involves predicting the value of one variable on the basis of another variable or a set of variables. The variable that will be predicted is assigned the term the dependent variable, while the variable or list of variables used to make predictions is often called the independent variable or variables [21,22]. A general view on the formula would be:
y = m x + b
where m is the slope of the line fitting the data, x is the independent variable and b is the bias or intercept that the line makes. But in more realistic cases we would have more than one independent variable just like the case in our problem, so our linear regression will take a different form. It will look like:
y = m 1 x 1 + m 2 x 2 + m 3 x 3 + + m n x n + b
where every single m n is the slope for each independent variable, x n are all the independent variables and b is the bias or intercept that the line makes.

2.2.4. Support Vector Machine Regressor

Support Vector Regression (SVR) represents a machine learning algorithm designed for regression analysis. The primary objective of the algorithm is to uncover a function that successfully models the relationship between the input variables and a continuous target variable while looking to minimize the errors produced [23,24].
In contrast to Support Vector Machines (SVMs) utilized in classification tasks, SVRs primary goal is to identify a hyperplane that optimally accommodates data points within a continuous space. This entails mapping input variables to a high-dimensional feature space and determining the hyperplane that minimizes the distance, i.e., the distance between the nearest data points and the hyperplane. Simultaneously, SVR works to minimize prediction errors.Unlike traditional regression techniques that aim to minimize the sum of squared errors, SVR introduces a margin of tolerance, known as epsilon ( ϵ ), within which errors are considered acceptable. The SVR algorithm seeks to identify a hyperplane that lies within this epsilon margin and fits as many data points as possible, while only those points that fall outside this margin become support vectors.
SVR distinguishes itself from traditional regression approaches by using an epsilon-insensitive loss function, which allows for a degree of error tolerance. Predictions that fall within this epsilon zone are not penalized. The goal of SVR is not just to minimize errors but to do so within this predefined margin of tolerance:
L ϵ ( y , f ( x ) ) = 0 if | y f ( x ) | ϵ | y f ( x ) | ϵ otherwise
where, y is the true target, and f ( x ) is the result of the weight matrix multiplication with the inputs and adding the biases.
Thus, the SVR model tries to find a hyperplane that not only minimizes the prediction error but also maximizes the margin, ensuring a balance between model complexity and prediction accuracy.

2.2.5. Random Forest Regressor

Random Forest Regressor is one of the most famous used Machine Learning model when it comes to problems pertaining to regression. With its simplicity and high accuracy, RFR is an ensemble method with a number of independent trees which are all together tied together with a voting mechanism. The randomness of RDR is what makes it a better ensemble model than Decision Tree Regression. This randomness help RFR to reduce the covariance. The advantage it poses over an individual model is that it uses bagging methods which combine predictions from various ML models together to make a prediction [25]. Outliers do not pose that much of a hindrance to the overall working of the model and does not require much parameter tuning. Usually when it comes to hyper tuning RFR, one mostly needs to play around with the number of trees in the model. The final prediction is the average or the mean of all the decision trees. The most important thing to be remembered for this is the low correlation between individual models [26,27].
The obvious gain of Random Forest Regressor is the natural capability in overseeing and solving the overfitting issue faced by decision trees when it came to their training data sets. By utilizing random feature selection and bagging methods, we are able to mitigate the ill-effects of overfitting, which often leads to inaccurate and unwanted outcomes, a very good amount.
By utilizing random feature selection and bagging methods, we are able to mitigate the ill-effects of overfitting, which often leads to inaccurate and unwanted outcomes, a very good amount [28].
The number of trees heavily influence how much the influence of over-fitting is reduced. the result is calculated using the following formula:
y ^ = 1 T i = 1 T f t ( x )
where,
  • T is the total number of trees.
  • f t ( x ) is the prediction of the i-th tree for the input x.

2.2.6. XGBoost Regressor

Extreme Gradient Boosting (XGBoost) is an open-source library that aims to provide an efficacious and fruitful implementation of the gradient boosting algorithm [29,30]. The foundation of XGBoost lies in decision tree algorithms, where an ensemble of weak learners, typically decision trees, is iteratively constructed to minimize a loss function by optimizing residual errors from previous trees. Unlike traditional boosting methods that can suffer from high variance or overfitting, XGBoost introduces regularization parameters to control the complexity of the model, thereby improving its generalizability.
XGBoost is built upon the principles of ensemble learning, a method that combines the predictive power of multiple weak learners to form a stronger model. Ensemble learning generally comes in two main types: bagging and boosting. Bagging, or Bootstrap Aggregating, is a technique where multiple models are trained independently on different random subsets of the data and their predictions are aggregated, usually by averaging (in the case of regression) or voting (in classification tasks). This method aims to reduce variance and prevent overfitting by leveraging the “wisdom of the crowd” effect, as seen in Random Forest algorithms. In contrast, boosting, as implemented in XGBoost, is a sequential process where each new model attempts to correct the errors made by the previous models. This additive model-building approach allows boosting algorithms to focus more on hard-to-predict data points, thereby reducing bias and improving the overall accuracy of the predictive model.The XGBoost model will be fed with the inputs and a tether force corresponding to the given input will be generated [31,32].
The main differentiating factor between Random Forest Regression (RFR) and XGBoost lies in their tree-building process. In Random Forest, trees are constructed independently of each other. In contrast, XGBoost enhances the model by adding a new tree to complement those already built [33,34]. Hence why the average isn’t taken in XGBoost. The predicted output is calculated in the following way:
y ^ = i = 1 T f t ( x )
where,
  • T is the total number of trees.
  • f t ( x ) is the prediction of the i-th tree for the input x.

3. Results

This section discusses the results and findings of tether force estimation and verification of the Linear Regressor, SVR, Random Forest Regressor and XGBoost Regressor with the experimental data. Multiple flights were conducted and fed to the models as considered in test data earlier in Section 2.1. The models are tested with various random seed values to check it robustness with different scenarios. Below we discuss the results pertaining to each machine learning algorithm and we finally at the end compare all the metrics such as MAE, RMSE and R 2 Error.
The original paper had a physical model which was simulated on MATLAB Simulink. Tether force was predicted using ANN and LSTM Models [19]. We shall discuss how our different models fared with the different random seeds taken now.

3.1. Tether Force Validation

The flight tests were taken up on the beaches of National Institute of Technology Karnataka, Surathkal India. Maintaining a consistent 24-m tether length, the kite maneuvered within its designated airspace. The kite traced figure-eight patterns at different wind speeds, with data being collected throughout. The force from the power lines is measured using a load cell [19]. The combined dataset of recorded kite orientation, altitude, and wind speed served as the input features for predicting tether force using four regression models: Linear Regression, Support Vector Machine (SVM), Random Forest Regressor, and XGBoost Regressor. The tether force is estimated using the above models which is trained with our experimental data. After comparing the performance of each, we’d choose the best one.

3.1.1. Linear Regression

Figure 4 compares predicted tether force with experimental tether force. In the figure, y-predicted are the values predicted by the Linear Regression model and y-test represents the tether force got after experiments on the beach. The Figure 4a–d shows the comparison of simulated tether force with experimental force in the graphs for different random seed values.
As seen from Figure 4a–d, Linear Regression model performs well for values pertaining to calm nature of the winds, but results are haphazard when there is a slight change in the input values.

3.1.2. Support Vector Machine Regressor (SVR)

Figure 5 compares predicted tether force with experimental tether force. In the figure, y-predicted are the values predicted by the Support Vector Machine Regressor model and y-test represents the tether force gotten in the experiments done on the beach. The Figure 5a–d shows the comparison of simulated tether force with experimental force in the graphs for different random seed values.
SVR gives good results overall, the difference in predicted values and real-life values aren’t that off from each other. However in most extreme cases, the error is very high as seen in Figure 5a.

3.1.3. Random Forest Regressor

Figure 6 compares predicted tether force with experimental tether force. In the figure, y-predicted are the values predicted by the Random Forest Regressor model and y-test represents the tether force got in the experiments done on the beach. The Figure 6a–d shows the comparison of simulated tether force with experimental force in the graphs for different random seed values.
Random Forest Regressor is performing better than the Linear Regression. It is able to react well to erratic turbulant conditions. However, the error doesn’t diminish that much.

3.1.4. XGBoost Regressor

Figure 7 compares predicted tether force with experimental tether force. In the figure, y-predicted are the values predicted by the Random Forest Regressor model and y-test represents the tether force gotten by the experiments done on the beach. The Figure 7a–d shows the comparison of simulated tether force with experimental force in the graphs for different random seed values.
The XGBoost Regressor performs best when it comes to predicting tether force for both calm and extreme wind conditions. Figure 7a,d are best examples of this, the sudden extreme is very well predicted by the model, reducing the error in tether force prediction.

3.1.5. Comparison and Validations of Models

The Linear Regression, SVR, RF and XGBoost model results are compared with the actual value measured in the field tests for the combined analysis of the models. The Figure 8 shows the comparison of the proposed methods with the experimental values for the different random seed values that were taken. From the Figure 8a–c, we can infer that the XGBoost performs the best in all 5 cases when it comes to the error reduction and how close the predicted tether force is to the field data. Even in the Regression Line with 95% CI Level, in the Figure 9, XGBoost is seen to be the best. The random seeds that were taken were 101, 42, 77, 87.
The tether force estimation errors for the 4 different seeds taken are listed in Figure 10. Now an important part that is left for us to do is compare and analysis the errors associated with each model that is been used. To do so we shall employ three different error parametrics namely, Root Mean Square Error (RMSE), Mean Absolute Error (MAE), and R-squared ( R 2 ) method [35].

RMSE Method

This method studies the standard deviation that is observed while estimating the tether force by using the equation:
R M S E F T = i = 1 K ( F a c t u a l F e s t i m a t e d ) 2 K
where, R M S E F T denotes RMSE pertaining to the tether force, F a c t u a l is the tether force obtained from field testing, F o r e d i c t is the predicted tether force predicted by the various machine learning models and lastly K is the number of definitive data points.

MAE Method

This method entails the calculation of the mean absolute error involving the tether force measurement. The absolute error is calculated by taking the mod of the difference between actual and predicted tether force. The formula to calculate MAE for different cases of tether force is given:
M A E F T = i = 1 K | F a c t u a l F e s t i m a t e d | K
where, M A E F T is the mean absolute error observed in the tether force, and K is the number of non-zero data points.

R 2 Method

In assessing the agreement between simulated and actual tether force values, the R-squared statistic serves as a metric for goodness-of-fit. This measure, ranging from 0 to 1, reflects the proportion of variance in the expected tether force explained by the model. Higher values of R-squared indicate a closer alignment between predictions and observations. The formula used to evaluate the error by using the R 2 method is given below:
R F T 2 = 1 S S R S S T = 1 i = 1 N ( F a c t u a l F e s t i m a t e d ) 2 i = 1 N ( F a c t u a l F a c t u a l N ) 2
Figure 10 shows the performance analysis of the different models for the random seed values that were taken. In Figure 10a We can see that XGBoost, SVM and Random Forest are giving the smallest Mean Absolute Errors when it comes to all the seeds all below 40 N. At the end, we take an average and XGBoost gives the best value of 32.1 N.
In Figure 10c, We can see that when it comes to RMSE, again we see XGBoost performing extremely well having a RMSE of 52.3, SVM and Random Forest are doing well in a some seeds but little poorly in the others. Linear Regression has a RMSE over 150, which is very high.
Finally in Figure 10, we compare the R 2 of all the models, once again with XGBoost leading the way with an outstanding 0.93 score while SVM and Random Forest both have a score of 0.88 and lastly Linear Regression has a poor score of 0.36.

4. Discussion

The study was conducted to address the growing need for accurate and efficient tether force prediction in Airborne Wind Energy Systems (AWES), which is vital for ensuring system safety and operational efficiency. Traditional physics-based models, while effective, often struggle with computational complexity and adaptability to varying conditions. By employing machine learning techniques, this study aimed to develop a more flexible, data-driven approach that can generalize across different operating environments. The results, particularly the success of the XGBoost Regressor, demonstrate that machine learning can significantly enhance tether force prediction accuracy, thereby contributing to the overall reliability of AWES.
Our findings revealed that the XGBoost Regressor outperformed other models such as Linear Regression, Support Vector Machine Regression, and Random Forest Regression, particularly in terms of error metrics like MAE, RMSE, and R 2 . These results are consistent with previous research that highlights XGBoost’s robustness in handling nonlinear relationships and high-dimensional data, as seen in Table 2 and Table 3. Additionally, the model’s ability to identify influential variables provides an interpretative edge, though it still functions largely as a black-box model. Other models showed mixed results: Random Forest exhibited good performance but occasional instability, while Linear Regression underperformed due to the complexity of the dataset. These findings suggest that, although traditional models have their merits, machine learning approaches, especially XGBoost, are better suited for tether force prediction in dynamic environments. Furthermore, our model also outperforms other models and architectures that have been previously used in the same domain. This superiority is demonstrated in the table below, where the key performance metrics of our model are compared to those from prior studies. Additionally, the model’s ability to identify influential variables provides an interpretative edge, though it still functions largely as a black-box model. These findings suggest that, although traditional models have their merits, machine learning approaches, especially XGBoost, are better suited for tether force prediction in dynamic environments.
The strong points of this study include the use of comprehensive datasets and the comparative analysis of various models. However, the study is limited by the dataset’s range of conditions, which may not capture extreme environmental variations. Future research should focus on expanding the dataset to cover more diverse scenarios and explore deep learning models such as CNNs or RNNs for enhanced spatiotemporal analysis. Additionally, integrating the models into real-time control systems for AWES could open new avenues for practical applications. Overall, this study contributes to the ongoing efforts to improve AWES performance by demonstrating the efficacy of machine learning in predicting tether forces.

5. Conclusions

Airborne wind energy has the capacity to address certain limitations inherent in traditional wind turbines. The crucial assessment of tether force is integral to gauging the potential amount of power the system can produce. Through the strategic steering of the kite in crosswind figure-eight maneuvers, the system effectively harnesses wind energy. Through a series of controlled field experiments, we acquired data on kite flight dynamics across diverse scenarios. This data subsequently populated the tables utilized within our models.
We evaluate the performance of the proposed methods for tether force estimation using three metrics: RMSE, MAE, and R 2 . This evaluation is based on a comparison with experimental data. While the Linear Regression Model exhibits errors of 156 N (RMSE) and 119 N (MAE) in tether force estimation, it still achieves a moderate performance index of 0.36 ( R 2 ). Despite an average error of 66.8 N (RMSE) and 36.7N (MAE) in tether force estimation, the proposed SVM model exhibits a strong performance index of 0.88 based on the R 2 metric. Similarly despite an error of 66.3 N (RMSE) and 40.2 N (MAE), the Random Forest Model’s R 2 performance index of 0.88 suggests good overall accuracy in tether force prediction. When estimating tether force, the proposed XGBoost model exhibited an overall error of 52.3 Newtons as measured by the RMSE method, and 32.1 Newtons using the MAE method. Its performance was further indicated by an R 2 value of 0.93.
The findings from this study underscore the significant potential of advanced tether force estimation methods in improving the efficiency of airborne wind energy systems. The comparison of various models demonstrates the effectiveness of these approaches in accurately predicting tether force, with the XGBoost model achieving the highest accuracy. This advancement in tether force estimation is crucial for optimizing kite performance and enhancing the overall power generation capabilities of airborne wind energy systems. Future research will focus on further refining these models and exploring additional factors that may influence tether force. Additionally, there is potential for integrating these models into real-time systems for dynamic kite control, which could lead to more efficient energy capture and contribute to the broader adoption of airborne wind energy technology.

Author Contributions

A.G., Conceptualization, Methodology, Software, Validation, Formal Analysis, Investigation, Writing—original draft preparation, Writing—Review and Editing and Visualization; Y.K., Conceptualization, Validation, Investigation, Resources, Data Curation, Writing—Review and Editing, Supervision and Project Admistration; P.K., Conceptualization. All authors have read and agreed to the published version of the manuscript.

Funding

This research received no external funding.

Institutional Review Board Statement

Not applicable.

Informed Consent Statement

Not applicable.

Data Availability Statement

The data presented in this study are available on request from the corresponding author. The data is restricted as it belongs to the college, National Institute of Technology Karnataka, Surathkal, Mangalore, India.

Acknowledgments

The authors would like to acknowledge the support provided by the Electrical and Electronics Engineering Department at the National Institute of Technology Karnataka, Surathkal, Mangalore, India.

Conflicts of Interest

The authors assert that there are no identifiable conflicting financial interests or personal relationships that might have been perceived to influence the work presented in this paper.

Abbreviations

The following abbreviations are used in this manuscript:
HAWTHorizontal axis wind turbines
AWESAirborne Wind Energy Systems
ANNArtificial Neural Network
LSTMLong Short Term Memory
SVRSupport Vector Regression
RFRRandom Forest Regression
RMSERoot Mean Square Error
MAEMean Absolute Error

References

  1. Salameh, M.G. Can renewable and unconventional energy sources bridge the global energy gap in the 21st century? Appl. Energy 2003, 75, 33–42. [Google Scholar] [CrossRef]
  2. Jurasz, J.; Canales, F.A.; Kies, A.; Guezgouz, M.; Beluco, A. A review on the complementarity of renewable energy sources: Concept, metrics, application and future research directions. Sol. Energy 2020, 195, 703–724. [Google Scholar] [CrossRef]
  3. Stančin, H.; Mikulčić, H.; Wang, X.; Duić, N. A review on alternative fuels in future energy system. Renew. Sustain. Energy Rev. 2020, 128, 109927. [Google Scholar] [CrossRef]
  4. Lund, H.; Østergaard, P.A.; Connolly, D.; Mathiesen, B.V. Smart energy and smart energy systems. Energy 2017, 137, 556–565. [Google Scholar] [CrossRef]
  5. Akbari, V.; Naghashzadegan, M.; Kouhikamali, R.; Afsharpanah, F.; Yaïci, W. Multi-Objective Optimization and Optimal Airfoil Blade Selection for a Small Horizontal-Axis Wind Turbine (HAWT) for Application in Regions with Various Wind Potential. Machines 2022, 10, 687. [Google Scholar] [CrossRef]
  6. Elkodama, A.; Ismaiel, A.; Abdellatif, A.; Shaaban, S.; Yoshida, S.; Rushdi, M.A. Control Methods for Horizontal Axis Wind Turbines (HAWT): State-of-the-Art Review. Energies 2023, 16, 6394. [Google Scholar] [CrossRef]
  7. Malz, E.C.; Verendel, V.; Gros, S. Computing the power profiles for an Airborne Wind Energy system based on large-scale wind data. Renew. Energy 2020, 162, 766–778. [Google Scholar] [CrossRef]
  8. Malz, E.C.; Walter, V.; Göransson, L.; Gros, S. The value of airborne wind energy to the electricity system. Wind Energy 2022, 25, 281–299. [Google Scholar] [CrossRef]
  9. Ghorani, M.M.; Karimi, B.; Mirghavami, S.M.; Saboohi, Z. A numerical study on the feasibility of electricity production using an optimized wind delivery system (Invelox) integrated with a Horizontal axis wind turbine (HAWT). Energy 2023, 268, 126643. [Google Scholar] [CrossRef]
  10. Johansen, K. Blowing in the wind: A brief history of wind energy and wind power technologies in Denmark. Energy Policy 2021, 152, 112139. [Google Scholar] [CrossRef]
  11. Caduff, M.; Huijbregts, M.A.; Althaus, H.J.; Koehler, A.; Hellweg, S. Wind power electricity: The bigger the turbine, the greener the electricity? Environ. Sci. Technol. 2012, 46, 4725–4733. [Google Scholar] [CrossRef] [PubMed]
  12. Schmehl, R. Airborne Wind Energy—An innovative renewable energy technology. In Proceedings of the Aerospace Engineering Seminar, Toronto, ON, Canada, 30 July–1 August 2019. [Google Scholar] [CrossRef]
  13. Cayon, O.; Watson, S.; Schmehl, R. Kite as a Sensor: Wind and State Estimation in Tethered Flying Systems. Wind Energy Sci. Discuss. 2025, 2015, 1–41. [Google Scholar] [CrossRef]
  14. Candade, A.; Ranneberg, M.; Schmehl, R. Structural analysis and optimization of a tethered swept wing for airborne wind energy generation. Wind Energy 2020, 23, 1006–1025. [Google Scholar] [CrossRef]
  15. Schelbergen, M.; Kalverla, P.; Schmehl, R.; Watson, S. Clustering wind profile shapes to estimate airborne wind energy production. Wind Energy Sci. Discuss. 2020, 2020, 1–34. [Google Scholar] [CrossRef]
  16. Aza-Gnandji, M.; Fifatin, F.X.; Hounnou, A.H.J.; Dubas, F.; Chamagne, D.; Espanet, C.; Vianou, A. Complementarity between Solar and Wind Energy Potentials in Benin Republic. Adv. Eng. Forum 2018, 28, 128–138. [Google Scholar] [CrossRef]
  17. Zolfaghari, M.; Co, S.; Azarsina, F.; Kani, A. Feasibility Analysis of Airborne Wind Energy System (AWES) Pumping Kite (PK). J. Adv. Res. Fluid Mech. Therm. Sci. J. Homepage 2020, 74, 133–143. [Google Scholar] [CrossRef]
  18. Cherubini, A.; Papini, A.; Vertechy, R.; Fontana, M. Airborne Wind Energy Systems: A review of the technologies. Renew. Sustain. Energy Rev. 2015, 51, 1461–1476. [Google Scholar] [CrossRef]
  19. Castelino, R.V.; Kashyap, Y.; Kosmopoulos, P. Airborne Kite Tether Force Estimation and Experimental Validation Using Analytical and Machine Learning Models for Coastal Regions. Remote Sens. 2022, 14, 6111. [Google Scholar] [CrossRef]
  20. De Amorim, L.B.V.; Cavalcanti, G.D.C.; Cruz, R.M.O. The choice of scaling technique matters for classification performance. Appl. Soft Comput. 2022, 133, 109924. [Google Scholar] [CrossRef]
  21. Maulud, D.; Abdulazeez, A.M. A Review on Linear Regression Comprehensive in Machine Learning. J. Appl. Sci. Technol. Trends 2020, 1, 140–147. [Google Scholar] [CrossRef]
  22. Filzmoser, P.; Nordhausen, K. Robust linear regression for high-dimensional data: An overview. Wiley Interdiscip. Rev. Comput. Stat. 2021, 13, e1524. [Google Scholar] [CrossRef]
  23. Zheng, Y.; Ge, Y.; Muhsen, S.; Wang, S.; Elkamchouchi, D.H.; Ali, E.; Ali, H.E. New ridge regression, artificial neural networks and support vector machine for wind speed prediction. Adv. Eng. Softw. 2023, 179, 103426. [Google Scholar] [CrossRef]
  24. Tariq, A.; Jiango, Y.; Li, Q.; Gao, J.; Lu, L.; Soufan, W.; Almutairi, K.F.; ur Rahman, M.H. Modelling, mapping and monitoring of forest cover changes, using support vector machine, kernel logistic regression and naive bayes tree models with optical remote sensing data. Heliyon 2023, 9, e13212. [Google Scholar] [CrossRef] [PubMed]
  25. Ita, K.; Prinze, J. Machine learning for skin permeability prediction: Random forest and XG boost regression. J. Drug Target. 2024, 32, 57–65. [Google Scholar] [CrossRef] [PubMed]
  26. Wang, G.; Lyu, Z.; Li, X. An Optimized Random Forest Regression Model for Li-Ion Battery Prognostics and Health Management. Batteries 2023, 9, 332. [Google Scholar] [CrossRef]
  27. Gatera, A.; Kuradusenge, M.; Bajpai, G.; Mikeka, C.; Shrivastava, S. Comparison of random forest and support vector machine regression models for forecasting road accidents. Sci. Afr. 2023, 21, e01739. [Google Scholar] [CrossRef]
  28. Mrabet, Z.E.; Sugunaraj, N.; Ranganathan, P.; Abhyankar, S. Random Forest Regressor-Based Approach for Detecting Fault Location and Duration in Power Systems. Sensors 2022, 22, 458. [Google Scholar] [CrossRef] [PubMed]
  29. Zhang, X.; Yan, C.; Gao, C.; Malin, B.A.; Chen, Y. Predicting Missing Values in Medical Data Via XGBoost Regression. J. Healthc. Inform. Res. 2020, 4, 383–394. [Google Scholar] [CrossRef] [PubMed]
  30. Dong, J.; Chen, Y.; Yao, B.; Zhang, X.; Zeng, N. A neural network boosting regression model based on XGBoost. Appl. Soft Comput. 2022, 125, 109067. [Google Scholar] [CrossRef]
  31. Nguyen, H.; Cao, M.T.; Tran, X.L.; Tran, T.H.; Hoang, N.D. A novel whale optimization algorithm optimized XGBoost regression for estimating bearing capacity of concrete piles. Neural Comput. Appl. 2023, 35, 3825–3852. [Google Scholar] [CrossRef]
  32. Wang, R.; Wang, L.; Zhang, J.; He, M.; Xu, J. XGBoost Machine Learning Algorism Performed Better Than Regression Models in Predicting Mortality of Moderate-to-Severe Traumatic Brain Injury. World Neurosurg. 2022, 163, e617–e622. [Google Scholar] [CrossRef]
  33. Sardar, I.; Karakaya, K.; Makarovskikh, T.; Abotaleb, M.; Aflake, S.; Mishra, P.; Gardazi, H. Machine Learning-Based COVID-19 Forecasting: Impact on Pakistan Stock Exchange. Int. J. Agricult. Stat. Sci 2021, 17, 53–61. [Google Scholar]
  34. Pan, B. Application of XGBoost algorithm in hourly PM2.5 concentration prediction. IOP Conf. Ser. Earth Environ. Sci. 2018, 113, 012127. [Google Scholar] [CrossRef]
  35. Chicco, D.; Warrens, M.J.; Jurman, G. The coefficient of determination R-squared is more informative than SMAPE, MAE, MAPE, MSE and RMSE in regression analysis evaluation. PeerJ Comput. Sci. 2021, 7, e623. [Google Scholar] [CrossRef] [PubMed]
Figure 1. The machine learning pipeline that was followed throughout the experimentation of tether force estimation.
Wind 05 00005 g001
Figure 2. This diagram depicts the kite setup used in the Airborne Wind Energy System (AWES) project for data collection and analysis. It showcases the main components, including the kite, control bar, control lines (blue), power lines (red), and their interactions with the forces acting on the system. Key forces such as the total tether tension ( F T ) and its components ( F x , F y , F z ) are represented, along with the kite’s aerodynamic motions—pitch, roll, and yaw. The setup also illustrates the influence of the wind direction and the spatial relationship between the kite and the ground reference frame (X, Y, Z), with the azimuthal angle ( ϕ ) defining the kite’s orientation [19].
Wind 05 00005 g002
Figure 3. Correlation of the input columns.
Wind 05 00005 g003
Figure 4. Verification of the Linear Regression model with experimental data: figures (ad) represents the different random seed condition.
Wind 05 00005 g004
Figure 5. Verification of the Support Vector Machine Regressor (SVR) model with experimental data: figures (ad) represents the different random seed condition.
Wind 05 00005 g005
Figure 6. Verification of the Random Forest Regressor model with experimental data: figures (ad) represents the different random seed condition.
Wind 05 00005 g006
Figure 7. Verification of the XGBoost Regressor model with experimental data: figures (ad) represents the different random seed condition.
Wind 05 00005 g007aWind 05 00005 g007b
Figure 8. Combined analysis of tether force estimation methods—RF, SVM, XGBoost method.
Wind 05 00005 g008
Figure 9. Regression and scatter plots for XGBoost, Linear Regression, SVR, and Random Forest with random seed 101: Figures (ad) illustrate the performance of each model, highlighting the 95% confidence intervals. Among the models, XGBoost demonstrates the best performance, showing the closest alignment of predictions with actual values despite some scatter, reflecting its ability to effectively capture complex patterns in the dataset.
Wind 05 00005 g009
Figure 10. Performance analysis of Linear Regression, SVR, RF and XGBoost model using RMSE, MAE, and R 2 methods for the different random seeds.
Wind 05 00005 g010
Table 1. Descriptive statistics of the dataset parameters. The dataset comprises 8473 data points, detailing kite motion dynamics and environmental conditions. Metrics include yaw, pitch, roll, altitude, geographical coordinates (latitude and longitude), and calibration values for acceleration, gyroscope, magnetometer and Wind Speed in m/s.
ParameterCountMeanStd. Dev.Min25%50%Max
Yaw8473−58.3763107.9977−270.0000−122.7673−32.217989.9804
Pitch847379.8286115.6201−180.000040.7037131.6634179.9786
Roll84735.794236.8290−90.0000−22.24697.157790.0000
Altitude (m)847312.75627.3817−5.75009.750014.690024.0100
Latitude847313.00920.000113.008913.009113.009213.0095
Longitude847374.78840.000174.788274.788474.788574.7889
Accel_Cal84733.00.03.03.03.03.0
Gyro_Cal84733.00.03.03.03.03.0
Mag_Cal84732.96870.19341.03.03.03.0
System_Cal84733.00.03.03.03.03.0
Wind speed (m/s)84733.030.5650.682.73.04.65
Table 2. Table that shows the comparative metrics when it came to predicting the resulting tether force generated by feeding the same inputs. This experiment outperforms previous attempts in accuracy and error reduction, demonstrating improved model generalization and reliability in similar conditions.
ModelMAE (in N)RMSE (in N) R 2
Artificial Neural Network (Steady) [19]1151500.36
LSTM (Steady) [19]1001260.43
Physical Model (Steady) [19]941270.52
Artificial Neural Network (Turbulent) [19]1311870.28
LSTM (Turbulent) [19]1301680.43
Physical Model (Turbulent) [19]1281790.29
XGBoost Regressor32.152.30.93
Table 3. The table showcases the percentage error of all models evaluated in the experiment. The percentage error is calculated by dividing the Mean Absolute Error (MAE) and Root Mean Square Error (RMSE) for each random seed by the mean tether force of the testing batch corresponding to that random seed. The results are then averaged across all random seeds to ensure consistency and robustness in the comparison of model performance.
ModelMAE (in %)RMSE (in %)
Linear Regression97.26145.21
RFR30.7650.33
SVR46.3178.53
XGBoost Regressor13.6822.36
Disclaimer/Publisher’s Note: The statements, opinions and data contained in all publications are solely those of the individual author(s) and contributor(s) and not of MDPI and/or the editor(s). MDPI and/or the editor(s) disclaim responsibility for any injury to people or property resulting from any ideas, methods, instructions or products referred to in the content.

