Abstract
This study aims to evaluate wind speed and significant wave height data from the Copernicus Marine Environment Monitoring Service (CMEMS) reanalysis using buoy measurements for offshore energy application off the east coast of Brazil. Such analysis has become important, since reanalysis datasets can be fundamental tools in identifying regions with wind energy potential that are suitable for the installation of offshore farms. Two sets of reanalysis were used: wind speed (with spatial resolution of 0.25° and temporal resolution of 6 h) and significant wave height (with spatial resolution of 0.2° and temporal resolution of 3 h). For validation, seven MetOcean buoys were selected. In the statistical validation, Pearson’s correlation, coefficient of determination (R2), slope of the straight line, root mean square error (RMSE), mean square error (MSE), probability density function (PDF), mean and standard deviation were calculated. In the evaluation of offshore wind energy resources, the calculation of energy density was performed. The results showed correlations above 0.70 for wind speed and above 0.91 for significant wave height, and additionally, the RMSE values showed maximums of 2.31 m/s for wind speed and 0.28 cm for significant wave height. In the PDF comparison of buoy data and reanalysis, similarities were observed, mainly in the PDF parameters. The energy density presented values consistent with other studies (352–461 W/m²). The results show that the reanalysis data can be applicable in studies focusing on offshore wind potential.
1. Introduction
Brazil has a large territorial extension with extensive renewable resources that have been used to meet the electricity demands of its population. Among the resources, the production of continental wind energy has grown in recent years [1].
According to data from the National System Operator, wind energy was responsible for producing approximately 4.66 GWh in 2019 [2], but this number represents only onshore generation with wind turbines installed on land. Wind exploration is expanding to the ocean (offshore) where there are areas with higher wind speeds and smaller variations in wind speed due to the absence of physical barriers, such as mountains, buildings and vegetation [3].
The use of offshore wind energy in Brazil is of paramount importance, since approximately 25% of the Brazilian population resides in coastal areas [4], and therefore the installation of offshore wind farms can be close to the places of demand. As this natural resource is abundant in several Brazilian regions, it is important to carry out studies that identify locations for the installation of offshore wind farms and to try to take advantage of the energy capacity to meet the population’s demand.
Observational data of significant wave height and wind speed are often used to define the characteristics of offshore areas [5]. These data are obtained through automatic stations installed in ocean buoys [6]. However, the main problems that still hinder studies related to offshore data is the lack of wind measurement and significant wave height data in oceanic areas, due to the technical challenges and high costs associated with conducting ocean measurement campaigns [7]. Also, compared to the amount of onshore measurements, offshore measurements tend to have fewer in situ stations: only 13 buoys operate over the vast offshore region [8].
Faced with the problem of lack of in situ data, other data sources have played a fundamental role in the characterization and monitoring of winds and waves. Currently, several efforts are being made to overcome the lack of observational data. The use of high-resolution models, satellite, and reanalysis estimations is increasing in frequency [7,9,10,11,12,13]. In Brazil, several studies have evaluated the performance of different datasets to calculate the offshore wind resource, and others have compared it with observations in buoys [14,15,16,17]. In this sense, the studies concluded that there are some advantages, especially in the use of reanalysis data, as these data have high spatial and temporal resolutions and no gaps. Although there are advantages in using reanalysis, they have failed data series, especially with the assimilation of different satellites data that result in inharmonious temporal series, thus it is necessary to constantly assess the quality of the data.
The Copernicus Marine Environment Monitoring Service (CMEMS) reanalysis is the reprocessing of a long series of analyses, containing a set of several oceanographic and meteorological variables for oceanic areas. Those data were used in several applications in different regions of the world [18,19,20,21]. To exploit this large source of information for potential offshore wind energy production, it is important to determine the consistency of the CMEMS reanalysis with observational references. Thus, the main objective of this study is to validate the reanalysis with buoy measurements for periods when data were available. In addition, the energy density estimates are calculated to identify geographical distribution of potential energy resources.
2. Materials and Methods
2.1. Data
2.1.1. CMEMS
The “Wind” (reference: WIND_GLO_WIND_L4_REP_OBSERVATIONS_012_006) and “Height” (reference: GLOBAL_REANALYSIS_WAV_001_032) data from the global reanalysis of the Copernicus Marine Environment Monitoring Service (CMEMS) were used. The first dataset that was used is the reprocessing of a long series of global analyses of 10 m high wind speed oceans, with spatial resolutions of 0.25° latitude and longitude, and with a temporal resolution of 6 h (00, 06, 12, 18 UTC). These data are calculated based on various sources of wind observation data obtained through remote sensing (ERS-1, ERS-2, QuikSCAT, RapidScat, ASCAT-A, ASCAT-B, HY2A and OceanSat-2, SSM/I, SSMIS, WindSat) and atmospheric reanalysis (ERA-Interim), where these data are interpolated by kriging methods to build a series of wind climatology from 1992 to the present time, to describe the spatial characteristics of the wind only over oceanic areas [22,23].
The wave height dataset is also part of the CMEMS services: it is a global wave reanalysis that describes the ocean characteristics as significant wave height (Hs) or the mean wave period available from 1993 to the present time. The CMEMS wave reanalyses provide integrated data with a time interval of 3 h (00, 03, 06, 09, 12, 15, 18 and 21 UTC), with a spatial resolution of 0.2° [24]. This reanalysis takes into account the ocean currents from the physical reanalysis of the GLORYS12 ocean data, along with the wave height obtained from Sentinel 1 SAR (Synthetic Aperture Radar) to Sentinel-3A missions; a more detailed description can be obtained from Chune et al. (2020b) [25].
2.1.2. Buoys
The performance of the CMEMS reanalysis in the coastal region of Brazil is evaluated by comparison with seven MetOcean buoys located along the Brazilian east coast. These buoys are part of the Brazilian Navy’s National Buoys Program (PNBOIA), which aims to provide near real-time meteorological and oceanographic information on points of the South Atlantic Ocean. The data is available on the Brazilian Navy database [8], where hourly values of wind speed and significant wave height (Hs) were downloaded in two dataset: one containing wind speed information and the other containing significant wave heights. The comparison with CMEMS was carried out for January 2011 to December 2018. The buoy locations are shown in Figure 1. The buoy location names, position, and height of the anemometer are listed in Table 1.
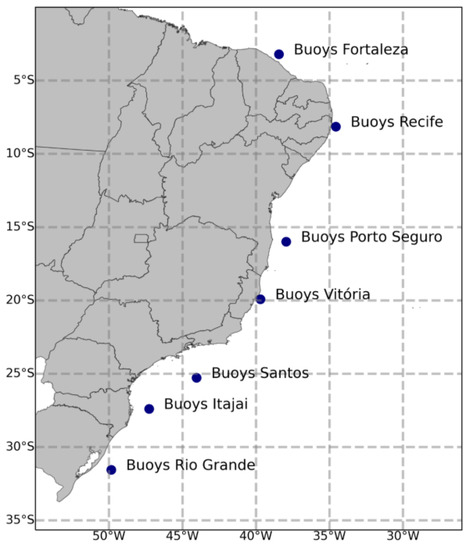
Figure 1.
Locations of automatic stations installed on buoys to measure wind speed and wave height.

Table 1.
Location of the MetOcean buoys used in the assessments.
The wind speed data measured by the ocean buoys are defined at the heights of the anemometers, mentioned in Table 1. In order to make the comparison with the data from the CMEMS reanalysis, the instrument height corrections for 10 m was applied, according to [26,27], where the conversion considers a neutral and stable boundary layer. The following equation is applied when the anemometer is less than 10 m high:
where represents the wind speed measured on the anemometer; Z is the height of the anemometer; K is the constant (equal to 0.4); Z0 the roughness of the ocean surface (9.5 × 10⁻⁵); and Cd is the drag coefficient, the value of Cd varies according to wind speed and sea conditions, thus, it was assumed that sea conditions did not interfere with wind speed, defining a constant Cd (1.4 × 10⁻³).
2.2. Statistics
The purpose of this work will be to validate the data from the CMEMS reanalysis, followed by an application of the data in offshore resource calculations. The wind speed and variables were validated. For quantitative statistical validation, linear regressions were calculated between the buoy data and reanalysis, Pearson correlation, coefficient of determination (R²), slope of the straight line, root-mean-square error (RMSE), mean-square error (MSE), in addition to the mean and standard deviation of the buoys’ and CMEMS data. The probability density function (PDF) of the buoy and CMEMS was compared to confirm that the reanalysis estimates are consistent with the buoy measurements across the range of variability of the wind speed and data. In addition, the distribution parameters (shape and Weibull scale) were extracted to verify the similarity between the buoy and CMEMS data across the variability series. A more detailed description of how to perform these statistical calculations can be found in [28].
2.3. Offshore Resource Estimates—Energy Density Estimate
When carrying out projects to install wind farms, various information related to the wind must be calculated. This information becomes important during the decision, which makes investments to explore offshore wind resources viable [29], for example, the energy density to identify areas usable for offshore energy generation that are suitable for the development of wind farms. The energy density in some areas where buoys are installed (Fortaleza and Rio Grande) was estimated, shown in Figure 1, since there are wind farms to start construction.
To calculate the energy density (E), the methods suggested by Jamil et al. [30], which uses the scale (c) and shape (k) parameters of the distribution, the gamma function (Γ), and the air density () equal to 1.225 kg/m³. E is expressed in W/m², calculated according to Equation (2) [28]:
3. Results
3.1. Statistical Validation
Figure 2 shows the scatter plot comparing the CMEMS reanalyses with data from observations of wind speed, in addition to presenting Pearson’s correlation, coefficient of determination (R²), and slope of the straight line for the evaluated targets. Buoys missing data were not applied in this analysis. In all sites, the estimated winds were highly correlated and the R² coefficient was between 0.49 and 0.79. As the reanalysis data is made available through grid points, the distances of the buoy locations in relation to the grid point were calculated when the information was extracted. Figure 2a,c,e,g correspond to the buoys located closer to the grid point, while Figure 2b,d,f show greater distances. In all evaluated locations, there is a tendency of the reanalysis to underestimate or overestimate the observations that present wind speed with high or low intensity, respectively. According to [31], the bias is caused by the data from the reanalysis having been obtained based on information every 6 h, thus, we assume that the bias originates due to temporal resolution in the data interpolation process that make the reanalysis available. As shown in Figure 2, the slope of the regression lines varied between 0.3 and 1.21. According to [21], this can be defined as a proportional bias to differentiate from a constant bias in which the regression line is parallel but off-diagonal.
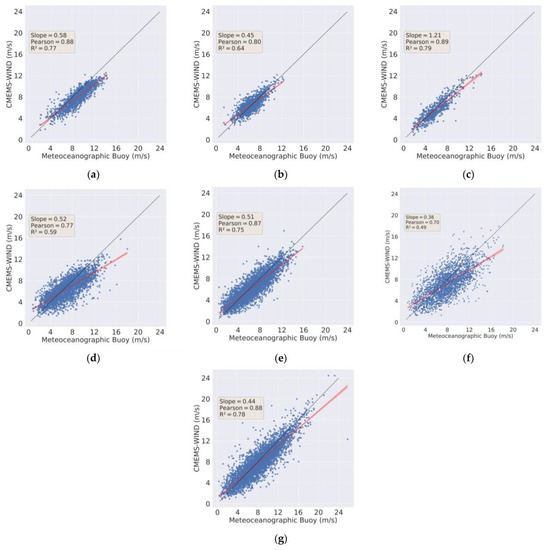
Figure 2.
Linear regression graphs comparing wind speed data estimated by CMEMS and MetOcean buoys at the following locational targets: Fortaleza (a), Recife (b), Porto Seguro (c), Vitória (d), Santos (e), Itajaí (f), and Rio Grande (g). The red line is the best fit linear regression line, with a 99% confidence interval. The black dashed line is the reference for observed data (the closer the red line is to the black dashed line, the better the CMEMS reanalysis skill).
Figure 2 and Figure 3 show the scatter plot comparing the Hs reanalysis and in situ observations. Compared with wind speed, the Hs data show a smaller distribution with proportional bias, with highest correlation and R² above 0.83 (Figure 4). In all evaluated locations, the regression line follows close to the main diagonal line (dashed black line), but similar to wind speed there is a tendency to overestimate small and underestimate large values of Hs. The high performance of Hs via reanalysis is also observed in other validation studies [32,33]. The CMEMS showed worst accuracy in buoys to the south Brazil, where wind speed and Hs are higher.
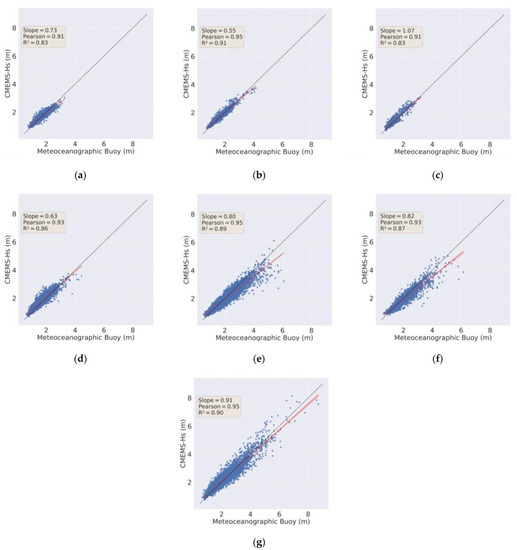
Figure 3.
Linear regression graphs comparing Hs data estimated by CMEMS and MetOcean buoys at the following locational targets: Fortaleza (a), Recife (b), Porto Seguro (c), Vitória (d), Santos (e), Itajaí (f), and Rio Grande (g). The red line is the best fit linear regression line, with a 99% confidence interval. The black dashed line is the reference for observed data (the closer the red line is to the black dashed line, the better the CMEMS reanalysis skill).
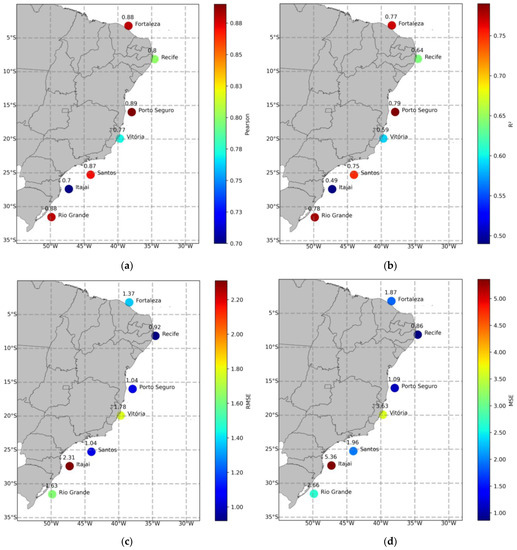
Figure 4.
Correlation (a), coefficient of determination (b), RMSE (c) and MSE (d) values between buoy wind speed measurements and CMEMS reanalysis.
Figure 4 and Figure 5 present Pearson’s correlation coefficient, determination coefficient, RMSE and MSE for wind speed (m/s) and Hs (meters), respectively. It is possible to observe that Pearson’s correlations for wind speed at 10 m were greater than 0.70. The targets with the lowest correlations and the highest mean deviations (Recife, Vitória and Itajaí) are furthest from the grid points. The Itajaí buoy had the highest RMSE for wind speed (2.31 m/s). Pearson’s correlation for Hs is greater than 0.91, RMSE is less than 28 cm. Altimetry missions aboard satellites have a high degree of reliability and exert greater influence on the interpolation methods for Hs data, thus, the distance from the grid point did not result in larger errors.
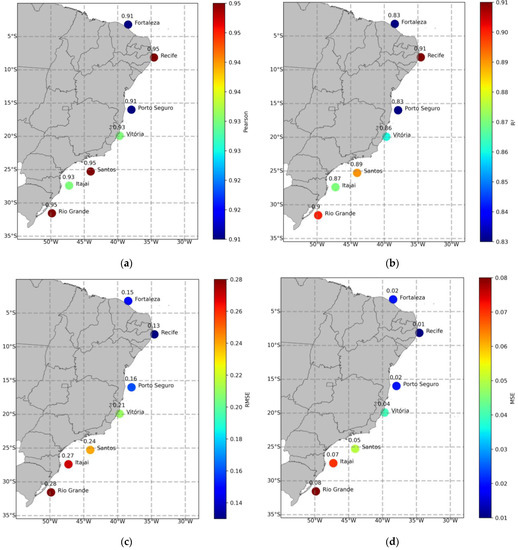
Figure 5.
Correlation (a), coefficient of determination (b), RMSE (c) and MSE (d) values between the Hs measures of the buoys and CMEMS reanalysis.
The probability density function (PDF) of the CMEMS reanalysis was also compared with observations of the U10 m and Hs for the Fortaleza and Rio Grande buoys. These buoys were selected because they present a sample size large enough to determine the PDFs and define a distribution with confidence for both variables. Figure 6 and Figure 7 show the PDF to compare the variability of the wind speed and Hs data measured by the buoys and estimated by the CMEMS reanalysis. It is noteworthy that in all cases and data sources the distribution of U10 m is broader than the distribution of Hs in Fortaleza and Rio Grande (Figure 6 and Figure 7).
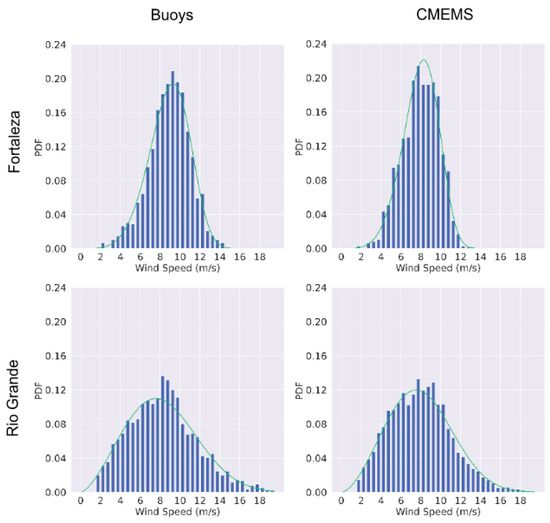
Figure 6.
Frequency distribution of wind speed variation for data from buoys and CMEMS. The fitting curves for the Weibull distribution are defined in Table 2.
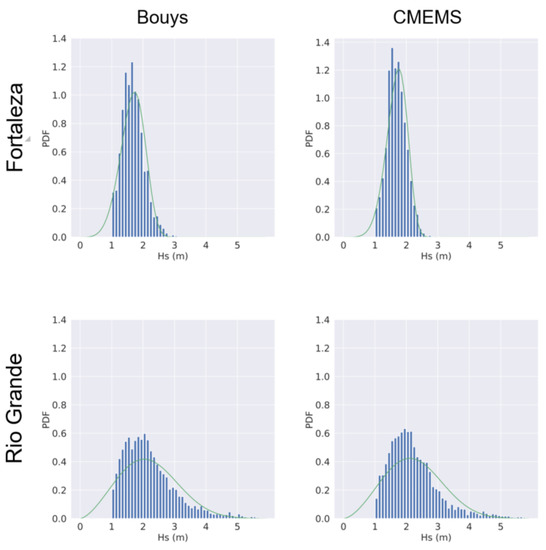
Figure 7.
Frequency distribution of Hs variation for data from buoys and CMEMS. The fitting curves for the Weibull distribution are defined in Table 3.
Another characteristic observed in Figure 6 is that the maximums of the wind distribution in the data from the Fortaleza buoy are shifted to lower values in the CMEMS reanalysis. The Weibull distribution of the wind speed (calculated by the using the formula A/√2, where A is the scale parameter of the Weibull distribution) is 6.85 m/s for the Fortaleza buoy and 6.10 m/s for CMEMS reanalysis, which indicates that reanalysis does not estimate events with high wind speeds. No change in location of mode for Hs was observed, assuming that the comparisons between the data are matched for all parameters (Figure 7).
Table 2 and Table 3 present the parameter values of the Weibull distribution (Weibull Shape-W. s and Weibull Scale-W. sc), mean (med) and standard deviation (std) of the wind speeds and Hs in the buoy data and CMEMS for every site. The two tables show that U10 m fits well using W. s of 5 for Fortaleza and 2 for Rio Grande. Moreover, for the W. sc parameters they are all similar, this similarity was also observed for the average and standard deviation values. For Hs, the values of the statistical parameters further enhanced the similarity. This shows that this variable is even better estimated and corroborates the previous results.
Table 2.
Values of the Weibull distribution parameters (shape and scale), mean and standard deviation of the reanalysis and Fortaleza buoy.
Table 3.
Values of the Weibull distribution parameters (shape and scale), mean and standard deviation of the reanalysis and Rio Grande buoy.
3.2. Estimate of Energy Density (W/m²)
The results obtained so far indicate that the estimates from the CMEMS reanalysis are consistent with the reference station statistics, particularly for wind speed. The Fortaleza and Rio Grande target areas already home to offshore wind projects in the phase of environmental licensing to start construction: Caucaia Parazinho—Iparana Offshore Wind Farm and Águas Claras Marine Wind Complex, respectively [34]. Thus, the energy density without direct wind observations in the target area was calculated with CMEMS estimates and buoy data. Table 4 shows the energy density in the evaluated locations. It is possible to observe that the E is underestimated by the CMEMs, requiring a bias correction to reduce the errors. The increased values of energy density at the sites are consistent with previous work, which found values between 300–550 W/m² [14,15,16] based on in situ observations and reanalysis. The location with these energy density values, are considered suitable for wind energy production.
Table 4.
Comparison of average energy density (E) W/m² at the study sites.
4. Conclusions
In this study, the potential for the characterization of wave height and wind speed of CMEMS reanalysis data was evaluated for use in offshore wind resource assessments in oceanic areas along the east coast of Brazil. The dataset from the CMEMS reanalysis was selected in this study because it presents acceptable temporal and spatial resolution to perform these analyses, especially close to coastal areas. Although reanalysis is currently performing well in several regions around the world and in different applications, its full potential for energy-related studies remains unexplored in Brazil.
Faced with the great challenge of filling large gaps in space and in time of data, especially in oceanic areas, we approached this problem by collecting data in reanalysis areas close to the reference sites, since reanalysis data are available in grid points. The results showed that for the two variables evaluated, the CMEMS data have acceptable performance.
Specifically, the results indicated a high degree of accuracy of the CMEMS data compared to the buoy observations, with the worst performance for the Itajaí buoy and the best performance for the Recife buoy, however, all locations show correlations greater than 0.70. The Hs in the CMEMS data performed very well in all locations along the east coast of Brazil.
The results indicate that the Weibull distribution fits well with the CMEMS wind speed and Hs histograms, and the parameters for the histograms of the buoy observations were very similar.
Although the CMEMS data performed well in general, there is a bias of underpredicting high speeds, possibly due to mesoscale wind gusts, which are not captured by typical reanalysis datasets. It is necessary to apply bias corrections to bring the estimates closer to the observations. The results of this study contributes to issues related to offshore engineering, logistics and monitoring.
Author Contributions
Data curation, I.G.F.d.F., P.M., T.S.V.N. and K.M.R.d.S.; Formal analysis, I.G.F.d.F.; Methodology, I.G.F.d.F., H.B.G., M.P., P.M. and A.J.P.C.; Supervision, H.B.G. and M.P.; Visualization, I.G.F.d.F., T.S.V.N. and K.M.R.d.S.; Writing—original draft, I.G.F.d.F.; Writing—review & editing, I.G.F.d.F., P.M., A.J.P.C. and T.S.V.N. All authors have read and agreed to the published version of the manuscript.
Funding
This research received no external funding.
Institutional Review Board Statement
Not applicable.
Informed Consent Statement
Not applicable.
Data Availability Statement
The datasets used in this study were obtained from the Copernicus Marine Environment Monitoring Service (CMEMS) reanalysis and National Buoys Program (PNBOIA). The links where to download the data were provided through https://marine.copernicus.eu/ (accessed on 2 December 2021) and https://www.marinha.mil.br/ (accessed on 2 December 2021) to CMEMS reanalysis and Buoys, respectively.
Conflicts of Interest
The authors declare that there are no conflict of interest regarding the publication of this paper.
Abbreviations
| Hs | Significant Wave Height |
| Gw | Gigawatts |
| R2 | Coefficient determination |
| RMSE | Root Mean Square Error |
| MSE | Mean Square Error |
| Probability Density Function | |
| W. s | Weibull distribution Shape |
| W. sc | Weibull Scale |
| Med | Mean |
| SAR | Synthetic Aperture Radar |
| UTC | Coordinated Universal Time |
References
- Adami, V.S.; Júnior, J.A.V.A.; Sellitto, M.A. Regional industrial policy in the wind energy sector: The case of the State of Rio Grande do Sul, Brazil. Energy Policy 2017, 111, 18–27. [Google Scholar] [CrossRef]
- Operador Nacional do Sistema Elétrico do Brasil (ONS). Histórico de Operação. Available online: http://www.ons.org.br/Paginas/resultados-da-operacao/historico-da-operacao/ (accessed on 20 June 2020).
- Pryor, S.C.; Barthelmie, R.J. Comparison of potential power production at on and offshore sites. Wind. Energy Int. J. Prog. Appl. Wind. Power Convers. Technol. 2001, 4, 173–181. [Google Scholar] [CrossRef]
- Instituto Brasileiro de Geografia e Estatística (IBGE). População do Brasil. Available online: https://censo2010.ibge.gov.br/noticias-censo.html (accessed on 30 September 2020).
- Pérez, C.C.; Greaves, D.; Iglesias, G. A review of combined wave and offshore wind energy. Renew. Sustain. Energy Rev. 2015, 42, 141–153. [Google Scholar] [CrossRef]
- Tuchtenhagen, P.N. Variabilidade do Vento e Potencial Para Energia Eólica Offshore no Litoral Sul do Brasil. Ph.D. Thesis, Universidade Federal do Rio Grande do Norte, Natal, Brazil, 2019. [Google Scholar]
- Carvalho, D.; Rocha, A.; Gómez-Gesteira, M.; Santos, C.S. Offshore wind energy resource simulation forced by different reanalyses: Comparison with observed data in the Iberian Peninsula. Appl. Energy 2014, 134, 57–64. [Google Scholar] [CrossRef]
- Marinha do Brasil (MB). Dados PNBOIA. Available online: https://www.marinha.mil.br/chm/dados-do-goos-brasil/pnboia-mapa (accessed on 1 June 2020).
- Jiang, D.; Zhuang, D.; Huang, Y.; Wang, J.; Fu, J. Evaluating the spatio-temporal variation of China’s offshore wind resources based on remotely sensed wind field data. Renew. Sustain. Energy Rev. 2013, 24, 142–148. [Google Scholar] [CrossRef]
- Soukissian, T.H.; Papadopoulos, A. Effects of different wind data sources in offshore wind power assessment. Renew. Energy 2015, 77, 101–114. [Google Scholar] [CrossRef]
- Gadad, S.; Deka, P.C. Offshore wind power resource assessment using Oceansat-2 scatterometer data at a regional scale. Appl. Energy 2016, 176, 157–170. [Google Scholar] [CrossRef]
- Von Schuckmann, K.; Le Traon, P.Y.; Alvarez-Fanjul, E.; Axell, L.; Balmaseda, M.; Breivik, L.A.; Dubois, C. The copernicus marine environment monitoring service ocean state report. J. Oper. Oceanogr. 2016, 9, 235–320. [Google Scholar] [CrossRef]
- Yang, J.; Zhang, J.; Jia, Y.; Fan, C.; Cui, W. Validation of Sentinel-3A/3B and Jason-3 Altimeter Wind Speeds and Significant Wave Heights Using Buoy and ASCAT Data. Remote Sens. 2020, 12, 2079. [Google Scholar] [CrossRef]
- Pimenta, F.; Kempton, W.; Garvine, R. Combining meteorological stations and satellite data to evaluate the offshore wind power resource of Southeastern Brazil. Renew. Energy 2008, 33, 2375–2387. [Google Scholar] [CrossRef]
- Ortiz, G.P.; Kampel, M. Potencial de Energia Eólica Offshore na Margem do Brasil; V Simpósio Brasileiro de Oceanografia: Santos, Brasil, 2011. [Google Scholar]
- Silva, G.K.; Santos, A.C.S.; Da Silva, M.V.M.; Brabo Alves, J.M.; Barros, A.C.; Oliveira, C.; Sombra, S.S. Estudo dos Padrões de Ventos Offshore no Litoral do Ceará Utilizando Dados Estimados pelo Produto de Satélites BSW. Rev. Bras. Meteorol. 2017, 32, 679–690. [Google Scholar] [CrossRef][Green Version]
- Tavares, L.F.; Shadman, M.; Freitas, L.P.; Silva, C.; Landau, L.; Estefen, S.F. Assessment of the offshore wind technical potential for the Brazilian Southeast and South regions. Energy 2020, 196, 117097. [Google Scholar] [CrossRef]
- Aznar, R.; Sotillo, M.G.; Cailleau, S.; Lorente, P.; Levier, B.; Amo-Baladrón, A.; Álvarez-Fanjul, E. Strengths and weaknesses of the CMEMS forecasted and reanalyzed solutions for the Iberia–Biscay–Ireland (IBI) waters. J. Mar. Syst. 2016, 159, 1–14. [Google Scholar] [CrossRef]
- Karagali, I.; Hahmann, A.N.; Badger, M.; Hasager, C.B.; Mann, J. New European wind atlas offshore. J. Phys. Conf. Ser. 2018, 1037, 5–10. [Google Scholar] [CrossRef]
- Mason, E.; Ruiz, S.; Bourdalle-Badie, G.; Reffray, M.; Pascual, A. New insight into 3-D mesoscale eddy properties from CMEMS operational models in the western Mediterranean. Ocean. Sci. 2019, 4, 1111–1131. [Google Scholar] [CrossRef]
- Xie, J.; Raj, R.P.; Bertino, L.; Samuelsen, A.; Wakamatsu, T. Evaluation of Arctic Ocean surface salinities from SMOS and two CMEMS reanalyses against in situ data sets. Ocean. Sci. 2019, 10, 1–33. [Google Scholar]
- Bentamy, A. Product User Manual For Wind product WIND_GLO_WIND_L4_REP_OBSERVATIONS_012_006. EU Copernic. Mar. Environ. Monit. Serv. 2018, 1, 26. [Google Scholar]
- Le Traon, P.Y.; Reppucci, A.; Alvarez, E.; Aouf, L.; Behrens, A.; Belmonte, M.; Benkiran, M. From observation to information and users: The Copernicus Marine Service perspective. Front. Mar. Sci. 2019, 6, 234. [Google Scholar] [CrossRef]
- Chune, S.L.; Aouf, L.; Dalphinet, A.; Levier, B.; Drillet, Y. Waverys: A CMEMS global wave reanalysis during the altimetry period. Ocean Dyn. 2021, 71, 357–378. [Google Scholar] [CrossRef]
- Chune, S.L.; Aouf, L.; Bruno, L.; Dalphinet, A. Global High Resolution Production Centre For Wave product GLOBAL_REANALYSIS_WAV_001_032. EU Copernic. Mar. Environ. Monit. Serv. 2020, 1, 48. [Google Scholar]
- Ribal, A.; Young, I.R. 33 years of globally calibrated wave height and wind speed data based on altimeter observations. Sci. Data 2019, 6, 77. [Google Scholar] [CrossRef] [PubMed]
- Li, X.; Mitsopoulos, P.; Yin, Y.; Peña, M. SARAL-AltiKa Wind and Significant Wave Height for Offshore Wind Energy Applications in the New England Region. Remote Sens. 2021, 13, 57. [Google Scholar] [CrossRef]
- Wilks, D.S. Statistical Methods in the Atmospheric Sciences; Academic Press: Amsterdam, The Netherland, 2005; p. 676. [Google Scholar]
- Oh, K.Y.; Kim, J.Y.; Lee, J.K.; Ryu, M.S.; Lee, J.S. An assessment of wind energy potential at the demonstration offshore wind farm in Korea. Energy 2012, 46, 555–563. [Google Scholar] [CrossRef]
- Jamil, M.; Parsa, S.; Majidi, M. Wind power statistics and an evaluation of wind energy density. Renew. Energy 1995, 6, 623–628. [Google Scholar] [CrossRef]
- Bentamy, A. Product User Manual for Wind product WIND_GLO_WIND_L4_NRT_OBSERVATIONS_012_004. Change 2016, 1, 18. [Google Scholar]
- Aouf, L. CMEMS quality information document for global ocean waves analysis and forecasting product. Man. CMEMS 2018, 1, 1–27. [Google Scholar]
- Kang, J.; Mao, R.; Chang, Y.; Fu, H. Comparative analysis of significant wave height between a new Southern Ocean buoy and satellite altimeter. Atmos. Ocean. Sci. Lett. 2021, 14, 100044. [Google Scholar] [CrossRef]
- EPE. Energia Eólica Offshore Brasil: Perspectivas e Caminhos Para a Energia Eólica Marítima, 1st ed.; Empresa de Pesquisa Energética: Rio de Janeiro, Brazil, 2021. [Google Scholar]


Publisher’s Note: MDPI stays neutral with regard to jurisdictional claims in published maps and institutional affiliations. |
© 2022 by the authors. Licensee MDPI, Basel, Switzerland. This article is an open access article distributed under the terms and conditions of the Creative Commons Attribution (CC BY) license (https://creativecommons.org/licenses/by/4.0/).