Proceeding Paper

Optical Methods to Determine the Gas Atmosphere in Various Modified Atmosphere Packages: Applications and Correlation in Meat Spoilage †

by
Jasmin Dold
1,*,
Clarissa Hollmann
1,
Caroline Kehr
1 and
Horst-Christian Langowski
2,3
1
Chair of Brewing and Beverage Technology, Technical University of Munich, Weihenstephaner Steig 20, D-85354 Freising, Germany
2
TUM School of Life Sciences, Technical University of Munich, Weihenstephaner Steig 22, D-85354 Freising, Germany
3
Fraunhofer Institute for Process Engineering and Packaging, Giggenhauser Straße 35, D-85354 Freising, Germany
*
Author to whom correspondence should be addressed.
Presented at the 2nd International Electronic Conference on Foods—“Future Foods and Food Technologies for a Sustainable World”, 15–30 October 2021; Available online: https://foods2021.sciforum.net/.
Biol. Life Sci. Forum 2021, 6(1), 36; https://doi.org/10.3390/Foods2021-11098
Published: 14 October 2021

Abstract

:
The use of non-invasive optical measurement systems for the quality evaluation of packed food is becoming more important for the reduction of food waste and quality improvement. In this study, the gas atmosphere of packed poultry was monitored using optical measurement systems based on fluorescence quenching for oxygen determination and mid-infrared (MIR) laser spectroscopy for the detection of carbon dioxide. The gas atmosphere was evaluated continuously over fifteen days of storage, the total viable count was obtained, and optical and olfactory sensory evaluations were simultaneously performed by a trained sensory panel. The results revealed that irregular storage conditions could be detected and that microbiological growth under regular conditions does not lead to a significant change in the headspace atmosphere.

1. Introduction

Non-destructive measurement systems for the quality evaluation of packed food are becoming increasingly important because both quality standards and the amount of packed food are increasing. However, sustainability and reduction in food waste is gaining importance as well. In Europe, approximately 88 million tons of food is wasted annually [1], a high proportion of which is meat or meat products, often due to an expired shelf life or use-by date.
Optical measurement systems, which include fluorescence quenching and infrared technology, have been well studied for the determination of food quality [2,3]. However, many of them are extremely product-specific or involve very elaborate conversion factors. As observed in previous studies, in high-O2 modified atmosphere packaging (MAP) the amount of O2 decreases and that of CO2 increases characteristically upon spoilage of poultry or beef due to the respiration of spoilage microorganisms [4,5,6]. Often, this spoilage is accompanied by the formation of volatile organic compounds (VOCs), which affect sensory perception [7].
This study combines the previously-described topics. High O2 packed poultry was monitored at different temperatures using novel non-destructive measurement devices with simultaneous control of total viable count (TVC) and sensory acceptability over a storage period of fifteen days. Afterward, the correlations between the parameters and their suitability for shelf life prediction were evaluated.

2. Materials and Methods

2.1. Optical Measurement Systems

2.1.1. Fluorescence Quenching to Detect O2

For the non-destructive determination of O2, a fluorescence-based measurement system and associated sensor spots (PreSens Precision Sensing GmbH, Regensburg, Germany) were used. This measurement device works via fiber optics (λex = 505 nm and λem = 650 nm). To integrate the sensor spots into the lid film, a sensor spot was placed on the inside of the lid film that faced upward (PP/PA/PP/PA, 100 µm, allvac Folien GmbH, Waltenhofen, Germany) which was then covered with a PP film (56 µm, Huhtamaki Flexible Packaging Germany GmbH & Co. KG, Ronsberg, Germany) and sealed at 155 °C with a ring-shaped sealing tool. Before sealing, two-point calibration of the sensor spots in the relevant measuring range (0% and 60% O2) was carried out.

2.1.2. MIR Spectroscopy to Detect CO2

The non-destructive measurement of CO2 was carried out with a measurement system based on MIR spectroscopy (KNESTEL Technologie und Elektronik GmbH; Hopferbach, Germany). Three different wavelengths were used, λ1 = 4.26 µm, λ2 = 4.45 µm, and λ3 = 4.27 µm. The laser beam was pointed at 45° through the corner of the packaging. Two-point calibration with 0% and 40% CO2 was carried out on the empty reference trays.

2.2. Sample Preparation

A total of 400 g fresh chicken strips (Donautal Geflügelspezialitäten, Bogen, Germany) were weighed into transparent polypropylene trays (ES-Plastic GmbH, Hutthurm, Germany) and sealed with a semiautomatic tray sealer (T250, MULTIVAC Sepp Haggenmüller SE & Co. KG, Wolfertschwenden, Germany) under a modified gas atmosphere (70% O2/30% CO2 or 80% O2/20% CO2). For each atmosphere, six samples with integrated sensor material were used as the lid film. In addition, 44 samples were prepared for each gas atmosphere without integrated sensor materials for sensory and microbiological evaluation. Samples were stored at 4 °C and 10 °C. Furthermore, three empty trays were prepared for each temperature and gas combination with sealed-in sensor spots to monitor the concentrations of O2 and CO2 without product influence during storage.

2.3. Non-Destructive Gas Determination

The gas atmosphere of the prepared trays was monitored for 15 days (except for day 3 for filled trays and days 3, 5, 6, 12, and 13 for the empty trays) via the above-mentioned non-destructive measurement devices.

2.4. Microbiological Analysis

TVC was determined in duplicate for each temperature and gas composition on days 0, 1, 4, 6, 8, 11, 13, and 15. A total of 70 g of chicken strips was weighed into a sample bag (VWR International, Darmstadt, Germany) and homogenized for 120 s with 50 mL Ringer’s solution (Merck KGaA, Darmstadt, Germany) in a stomacher (LabBlender400, Gemini BV, Apeldoorn, Netherlands). A dilution series was prepared with Ringer’s solution using 1 mL of the filtrate and 100 µL of the chosen dilutions were later spread onto the brain heart infusion agar (Carl Roth GmbH & Co., KG, Karlsruhe, Germany). After incubating the plates aerobically at 30 °C for three days, the colony-forming units per gram sample (CFU/g) were calculated.

2.5. Sensory Evaluation

For sensory evaluation, the samples were investigated by a previously trained panel (n = 15; 5 f, 10 m, average age 29 years) on days 0, 1, 4, 6, and 8 for the samples stored at 4 °C and 10 °C and again on days 11 and 14 for the samples stored at 4 °C. The intensity of previously-specified attributes was evaluated visually and olfactorily on an analog scale ranging from 0 to 100 (0 = not perceptible/fresh; 100 = strong perceptible/rotten). For the evaluation, a sample was defined as no longer acceptable when the average value of the orthonasal or visual impression was ≥50.

2.6. Statistical Analysis

Statistical analysis was performed using MS Excel. To calculate significance, a two-sample t-test was performed.

3. Results

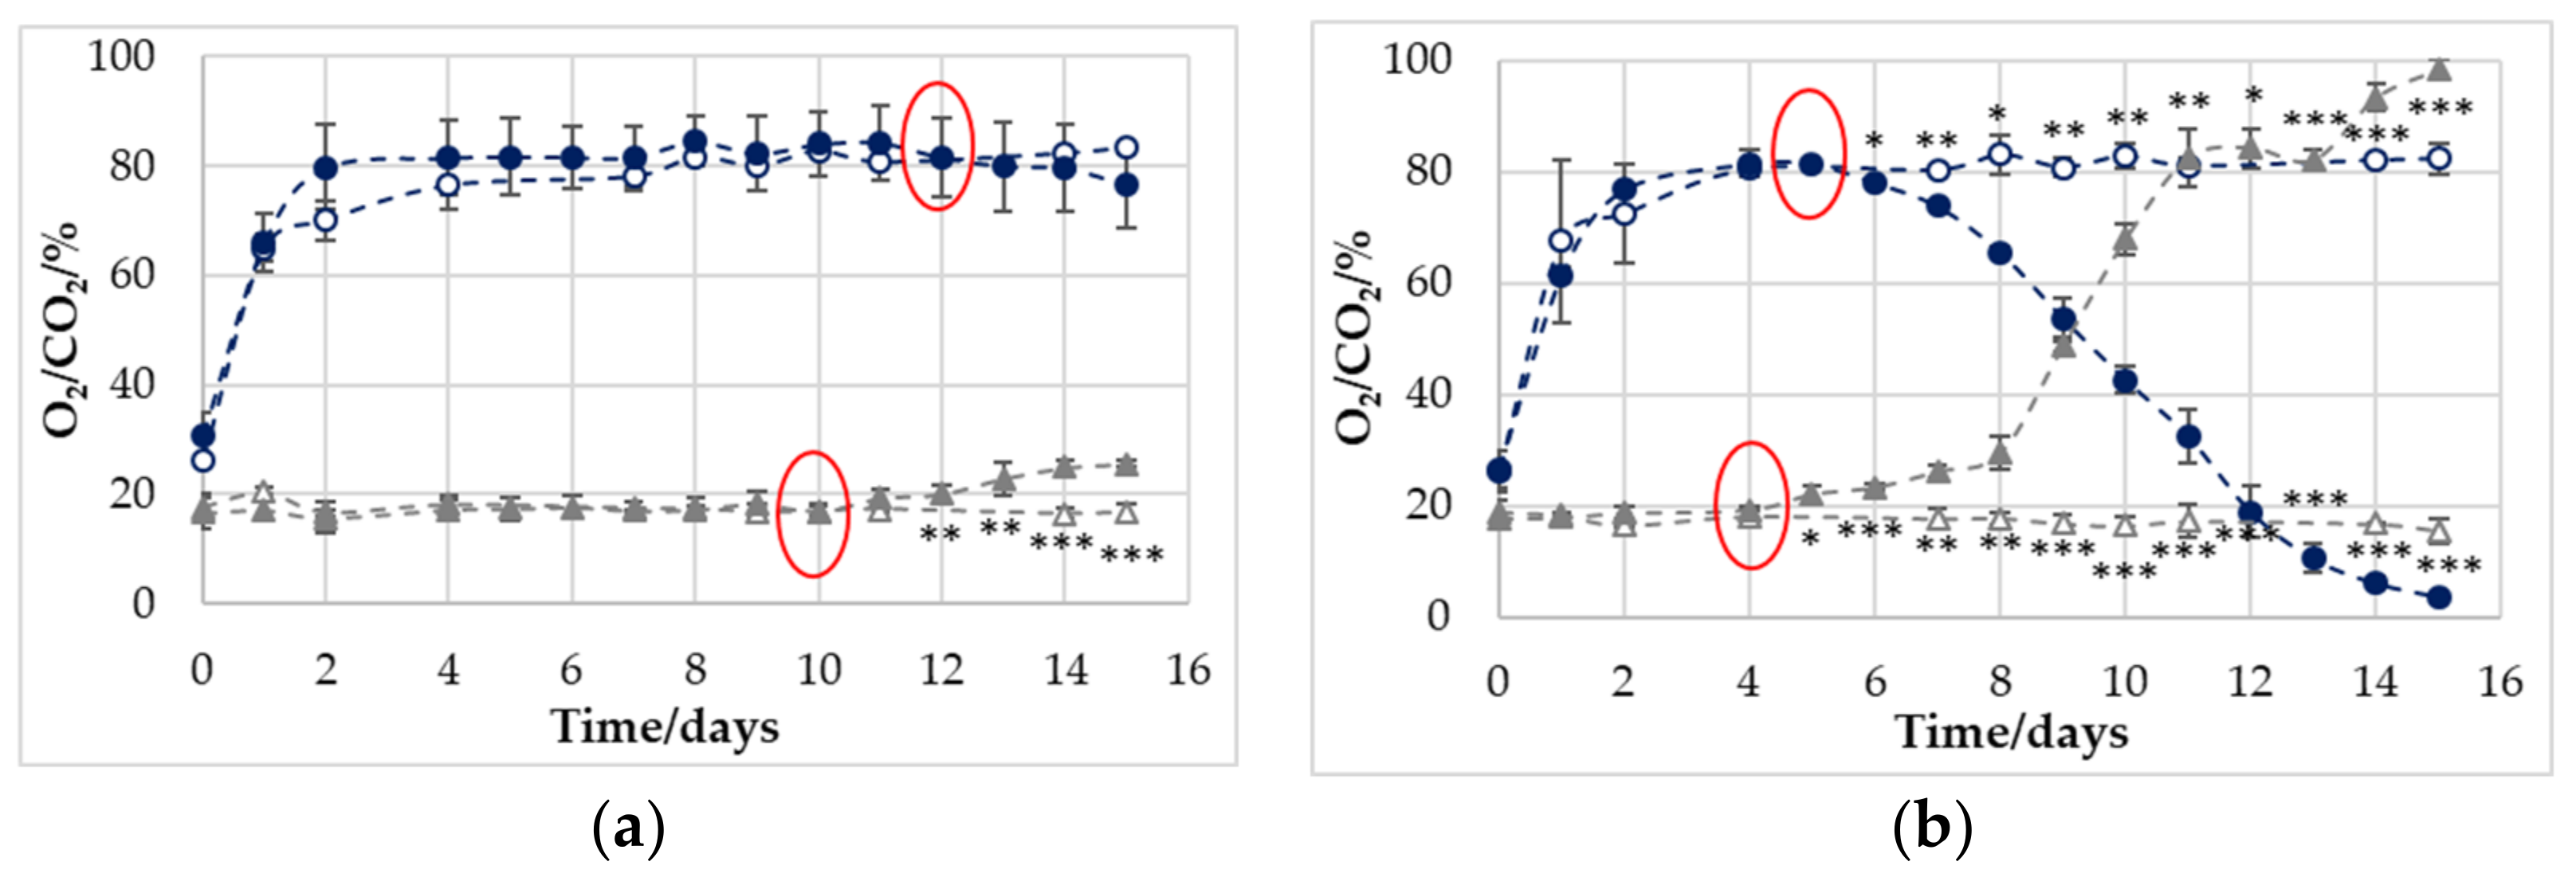
3.1. Development of Gas Concentration in Empty and Filled Trays

For the empty trays, almost no changes in the gas content were detected; the respective amounts of O2 and CO2 increased and decreased slightly. In addition, the optical measurement method for O2 deviated from the real values at the first two to three measurement points. This was because the sensor spots were sealed into the lid film under atmospheric conditions and the higher O2 concentration in the MAP had to permeate into the spot area first.
By comparing the empty and filled trays, the influence of the product was determined. For the 80/20 4 °C samples (Figure 1a), a significant deviation was noted between the filled and empty trays for CO2 measurement from days 12 to 15. However, O2 did not show any statistical significance. The cross-over was on day 12, then the O2 content of the filled package decreased steadily until day 15. In addition, the cross-over was noticeable for the 70/30 4° C samples (Supplementary Figure S1a), but only from day 13. For CO2 content, however, no change in the headspace atmosphere was observed for filled and empty trays. Samples that were stored at 10° C in 80/20 (Figure 1b) MAP showed the earliest deviation from the empty trays, with a significant change at day 5 for CO2 and day 6 for O2. Afterward, a fast increase in the amount of CO2 (approximately 100%) on day 15 and a decrease in O2 was visible. The 70/30 MAP at 10 °C (Supplementary Figure S1b) showed a similar, though slower trend.

3.2. Microbiological Analysis

All samples had a similar starting value of approximately 104 CFU/g (Table 1). The samples that were stored at 10 °C showed faster growth and reached the defined critical value of 107 CFU/g [8] after three (80/20) or four days (70/30). The samples that were stored at 4 °C reached the value after six (80/20) or seven (70/30) days. At the end of storage, all the samples were well above the critical limit. The highest value of >1010 CFU/g was reached by the sample packed with 80% O2 and 20% CO2, which was stored at 10 °C. However, the samples stored at 4 °C reached at the final values of >109 CFU/g.

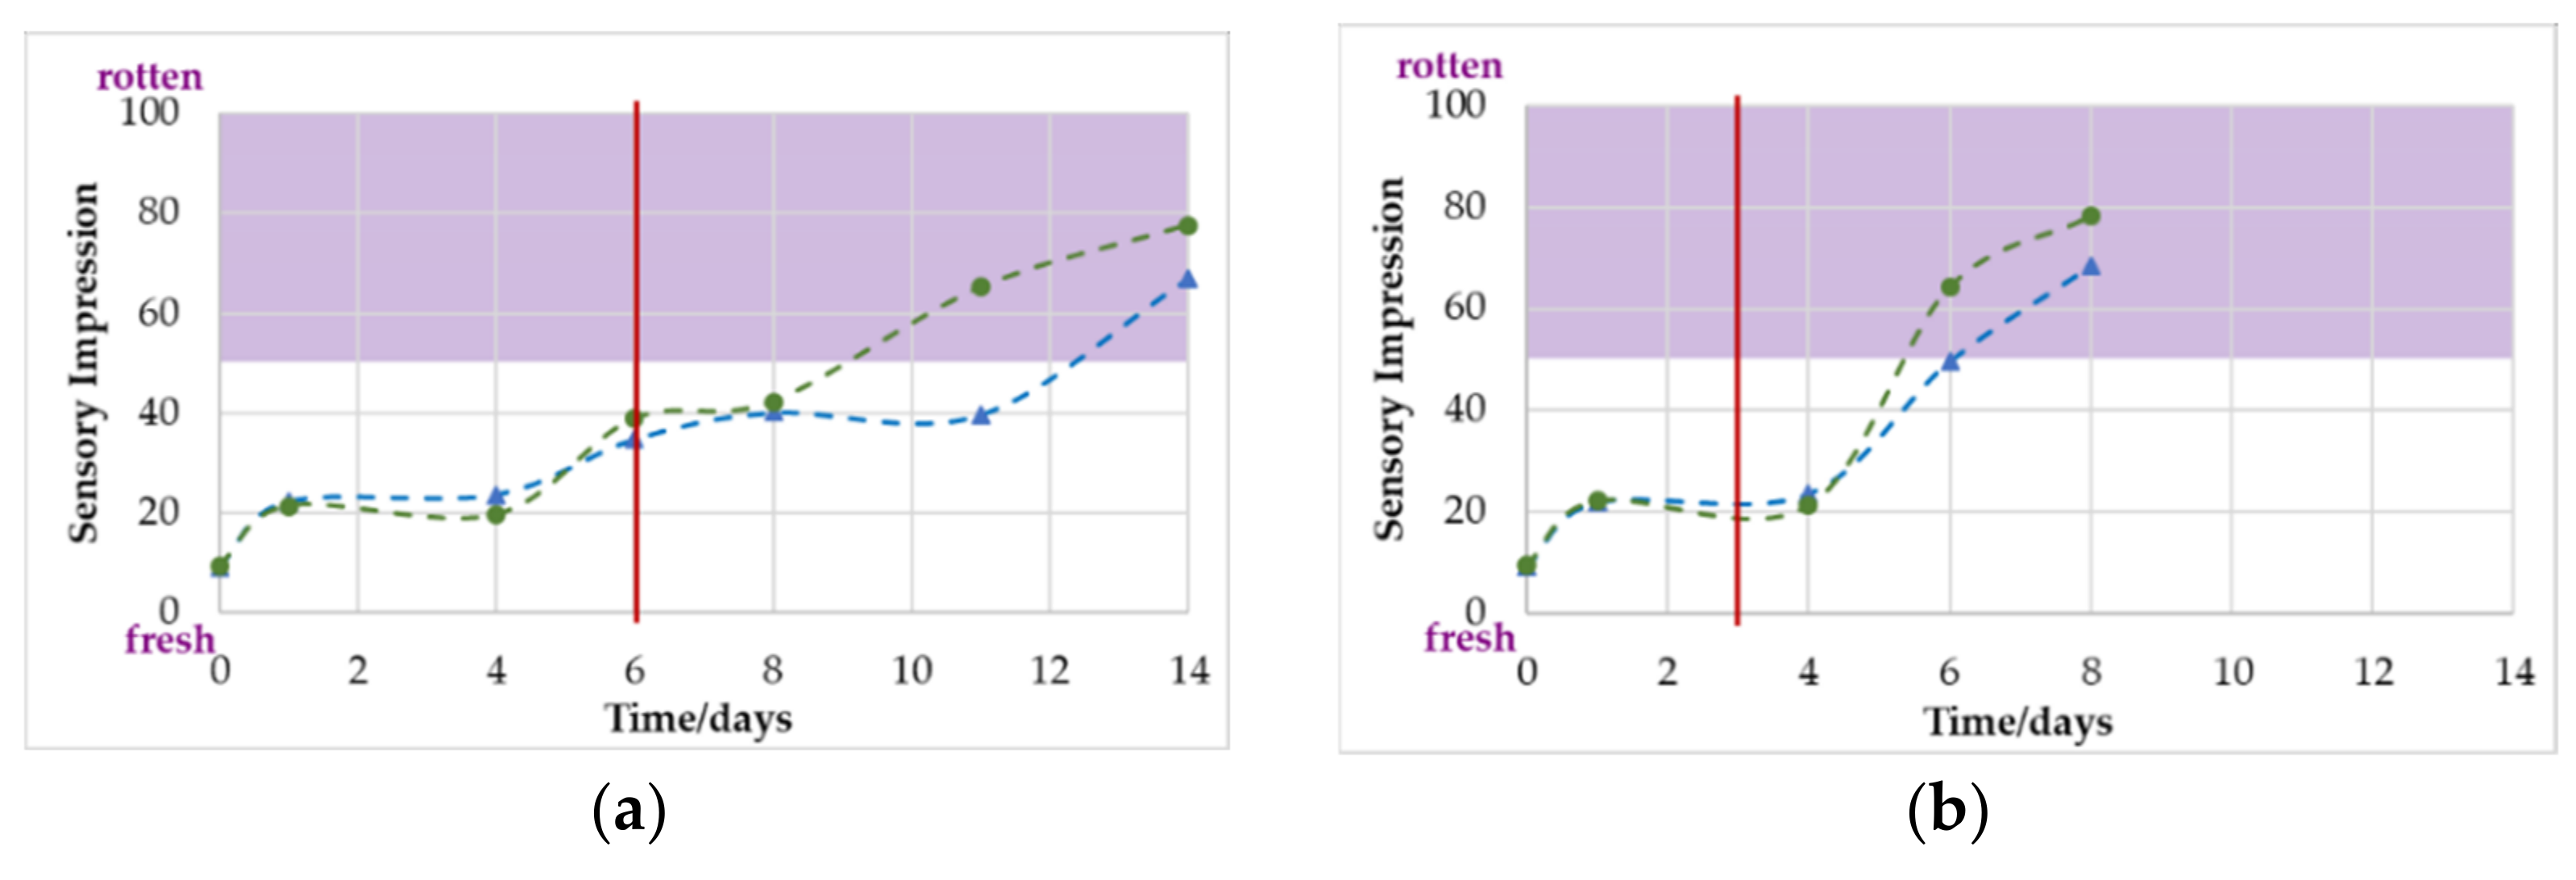
3.3. Sensory Evaluation

The results of the sensory evaluation of the samples are shown in Figure 2 (80/20) and Supplementary Figure S2 (70/30). The microbiologically critical values (Section 3.2) are marked by a red line. The sensory impression, which was visual and orthonasal, remained acceptable for all the samples when the microbiological limit was exceeded. In addition, the poultry stored at 4 °C was first classified with an unacceptable orthonasal sensory impression of >50% on testing day 11 (80/20) or 14 (70/30) for the olfactory evaluation, whereas the samples at 10 °C had reached that point on day 6 (80/20) or day 8 (70/30).

4. Discussion

4.1. Correlation of Results

Table 2 provides an overview of the tested parameters and indicates several possible correlations. Yellow describes a possible association between the cross-over and microbiological spoilage; orange indicates a correlation between the cross-over and olfactory spoilage; and green indicates a correlation between the gas change in the headspace and olfactory spoilage.

4.1.1. Correlations between O2 and CO2 Concentrations and Microbial Spoilage

As described previously, several studies have been carried out that indicate a correlation between O2 respiration with microbiological spoilage, even for chicken meat [4,6]. However, this study could not completely confirm these findings. For all samples, no significant change in the gas concentration was noted when the limit of 107 CFU/g was reached. Microbial spoilage might be visible considering the previously described cross-over point for CO2 detection; however, this is only the case for the samples that were stored at 10 °C. This point was reached either on the day of (70/30) or one day after (80/20) the critical value of 107 CFU/g was reached. A significant change occurred in the gas atmosphere for the samples stored at 10 °C, and in addition for CO2 detection for the 80/20 samples stored at 4 °C; however, the TVC was already ≥109 CFU/g. For the samples stored at 10 °C, a very strong change occurred for both gases in the gas atmosphere after five or six days, and by the end the gas atmosphere in the headspace had completely changed. Nevertheless, the total microbiological growth was not very different compared with the 4 °C samples after fifteen days. This is a strong indication that it is the type of microorganisms and not necessarily their quantity which is crucial for O2 consumption. This is further confirmed by a previous study where beef was inoculated with different meat-spoiling bacteria; samples contaminated with Brochothrix thermospacta showed significant O2 consumption, while samples contaminated with Carnobacterium divergens and Carnobacterium maltaromaticum showed no consumption at all, even at microbial populations of ≥108/cm2 [5]. This shows that it is mainly the microbiota that determine O2 consumption and CO2 production, which makes correlation for the purpose of, for example, shelf-life prediction quite difficult.

4.1.2. Correlation of O2/CO2 with Sensory Evaluation

For all samples, it was observed that the achievement of the defined shelf life did not correlate with the visual and olfactory impressions of the panel. However, there appeared to be a correlation between gas development and sensory acceptance in certain cases. For the poultry that was stored at 4 °C at initial gas concentrations of 80% O2 and 20% CO2, a significant change in CO2 was observed on day 12, and the cross-over happened two days earlier. This agreed with the sensory evaluation on day 11 when the panel classified the sample as not acceptable for the first time. The 4 °C 70/30 sample had its cross-over with O2 on day 13 and the first classification as olfactory spoiled on day 14. However, the classification on day 11 was slightly below the 50 scores limit, which is why a prediction via gas determination is rather unlikely. For the samples stored at 10 °C, a very good fit between the gas concentration and sensory acceptance was observed. All samples showed their first significant CO2 change before olfactory spoilage. In addition, O2 detection was in accordance with the results that were obtained by the sensory panel. The cross-over provides a strong indication of the sensory spoilage for the 10 °C samples.

4.2. Influence of the Microbiome

These results allow several conclusions to be drawn about the type of spoilage microorganisms, with certain limitations. Franke et al. (2017) showed that chicken breasts packed at high O2 and stored at 4 °C were mainly populated with B. thermospacta, and develop Carnobacteria sp. and Pseudomonas sp. mainly under MAP with lower CO2 concentrations (≤15%) [9]. Because Pseudomonas sp. are responsible for the formation of VOCs [7], this agrees well with the earlier sensory spoilage of the 80/20 sample compared with that of the 70/30 sample. However, O2 was hardly respired at this point, which could be due to the small population of B. thermospacta, to the lack of heme compared with beef, or because of the low temperature [4,5]. The influence of storage temperature was visible, especially with respect to sensory evaluation and gas development, as previously observed by Höll et al. (2016). They used a mixed microbiome at the beginning of the storage process; later, at 4 °C, a mixture of B. thermospacta, Pseudomonas sp., and Carnobacteria sp. grew, and at 10 °C the microbiota mainly consisted of Pseudomonas sp. and Serratia sp. by the end of storage period. After 4–8 days B. thermospacta was present, which probably favored O2 consumption, allowing VOC-forming Pseudomonas sp. to grow [6]. The effect observed there was probably the same as observed in this study.

5. Conclusions

This study demonstrates that non-destructive measurement systems can monitor gas atmospheres. These systems, however, cannot be used to predict the shelf-life of high-O2 packed poultry stored under regular conditions. CO2 detection might be especially useful for detecting premature microbial spoilage due, for example, to contamination or interruption in the cold chain, as significant deviation can be measurable prior to sensory spoilage. In further research, a correlation with the concentration of volatile emissions (e.g., 2,3-butanedione) will be further elaborated and the influence of heme concentration will be clarified through experiments with beef. Other possible applications for these technologies might include the detection of leakages in packages and process control for MAP production lines.

Supplementary Materials

The following are available online at https://www.mdpi.com/article/10.3390/Foods2021-11098/s1, Figure S1: Development of O2 and CO2 under different storage conditions over fifteen days in trays with and without poultry, Figure S2: Visual and orthonasal impressions of poultry under different stor-age conditions over 8 or 14 days.

Author Contributions

Conceptualization, J.D., C.H., C.K. and H.-C.L.; methodology, J.D., C.H., C.K. and H.-C.L.; validation, J.D., C.H. and C.K.; formal analysis, J.D. and H.-C.L.; investigation, J.D., C.H. and C.K.; data curation, J.D., C.H. and C.K.; writing—original draft preparation, J.D.; writing—review and editing, H.-C.L.; visualization, J.D. and C.K.; supervision, H.-C.L.; project administration, J.D. and H.-C.L. All authors have read and agreed to the published version of the manuscript.

Funding

This work was funded by the German Federal Ministry for Economic Affairs and ClimateAction via the German Federation of Industrial Research Associations (AiF) and the Industry Association for Food Technology and Packaging (IVLV) (IGF 19993N).

Institutional Review Board Statement

The study was conducted according to the guidelines of the Declaration of Helsinki and the TUM ethic committee.

Informed Consent Statement

Informed consent was obtained from all subjects involved in the study.

Data Availability Statement

Not applicable.

Acknowledgments

We would like to thank the Fraunhofer IVV in Freising and the Chair of Technical Microbiology; TUM in Freising for their support with equipment and materials.

Conflicts of Interest

The authors declare no conflict of interest.

References

  1. European Parliament. Food Waste: The Problem in the EU in Numbers. Available online: https://www.europarl.europa.eu/news/en/headlines/society/20170505STO73528/food-waste-the-problem-in-the-eu-in-numbers-infographic (accessed on 2 August 2021).
  2. Schmutzler, M.; Beganovic, A.; Böhler, G.; Huck, C.W. Methods for detection of pork adulteration in veal product based on FT-NIR spectroscopy for laboratory, industrial and on-site analysis. Food Control 2015, 57, 258–267. [Google Scholar] [CrossRef]
  3. Banerjee, S.; Kelly, C.; Kerry, J.P.; Papkovsky, D.B. High throughput non-destructive assessment of quality and safety of packaged food products using phosphorescent oxygen sensors. Trends Food Sci. Technol. 2016, 50, 85–102. [Google Scholar] [CrossRef] [Green Version]
  4. Kolbeck, S.; Reetz, L.; Hilgarth, M.; Vogel, R.F. Quantitative Oxygen Consumption and Respiratory Activity of Meat Spoiling Bacteria Upon High Oxygen Modified Atmosphere. Front. Microbiol. 2019, 10, 2398. [Google Scholar] [CrossRef] [PubMed]
  5. Kolbeck, S.; Hilgarth, M.; Vogel, R.F. Proof of concept: Predicting the onset of meat spoilage by an integrated oxygen sensor spot in MAP packages. Lett. Appl. Microbiol. 2021, 73, 39–45. [Google Scholar] [CrossRef] [PubMed]
  6. Höll, L.; Behr, J.; Vogel, R.F. Identification and growth dynamics of meat spoilage microorganisms in modified atmosphere packaged poultry meat by MALDI-TOF MS. Food Microbiol. 2016, 60, 84–91. [Google Scholar] [CrossRef] [PubMed]
  7. Rossaint, S.; Klausmann, S.; Kreyenschmidt, J. Effect of high-oxygen and oxygen-free modified atmosphere packaging on the spoilage process of poultry breast fillets. Poult. Sci. 2015, 94, 96–103. [Google Scholar] [CrossRef] [PubMed]
  8. Baumgart, J.; Becker, B.; Stephan, R. (Eds.) Mikrobiologische Untersuchung von Lebensmitteln: Ein Leitfaden Für das Studium, 6th ed.; B.Behr’s Verlag GmbH & Co., KG: Hamburg, Germany, 2016; ISBN 978-3-95468-333-8. [Google Scholar]
  9. Franke, C.; Höll, L.; Langowski, H.-C.; Petermeier, H.; Vogel, R.F. Sensory evaluation of chicken breast packed in two different modified atmospheres. Food Packag. Shelf Life 2017, 13, 66–75. [Google Scholar] [CrossRef]
Figure 1. Development of O2 (/) and CO2 (△/▲) under different storage conditions over fifteen days in trays with (●/▲) and without poultry (/△): (a) 80% O2/20% CO2 4 °C (b) 80% O2/20% CO2 10 °C. Indices indicate a significant difference between the curves with and without poultry. * p < 0.05, ** p < 0.01, and *** p < 0.001. The red circles mark the point when the curve of the respective gas concentration in the filled trays intersects that for the empty trays (cross-over), which indicated a microbiologically-induced change in the headspace atmosphere.
Blsf 06 00036 g001
Figure 2. Visual (▲) and orthonasal (●) impressions of poultry under different storage conditions over 8 or 14 days: (a) 80% O2/20% CO2 4 °C and (b) 80% O2/20% CO2 10 °C. The red line marks the point when microbiological limit value was achieved. The purple area indicates the previous defined sensory limit of 50 scores.
Blsf 06 00036 g002
Table 1. TVC for the poultry on days 0 and 15 for each storage condition (n = 4) and the day the critical limit of 107 CFUg−1 was reached (end of shelf life).
Day 0Day 15Shelf Life Expired
80/20 4 °C1.36 × 104 CFUg−14.00 × 10⁹ CFUg−1Day 6
70/30 4 °C1.27 × 104 CFUg−14.29 × 10⁹ CFUg−1Day 7
80/20 10 °C1.36 × 104 CFUg−12.19 × 10¹⁰ CFUg−1Day 3
70/30 10 °C1.27 × 104 CFUg−14.47 × 10⁹ CFUg−1Day 4
Table 2. Possible correlations between the tested parameters; p ≤ 0.05 represents the first day where the difference between empty and filled trays was significant with p ≤ 0.05, after the cross-over was reached. “Microbiologically spoiled” indicates a TVC of 107 CFUg−1 and “olfactory spoiled” shows the panel classification of the sensory panel with >50 scores. A description of the color correlations can be found in the previous text.
4 °C10 °C
80/2070/3080/2070/30
Cross-over O2121355
p ≤ 0.05 O2--67
Cross-over CO210-44
p ≤ 0.05 CO212-56
Microbiologically spoiled6734
Olfactory spoiled111468
Publisher’s Note: MDPI stays neutral with regard to jurisdictional claims in published maps and institutional affiliations.

