
Estimating Leaf Area Index of Wheat Using UAV-Hyperspectral Remote Sensing and Machine Learning †

 , , and
Abstract
1. Introduction
2. Materials and Methods
2.1. Field Experimental Design, Data Acquisition and Pre-Processing
2.2. Selection of Vegetation Indices and Model Development
3. Results
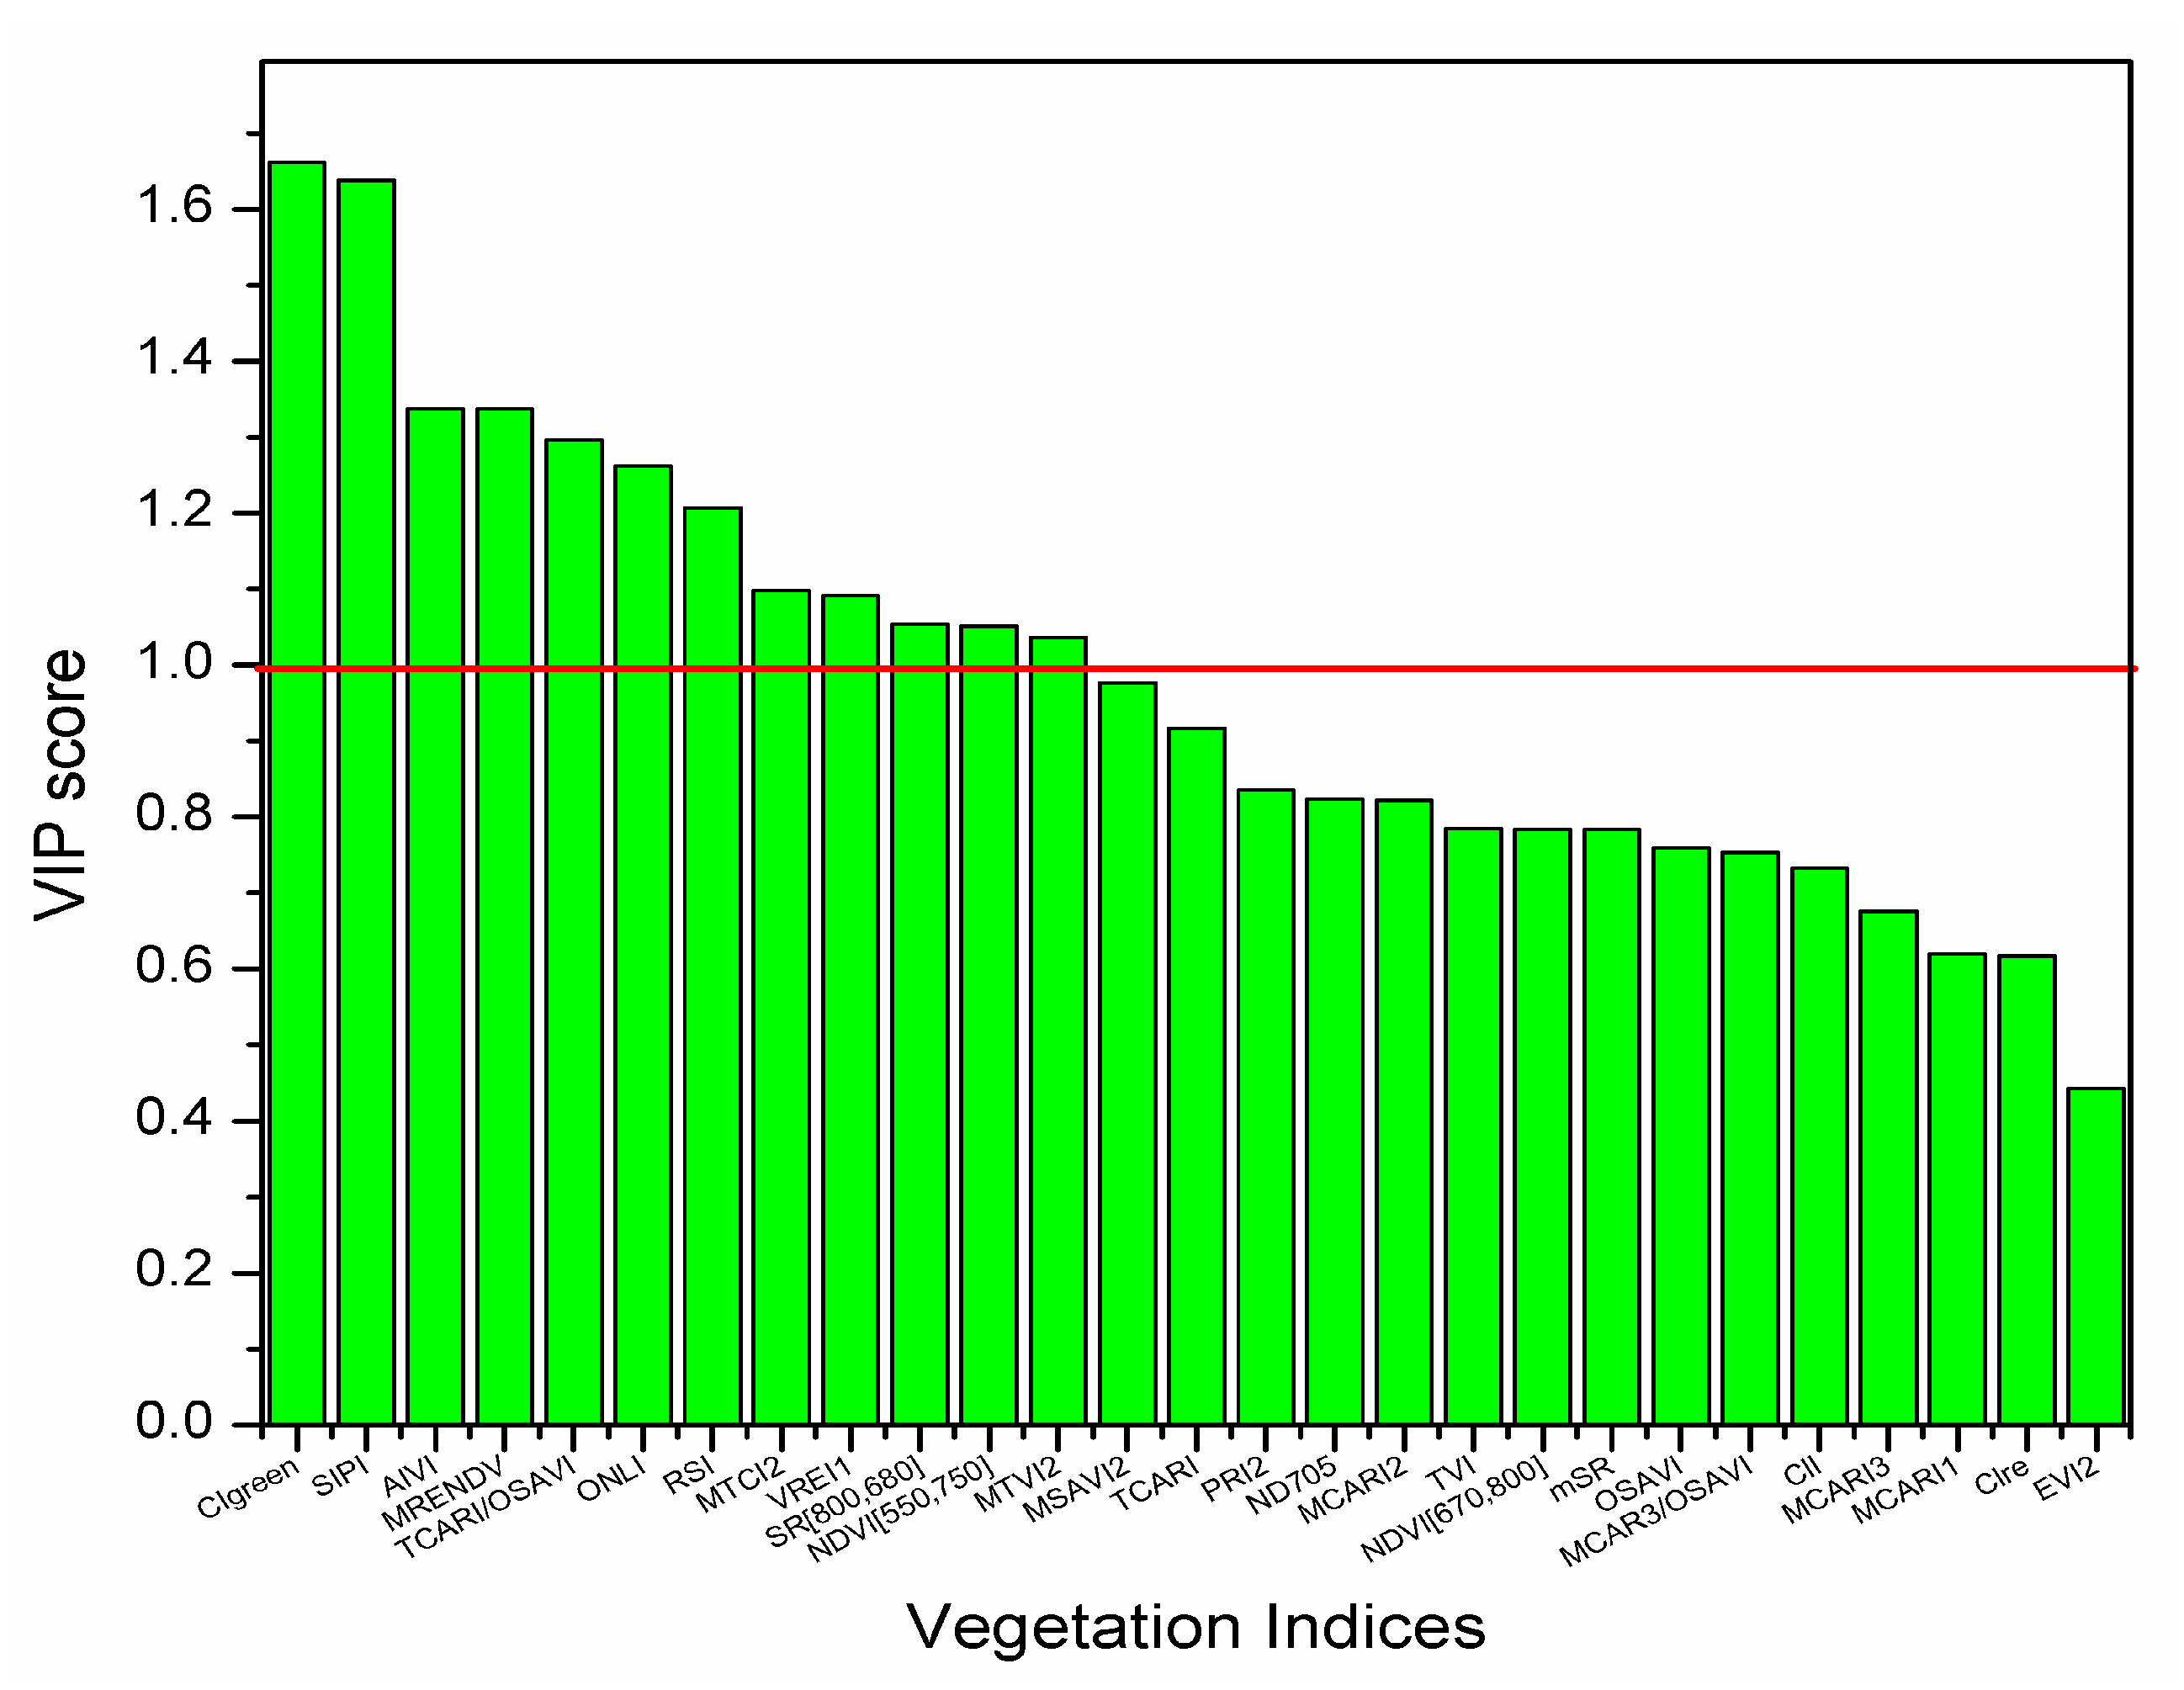
3.1. Optimizing Vegetation Indices Using PLSR-VIP
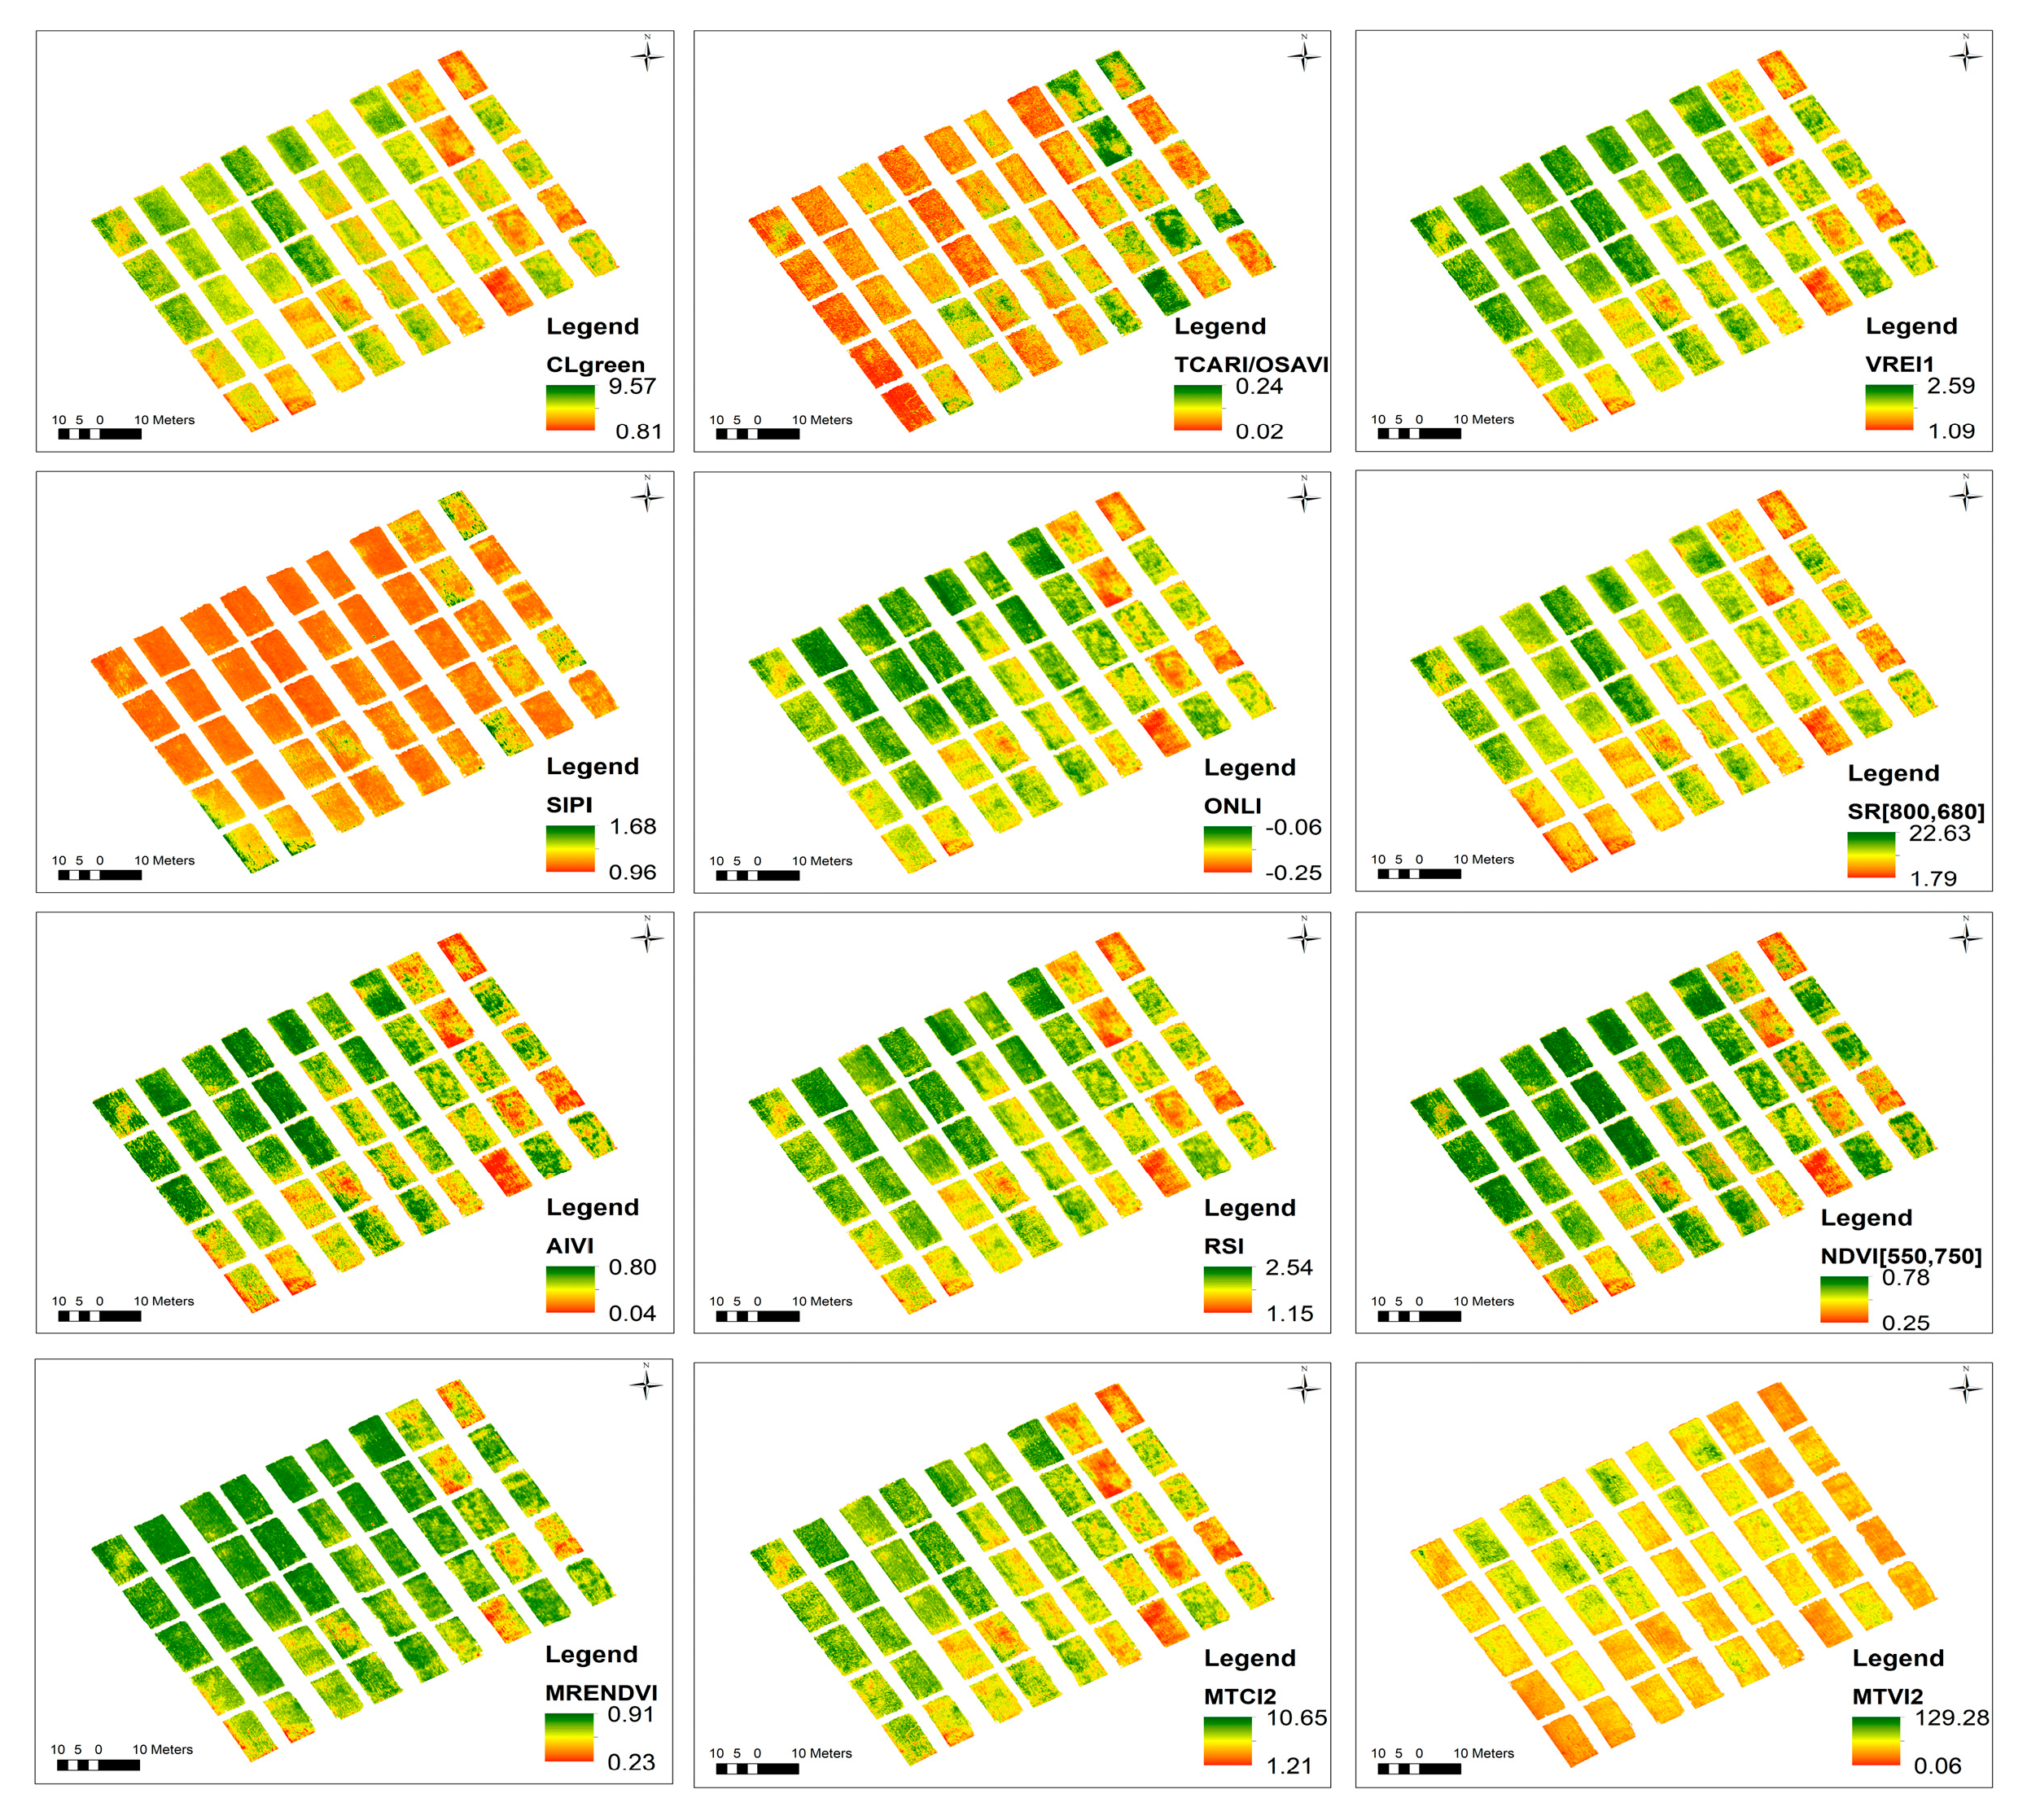
3.2. LAI Mapping and Validation
4. Discussion
5. Conclusions
Author Contributions
Funding
Institutional Review Board Statement
Informed Consent Statement
Data Availability Statement
Conflicts of Interest
References
- Gong, Y.; Yang, K.; Lin, Z.; Fang, S.; Wu, X.; Zhu, R.; Peng, Y. Remote Estimation of Leaf Area Index (LAI) with Unmanned Aerial Vehicle (UAV) Imaging for Different Rice Cultivars throughout the Entire Growing Season. Plant Methods 2021, 17, 88. [Google Scholar] [CrossRef] [PubMed]
- Din, M.; Zheng, W.; Rashid, M.; Wang, S.; Shi, Z. Evaluating Hyperspectral Vegetation Indices for Leaf Area Index Estimation of Oryza Sativa L. at Diverse Phenological Stages. Front. Plant Sci. 2017, 8, 820. [Google Scholar] [CrossRef] [PubMed]
- Rejith, R.G.; Sahoo, R.N.; Verrelst, J.; Ranjan, R.; Gakhar, S.; Anand, A.; Kondraju, T.; Kumar, S.; Kumar, M.; Dhandapani, R. UAV-Based Retrieval Of Wheat Canopy Chlorophyll Content Using A Hybrid Machine Learning Approach. In Proceedings of the 2023 IEEE India Geoscience and Remote Sensing Symposium (InGARSS), Bangalore, India, 10–13 December 2023; pp. 1–4. [Google Scholar]
- Shi, B.; Guo, L.; Yu, L. Accurate LAI Estimation of Soybean Plants in the Field Using Deep Learning and Clustering Algorithms. Front. Plant Sci. 2025, 15, 1501612. [Google Scholar] [CrossRef] [PubMed]
- Sahoo, R.N.; Kondraju, T.; Rejith, R.G.; Verrelst, J.; Ranjan, R.; Gakhar, S.; Bhandari, A.; Chinnusamy, V. Monitoring Cropland LAI Using Gaussian Process Regression and Sentinel—2 Surface Reflectance Data in Google Earth Engine. Int. J. Remote Sens. 2024, 45, 5008–5027. [Google Scholar] [CrossRef]
- Sahoo, R.N.; Gakhar, S.; Rejith, R.G.; Ranjan, R.; Meena, M.C.; Dey, A.; Mukherjee, J.; Dhakar, R.; Arya, S.; Daas, A.; et al. Unmanned Aerial Vehicle (UAV)–Based Imaging Spectroscopy for Predicting Wheat Leaf Nitrogen. Photogramm. Eng. Remote Sens. 2023, 89, 107–116. [Google Scholar] [CrossRef]
- Rejith, R.G.; Gakhar, S.; Sahoo, R.N.; Ranjan, R.; Meena, M.C.; Meena, A. UAV Hyperspectral Remote Sensing for Wheat Leaf Nitrogen Prediction. In Proceedings of the Applied Geoinformatics for Society and Environment(AGSE), Kerala, India, 2–4 November 2022; pp. 54–63. [Google Scholar]
- Sahoo, R.N.; Rejith, R.G.; Gakhar, S.; Ranjan, R.; Meena, M.C.; Dey, A.; Mukherjee, J.; Dhakar, R.; Meena, A.; Daas, A.; et al. Drone Remote Sensing of Wheat N Using Hyperspectral Sensor and Machine Learning. Precis. Agric. 2023, 25, 704–728. [Google Scholar] [CrossRef]
- Hu, M.; Wang, J.; Yang, P.; Li, P.; He, P.; Bi, R. Estimation of Daylily Leaf Area Index by Synergy Multispectral and Radar Remote-Sensing Data Based on Machine-Learning Algorithm. Agronomy 2025, 15, 456. [Google Scholar] [CrossRef]
- Li, Y.; Xu, X.; Wu, W.; Zhu, Y.; Gao, L.; Jiang, X.; Meng, Y.; Yang, G.; Xue, H. Hyperspectral Estimation of Chlorophyll Content in Grapevine Based on Feature Selection and GA-BP. Sci. Rep. 2025, 15, 8029. [Google Scholar] [CrossRef]
- Sahoo, R.N.; Gakhar, S.; Rejith, R.G.; Verrelst, J.; Ranjan, R.; Kondraju, T.; Meena, M.C.; Mukherjee, J.; Daas, A.; Kumar, S.; et al. Optimizing the Retrieval of Wheat Crop Traits from UAV-Borne Hyperspectral Image with Radiative Transfer Modelling Using Gaussian Process Regression. Remote Sens. 2023, 15, 5496. [Google Scholar] [CrossRef]
- Sahoo, R.N.; Rejith, R.G.; Gakhar, S.; Verrelst, J.; Ranjan, R.; Kondraju, T.; Meena, M.C.; Mukherjee, J.; Dass, A.; Kumar, S.; et al. Estimation of Wheat Biophysical Variables through UAV Hyperspectral Remote Sensing Using Machine Learning and Radiative Transfer Models. Comput. Electron. Agric. 2024, 221, 108942. [Google Scholar] [CrossRef]
- He, L.; Song, X.; Feng, W.; Guo, B.B.; Zhang, Y.S.; Wang, Y.H.; Wang, C.Y.; Guo, T.C. Improved Remote Sensing of Leaf Nitrogen Concentration in Winter Wheat Using Multi-Angular Hyperspectral Data. Remote Sens. Environ. 2016, 174, 122–133. [Google Scholar] [CrossRef]
- Nie, C.; Shi, L.; Li, Z.; Xu, X.; Yin, D.; Li, S.; Jin, X. A Comparison of Methods to Estimate Leaf Area Index Using Either Crop-Specific or Generic Proximal Hyperspectral Datasets. Eur. J. Agron. 2023, 142, 126664. [Google Scholar] [CrossRef]
- Jiang, Z.; Huete, A.R.; Didan, K.; Miura, T. Development of a Two-Band Enhanced Vegetation Index without a Blue Band. Remote Sens. Environ. 2008, 112, 3833–3845. [Google Scholar] [CrossRef]
- Gitelson, A.A.; Viña, A.; Ciganda, V.; Rundquist, D.C.; Arkebauer, T.J. Remote Estimation of Canopy Chlorophyll Content in Crops. Geophys. Res. Lett. 2005, 32, L08403. [Google Scholar] [CrossRef]
- Sims, D.A.; Gamon, J.A. Relationships between Leaf Pigment Content and Spectral Reflectance across a Wide Range of Species, Leaf Structures and Developmental Stages. Remote Sens. Environ. 2002, 81, 337–354. [Google Scholar] [CrossRef]
- Dash, J.; Curran, P.J. The MERIS Terrestrial Chlorophyll Index. Int. J. Remote Sens. 2004, 25, 5403–5413. [Google Scholar] [CrossRef]
- Haboudane, D.; Miller, J.R.; Pattey, E.; Zarco-Tejada, P.J.; Strachan, I.B. Hyperspectral Vegetation Indices and Novel Algorithms for Predicting Green LAI of Crop Canopies: Modeling and Validation in the Context of Precision Agriculture. Remote Sens. Environ. 2004, 90, 337–352. [Google Scholar] [CrossRef]
- Wu, C.; Niu, Z.; Tang, Q.; Huang, W. Estimating Chlorophyll Content from Hyperspectral Vegetation Indices: Modeling and Validation. Agric. For. Meteorol. 2008, 148, 1230–1241. [Google Scholar] [CrossRef]
- Qi, J.; Chehbouni, A.; Huete, A.R.; Kerr, Y.H.; Sorooshian, S. A Modified Soil Adjusted Vegetation Index. Remote Sens. Environ. 1994, 48, 119–126. [Google Scholar] [CrossRef]
- Rondeaux, G.; Steven, M.; Baret, F. Optimization of Soil-Adjusted Vegetation Indices. Remote Sens. Environ. 1996, 55, 95–107. [Google Scholar] [CrossRef]
- Rouse, J.W., Jr.; Haas, R.H.; Schell, J.A.; Deering, D.W. Monitoring Vegetation Systems in the Great Plains with Erts. In Proceedings of the NASA SP-351, 3rd ERTS-1 Symposium, Washington DC, USA, 10–14 December 1974. [Google Scholar]
- Gitelson, A.; Merzlyak, M.N. Spectral Reflectance Changes Associated with Autumn Senescence of Aesculus Hippocastanum L. and Acer Platanoides L. Leaves. Spectral Features and Relation to Chlorophyll Estimation. J. Plant Physiol. 1994, 143, 286–292. [Google Scholar] [CrossRef]
- Gitelson, A.A.; Kaufman, Y.J.; Merzlyak, M.N. Use of a Green Channel in Remote Sensing of Global Vegetation from EOS-MODIS. Remote Sens. Environ. 1996, 58, 289–298. [Google Scholar] [CrossRef]
- Feng, W.; Wu, Y.; He, L.; Ren, X.; Wang, Y.; Hou, G.; Wang, Y.; Liu, W.; Guo, T. An Optimized Non-Linear Vegetation Index for Estimating Leaf Area Index in Winter Wheat. Precis. Agric. 2019, 20, 1157–1176. [Google Scholar] [CrossRef]
- Tanaka, S.; Kawamura, K.; Maki, M.; Muramoto, Y.; Yoshida, K.; Akiyama, T. Spectral Index for Quantifying Leaf Area Index of Winter Wheat by Field Hyperspectral Measurements: A Case Study in Gifu Prefecture, Central Japan. Remote Sens. 2015, 7, 5329–5346. [Google Scholar] [CrossRef]
- Penuelas, J.; Baret, F.; Filella, I. Semi-Empirical Indices to Assess Carotenoids/Chlorophyll a Ratio from Leaf Spectral Reflectance. Photosynthetica 1995, 31, 221–230. [Google Scholar]
- Broge, N.H.; Leblanc, E. Comparing Prediction Power and Stability of Broadband and Hyperspectral Vegetation Indices for Estimation of Green Leaf Area Index and Canopy Chlorophyll Density. Remote Sens. Environ. 2001, 76, 156–172. [Google Scholar] [CrossRef]
- Haboudane, D.; Miller, J.R.; Tremblay, N.; Zarco-Tejada, P.J.; Dextraze, L. Integrated Narrow-Band Vegetation Indices for Prediction of Crop Chlorophyll Content for Application to Precision Agriculture. Remote Sens. Environ. 2002, 81, 416–426. [Google Scholar] [CrossRef]
- Vogelmann, J.E.; Rock, B.N.; Moss, D.M. Red Edge Spectral Measurements from Sugar Maple Leaves. Int. J. Remote Sens. 1993, 14, 1563–1575. [Google Scholar] [CrossRef]
- Liang, L.; Di, L.; Zhang, L.; Deng, M.; Qin, Z.; Zhao, S.; Lin, H. Estimation of Crop LAI Using Hyperspectral Vegetation Indices and a Hybrid Inversion Method. Remote Sens. Environ. 2015, 165, 123–134. [Google Scholar] [CrossRef]
- He, L.; Ren, X.; Wang, Y.; Liu, B.; Zhang, H.; Liu, W.; Feng, W.; Guo, T. Comparing Methods for Estimating Leaf Area Index by Multi-Angular Remote Sensing in Winter Wheat. Sci. Rep. 2020, 10, 13943. [Google Scholar] [CrossRef]
- Kiala, Z.; Odindi, J.; Mutanga, O.; Peerbhay, K. Comparison of Partial Least Squares and Support Vector Regressions for Predicting Leaf Area Index on a Tropical Grassland Using Hyperspectral Data. J. Appl. Remote Sens. 2016, 10, 036015. [Google Scholar] [CrossRef]
- Ferraz, E.X.L.; Bezerra, A.C.; Lira, R.M.d.; Cruz Filho, E.M.d.; Santos, W.M.d.; Oliveira, H.F.E.d.; Silva, J.A.O.S.; Silva, M.V.d.; Silva, J.R.I.d.; Silva, J.L.B.d.; et al. What Is the Predictive Capacity of Sesamum Indicum L. Bioparameters Using Machine Learning with Red–Green–Blue (RGB) Images? Agriengineering 2025, 7, 64. [Google Scholar] [CrossRef]
- Wang, Q.; Lu, X.; Zhang, H.; Yang, B.; Gong, R.; Zhang, J.; Jin, Z.; Xie, R.; Xia, J.; Zhao, J. Comparison of Machine Learning Methods for Estimating Leaf Area Index and Aboveground Biomass of Cinnamomum Camphora Based on UAV Multispectral Remote Sensing Data. Forests 2023, 14, 1688. [Google Scholar] [CrossRef]
- Zhang, J.; Cheng, T.; Guo, W.; Xu, X.; Qiao, H.; Xie, Y.; Ma, X. Leaf Area Index Estimation Model for UAV Image Hyperspectral Data Based on Wavelength Variable Selection and Machine Learning Methods. Plant Methods 2021, 17, 49. [Google Scholar] [CrossRef]
- Li, X.; Li, C.; Guo, F.; Meng, X.; Liu, Y.; Ren, F. Coefficient of Variation Method Combined with XGboost Ensemble Model for Wheat Growth Monitoring. Front. Plant Sci. 2023, 14, 1267108. [Google Scholar] [CrossRef] [PubMed]
- Chatterjee, S.; Baath, G.S.; Sapkota, B.R.; Flynn, K.C.; Smith, D.R. Enhancing LAI Estimation Using Multispectral Imagery and Machine Learning: A Comparison between Reflectance-Based and Vegetation Indices-Based Approaches. Comput. Electron. Agric. 2025, 230, 109790. [Google Scholar] [CrossRef]
- Du, L.; Yang, H.; Song, X.; Wei, N.; Yu, C.; Wang, W.; Zhao, Y. Estimating Leaf Area Index of Maize Using UAV-Based Digital Imagery and Machine Learning Methods. Sci. Rep. 2022, 12, 15937. [Google Scholar] [CrossRef]


| Sl No. | Vegetation Index | Formulation | Ref. |
|---|---|---|---|
| 1 | Angular insensitivity vegetation index (AIVI) | [13] | |
| 2 | Chlorophyll index (ClI) | [14] | |
| 3 | Two-band Enhanced vegetation index (EVI2) | 2.5[(R800 − R660)/(1 + R800 + 2.4 R660)] | [15] |
| 4 | Green chlorophyll index (CIgreen) | R780/R550 − 1 | [16] |
| 5 | Modified simple ratio (mSR) | (R750 − R445)/(R705 − R445) | [17] |
| 6 | MERIS terrestrial chlorophyll index (MTCI2) | (R754 − R709)/(R709 − R681) | [18] |
| 7 | Modified triangular vegetation index (MTVI2) | [19] | |
| 8 | Modified chlorophyll absorption ratio indices (MCARI3) | [20] | |
| 9 | Modified chlorophyll absorption ratio index 1 (MCARI1) | [19] | |
| 10 | Modified chlorophyll absorption ratio index 2 (MCARI2) | [1.5 × (2.5 × (R800 − R670) − 1.3 × (R800 − R550))]/[Sqrt((2 × R800 + 1)2 − 6 × R800 + 5 × sqrtR670) − 0.5] | [19] |
| 11 | Modified Red Edge Normalized Difference Vegetation Index (MRENDVI) | (R750 − R705)/(R750 + R705 − 2 R445) | [17] |
| 12 | Modified soil adjusted vegetation index (MSAVI2) | (2 R810 + 1 − sqrt((2 R810 + 1)2 − 8 (R810 − R660)))/2 | [21] |
| 13 | MCARI3/OSAVI | [20,22] | |
| 14 | Normalized difference vegetation index (NDVI [670,800]) | (R800 − R670)/(R800 + R670) | [23] |
| 15 | Normalized Difference ND [705,750] | (R750 − R705)/(R750 + R705) | [24] |
| 16 | NDVI [550,750] | (R750 − R550)/(R750 + R550) | [25] |
| 17 | Optimized soil adjusted vegetation index (OSAVI) | (1 + 0.16)(R800 − R670)/(R800 + R670 + 0.16) | [22] |
| 18 | Optimized nonlinear vegetation index (ONLI) | 1.05(0.6×R7982 − R728)/ (0.6*R7982 + R728 + 0.05) | [26] |
| 19 | Photon radiance index (PRI2) | (R531 − R570/(R531 + R570) | [27] |
| 20 | Ratio spectral index (RSI) | R760/R730 | [28] |
| 21 | Red-edge chlorophyll index (CIre) | R780/R710 − 1 | [16] |
| 22 | Structure Insensitive Pigment Index (SIPI) | (R800 − R445)/(R800 − R680) | [29] |
| 23 | Simple ratio index (SR) SR [800,680] | R800/R680 | [17] |
| 24 | Triangular vegetation index (TVI) | 0.5 [120(R750 − R550) − 200(R670 − R550)] | [30] |
| 25 | Transformed chlorophyll absorption in reflectance index (TCARI) | 3 [(R700 − R670) − 0.2(R700 − R550)(R700/R670)] | [31] |
| 26 | TCARI/OSAVI | [22,31] | |
| 27 | Vogelmann red edge index 1 (VREI1) | R740/R720 | [32] |
Disclaimer/Publisher’s Note: The statements, opinions and data contained in all publications are solely those of the individual author(s) and contributor(s) and not of MDPI and/or the editor(s). MDPI and/or the editor(s) disclaim responsibility for any injury to people or property resulting from any ideas, methods, instructions or products referred to in the content. |
© 2025 by the authors. Licensee MDPI, Basel, Switzerland. This article is an open access article distributed under the terms and conditions of the Creative Commons Attribution (CC BY) license (https://creativecommons.org/licenses/by/4.0/).
Share and Cite
Rejith, R.G.; Sahoo, R.N.; Ranjan, R.; Kondraju, T.; Bhandari, A.; Gakhar, S. Estimating Leaf Area Index of Wheat Using UAV-Hyperspectral Remote Sensing and Machine Learning. Biol. Life Sci. Forum 2025, 41, 11. https://doi.org/10.3390/blsf2025041011
Rejith RG, Sahoo RN, Ranjan R, Kondraju T, Bhandari A, Gakhar S. Estimating Leaf Area Index of Wheat Using UAV-Hyperspectral Remote Sensing and Machine Learning. Biology and Life Sciences Forum. 2025; 41(1):11. https://doi.org/10.3390/blsf2025041011
Chicago/Turabian StyleRejith, Rajan G., Rabi N. Sahoo, Rajeev Ranjan, Tarun Kondraju, Amrita Bhandari, and Shalini Gakhar. 2025. "Estimating Leaf Area Index of Wheat Using UAV-Hyperspectral Remote Sensing and Machine Learning" Biology and Life Sciences Forum 41, no. 1: 11. https://doi.org/10.3390/blsf2025041011
APA StyleRejith, R. G., Sahoo, R. N., Ranjan, R., Kondraju, T., Bhandari, A., & Gakhar, S. (2025). Estimating Leaf Area Index of Wheat Using UAV-Hyperspectral Remote Sensing and Machine Learning. Biology and Life Sciences Forum, 41(1), 11. https://doi.org/10.3390/blsf2025041011