Proceeding Paper

Diversity of Color, Infrared Spectra, and Phenolic Profile Correlation in Citrus Fruit Peels †

by
Rosa Zapata
1,
Lorena Martínez-Zamora
1,2 and
Francisco Artés-Hernández
1,*
1
Postharvest and Refrigeration Group, Department of Agricultural Engineering, Universidad Politécnica de Cartagena. Pº Alfonso XIII, 48, 30203 Cartagena, Murcia, Spain
2
Department of Food Technology, Food Science and Nutrition, Faculty of Veterinary Sciences, University of Murcia, 30100 Espinardo, Murcia, Spain
*
Author to whom correspondence should be addressed.
Presented at the 5th International Electronic Conference on Foods, Online, 28–30 October 2024.
Biol. Life Sci. Forum 2024, 40(1), 26; https://doi.org/10.3390/blsf2024040026
Published: 7 February 2025
(This article belongs to the Proceedings of The 5th International Electronic Conference on Foods)

Abstract

:
Citrus waste is a source of phytochemicals with extensive health properties, mainly diglycosylated flavonoids. In this experiment, the characterization of dried peels from three main citrus species, lemon (Citrus limon), orange (Citrus sinensis), and grapefruit (Citrus paradisi), was performed using various analytical techniques. The FTIR spectra of each species show the characteristic bands of C=O stretching and O-H stretching and bending, and the PCA shows discrimination between species based on their chemical nature. The TPC determined by UV-vis spectroscopy was found to be higher for grapefruit peel by 12.4% and 38.9% compared to lemon and orange, which coincides with the individual flavonoid content obtained by HPLC-MS/MS. Meanwhile, full-scan HPLC-MS confirmed a wider variety of phytochemicals in lemon peel.

1. Introduction

The Citrus genus, belonging to the Rutaceae family, represents the most widely cultivated fruit crop globally [1]. Even so, the demand and consumption of citrus fruits have continued to rise over recent decades, with global production reaching approximately 143.49 million tons in 2019 [2]. Among the most produced species are sweet oranges (Citrus sinensis); mandarins, tangerines, and clementines (Citrus reticulata, Citrus tangerine, and Citrus clementina); lemons and limes (Citrus limon and Citrus aurantifolia); and grapefruits (Citrus paradisi) prominent, with an approximated annual production of 68.6, 46.9, 19.5, and 9.5 million tons, respectively [3].
Both the high demand for fresh citrus fruits and the large volume destined for the food industry, particularly in juice production, generate a significant number of by-products, reaching 50% of the whole fruit. These by-products include peels, flavedo and albedo, pulp, and seeds, accounting for 34%, 19%, 26%, and 2%, respectively [4]. They represent a potential source of added-value co-products, including in greater quantity the primary metabolites such as fiber, sugars, lipids, and proteins, but also the secondary metabolites, which exhibit anti-inflammatory, antioxidant, antimicrobial, antimutagenic, neuroprotective, antiallergic, and antihypertensive effects, in all citrus fruit species [5]. These can be classified based on their nature and chemical structure in organic acids, vitamins, terpenes, coumarins, carotenoids, and phenolic compounds [2]. Within this latter group, flavonoids stand out due to their high concentration and superior positive bioactivity compared to other secondary metabolites [6]. Notable studies focus on the health effects of hesperetin, eriodictyol, and naringenin and their respective di-glycosylated derivatives of hesperidin, eriocitrin, and naringin [7,8].
The main interest in their valorization and application as natural antioxidant supplements has prompted numerous studies on the qualitative and quantitative analysis of the extracted bioactive compounds in several citrus species [9,10,11]. Considerable variability in the secondary metabolite content has been reported among different fruit parts and citrus species, primarily for carotenoid, coumarin, and flavonoid contents [6]. The comparison between three of the main citrus varieties, Citrus sinensis, Citrus paradisi, and Citrus limon, reveals a higher content of the main carotenoids, β-cryptoxanthin and β-carotene, in lemon and grapefruit, respectively, while violaxanthin is more abundant in orange peel [12]. Also, the peel of C. paradisi has a higher content of coumarins and furanocoumarins, notably including bergapten, bergamottin, 5-hydroxyfuranocoumarin, auraptene, and meranzin [6,13]. As for the polyphenolic compounds, although these three species provide a similar total phenolic content, the total flavonoid concentration reported for grapefruit peel is 2.5-fold higher than that of orange and grapefruit [4,14]. Flavanones, such as hesperidin, diosmin, narirutin, and eriocitrin, are the most abundant subgroup of flavonoids, accounting for 95% of the total [15,16].
Despite the wide variety of studies on the analysis and comparison of secondary metabolites among different citrus species, most of the described results were obtained using gas and liquid chromatography coupled with mass spectrometry after extraction. The initial characterization using non-destructive IR spectroscopy also provides rich structural and biophysical information about food chemical components and their differences among food products based on the characteristic bending and stretching bands of each functional group [17,18]. Among the few reported studies, the IR technique has been used for the determination of the functional properties of pasta supplemented with grapefruit albedo [19], the discrimination of whole citrus fruits [20], and the selection of the most suitable dryer to better maintain the bioactive compounds of sweet lime [21].
Therefore, the present study focuses on the chemical characterization of the peel by-products from C. sinensis, C. paradisi, and C. limon using Fourier Transform Infrared (FTIR) spectroscopy and HPLC-MS and their correlation with the total phenolic content (TPC), and color these types of citrus fruits exhibit.

2. Materials and Methods

2.1. Chemical Reagents

The solvents used, including formic acid solution, HPLC-grade methanol, and LC-MS-grade acetonitrile, were sourced from PanReac AppliChem (Castellar del Vallès, Barcelona, Spain). MiliQ water was produced using a Synergy-UV ultra-purification system (Millipore, Bradford, MA, USA). The reagents, Na2CO3, NaOH, and 2 N Folin–Ciocalteu reagent, were obtained from Sigma-Aldrich (St. Louis, MO, USA), along with standards for gallic acid, citric acid, and naringenin. Additional flavonoid standards for LC-MS analysis, including hesperidin, naringin, diosmin, rutin, and eriocitrin, were provided by CymitQuimica S.L (Sant Martí, Barcelona, Spain).

2.2. Plant Materials

The citrus peels were obtained from the corresponding whole organic fruits at commercial maturity, specifically ‘Fino 95’ lemons (Citrus limon), ‘Navelina’ sweet oranges (Citrus sinensis), and ‘Star Ruby’ grapefruits (Citrus paradisi), with maturity indices of 2.8 ± 0.4, 46.2 ± 10.9, and 12.8 ± 1.6 g citric acid 100 mL−1, respectively, as previously used in one of our reported works [22]. These fruits were supplied, grown, and harvested in January, eight months after full bloom, by Toñifruit S.L (Librilla, Murcia, Spain) in the open air in Southeast Mediterranean Spanish lands. Once all the by-product samples were separated (~400 g per cultivar), they were frozen at −80 °C and freeze-dried using a Telstar® LyoBeta (Terrassa, Barcelona, Spain) three days later to obtain the homogeneous raw material for further analyses in the form of a fine powder using the IKA A 11 basic mincer (Berlin, Germany).

2.3. Color Measurement and Fourier Transform Infrared Analysis

Color and IR spectra determinations were directly performed in quintuplicate on the different powder samples of each species. The color was measured in the CIELab color space with a Konica Minolta CR-400 colorimeter (Tokyo, Kanto, Japan). The IR spectra determination was carried out using a Thermo Nicolet 5700 FTIR spectrophotometer (Burladingen, Tubinga, Germany) equipped with a deuterated triglycine sulfate/KBr detector, an Attenuated Total Reflectance module (ATR) with diamond crystal and controlled by Omnic 9.11.721 software. Samples composed of 10 mg of the peel powder were dispensed directly onto the ATR crystal, and their transmittance spectra were collected. Each spectrum was acquired using parameters like those described [20], with slight modification, within a range of 4000–400 cm−1 with spectral resolution intervals of 4 cm−1 averaging 32 accumulations. Prior to the multivariate analysis, The Unscrambler X 10.4 software (CAMO Software, Oslo, Norway) was used to process the FTIR spectra, which included spectra cropping (400–1775 cm−1 and 2700–3600 cm−1), baseline correction, spectra normalization, and smoothing (Savitzky–Golay).

2.4. Total Phenolic Content and HPLC-ESI-QqQ-MS/MS Profile Analyses

The analyses of bioactive compounds were performed on the solid–liquid extraction of citrus peel powder. Samples of ~0.1 g were mixed with 10 mL of 80% methanolic solution (n = 5) in polypropylene plastic tubes, which were shaken in darkness at 4 °C in an orbital shaker (Stuart, Stone, UK) for 1 h at 200 rpm. After centrifuging for 10 min at 3220× g, the supernatants were isolated in 2 mL Eppendorf tubes using 0.2 μm polytetrafluoroethylene (PTFE) membrane filters (Macherey-Nagel, Düren, Germany) and stored at −80 °C for further TPC and HPLC-MS analyses.
The TPC was determined using UV-vis absorption spectroscopy on a Tecan Infinite M200 microplate reader (Mäneford, Switzerland) following the colorimetric method of the Folin–Ciocalteu reagent [23], with modifications [24]. Once the samples were diluted to 20% with 80% methanolic solution, 19 μL of these dilutions was mixed with 29 μL of the 1 N Folin–Ciocalteu reagent in a flat-bottom PS 96-well plate (Greiner Bio-One; Frickenhausen, Germany). Three minutes later, the medium was alkalinized by adding 192 μL of an aqueous solution of 0.4% Na2CO3 and 2% NaOH to facilitate the redox reaction. After one hour of incubation in darkness at room temperature, the plates were read at 750 nm. The results were expressed as g of gallic acid equivalents (GAE) kg−1 dry weigh (dw) of peel powder, as this is the standard used and widely recommended for analytical calibration [25].
The analysis of individual bioactive compounds extracted from the dried matrix was performed qualitatively and quantitatively using HPLC-MS and HPLC-MS/MS techniques. The equipment used was an Agilent 1200 liquid chromatograph (Santa Clara, CA, USA) coupled to a 6420 triple-quadrupole mass spectrometer (QqQ) with an electrospray ionization source (ESI) set in negative ionization mode. The chromatographic system was equipped with a G1311B quaternary pump, a G1329B standard autosampler, and a G1316A oven, which was set at 40 °C.
The separation of the compounds based on their polarity was performed using a C18 reversed-phase column, Luna Omega C18 (2.1 × 100 mm; 3 μm), as the stationary phase, and a 0.1% formic acid aqueous solution (A), and HPLC-MS grade acetonitrile (B) as the mobile phase. The MS parameters were set as previously described [26]: the gas temperature and flow were 350 °C and 11 L min−1, and the nebulizer and capillary voltage were 4000 V and 40 psi. First, for the identification of the compounds, a full-scan (FS) in the acquisition mode was performed following the gradient of 0 min, 5% B; 30 min, 95% B; 40 min, 95% B; and 45 min, 10%, with 7 min of postime. The flow rate and the sample volume injected were 0.2 mL min−1 and 5.00 μL, and the mass range, scan time, and fragmentor were set at 100–900 m/z, 500, and 140, respectively. The tentative identification allowed the quantification of certain flavonoids to be proceeded. For that, the QqQ was in a Multiple Reaction Monitoring (MRM) acquisition mode, considering the most suitable transitions. The gradient used was as previously described [22]: 0 min, 10% B; 3 min, 30% B; 8 min, 80% B; 8.50 min, 95% B; 12.00 min, 95% B; and 17.10 min, 5% B. The flow rate and sample volume injected were 0.3 mL min−1 and 1 μL, respectively. All measurements were conducted in quintuplicate, and the calibration was performed with the standards hesperidin, eriocitrin, diosmin, rutin, naringin, and naringenin.

2.5. Principal Component Analysis and Statistical Analyses

The obtained results were subjected to one- and two-way analyses of variance (ANOVA) (p < 0.05) using GraphPad Prism statistical software (v. 8.0.2. GraphPad Software, Boston, MA, USA) to determine significant differences between groups by comparing all means pairwise using Tukey’s multiple range test. In addition, principal component analysis (PCA) was used to visualize whether the ATR-FTIR spectral differences and all the variables analyzed among the peels enabled the discrimination between citrus species. This multivariate analysis was performed using The Unscrambler X 10.4 software (CAMO Software, Oslo, Norway). All quality attributes were measured in quintuplicate from different 1 g samples of lyophilized and homogenized powder prepared from the peel of ~10–15 fruits.

3. Results and Discussion

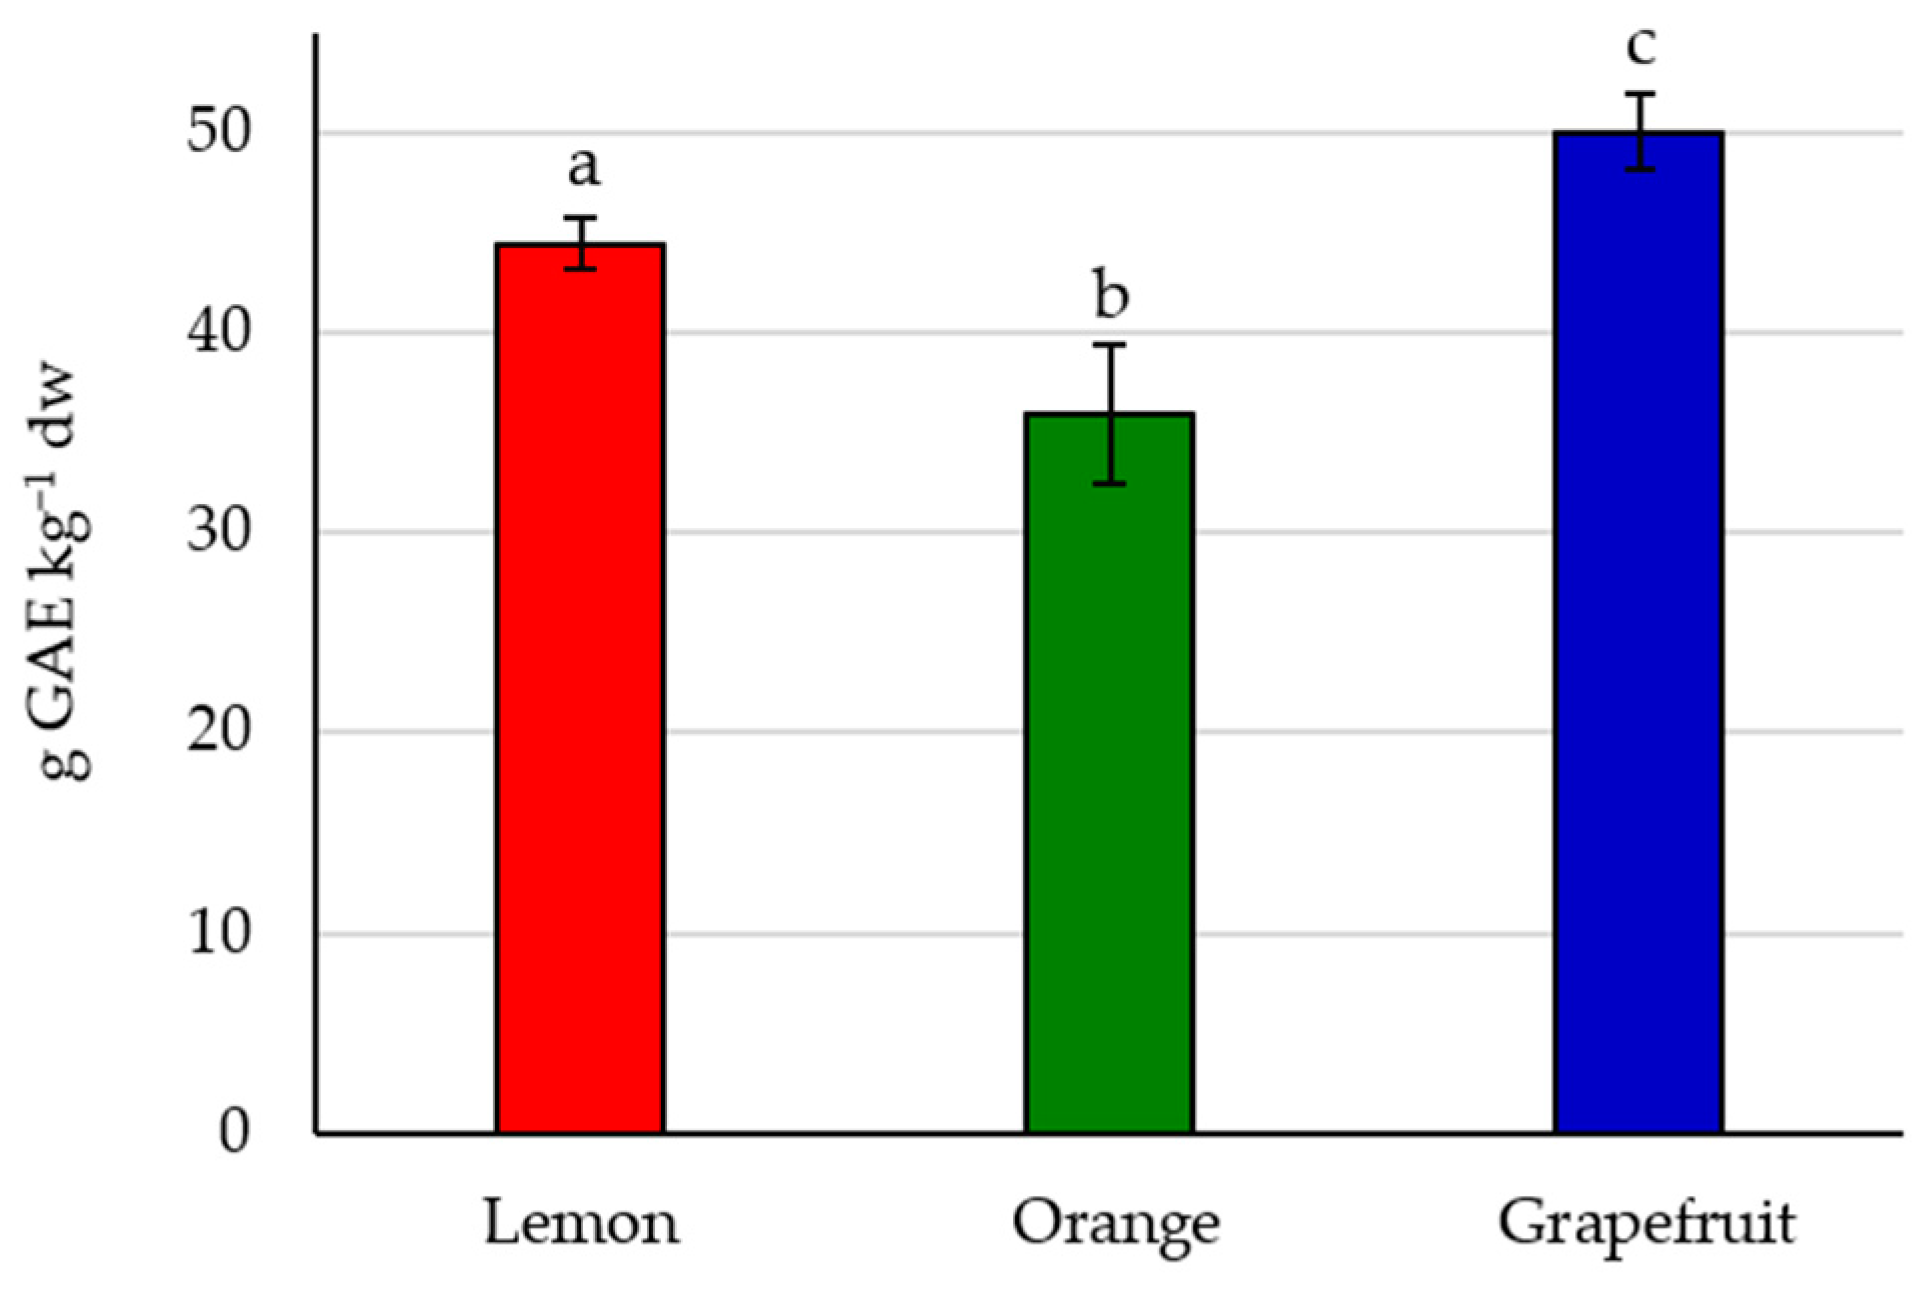
3.1. Color and Total Phenolic Content

The visual color variation observed among the whole fresh fruits continued to be appreciated after the freeze-drying and grinding of the peels (flavedo and albedo), as indicated by the different measured L*, a*, and b* values (Table 1). The L* value, which represents luminosity, is slightly higher in citrus lemon peel. The a* and b* values, which represent the coordinates on the green–red and blue–yellow axes, are higher for grapefruit and orange, respectively.
In a previous study, the color observed for the fresh whole fruits differed considerably from the values measured once the by-product was freeze-dried and ground [22]. The a* and b* values were higher in all three species; for example, for the orange, the reported measurements were 27.6 ± 1.9 and 51.7 ± 1.4, respectively. This is also because the color corresponds not only to the flavedo but also to the albedo, unlike the measurement of the whole fruit. The significant differences indicated in Table 1 show that the color of the dried by-product is a distinguishing parameter for the three species.
The TPC found for each citrus peel expresses the overall number of compounds with the phenol functional group extracted, including phenolic acids and flavonoids. The TPC values found for each species are represented in Figure 1. Significant differences can be observed among the three fruits; grapefruit peel provides the highest TPC, being 12.4% and 38.9% higher than lemon and orange, respectively. This trend differs from one previously reported where the TPC provided by lemon peel was the highest, being 55.9 ± 2.5, 79.7 ± 1.2, and 87.8 ± 1.4 for C. paradisi, C. sinensis, and C. limon, respectively [27]. The superiority of these values compared to the experimental ones may be due to the extraction being performed on samples of 3 g of dw with 50 mL of the solvent, which consisted of pure methanol, representing a solid/liquid ratio of 6%, while in this experiment it was 1%.

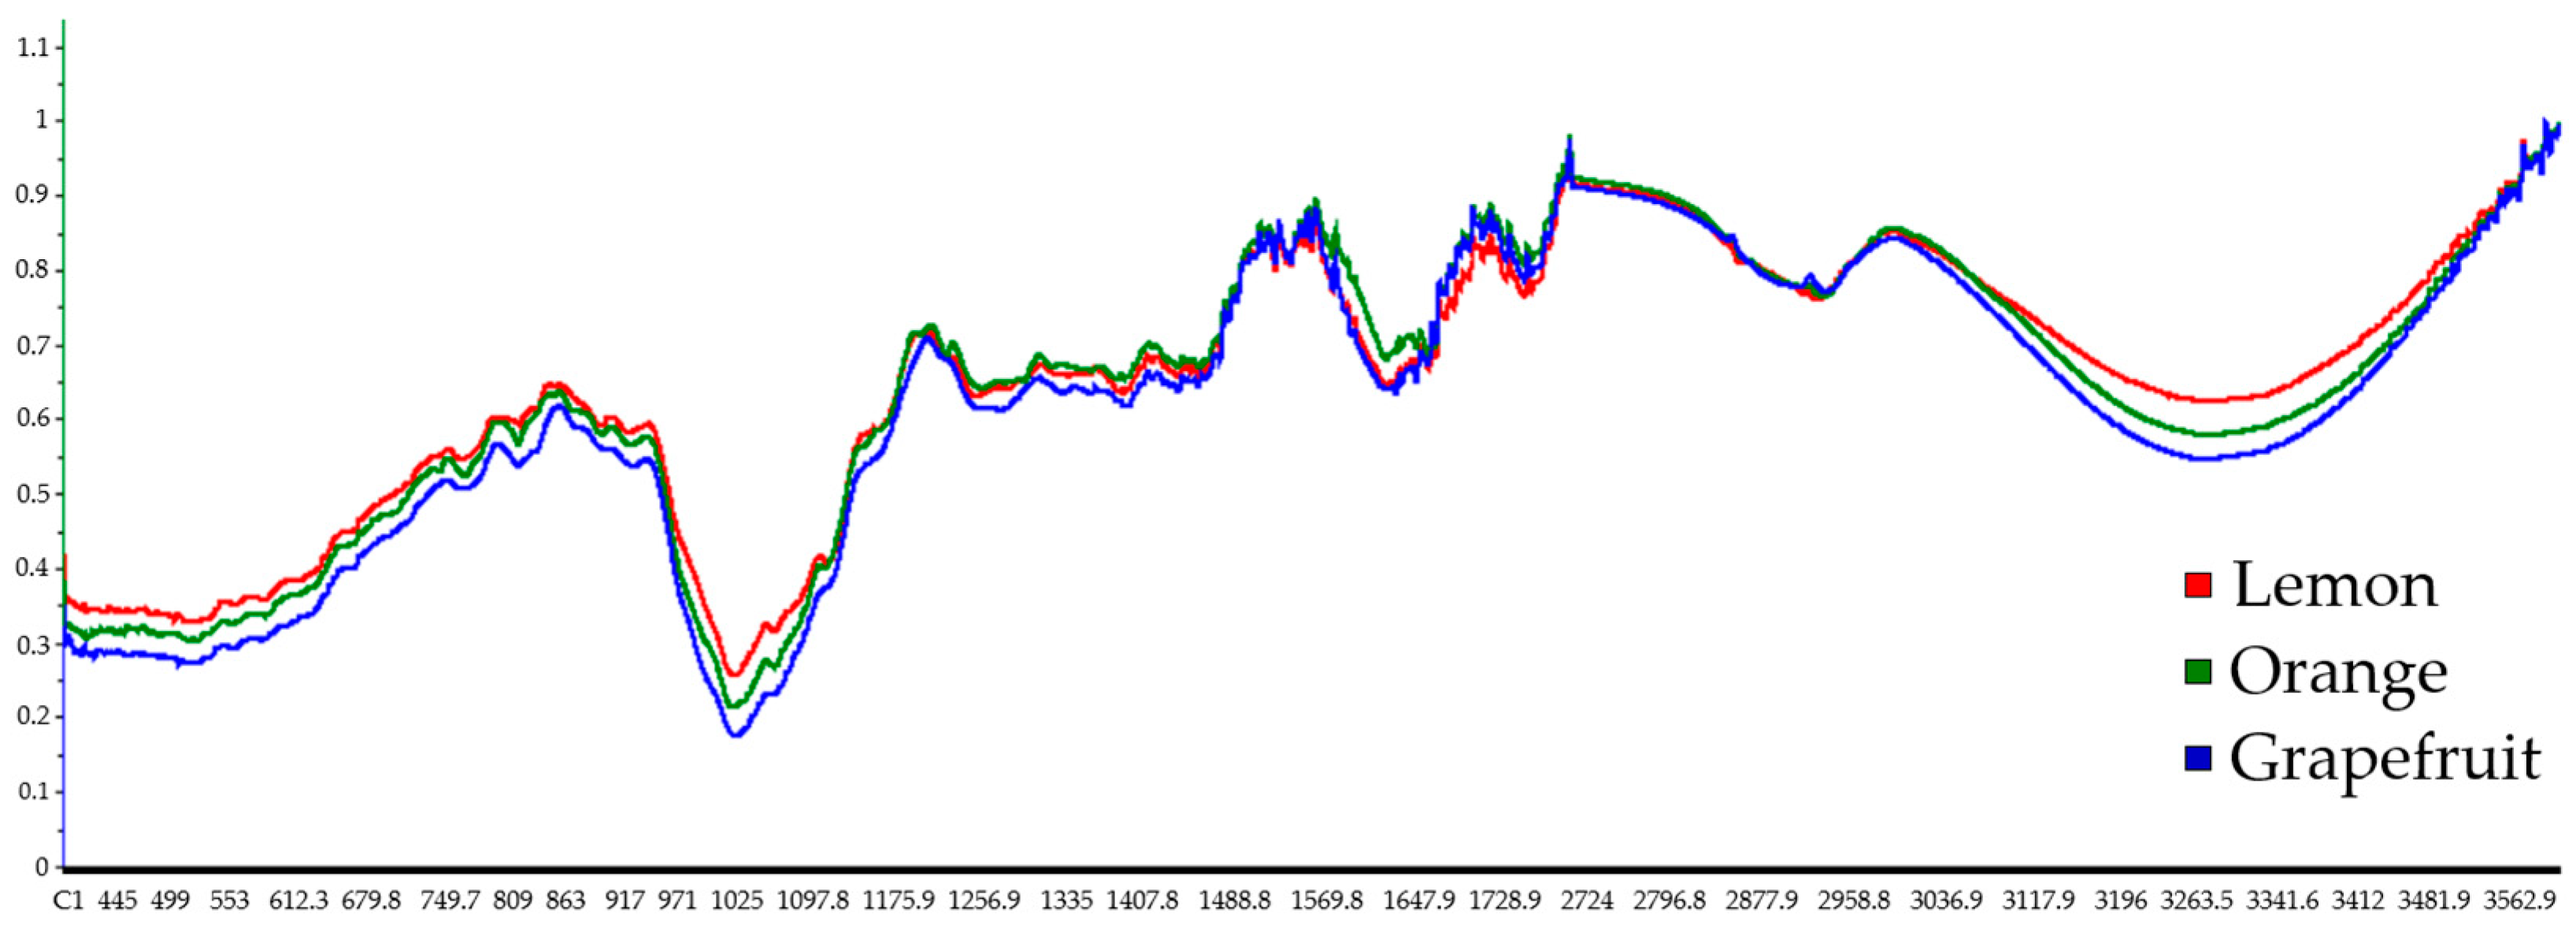
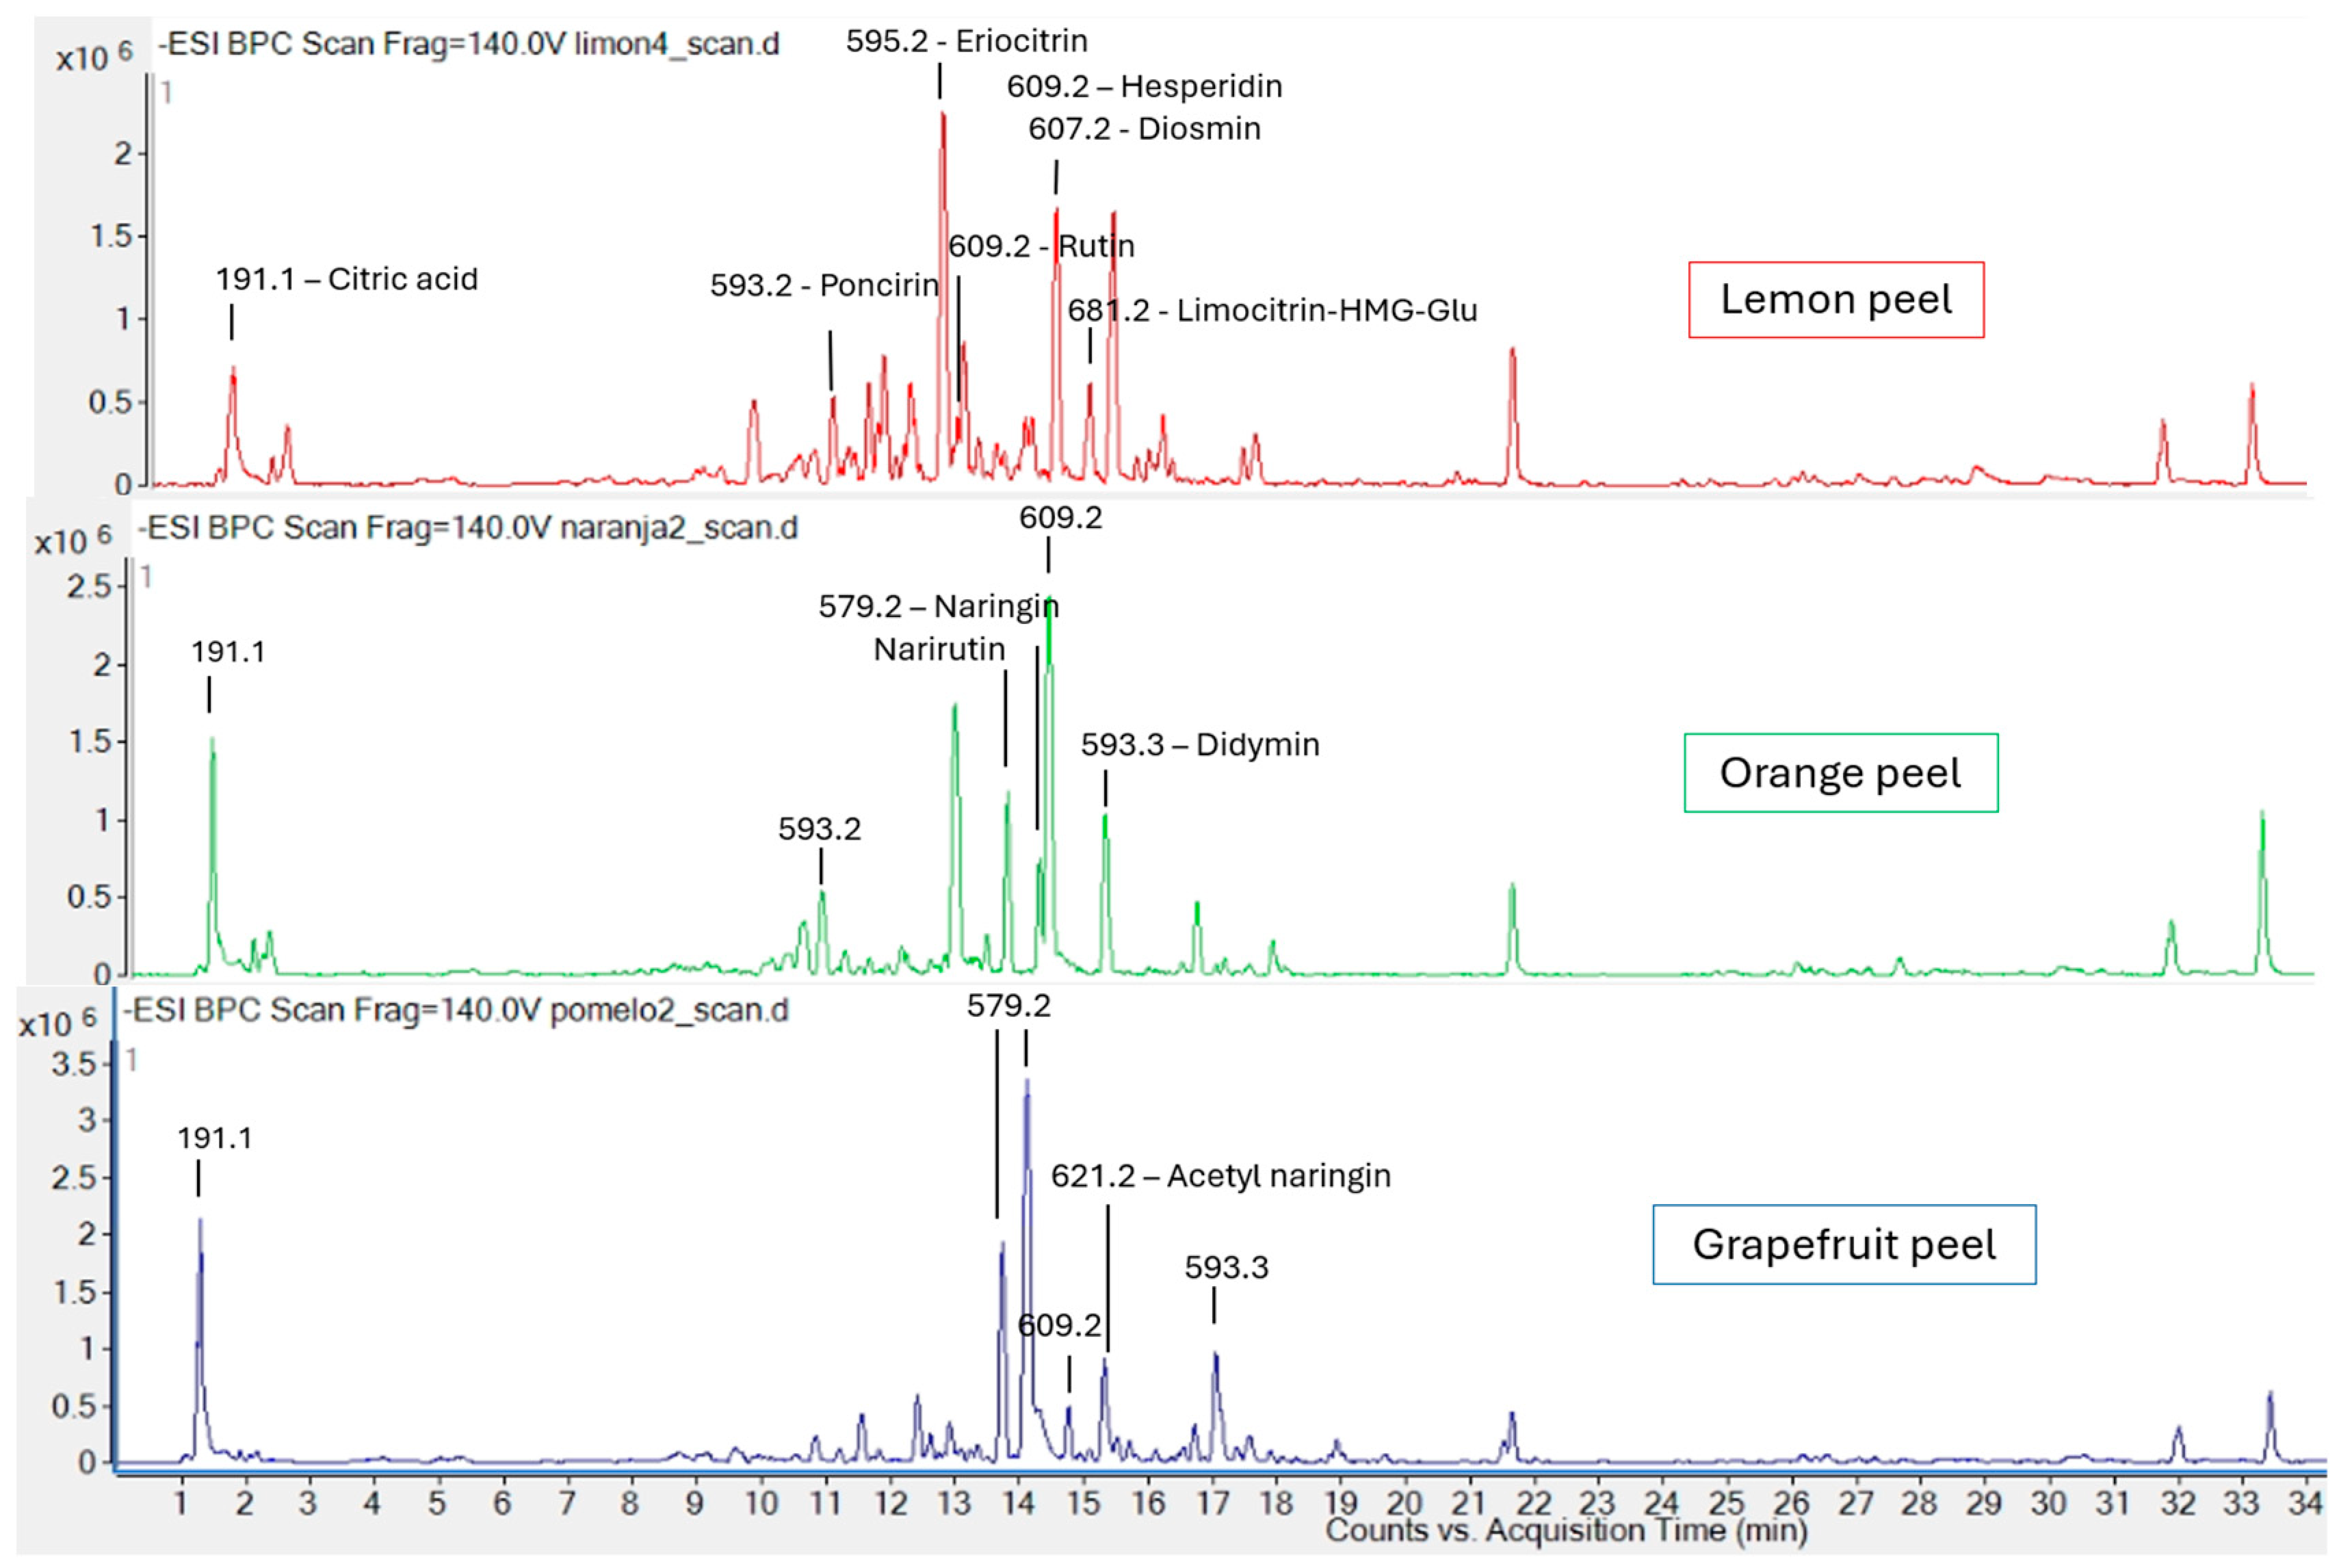
3.2. FTIR Spectrum Analysis and HPLC-MS/MS Profile

The average spectra of the three fruit peels are shown superimposed in Figure 2 to facilitate their comparison. A similar trend for the bands is observed, showing the main differences in the spectral ranges at 1600–1750 cm1, 1400–1440 cm1, and 3200–3600 cm1 due to the stretching bands of the C=O bond, and the bending and stretching of the O-H bond, respectively [28]. The three bonds derived from the band assignments are characteristic of phenolic compounds.
The technique of HPLC using a non-polar column is widely reported for the analysis of phytochemicals from the methanolic extraction of citrus tissues, specifically for phenolic acids, flavanones, flavonols, and limonoids, in this order of elution [29]. In the full-scan chromatograms performed for the peels (Figure 3), there were clear differences between species.
The m/z detection, as well as its tentative identification based on the fragmentation pattern and some commercial standards, confirms the presence of these groups of compounds in decreasing order of polarity. Comparing the three profiles, a wider variety of bioactive compounds can be observed in lemon peel, with eriocitrin providing the largest peak area, while for orange peel, it is hesperidin. In the grapefruit chromatogram, although a considerable decrease in the variety of phytochemicals is observed, the magnitude of the ion count rate (y-axis) is higher, so the total amount of bioactive compounds does not necessarily have to be lower, with naringin being the major compound. The major analytes for each species are consistent with those previously reported [30].
The subsequent quantification of the main flavonoids using the MRM mode is shown in Table 2. The quantification of the compounds was performed using the commercial standards, except for limocitrin–HMG–Glu, poncirin, and didymin, and from acetyl naringenin and quercetin, where naringenin was used. It can be observed that the content of individual flavonoids in the case of grapefruit is higher, followed by lemon and orange, in the same order as derived from the TPC analysis.

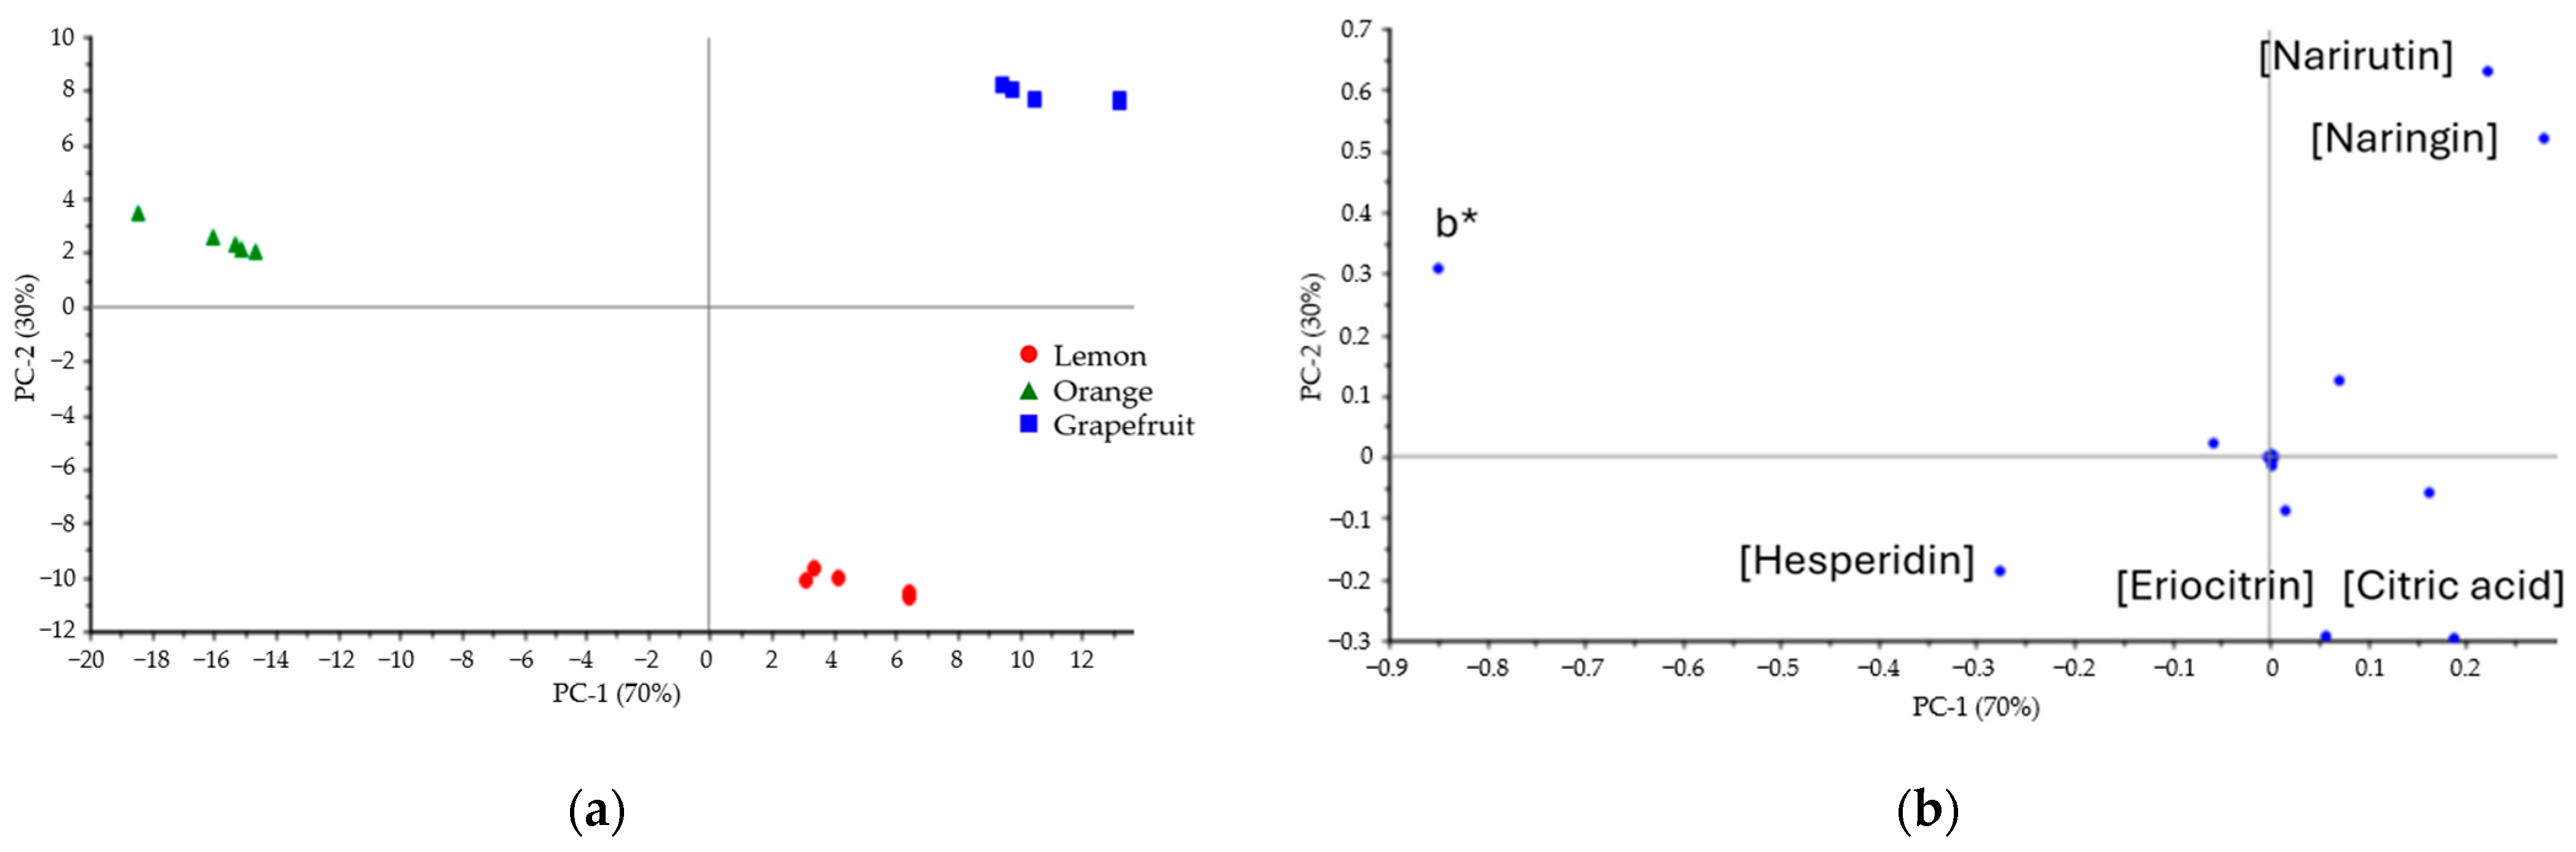
3.3. Principal Component Analysis

The PCA allowed us to verify that the slight differences observed in the FTIR spectra of the peels enabled discrimination between samples, as evidenced in Figure 4, where the three groups can be distinguished. This representation shows the use of three principal components, PC1, PC2, and PC4, which account for 88%, 9%, and 1% of the total variance and lead to the greatest intergroup dispersion. The IR spectrum of a compound or a mixture is also known as its fingerprint, as it is characteristic of each one. As they differ among citrus species, it confirms the differences in their chemical composition.
After verifying the differences between FTIR spectra among peels, the PCA of the combination of all determined variables was visualized, including color (L*, a*, and b*), TPC, selected FTIR absorbance bands, and the content of individual compounds. The intragroup variance with the two principal components, PC1 (70%) and PC2 (30%), was the highest. The score plot (Figure 5a) shows the three groups completely differentiated based on the mentioned variables. The loadings plot (Figure 5b) shows that the b* color parameter and individual contents of naringin, narirutin, eriocitrin, hesperidin, didymin, and citric acid are the most influencing factors in the discrimination between peels.

4. Conclusions

PCA confirms that the color differences visually observable and measured through the CIELab system of lemon, orange, and grapefruit dried peels correlate with differences in their chemical composition; total phenolic content; and major flavonoid concentrations (narirutin, naringin, eriocitrin, hesperidin, didymin, and citric acid) evaluated through the FTIR fingerprint spectra, UV-vis colorimetric method, and HPLC-MS/MS quantification, respectively. Lemon peel presents a wider variety of flavonoids; meanwhile, grapefruit shows a higher TPC than lemon and orange by 12.4% and 38.9%, respectively, aligning with the higher content of the main individual flavonoids, especially naringin and narirutin.

Author Contributions

Conceptualization, F.A.-H., L.M.-Z. and R.Z.; methodology, F.A.-H., L.M.-Z. and R.Z.; software, R.Z.; validation, F.A.-H., L.M.-Z. and R.Z.; formal analysis, L.M.-Z. and R.Z.; investigation, F.A.-H., L.M.-Z. and R.Z.; resources, F.A.-H.; data curation, R.Z.; writing—original draft preparation, L.M.-Z. and R.Z.; writing—review and editing, F.A.-H., L.M.-Z. and R.Z.; visualization, F.A.-H.; supervision, F.A.-H.; project administration, F.A.-H.; funding acquisition, F.A.-H. All authors have read and agreed to the published version of the manuscript.

Funding

This work was supported by the grant PID2021-123857OB-I00, funded by MICIU/AEI/10.13039/501100011033 and by “ERDF/EU”. This work is also a result of the AGROALNEXT program and was supported by MICIU with funding from EU NextGeneration (PRTR-C17.I1) and by Seneca Foundation with funding from Autonomous Community of the Region of Murcia (CARM).

Institutional Review Board Statement

Not applicable.

Informed Consent Statement

Informed consent was obtained from all subjects involved in this study.

Data Availability Statement

The original contributions presented in the study are included in the article, further inquiries can be directed to the corresponding author.

Acknowledgments

R.Z. acknowledges the predoctoral scholarship IFPI—SEFYCU 2629070 from UPCT. L.M.Z. thanks the postdoctoral contract Margarita Salas from University of Murcia, funded by the EU Next Generation EU/PRTR.

Conflicts of Interest

The authors declare no conflicts of interest. The funders had no role in the design of the study; in the collection, analyses, or interpretation of data; in the writing of the manuscript; or in the decision to publish the results.

References

  1. Suri, S.; Singh, A.; Nema, P.K. Recent advances in valorization of citrus fruits processing waste: A way forward towards environmental sustainability. Food Sci. Biotechnol. 2021, 30, 1601–1626. [Google Scholar] [CrossRef]
  2. Nieto, G.; Fernández-López, J.; Pérez-álvarez, J.A.; Peñalver, R.; Ros, G.; Viuda-martos, M. Valorization of citrus co-products: Recovery of bioactive compounds and application in meat and meat products. Plants 2021, 10, 1069. [Google Scholar] [CrossRef] [PubMed]
  3. Food and Agriculture Organization of the United Nations FAOSTAT. Available online: https://www.fao.org/faostat/en/#data/QCL (accessed on 16 January 2025).
  4. Leporini, M.; Tundis, R.; Sicari, V.; Loizzo, M.R. Citrus species: Modern functional food and nutraceutical-based product ingredient. Ital. J. Food Sci. 2021, 33, 63–107. [Google Scholar] [CrossRef]
  5. Mahato, N.; Sharma, K.; Sinha, M.; Cho, M.H. Citrus waste derived nutra-/pharmaceuticals for health benefits: Current trends and future perspectives. J. Funct. Foods 2018, 40, 307–316. [Google Scholar] [CrossRef]
  6. Lv, X.; Zhao, S.; Ning, Z.; Zeng, H.; Shu, Y.; Tao, O.; Xiao, C.; Lu, C.; Liu, Y. Citrus fruits as a treasure trove of active natural metabolites that potentially provide benefits for human health. Chem. Cent. J. 2015, 9, 1–14. [Google Scholar] [CrossRef] [PubMed]
  7. Zhong, G.; Shen, J.; Chen, Z.; Lin, Z.; Long, L.; Wu, J.; Long, C.; Huang, S.; Lian, P.; Luo, G. Antioxidant and antitumor activities of newly synthesized hesperetin derivatives. Molecules 2022, 27, 879. [Google Scholar] [CrossRef] [PubMed]
  8. Alghareeb, S.A.; Alsughayyir, J.; Alfhili, M.A. Eriocitrin disrupts erythrocyte membrane asymmetry through oxidative stress and calcium signaling and the activation of casein kinase 1α and rac1 gtpase. Pharmaceuticals 2023, 16, 1681. [Google Scholar] [CrossRef] [PubMed]
  9. Raghavan, S.; Gurunathan, J. Citrus species—A golden treasure box of metabolites that is beneficial against disorders. J. Herb. Med. 2021, 28, 100438. [Google Scholar] [CrossRef]
  10. Wang, Y.; Qian, J.; Cao, J.; Wang, D.; Liu, C.; Yang, R.; Li, X.; Sun, C. Antioxidant capacity, anticancer ability and flavonoids composition of 35 citrus (citrus reticulata blanco) varieties. Molecules 2017, 22, 1114. [Google Scholar] [CrossRef] [PubMed]
  11. Anuradha, N.; Kumar, S.S.; Himabindu, N.; Gnanavel, A.; Karthick, S. Quantitative analysis of phytocompounds and gas chromatography mass spectrometry profiling of methanolic extract of citrus limon peel: An experimental study. J. Clin. Diagn. Res. 2024, 18, 7. [Google Scholar] [CrossRef]
  12. Agócs, A.; Nagy, V.; Szabó, Z.; Márk, L.; Ohmacht, R.; Deli, J. Comparative study on the carotenoid composition of the peel and the pulp of different citrus species. Innov. Food Sci. Emerg. Technol. 2007, 8, 390–394. [Google Scholar] [CrossRef]
  13. Fayek, N.M.; Farag, M.A.; Abdel Monem, A.R.; Moussa, M.Y.; Abd-Elwahab, S.M.; El-Tanbouly, N.D. Comparative metabolite profiling of four citrus peel cultivars via ultra-performance liquid chromatography coupled with quadrupole-time-of-flight-mass spectrometry and multivariate data analyses. J. Chromatogr. Sci. 2019, 57, 349–360. [Google Scholar] [CrossRef]
  14. Huang, R.; Zhang, Y.; Shen, S.; Zhi, Z.; Cheng, H.; Chen, S.; Ye, X. Antioxidant and pancreatic lipase inhibitory effects of flavonoids from different citrus peel extracts: An in vitro study. Food Chem. 2020, 326, 126785. [Google Scholar] [CrossRef]
  15. Martinidou, E.; Michailidis, M.; Ziogas, V.; Masuero, D.; Angeli, A.; Moysiadis, T.; Martens, S.; Ganopoulos, I.; Molassiotis, A.; Sarrou, E. Comparative evaluation of secondary metabolite chemodiversity of citrus genebank collection in greece: Can the peel be more than waste? J. Agric. Food Chem. 2024, 72, 9019–9032. [Google Scholar] [CrossRef]
  16. Magalhães, D.; Vilas-Boas, A.A.; Teixeira, P.; Pintado, M. Functional ingredients and additives from lemon by-products and their applications in food preservation: A review. Foods 2023, 12, 1095. [Google Scholar] [CrossRef] [PubMed]
  17. Borba, A.; Gómez-Zavaglia, A. Infrared spectroscopy: An underexploited analytical tool for assessing physicochemical properties of food products and processing. Curr. Opin. Food Sci. 2023, 49, 100953. [Google Scholar] [CrossRef]
  18. Aftab, J.; Abbas, M.; Sharif, S.; Mumtaz, A.; Zafar, K.; Ahmad, N.; Mohammed, O.A.; Nazir, A.; Iqbal, S.; Iqbal, M. LC-MS/MS profiling, antioxidant potential and cytotoxicity evaluation of Citrus reticulata albedo. Nat. Prod. Commun. 2024, 19, 1934578X241272471. [Google Scholar] [CrossRef]
  19. Chaudhary, S.; Singh, B.; Srivastava, Y.; Chahal, T.S. Grapefruit albedo-incorporated pasta: Effect on the phytochemical, functional, textural, cooking and sensorial properties of semolina pasta. J. Food Meas. Charact. 2024, 18, 8530–8539. [Google Scholar] [CrossRef]
  20. Song, S.Y.; Kim, C.H.; Im, S.J.; Kim, I.J. Discrimination of citrus fruits using ft-ir fingerprinting by quantitative prediction of bioactive compounds. Food Sci. Biotechnol. 2018, 27, 367–374. [Google Scholar] [CrossRef]
  21. Suri, S.; Singh, A.; Nema, P.K.; Malakar, S.; Arora, V.K. Sweet lime (Citrus limetta) peel waste drying approaches and effect on quality attributes, phytochemical and functional properties. Food Biosci. 2022, 48, 101789. [Google Scholar] [CrossRef]
  22. Zapata, R.; Martínez-Zamora, L.; Cano-Lamadrid, M.; Artés-Hernández, F. Wounding citrus peel by-products as abiotic stress to induce the synthesis of phenolic compounds? Horticulturae 2024, 10, 885. [Google Scholar] [CrossRef]
  23. Singleton, V.L.; Rossi, J. A colorimetry of total phenolics with phosphomolybdic-phosphotungstic acid reagents. Am. J. Enol. Vitic. 1965, 16, 144–158. [Google Scholar] [CrossRef]
  24. Castillejo, N.; Martínez-Zamora, L.; Artés-Hernández, F. Postharvest UV radiation enhanced biosynthesis of flavonoids and carotenes in bell peppers. Postharvest Biol. Technol. 2022, 184, 111774. [Google Scholar] [CrossRef]
  25. Nenadis, N.; Lazaridou, O.; Tsimidou, M.Z. Use of reference compounds in antioxidant activity assessment. J. Agric. Food Chem. 2007, 55, 5452–5460. [Google Scholar] [CrossRef] [PubMed]
  26. Salas-Millán, J.Á.; Aznar, A.; Conesa, E.; Conesa-Bueno, A.; Aguayo, E. Functional food obtained from fermentation of broccoli by-products (stalk): Metagenomics profile and glucosinolate and phenolic compounds characterization by LC-ESI-QqQ-MS/MS. LWT 2022, 169, 113915. [Google Scholar] [CrossRef]
  27. Guimarães, R.; Barros, L.; Barreira, J.C.M.; Sousa, M.J.; Carvalho, A.M.; Ferreira, I.C.F.R. Targeting excessive free radicals with peels and juices of citrus fruits: Grapefruit, lemon, lime and orange. Food Chem. Toxicol. 2010, 48, 99–106. [Google Scholar] [CrossRef] [PubMed]
  28. Pretsch, E.; Bühlmann, P.; Affolter, C. IR spectroscopy. In Structure Determination of Organic Compounds; Springer: Berlin, Germany, 2009. [Google Scholar]
  29. Sanches, V.L.; Cunha, T.A.; Viganó, J.; de Souza Mesquita, L.M.; Faccioli, L.H.; Breitkreitz, M.C.; Rostagno, M.A. Comprehensive analysis of phenolics compounds in citrus fruits peels by UPLC-PDA and UPLC-Q/TOF MS using a fused-core column. Food Chem. X 2022, 14, 100262. [Google Scholar] [CrossRef]
  30. Li, P.; Yao, X.; Zhou, Q.; Meng, X.; Zhou, T.; Gu, Q. Citrus peel flavonoid extracts: Health-beneficial bioactivities and regulation of intestinal microecology in vitro. Front. Nutr. 2022, 9, 888745. [Google Scholar] [CrossRef]
Figure 1. Total phenolic content of lemon, orange, and grapefruit peels. Different letters indicate significant differences (p < 0.05).
Blsf 40 00026 g001
Figure 2. ATR-FTIR average spectra (n = 5) of lemon, orange, and grapefruit freeze-dried peels, between 400 and 1775 cm−1 and 2700 and 3600 cm−1 spectral ranges.
Blsf 40 00026 g002
Figure 3. Full-scan chromatograms of lemon, orange, and grapefruit peel using HPLC-MS (ESI-QqQ) in a negative ionization mode with the m/z of certain peaks indicated and their tentative identification.
Blsf 40 00026 g003
Figure 4. The 3D score plot of the citrus fruit peel samples based on their FTIR spectra.
Blsf 40 00026 g004
Figure 5. (a) The 2D score plot and (b) 2D loadings plot of the citrus peels both based on the combination of all measured variables: CIELab color, TPC, FTIR absorbance, and the content of individual compounds.
Blsf 40 00026 g005
Table 1. Color in the CIELab system of freeze-dried citrus peels of orange (Citrus sinensis), grapefruit (Citrus paradisi), and lemon (Citrus limon).
Citrus SpeciesL*a*b*
C. limon86.6 ± 1.3 a0.3 ± 0.3 b23.8 ± 1.7 c
C. sinensis82.8 ± 1.0 b1.8 ± 0.2 b45.2 ± 1.6 a
C. paradisi82.4 ± 0.7 b5.1 ± 0.4 a39.3 ± 1.8 b
Means (n = 5 ± SD). Different letters denote significant differences (p < 0.05) among citrus species.
Table 2. Individual phenolic compounds content (g kg−1 dw) in lemon (Citrus limon), orange (Citrus sinensis), and grapefruit (Citrus paradisi) peels.
Compounds (g kg−1 dw)LemonOrangeGrapefruit
Citric acid7.9 ± 0.6 a0.095 ± 0.009 c3.72 ± 0.10 b
Eriocitrin5.1 ± 0.5 a0.075 ± 0.002 b0.104 ± 0.003 b
Limocitrin–HMG–Glu0.25 ± 0.02ndnd
Acetyl naringeninndnd0.018 ± 0.001
Hesperidin5.5 ± 0.3 a8.9 ± 0.2 b0.32 ± 0.03 c
Rutin0.15 ± 0.020.078 ± 0.0020.118 ± 0.005
Diosmin1.7 ± 0.3 a0.27 ± 0.03 b0.24 ± 0.02 b
Poncirinndnd0.081 ± 0.006
Didymin1.0 ± 0.1 b1.15 ± 0.05 b3.75 ± 0.08 a
Naringin0.017 ± 0.005 c0.81 ± 0.03 b11.3 ± 0.4 a
Narirutin0.25 ± 0.03 c3.6 ± 0.1 b13.1 ± 0.3 a
Quercetin0.021 ± 0.0070.073 ± 0.004nd
Means (n = 5 ± SD). Nd: non-detectable. Different letters denote significant differences (p < 0.05) among citrus peels.
Disclaimer/Publisher’s Note: The statements, opinions and data contained in all publications are solely those of the individual author(s) and contributor(s) and not of MDPI and/or the editor(s). MDPI and/or the editor(s) disclaim responsibility for any injury to people or property resulting from any ideas, methods, instructions or products referred to in the content.

