Proceeding Paper

Exploring Peruvian Cocoa Populations and Their Influence on Rat Metabolism †

by
Malén Massot-Cladera
1,2,
Raquel García-Valdera
3,
Daniela Gálvez-González
3,
María J. Rodríguez-Lagunas
1,2,
Francisco J. Pérez-Cano
1,2,
Ivan Best
4 and
Margarida Castell
1,2,5,*
1
Section of Physiology, Department of Biochemistry and Physiology, Faculty of Pharmacy and Food Science, University of Barcelona (UB), 08028 Barcelona, Spain
2
Nutrition and Food Safety Research Institute (INSA-UB), 08921 Santa Coloma de Gramenet, Spain
3
Facultad de Ingeniería, Universidad San Ignacio de Loyola (USIL), Lima 15024, Peru
4
Instituto de Ciencias de los Alimentos y Nutrición, Universidad San Ignacio de Loyola (USIL), Lima 15024, Peru
5
Centro de Investigación Biomédica en Red de Fisiopatología de la Obesidad y la Nutrición (CIBEROBN), Instituto de Salud Carlos III, 28029 Madrid, Spain
*
Author to whom correspondence should be addressed.
Presented at the 3rd International Electronic Conference on Nutrients, 1–15 November 2023; Available online: https://iecn2023.sciforum.net/.
Biol. Life Sci. Forum 2023, 29(1), 8; https://doi.org/10.3390/IECN2023-15792
Published: 1 November 2023
(This article belongs to the Proceedings of The 3rd International Electronic Conference on Nutrients)

Abstract

:
This study aimed to characterize two Peruvian cocoa populations (CCN51 and JL2) and determine their influence on rat metabolism. For this, the phytochemical composition and in vitro antioxidant activity of CCN51 and JL2 were established. Furthermore, Wistar rats were fed with either CCN51-, JL2-enriched or standard diets for 4 weeks. At the end, an oral glucose tolerance test was carried out. Moreover, visceral adiposity index and fecal pH were measured. The JL2 cocoa showed the highest content of total polyphenols, catechin and epigallocatechin-3-gallate as well as the highest in vitro antioxidant activity. No significant differences were observed in glycemia among the three experimental groups, but both cocoa-fed groups showed lower visceral adiposity than the standard diet-fed animals. Lower fecal pH was observed after both cocoa diets. In conclusion, two Peruvian cocoa populations with different polyphenol compositions induced similar effects on rat metabolism when administered as 10% of the diet for 4 weeks.

1. Introduction

Type 2 diabetes mellitus (T2DM) is a chronic metabolic disease that represents a significant public health problem due to its rising prevalence and incidence [1]. The current therapeutic approach for its treatment relies on pharmaceuticals, but lifestyle changes (diet and physical exercise) are the most promising strategies for preventing or delaying the onset of T2DM. Consequently, the identification of dietary components with potential antidiabetic effects has become essential in the search for alternative or adjunct treatments for this disease [2]. In this context, flavonoids are gaining interest for their potential metabolism benefits [3].

2. Material and Methods

2.1. Cocoa Population Characterization

Two cocoa pastes made with beans from the “Chuncho” Peruvian cocoa populations from the Cusco region were used: JL2 and VRAE99. In addition, the CCN51 ordinary cocoa paste from the same area was used as a reference.
Polyphenol quantification was carried out by high-performance liquid chromatography with diode-array detection (HPLC-DAD), and the in vitro antioxidant capacity was established by the α,α-diphenyl-β-picrylhydrazyl (DPPH) radical scavenging assay. Determinations were performed in triplicate, beginning with 100% pure cocoa paste.

2.2. In Vivo Study

According to their polyphenol content and antioxidant activity, the JL2 cocoa population was selected to evaluate its effects on rat metabolism in an in vivo study. The ordinary CCN51 cocoa paste was also included to be considered as the reference cocoa.

2.2.1. Diets and Animals

Three different diets were used: a standard diet based on the AIN-93M diet (Envigo, Indianapolis, IN, USA) and two diets in which 90% of powdered AIN-93M was mixed with 10% of cocoa paste (CCN51 or JL2), previously pulverized. The mixture was pelletized and subsequently dried in 40 °C oven for 48 h. The pellet diet was stored at 4 °C until used (maximum 7 days later).
Female Wistar rats (5 weeks old at arrival, n = 24) were obtained from Janvier Labs (Saint-Berthevin, France) and housed (2 rats per cage) at the Animal Experimentation Unit (UEA) in the Diagonal Campus of the Faculty of Pharmacy and Food Science (University of Barcelona) in polycarbonate cages containing bedding of large fibrous particles (Souralit 1035, Bobadeb S.L., Santo Domingo de la Calzada, Spain) under controlled conditions of temperature and humidity and in a 12:12h light/dark cycle. The animals were randomly distributed into three groups (n = 8 animals/each): the reference group (REF), which was fed with the standard diet; the CCN51 group, which was fed the diet enriched with CCN51 cocoa; and the JL2 group, in which animals were fed the diet enriched with JL2 cocoa. Food and water were administered ad libitum and their intake was monitored three times per week throughout the study.
All animal procedures were conducted in accordance with the institutional guidelines for the Care and Use of Laboratory Animals (EU-Directive 2010/63/UE).

2.2.2. Oral Glucose Tolerance Test

After 26 days of diet, rats were fasted for 6 h with no access to food but with access to water. Then, a glucose solution (2 g/kg body weight) was orally administered. Blood samples were obtained from the femoral vein at 0, 15, 30, 60, 90, and 120 min, and blood glucose levels were determined using a glucometer (Adia, Brussels, Belgium).

2.2.3. Sample Collection and Processing

After four weeks of nutritional intervention, the visceral fat from the right half of the body was excised and immediately weighed. Moreover, the pH of fecal samples obtained at the end of the study was measured using a surface electrode (Crison Instruments, S.A., Barcelona, Spain). The water content of fecal samples at the end of the study was also measured.

2.3. Statistical Analysis

The Student-t test was used for statistical analysis. Significant differences were established at p < 0.05.

3. Results and Discussion

3.1. Peruvian Cocoa Composition

The content of total phenolics, total flavonoids, catechin and epicatechin differed between the three cocoa samples (Table 1). In particular, JL2 was the cocoa population with the highest content of catechin compared to both CCN51 and VRAE99 cocoas (p < 0.05). The content of total phenolics was also higher in JL2 compared to the CCN51 population (p < 0.05) as well as the total flavonoid measured as catechin equivalents compared to the VRAE99 population (p < 0.05). The epicatechin content also differed, with CCN51 having the highest content followed by VRAE99 (p < 0.05).
With regards to the antioxidant capacity (Table 1), JL2 cocoa had the highest capacity compared to CCN51 and VRAE99 (p < 0.05), which showed similar antioxidant capacities.

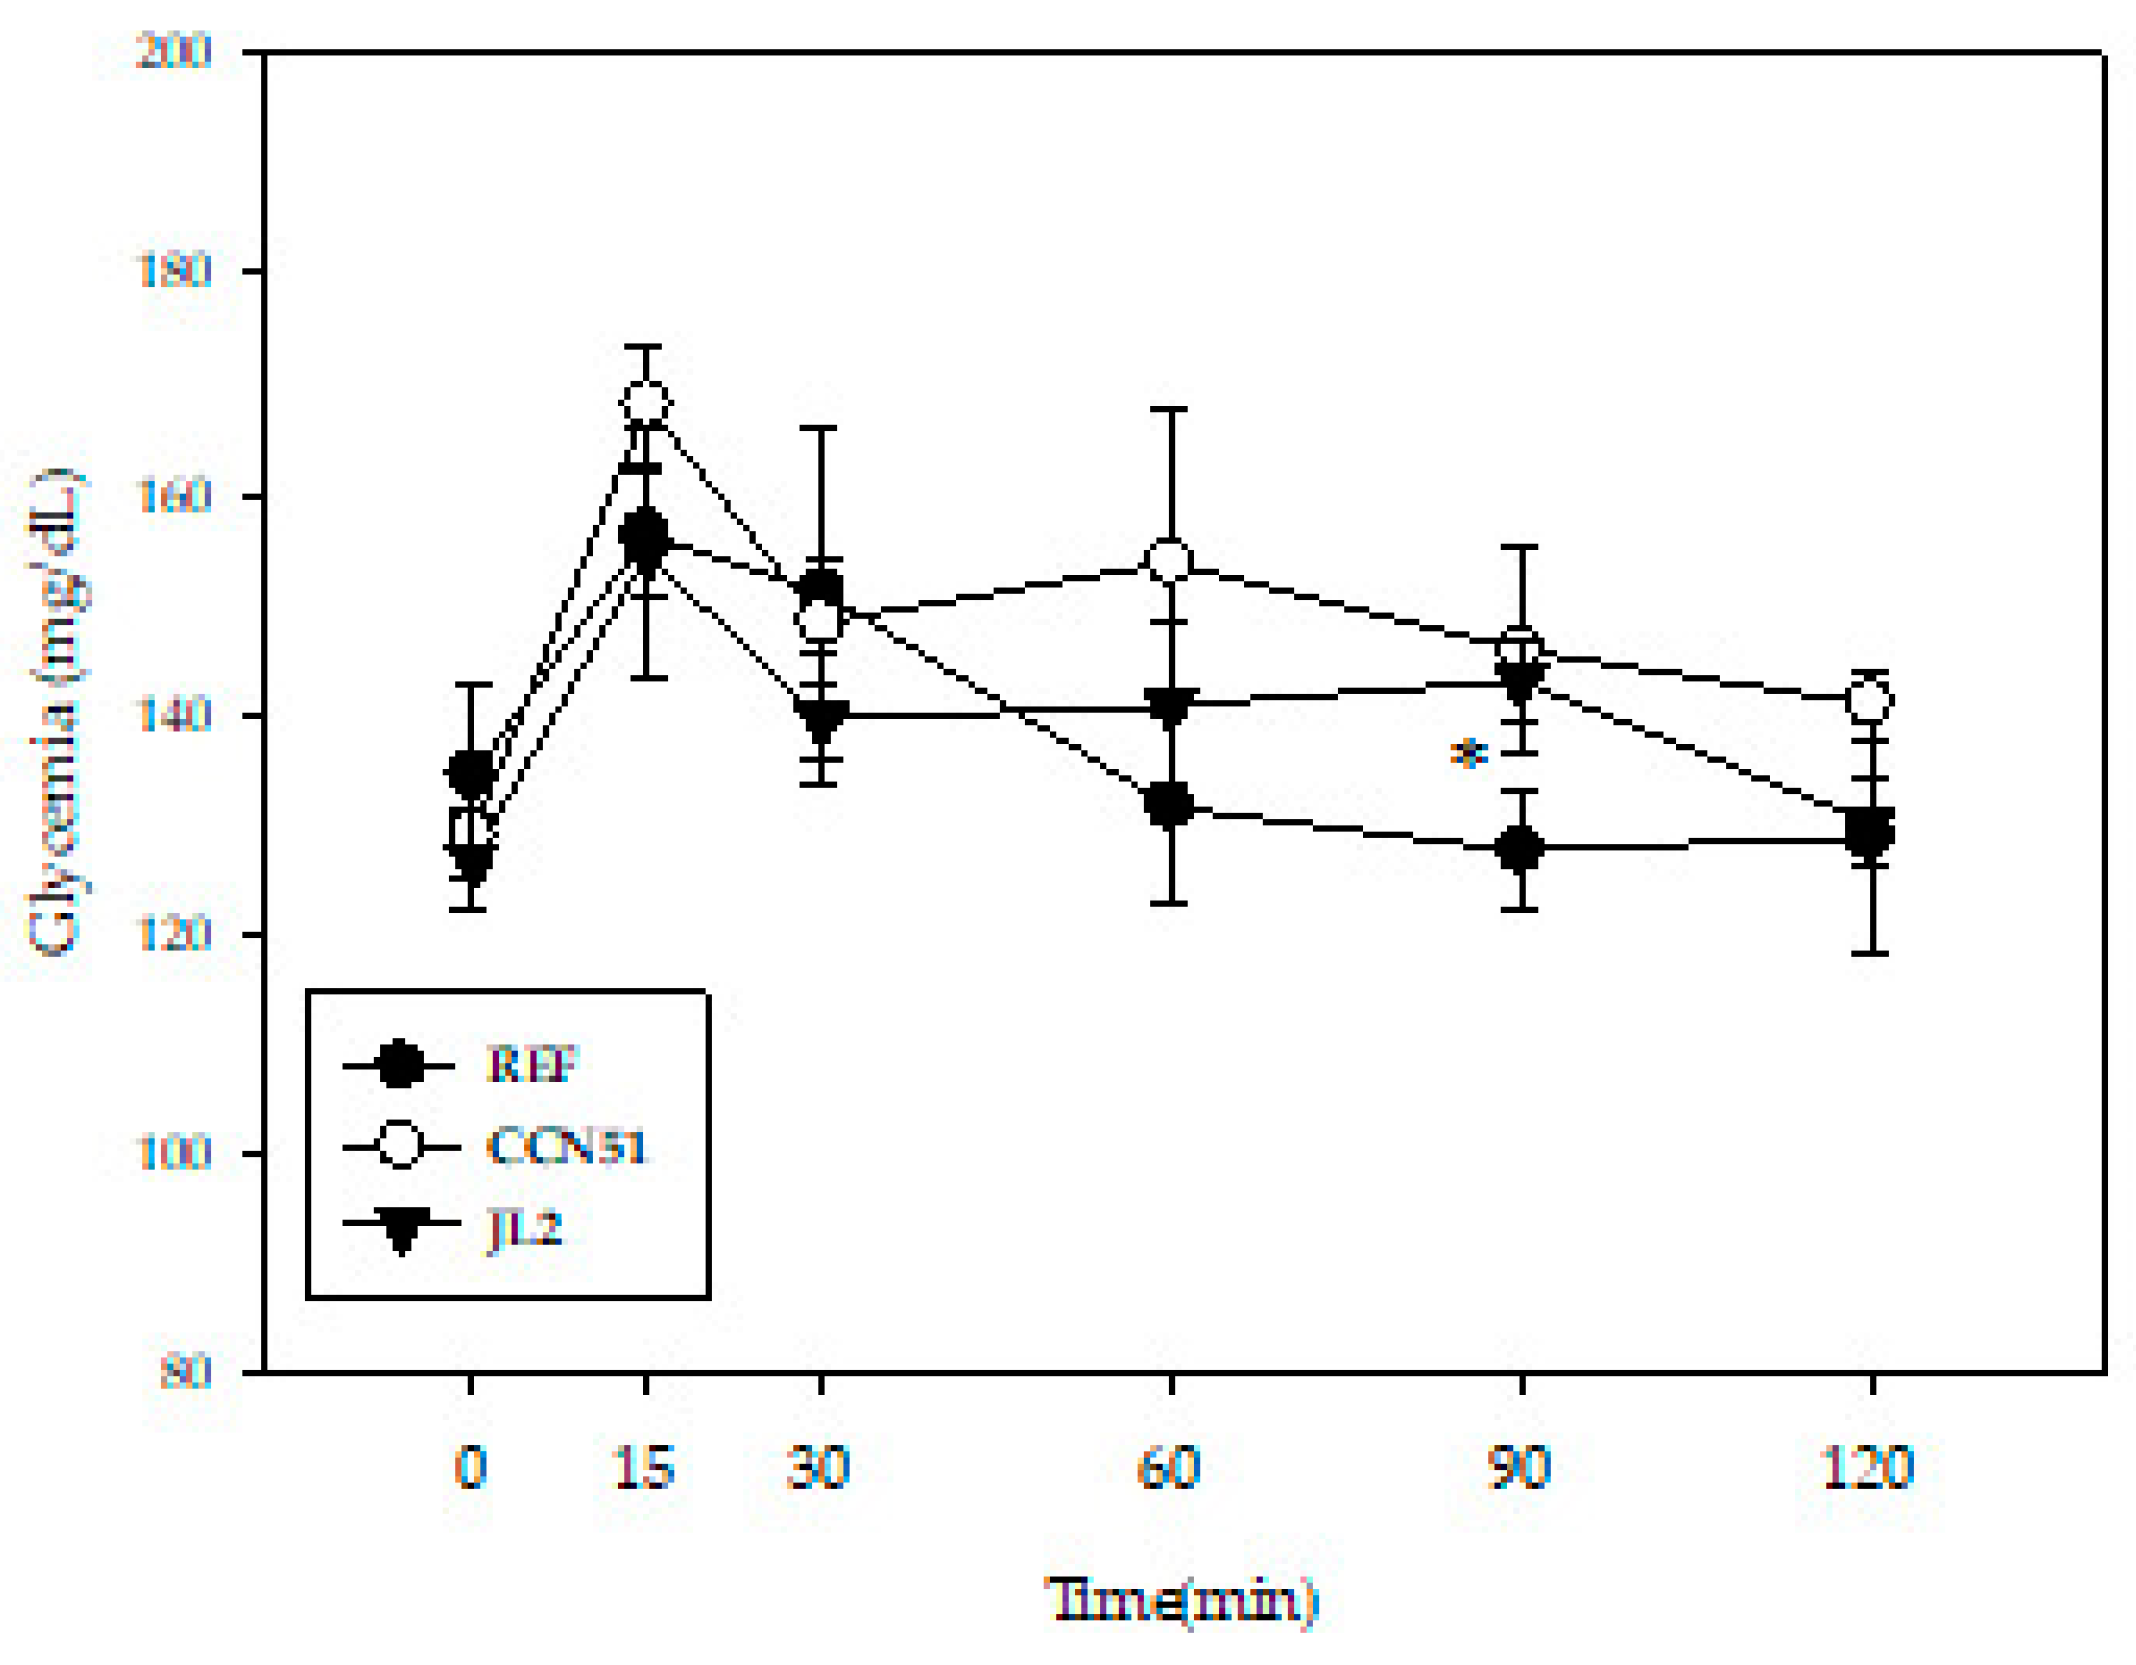
3.2. Effect of Peruvian Cocoa Populations on Glucose Tolerance Test

After a 6 h fasting period, a glucose tolerance test was performed (Figure 1). At 15 min after glucose administration, an increase in blood glucose levels was observed in all experimental groups with no differences among them. The values gradually returned to baseline. At 90 min, the animals that were fed the JL2 diet exhibited higher blood glucose levels compared to the REF group (p < 0.05), which normalized after 2 h with no differences between the groups.

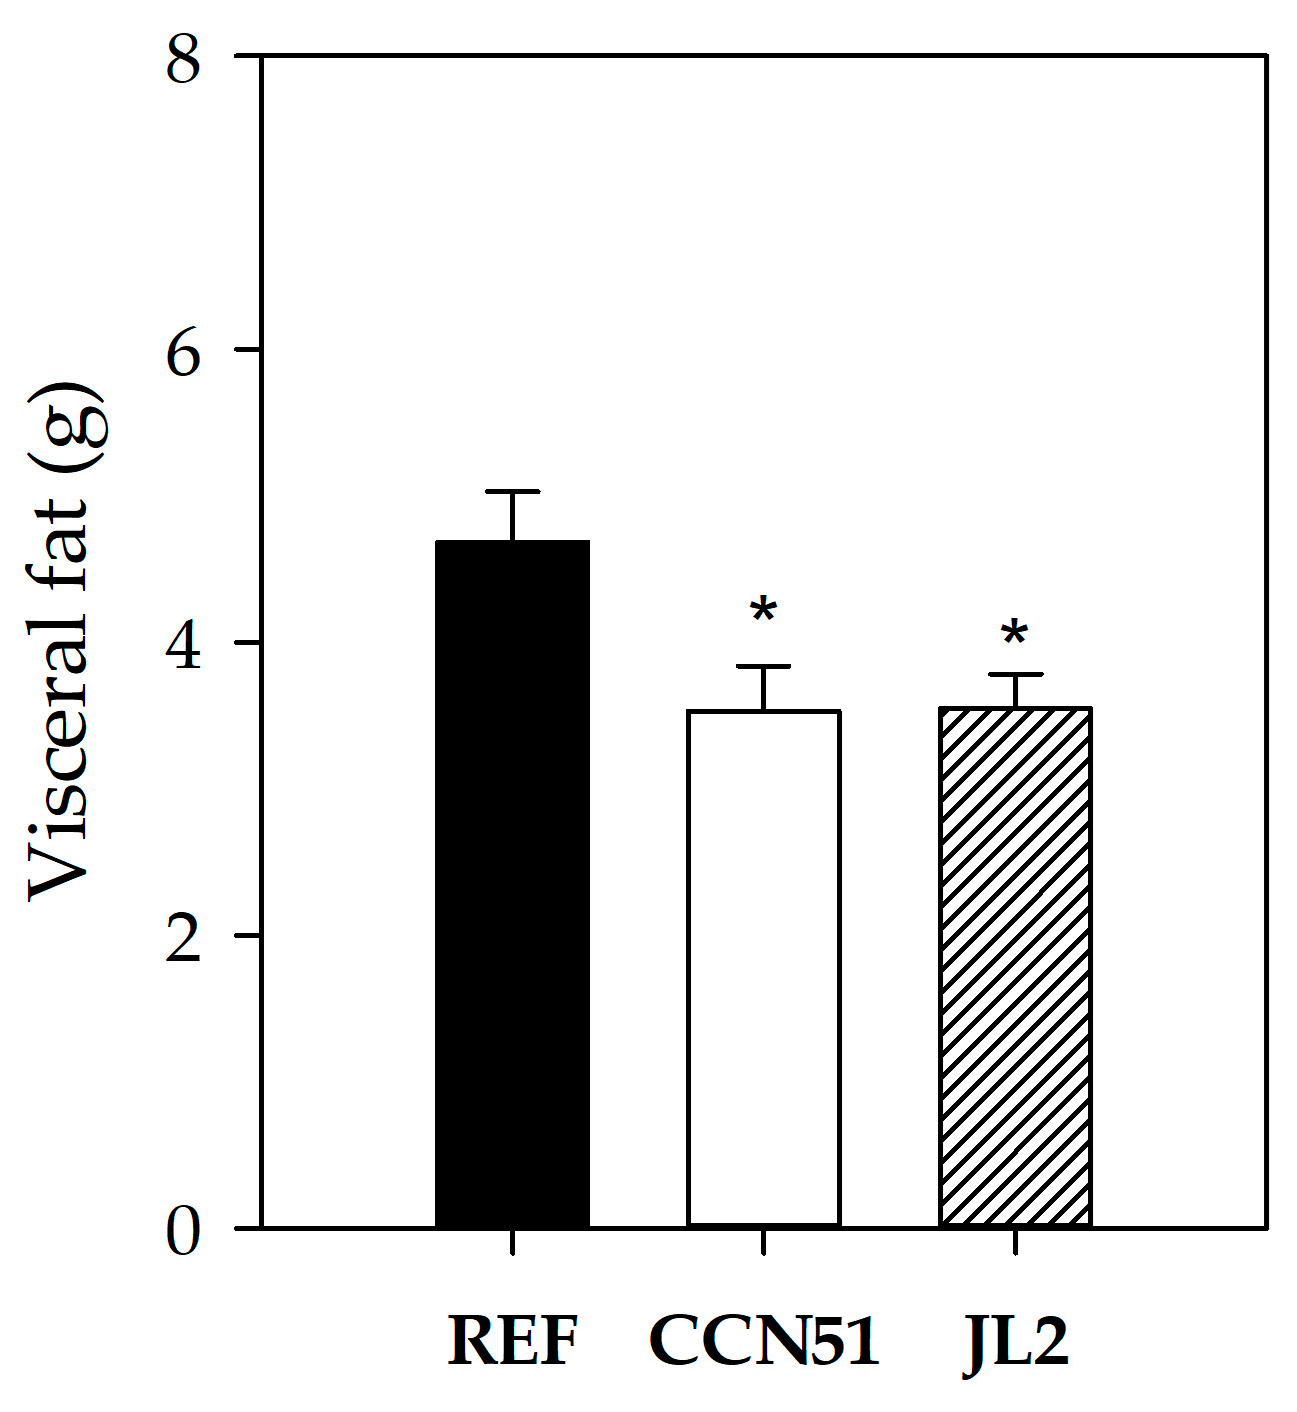
3.3. Effect of Peruvian Cocoa Populations on Body and Organ Weight

Cocoa-enriched diets did not influence the body weight increase (49.4 ± 1.64 g among all groups). However, the intake of both cocoa populations resulted in a lower visceral adiposity at the end of the study (p < 0.05) (Figure 2). The reduction in visceral adiposity is in line with that reported in adolescents who followed a flavonoid-enriched diet derived from cocoa-based products [4]. Moreover, the flavonoid-enriched diet from conventional cocoa has also been evidenced to downregulate the expression of genes involved in lipid metabolism in colonic samples [5] and to reduce fat deposition [6]. Likewise, anti-obesity activity has also been attributed to cocoa due to their impact on the expression of genes related to lipid metabolism in white adipose tissue [7]. Therefore, further research should be performed in order to identify the compounds responsible for these effects and to elucidate the mechanisms involved.

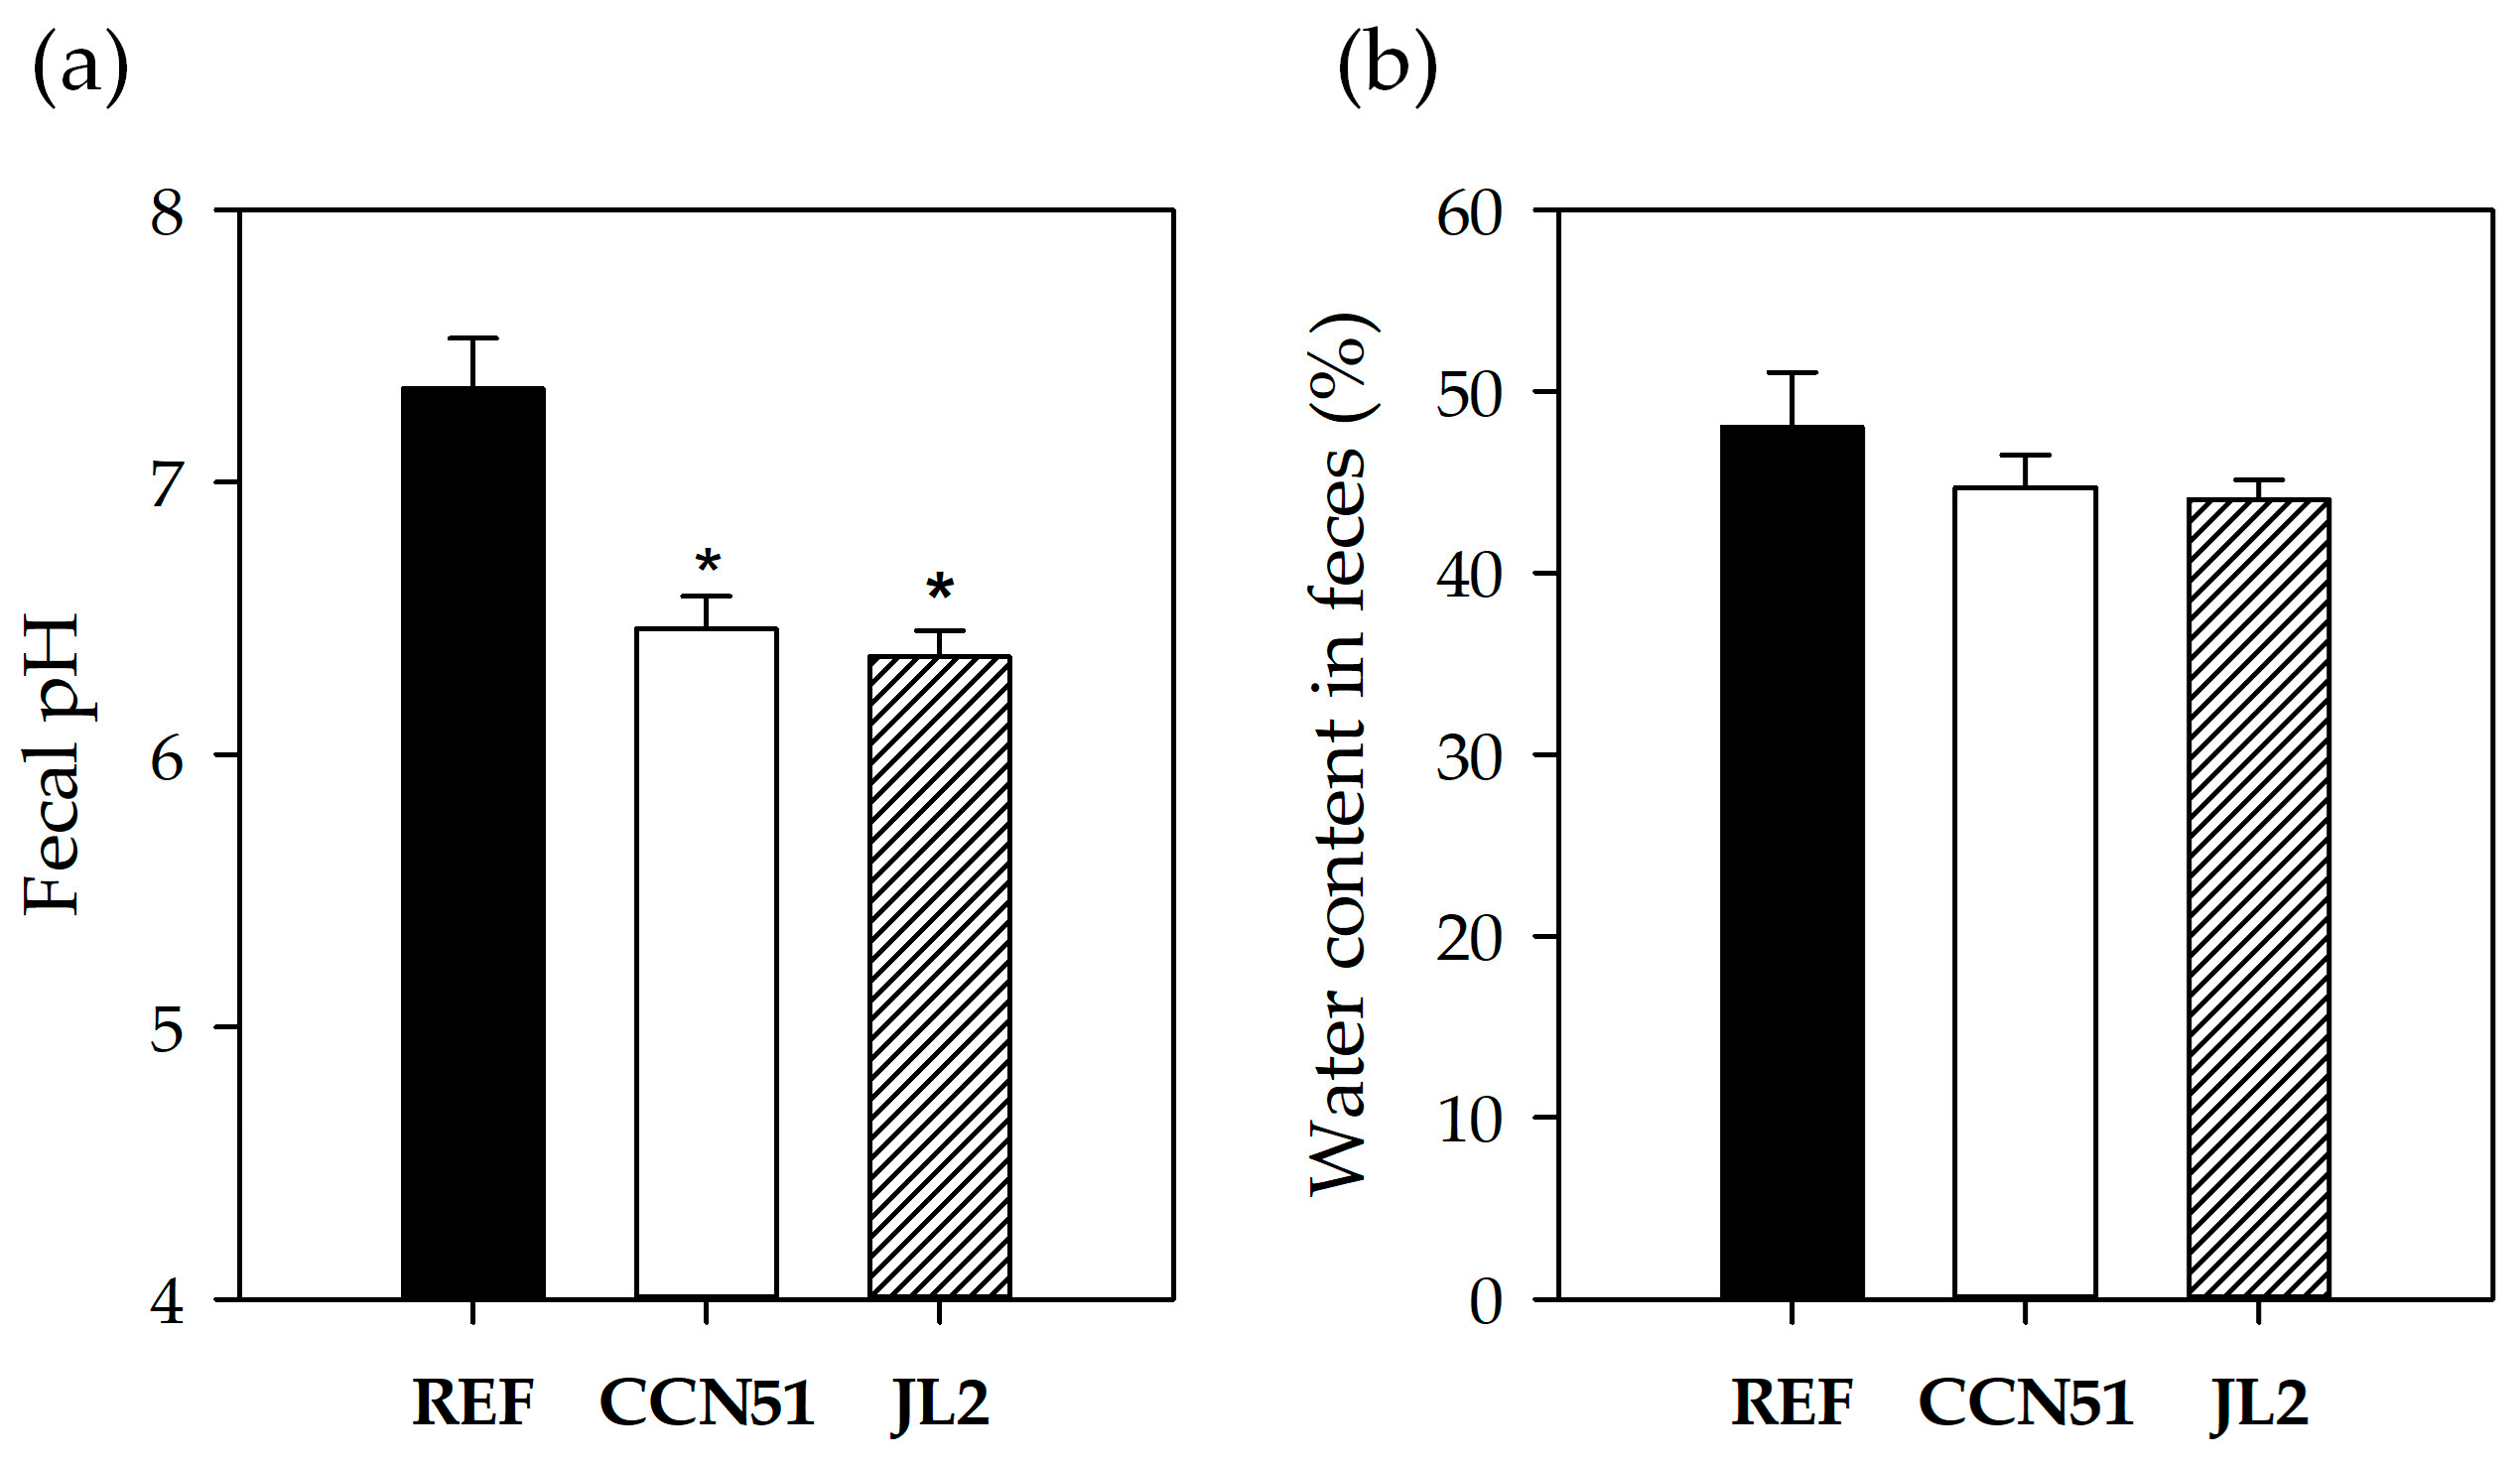
3.4. Fecal Variables

Fecal pH and water content were measured (Figure 3). We found that the consumption of cocoa-enriched diets (CCN51 and JL2) acidified the fecal samples compared to those obtained from the REF group (p < 0.05) (Figure 3a). No differences were observed between the two experimental diets. Similar acidification of fecal and cecal samples was also observed in young rats fed a 10% standard cocoa-enriched diet for three weeks. In fact, this effect has been linked to the enhancement of beneficial bacteria growth, which was closely related to the concentration of short-chain fatty acids [8,9,10]. Additionally, the shaping of microbiota by cocoa polyphenols has also been reported to affect fat index by causing the modulation of the ratio of the two main phyla (Firmicutes and Bacteroidetes), which has been associated with obesity [11].
Regarding the fecal water content, no differences were observed due to the nutritional intervention; however, CCN51 and JL2 cocoa pastes showed a tendency to reduce their percentage compared to the REF group (Figure 3b).

4. Conclusions

From the “Chuncho” Peruvian cocoa populations used here, JL2 was the cocoa with the highest content of polyphenols and the highest antioxidant activity. However, the intake of diets containing 10% of CCN51 or JL2 cocoa produced the same effects on glycemia, visceral fat and fecal variables in young Wistar rats.

Author Contributions

Funding acquisition, I.B.; conceptualization and design of the project, I.B., M.C. and F.J.P.-C.; methodology, R.G.-V., D.G.-G., M.M.-C., M.J.R.-L., F.J.P.-C. and M.C.; writing—original draft preparation, M.M.-C., writing—review and editing, M.J.R.-L., F.J.P.-C. and M.C. All authors have read and agreed to the published version of the manuscript.

Funding

This research was funded by Fondo Especial USIL (Ref 2022-02) and the INSA Maria de Maeztu Unit of Excellence, grant (CEX2021-001234-M) by MICIN/AEI/FEDER, UE.

Institutional Review Board Statement

The animal study protocol was approved by the Ethical Committee for Animal Experimentation of the University of Barcelona and the Catalan Government (CEEA/UB ref. 517/18 P2 and DAAM 10615, respectively), in full compliance with national legislation following the EU Directive 2010/63/EU for the protection of animals used for scientific purposes.

Informed Consent Statement

Not applicable.

Data Availability Statement

The data presented in this study are available on request from the corresponding author.

Acknowledgments

The authors would like to thank Omar Danilo Ortiz and Leticia Orozco-Arguelles for their technical assistance.

Conflicts of Interest

The authors declare no conflict of interest.

References

  1. Ramos, W.; López, T.; Revilla, L.; More, L.; Huamaní, M.; Pozo, M. Results of the Epidemiological Surveillance of Diabtes Mellitus in Hospitals in Peru, 2012. Rev. Peru. Med. Exp. Salud Pública 2014, 34, 680–687. [Google Scholar]
  2. Ahman, N.; Amr, A. The Effect of Defatted Cocoa Powder on Cholesterol-Induced Changes of Serum Lipids in Rats. Nutr. Hosp. 2022, 39, 537–546. [Google Scholar]
  3. Ramos, S.; Martín, M.A.; Goya, L. Effects of Cocoa Antioxidants in Type 2 Diabetes Mellitus. Antioxidants 2017, 6, 84. [Google Scholar] [CrossRef] [PubMed]
  4. Laveriano-Santos, E.P.; Arancibia-Riveros, C.; Tresserra-Rimbau, A.; Castro-Barquero, S.; Ruiz-León, A.M.; Estruch, R.; Casas, R.; Bodega, P.; de Miguel, M.; de Cos-Gandoy, A.; et al. Flavonoid Intake From Cocoa-Based Products and Adiposity Parameters in Adolescents in Spain. Front. Nutr. 2022, 9, 931171. [Google Scholar] [CrossRef] [PubMed]
  5. Massot-Cladera, M.; Franch, À.; Castell, M.; Pérez-Cano, F.J. Cocoa Polyphenols and Fiber Modify Colonic Gene Expression in Rats. Eur. J. Nutr. 2017, 56, 1871–1885. [Google Scholar] [CrossRef] [PubMed]
  6. Ali, F.; Ismail, A.; Esa, N.M.; Pei, C.P.; Kersten, S. Hepatic Genome-Wide Expression of Lipid Metabolism in Diet-Induced Obesity Rats Treated with Cocoa Polyphenols. J. Funct. Foods 2015, 17, 969–978. [Google Scholar] [CrossRef]
  7. Coronado-Cáceres, L.J.; Rabadán-Chávez, G.; Quevedo-Corona, L.; Hernández-Ledesma, B.; Garcia, A.M.; Mojica, L.; Lugo-Cervantes, E. Anti-Obesity Effect of Cocoa Proteins (Theobroma cacao L.) Variety “Criollo” and the Expression of Genes Related to the Dysfunction of White Adipose Tissue in High-Fat Diet-Induced Obese Rats. J. Funct. Foods 2019, 62, 103519. [Google Scholar] [CrossRef]
  8. Massot-Cladera, M.; Costabile, A.; Childs, C.E.; Yaqoob, P.; Franch, À.; Castell, M.; Pérez-Cano, F.J. Prebiotic Effects of Cocoa Fibre on Rats. J. Funct. Foods 2015, 19, 341–352. [Google Scholar] [CrossRef]
  9. Tzounis, X.; Rodriguez-Mateos, A.; Vulevic, J.; Gibson, G.R.; Kwik-Uribe, C.; Spencer, J.P.E. Prebiotic Evaluation of Cocoa-Derived Flavanols in Healthy Humans by Using a Randomized, Controlled, Double-Blind, Crossover Intervention Study. Am. J. Clin. Nutr. 2011, 93, 62–72. [Google Scholar] [CrossRef] [PubMed]
  10. Sorrenti, V.; Ali, S.; Mancin, L.; Davinelli, S.; Paoli, A.; Scapagnini, G. Cocoa Polyphenols and Gut Microbiota Interplay: Bioavailability, Prebiotic Effect and Impact on Human Health. Nutrients 2020, 12, 1908. [Google Scholar] [CrossRef] [PubMed]
  11. Sanz, Y.; Rastmanesh, R.; Agostonic, C. Understanding the Role of Gut Microbes and Probiotics in Obesity: How Far Are We? Pharmacol. Res. 2013, 69, 144–155. [Google Scholar] [CrossRef] [PubMed]
Figure 1. Glucose tolerance test. Results are expressed as mean ± SEM (n = 8/group). Statistical differences: * p < 0.05 vs. REF.
Blsf 29 00008 g001
Figure 2. Visceral fat weight (g) at the end of the nutritional intervention for all experimental groups. Results are expressed as mean ± SEM (n = 8/group). Statistical differences: * p < 0.05 vs. REF.
Blsf 29 00008 g002
Figure 3. (a) pH and (b) water content in feces at the end of the nutritional intervention for all experimental groups. Results are expressed as mean ± SEM (n = 8/group). Statistical differences: * p < 0.05 vs. REF.
Blsf 29 00008 g003
Table 1. Content of total polyphenols and flavonoids and antioxidant capacity in the cocoa populations considered in the study. Results are expressed as mean ± standard error of the mean from the three independent experiments. Values not sharing letters denote significant differences between populations (p < 0.05), while values sharing the same letter did not differ.
CCN51JL2 VRAE99
Total phenolics
(mg GA equivalents/g)
62.31 ± 7.50 a106.62 ± 6.55 b85.47 ± 1.12 ab
Total flavonoid
(mg catechin equivalents/g)
18.95 ± 0.08 a19.050 ± 0.71 a15.70 ± 0.08 b
Catechin
(mg/g)
0.41 ± 0.067 a0.63 ± 0.004 b0.44 ± 0.001 a
Epicatechin
(mg/g)
0.99 ± 0.001 a0.91 ± 0.008 b0.94 ± 0.002 c
IC50 values of DPPH assay
(µM)
127.56 ± 2.58 a106.85 ± 7.19 b129.53 ± 0.75 a
Disclaimer/Publisher’s Note: The statements, opinions and data contained in all publications are solely those of the individual author(s) and contributor(s) and not of MDPI and/or the editor(s). MDPI and/or the editor(s) disclaim responsibility for any injury to people or property resulting from any ideas, methods, instructions or products referred to in the content.

