Proceeding Paper

Impact of Colonic Fermentation of Plant Sterol-Enriched Rye Bread on Gut Microbiota and Metabolites †

by
Nerea Faubel
,
Virginia Blanco-Morales
,
Reyes Barberá
and
Guadalupe Garcia-Llatas
*
Nutrition and Food Science Area, University of Valencia, 46100 Valencia, Spain
*
Author to whom correspondence should be addressed.
Presented at the 4th International Electronic Conference on Foods, 15–30 October 2023; Available online: https://foods2023.sciforum.net/.
Biol. Life Sci. Forum 2023, 26(1), 87; https://doi.org/10.3390/Foods2023-15012
Published: 13 October 2023
(This article belongs to the Proceedings of The 4th International Electronic Conference on Foods)

Abstract

:
Studies on the impact of colonic fermentation of plant sterol (PS)-enriched foods using dynamic in vitro models are limited. This study aimed to evaluate the effect of a 72-h dynamic in vitro digestion-colonic fermentation (using the simgi® system) of PS-enriched rye bread on colonic microbial population and short-chain fatty acid (SCFA) and ammonium production. In all colon compartments (ascending colon (AC), transverse colon (TC), and descending colon (DC)) (72 vs. 0 h), a reduction in ammonium concentration (5.7- to 9.4-fold) and an increase in Staphylococcus spp. (1.4- to 2.1-fold), Lactobacillus spp. (1.5-fold), Bifidobacterium spp. (1.3- to 1.5-fold), and Enterococcus spp. (1.4- to 1.6-fold) were observed. In AC and TC, total SCFA decreased (4- and 1.3-fold, respectively), whereas it increased 1.4-fold in DC due to an increase in butyrate content from 4 to 45 mM. These results suggest that PS-enriched rye bread favors the growth of beneficial microbial species and the production of butyrate, a fuel source for enterocytes, thus promoting health benefits.

1. Introduction

Diet is known to modify the gut microbiota, potentially influencing the host’s health through shifts in microbiota composition, diversity, and richness [1]. Wholemeal rye bread is an excellent source of fiber (arabinoxylan, fructan, cellulose, and β-glucan) [2] that can be fermented by the microbiota producing metabolites like short-chain fatty acids (SCFA, such as acetate, propionate, and butyrate). These metabolites play crucial roles in promoting gut integrity and regulating glucose homeostasis, lipid metabolism, appetite, immune system, and inflammatory response [3]. Fiber-rich food (such as wholemeal rye bread with 15.3 g of fiber/100 g of bread [4]) selectively promotes the growth of Bifidobacterium, a specific acetate- and butyrate-producing bacteria [5], as well as Lactobacillus [6].
Regarding plant sterols (PS), their efficacy as a cholesterol-lowering agent (reducing plasma cholesterol concentrations up to 12% with a daily intake of 1.5 to 3 g) [7] is well known, as well as their antiproliferative, anti-inflammatory, antioxidant, and antidiabetic properties [8]. Although there is a lack of research on the metabolism of these bioactive compounds by microbiota due to their limited absorption rate (ranging from 4 to 16%), PS reach the colon, where they become susceptible to the microbiota’s influence, ultimately affecting metabolites such as SCFA or ammonium [9].
Therefore, for the first time, this study aims to evaluate the effect of dynamic in vitro digestion and colonic fermentation of PS-enriched wholemeal rye bread (PS-WRB) on changes in the colonic microbial population and SCFA and ammonium production.

2. Materials and Methods

2.1. Sample and Oral Phase Digestion

The PS-WRB optimized baking procedure and the chemical composition (% w/w, dry basis) are as stated in Makran et al. [4] (protein: 7.8 ± 0.1; ash: 2.0 ± 0.1; lipid: 4.7 ± 0.2; carbohydrate: 65.2 ± 0.6; insoluble fiber: 15.2 ± 1.8; soluble fiber: 5.1 ± 0.2). For the human oral phase, three portions of PS-WRB (81.45 ± 1.14 g) were chewed as described in Faubel et al. [10] to obtain the respective oral bolus. The optimum ratio for in vitro digestion was determined to be 1:1 (w/w) or a 100% increase in the bolus, and the oral bolus should not be thicker than tomato or mustard paste [11].

2.2. Dynamic In Vitro Colonic Fermentation

The simgi® system (CIAL, CSIC-UAM, Madrid, Spain) was used for dynamic gastrointestinal digestion and colonic fermentation [12] with modifications. This system includes five compartments (stomach, small intestine, ascending colon (AC), transverse colon (TC), and descending colon (DC)) with a constant 37 °C temperature and controlled enzyme and NaOH/HCl flow to maintain the pH at each stage (Stomach: 1.8; small intestine: 7; AC: 5.6; TC: 6.3; DC: 6.8). Gastric digestion was performed for each oral bolus in a reactor without peristaltic movements and once finished, manually emptied into the small intestine due to the high viscosity of the sample generated by the bread’s fiber content (15.3 g/100 g bread). Enzymes and pH solutions were added progressively. The intestinal and colonic compartments were connected by pipes, and the peristaltic valve pumps were automated. Pepsin (2000 U/mL, 15 mL in 150 mM NaCl) initiated the gastric phase. The small intestine phase used pancreatic juice (40 mL, including pancreatin (0.9 g/L) and Oxgall dehydrated fresh bile (6 g/L)). AC, TC, and DC were filled with a nutrition medium (250, 400, and 300 mL, respectively). A fecal sample from a healthy donor meeting specific criteria was used for inoculating colonic compartments with 20 mL of diluted fecal sample (20%, w/v) in a sodium phosphate buffer (0.1 M, pH 7) with 1 g/L of sodium thioglycolate. The transfer between colonic compartments was 145 mL at 5 mL/min.
After a 9-day stabilization period, the AC of the simgi® was fed 145 mL of gastrointestinal digesta (equivalent to 40 g of PS-WRB providing 1.3 g PS per day) at a flow rate of 5 mL/min in the first 8 h. Another 145 mL of gastrointestinal digesta was incorporated into the AC at the same flow rate, and in the last 8 h, 145 mL of nutritive medium was added. This process was performed for 3 days to simulate daily 80 g PS-WRB intake through the AC, TC, and DC. Fermentation liquids were collected at specific time points and stored at −20 °C for further analysis.

2.3. Plate Count and Determination of SCFA and Ammonium Ion

Microbiota composition analysis and SCFA and ammonium ion determination were conducted as described by Tamargo et al. [12].
Plate counts were performed on general and selective media after serial dilutions of fermentation liquids in sterile saline (NaCl 0.9%). Spot seeding (10 μL in triplicate) of each dilution was performed on selected media: Enterococcus agar (Enterococcus spp.), BBL CHROMAgar (Staphylococcus spp.), Bifidobacterium agar modified by Beerens (Bifidobacterium spp.), and LAMVAB (Lactobacillus spp. from feces). Plates were incubated at 37 °C for 24 or 72 h, depending on the culture medium. All media, except BBL CHROMAgar, were incubated in an anaerobiosis cabinet (BACTRON). Colonies were counted using an SC6PLUS colony counter (Stuart, UK). Results are expressed as log CFU/mL.
The determination of SCFA was performed in duplicate using gas chromatography on an Agilent 6890A chromatograph equipped with an automatic injector G2613A and flame ionization detector. A DB-WAXetr column (100% polyethylene glycol, 60 m, 0.32 mm × 0.25 μm) was used, and helium served as the carrier gas at a flow rate of 1.5 mL/min. The temperature gradient consisted of the following steps: 50 °C for 2 min, followed by a 15 °C/min increase to 150 °C, a 5 °C/min increase to 200 °C, and a 15 °C/min increase to 240 °C for 20 min, resulting in a total analysis time of 41.3 min.
Ammonium ion determination was performed in duplicate using the Spectroquant Ammonium Test Kit (Merck, Germany). Serial dilutions were prepared from a 10 g/L standard ammonium solution for calibration. Fermentation liquid samples were diluted (1:10, v/v) with deionized water, and before measuring at 25 °C, 5 mL of NH4-1 and NH4-2 reagents were added to the standards and samples. The mixture was stirred between reagent addition, and absorbance was measured at 690 nm.

2.4. Statistically Analysis
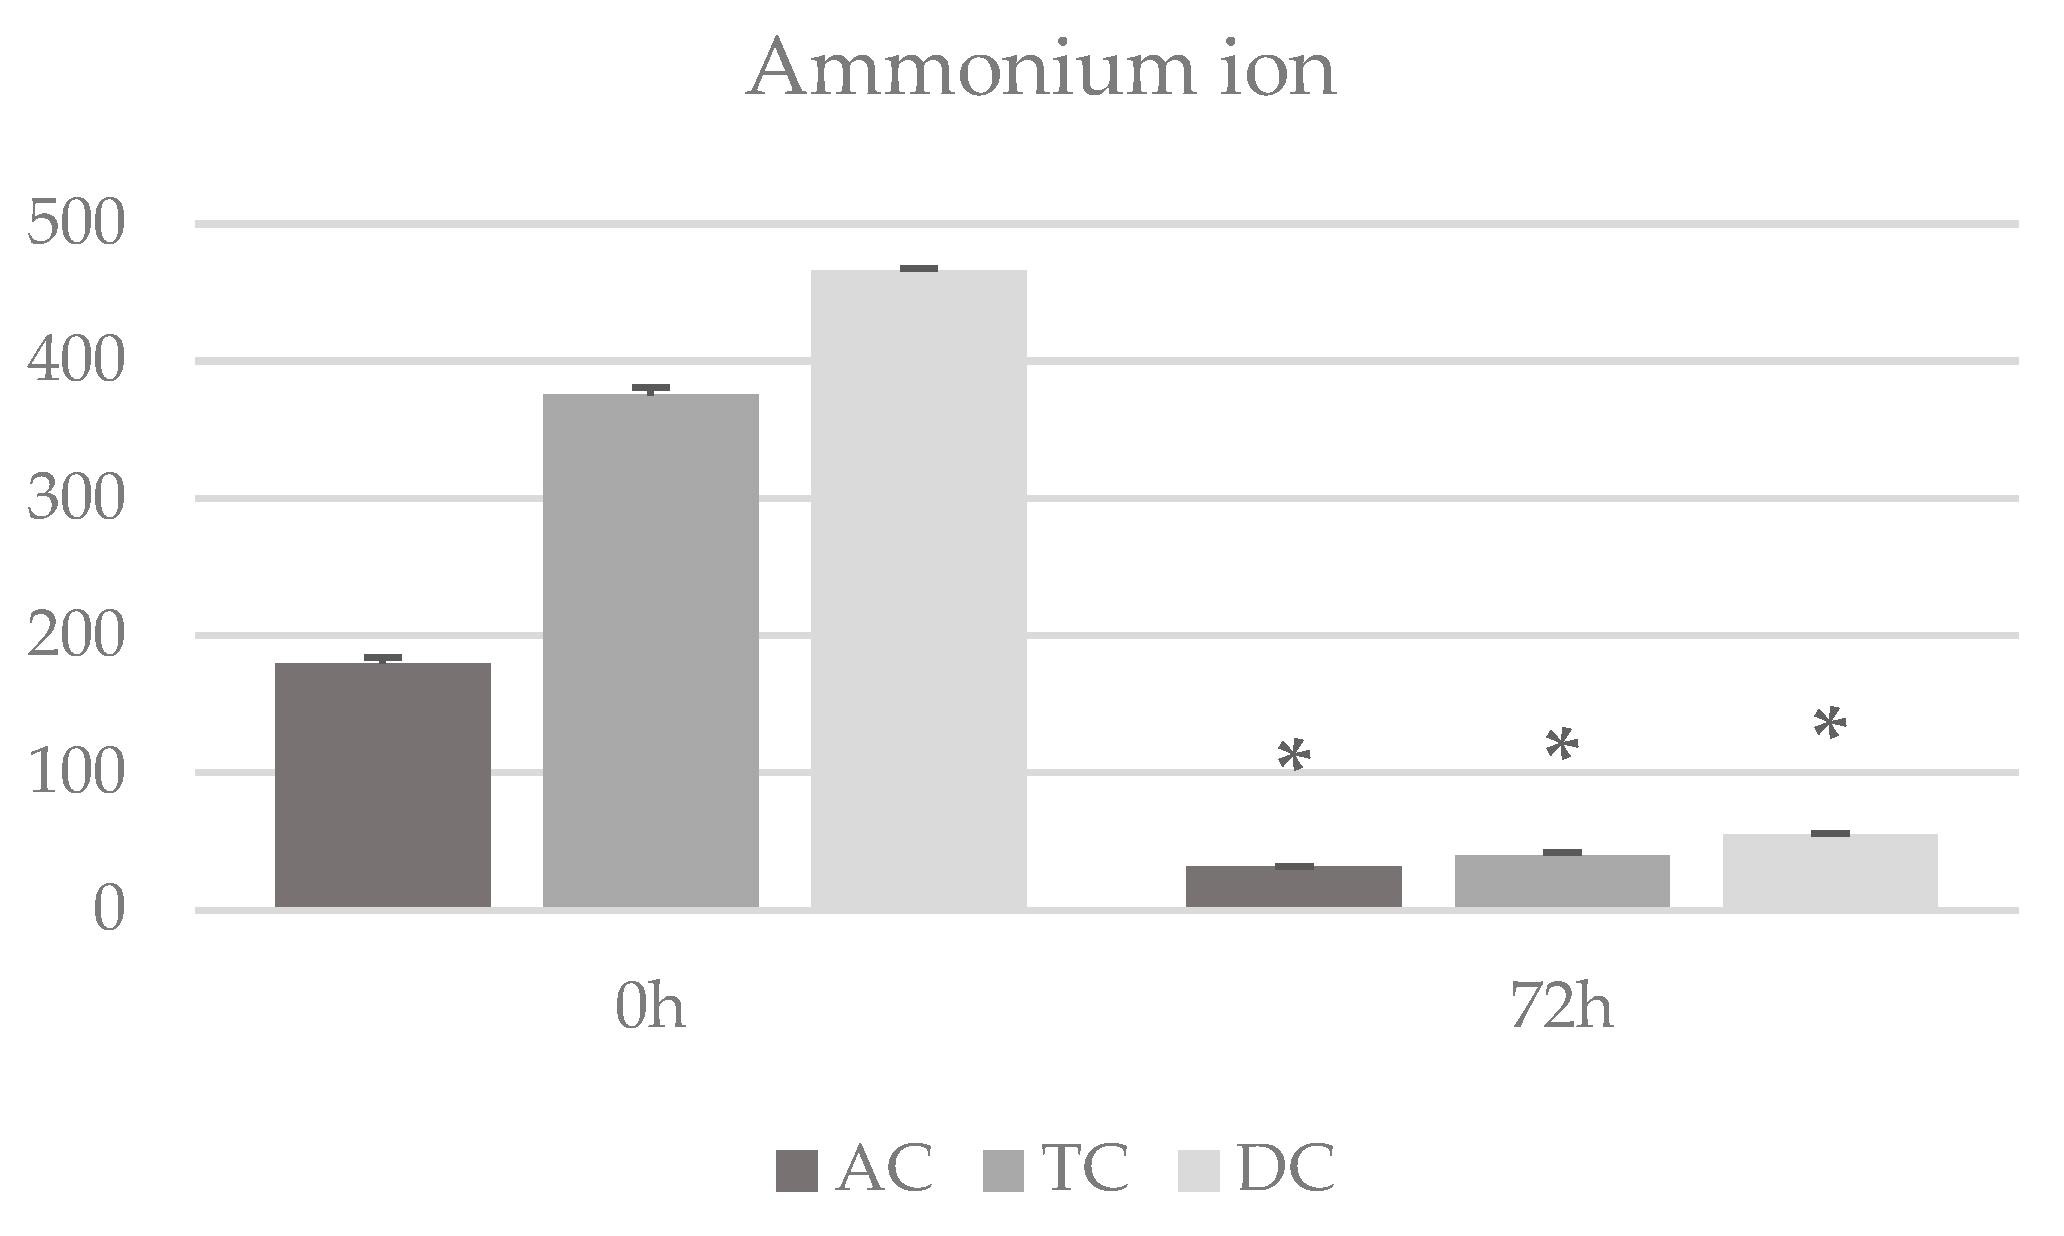
A t-test was used to evaluate statistically significant differences (p < 0.05) in each colon compartment between 0 and 72 h for microbial growth, ammonium content, and individual and total SCFA content. GraphPad Prism 9.5.1 (GraphPad Software Inc., San Diego, CA, USA) was used throughout this study.

3. Results

Microbial growth was observed in each colon compartment (differences statistically significant at 72 vs. 0 h, p < 0.05) of the species listed in Table 1. Staphylococcus spp. in the AC showed the highest growth, being 2.1-fold at 72 h of fermentation compared with 0 h, with less growth (1.4 and 1.6-fold, respectively) in the distal compartments (TC and DC). Lactobacillus spp., Bifidobacterium spp., and Enterococcus spp. showed a 1.3- to 1.6-fold increase in all three colon compartments.
Regarding the concentration of ammonium ions (Figure 1), at 0 h, the highest content concentration was observed in the DC (465.90 mg/L), followed by the TC (375.52 mg/L) and the AC (179.82 mg/L). After 72 h of colonic fermentation of the bread digesta, a statistically significant decrease (p < 0.05) in ammonium ion content was observed in all three colon compartments. This decrease was highest in the TC (9.4-fold), followed by the DC (8.5-fold) and AC (5.4-fold).
The main SCFAs are acetate, propionate, and butyrate (Table 2). In the AC (72 vs. 0 h), a decrease was observed for acetate and propionate (4.1- and 3.5-fold, respectively), while a slight increase (0.04 to 0.06 mM) was shown for butyrate. As a result, the total SCFA (sum of acetate, propionate, and butyrate) decreased from 16.22 to 4.03 mM (Figure 2). In the TC (72 vs. 0 h), acetate remained constant without statistically significant differences (p < 0.05), whereas propionate and butyrate decreased (4.8- and 1.2-fold, respectively). Total SCFA in TC decreased from 49.61 to 39.95 mM. In the DC (72 vs. 0 h), acetate and propionate decreased 1.3- and 1.7-fold, respectively; however, the largest increase of 11.8-fold for butyrate caused an increase in total SCFA (from 67.34 to 92.37 mM).

4. Discussion

In this study, we evaluated the impact of a complex food matrix, such as PS-WRB, on microbiota composition and metabolite production using a simgi® system. Colonic fermentation of PS-WRB leads to an increase in Lactobacillus and Bifidobacterium species, probably due to the bread components. In fact, bread has an important content of fiber (15.3 g/100 g bread) and is a source of β-glucan, which has been identified as a prebiotic [2,13]. Lactobacillus and Bifidobacterium are butyrate-producing bacteria [5]. This could explain the increase in microbial species after 72 h of colonic fermentation of the PS-WRB digesta, which translates into an increase in butyrate in the DC and consequently, an increase in total SCFA. It should be noted that it has been reported that 10 g of dietary fiber could lead to the production of SCFA of around 100 mM [5]. This would agree with our results, where 84 mM total SCFA were obtained in the DC after 72 h of fermentation of rye bread containing 15.3 g of fiber/100 g of bread. In addition, in a previous study by our research group, the colonic fermentation of a PS-ingredient (source of free microcrystalline PS) was evaluated using a dynamic fermentation system [14]. The PS ingredient led to modifications of the microbiota composition (increase in some genera from the phylum Firmicutes such as Catenibacterium and Coprococcus) and SCFA (including butyrate). Therefore, it is possible that the PS present in our matrix may also contribute to the butyrate generation mentioned above.
The decrease in ammonium ions could be explained by the amount of protein present in the PS-WRB (5.3 g/100 g bread). The low amount of protein compared with fiber (2.5-fold higher) could also have an inhibitory effect on proteolytic fermentation, as well as the production of SCFA, which inhibits the proteolytic capacity of the enzymes. In addition, enhanced bacterial growth and carbohydrate fermentation can reduce ammonia concentrations in the gut due to a greater incorporation of nitrogen into microbial cells [15].

5. Conclusions

Our results showed that the consumption of PS-WRB could influence the growth of beneficial microbial species such as Lactobacillus and Bifidobacterium, which in turn, promotes the production of butyrate, a crucial energy substrate for enterocytes. This combined effect boosts the capacity to promote health while increasing microbial diversity.

Author Contributions

Conceptualization, R.B. and G.G.-L.; formal analysis, N.F. and V.B.-M.; investigation, N.F. and V.B.-M.; data curation, N.F. and V.B.-M.; writing—original draft preparation, N.F., V.B.-M., R.B. and G.G.-L.; writing—review and editing, R.B. and G.G.-L.; supervision, R.B. and G.G.-L.; project administration, R.B. and G.G.-L.; funding acquisition, R.B. and G.G.-L. All authors have read and agreed to the published version of the manuscript.

Funding

This study is part of the project PID2019-104167RB-I00 funded by MCIN/AEI/10.13039/501100011033 and partially funded by Generalitat Valenciana (CIAICO/2021/076). N.Faubel holds a CPI-22-458 contract with the Investigo Program (Generalitat Valenciana, Spain). V.Blanco-Morales holds a grant for the requalification of the Spanish university system from the Ministry of Universities of the Government of Spain (European Union, NextGeneration EU).

Institutional Review Board Statement

Not applicable.

Informed Consent Statement

Not applicable.

Data Availability Statement

Data are contained within the article.

Conflicts of Interest

The authors declare no conflict of interest.

References

  1. Danneskiold-Samsøe, N.B.; Dias de Freitas Queiroz Barros, H.; Santos, R.; Bicas, J.L.; Cazarin, C.B.B.; Madsen, L.; Kristiansen, K.; Pastore, G.M.; Brix, S.; Maróstica Júnior, M.R. Interplay between food and gut microbiota in health and disease. Food Res. Int. 2019, 115, 23–31. [Google Scholar] [CrossRef] [PubMed]
  2. Åman, P.; Andersson, A.A.M.; Rakha, A.; Andersson, R. Rye, a healthy cereal full of dietary fiber. Cereal Foods World 2010, 55, 231–234. [Google Scholar]
  3. Morrison, D.J.; Preston, T. Formation of short chain fatty acids by the gut microbiota and their impact on human metabolism. Gut Microbes 2016, 7, 189–200. [Google Scholar] [CrossRef] [PubMed]
  4. Makran, M.; Cilla, A.; Haros, C.M.; Garcia-Llatas, G. Enrichment of wholemeal rye bread with plant sterols: Rheological analysis, optimization of the production, nutritional profile and starch digestibility. Foods 2022, 12, 93. [Google Scholar] [CrossRef] [PubMed]
  5. Gong, L.; Wen, T.; Wang, J. Role of the microbiome in mediating health effects of dietary components. J. Agric. Food Chem. 2020, 68, 12820–12835. [Google Scholar] [CrossRef] [PubMed]
  6. Ounnas, F.; Privé, F.; Salen, P.; Gaci, N.; Tottey, W.; Calani, L.; Bresciani, L.; López-Gutiérrez, N.; Hazane-Puch, F.; Laporte, F.; et al. Whole rye consumption improves blood and liver n-3 fatty acid profile and gut microbiota composition in rats. PLoS ONE 2016, 11, e0148118. [Google Scholar] [CrossRef] [PubMed]
  7. EFSA Panel on dietetic products, nutrition, and allergies (NDA). Scientific Opinion on the substantiation of a health claim related to 3 g/day plant sterols/stanols and lowering blood LDL-cholesterol and reduced risk of (coronary) heart disease. EFSA J. 2012, 10, 2693. [Google Scholar] [CrossRef]
  8. Salehi, B.; Quispe, C.; Sharifi-Rad, J.; Cruz-Martins, N.; Nigam, M.; Mishra, A.P.; Konovalov, D.A.; Orobinskaya, V.; Abu-Reidah, I.M.; Zam, W.; et al. Phytosterols: From preclinical evidence to potential clinical applications. Front. Pharmacol. 2021, 11, 599959. [Google Scholar] [CrossRef] [PubMed]
  9. Cuevas-Tena, M.; Alegría, A.; Lagarda, M.J. Relationship between dietary sterols and gut microbiota: A review. Eur. J. Lipid Sci. Technol. 2018, 120, 1800054. [Google Scholar] [CrossRef]
  10. Faubel, N.; Makran, M.; Cilla, A.; Alegría, A.; Barberá, R.; Garcia-Llatas, G. Bioaccessibility of plant sterols in wholemeal rye bread using the INFOGEST protocol: Influence of oral phase and enzymes of lipid metabolism. J. Agric. Food Chem. 2022, 70, 13223–13232. [Google Scholar] [CrossRef] [PubMed]
  11. Brodkorb, A.; Egger, L.; Alminger, M.; Alvito, P.; Assunçaõ, R.; Ballance, S.; Bohn, T.; Bourlieu-Lacanal, C.; Boutrou, R.; Carrierè, F.; et al. INFOGEST static in vitro simulation of gastrointestinal food digestion. Nat. Protoc. 2019, 14, 991–1014. [Google Scholar] [CrossRef] [PubMed]
  12. Tamargo, A.; Cueva, C.; Taladrid, D.; Khoo, C.; Moreno-Arribas, M.V.; Bartolomé, B.; González de Llano, D. Simulated gastrointestinal digestion of cranberry polyphenols under dynamic conditions. Impact on antiadhesive activity against uropathogenic bacteria. Food Chem. 2022, 368, 130871. [Google Scholar] [CrossRef] [PubMed]
  13. Sivieri, K.; de Oliveira, S.M.; de Souza Marquez, A.; Pérez-Jiménez, J.; Diniz, S.N. Insights of β-glucan as a prebiotic coadjuvant in the treatment of diabetes mellitus: A review. Food Hydrocoll. Health 2022, 2, 100056. [Google Scholar] [CrossRef]
  14. Cuevas-Tena, M.; Alegria, A.; Lagarda, M.J.; Venema, V. Impact of plant sterols enrichment dose on gut microbiota from lean and obese subjects using TIM-2 in vitro fermentation model. J. Funct. Foods 2019, 54, 164–174. [Google Scholar] [CrossRef]
  15. Diether, N.E.; Willing, B.P. Microbial fermentation of dietary protein: An important factor in diet-microbe-host interaction. Microorganisms 2019, 7, 19. [Google Scholar] [CrossRef] [PubMed]
Figure 1. Ammonium ion contents (mg/L) in the colon compartments at 0 and 72 h of PS-WRB fermentation. * Statistically significant differences (p < 0.05) between 0 and 72 h for ammonium ion concentration for each colon compartment. AC: ascending colon, TC: transverse colon, DC: descending colon.
Blsf 26 00087 g001
Figure 2. Total short-chain fatty acids (SCFA) contents (Mm) in the colon compartments at 0 and 72 h of PS-WRB fermentation. * Statistically significant differences (p < 0.05) between 0 and 72 h for total SCFA for each colon compartment. AC: ascending colon, TC: transverse colon, DC: descending colon.
Blsf 26 00087 g002
Table 1. Changes in microbial growth at 0 and 72 h of PS-WRB fermentation in the three colon compartments.
Microorganisms 0 h72 h 1
Staphylococcus spp.AC4.28 ± 0.018.98 ± 0.05
TC5.67 ± 0.017.88 ± 0.05
DC5.64 ± 0.068.77 ± 0.01
Lactobacillus spp.AC6.01 ± 0.029.23 ± 0.07
TC6.15 ± 0.039.17 ± 0.02
DC5.71 ± 0.038.67 ± 0.02
Bifidobacterium spp.AC6.37 ± 0.019.34 ± 0.02
TC7.25 ± 0.049.18 ± 0.09
DC7.14 ± 0.089.23 ± 0.12
Enterococcus spp.AC5.80 ± 0.039.44 ± 0.04
TC6.42 ± 0.029.29 ± 0.01
DC5.71 ± 0.018.86 ± 0.03
Data expressed as mean values of log CFU/mL ± standard deviation (n = 3). 1 Statistically significant difference (p < 0.05) between 0 and 72 h in each colon compartment and genera. AC: ascending colon, TC: transverse colon, DC: descending colon.
Table 2. Contents of short-chain fatty acids (SCFAs) at 0 and 72 h of PS-WRB fermentation in the three colon compartments.
SCFA 0 h72 h
AcetateAC15.11 ± 0.02 3.66 ± 0.05 *
TC35.25 ± 0.3635.46 ± 0.22
DC40.29 ± 0.5929.88 ± 0.25 *
PropionateAC1.07 ± 0.030.31 ± 0.12 *
TC12.03 ± 0.092.51 ± 0.03 *
DC15.42 ± 0.229.06 ± 0.02 *
ButyrateAC0.04 ± 0.0020.06 ± 0.001 *
TC2.33 ± 0.011.98 ± 0.17 *
DC3.79 ± 0.1144.89 ± 0.02 *
Data expressed as mean values (mM) ± standard deviation (n = 2). * Statistically significant differences (p < 0.05) between 0 and 72 h for each SCFA at the same colon compartment. AC: ascending colon, TC: transverse colon, DC: descending colon.
Disclaimer/Publisher’s Note: The statements, opinions and data contained in all publications are solely those of the individual author(s) and contributor(s) and not of MDPI and/or the editor(s). MDPI and/or the editor(s) disclaim responsibility for any injury to people or property resulting from any ideas, methods, instructions or products referred to in the content.

