Proceeding Paper

Geographical Differentiation of Honeys from Entre Ríos (Argentina) through Physicochemical Analysis: A Scientific Approach for the Characterization and Authentication of Regional Honeys †

by
Lucía Elisabet Brelis
1,2,
Carolina Elizabeth Genevois
1,2,
Daniel Primost
2,3 and
Verónica María Busch
1,2,*
1
Instituto de Ciencia y Tecnología de los Alimentos de Entre Ríos (ICTAER), UNER-CONICET, Gualeguaychu CP 2820, Entre Ríos, Argentina
2
Facultad de Bromatología, Universidad Nacional de Entre Ríos, Gualeguaychu CP 2820, Entre Ríos, Argentina
3
Of. Técnica Urdinarrain, Instituto Nacional de Tecnología Agropecuaria, INTA, Urdinarrain CP 2826, Entre Ríos, Argentina
*
Author to whom correspondence should be addressed.
Presented at the 4th International Electronic Conference on Foods, 15–30 October 2023; Available online: https://foods2023.sciforum.net/.
Biol. Life Sci. Forum 2023, 26(1), 53; https://doi.org/10.3390/Foods2023-15075
Published: 14 October 2023
(This article belongs to the Proceedings of The 4th International Electronic Conference on Foods)

Abstract

:
Argentina’s prominent global position in honey production is due to its extensive agroecological diversity. This study assessed the influence of geographical origin on the physicochemical properties of honeys from southeastern Entre Ríos. In total, 104 honey samples from Gualeguaychú (GU), Islas del Ibicuy (II), and Concepción del Uruguay (CU) (2020–2022) were analyzed. Statistically significant differences (p < 0.05) were observed among districts: the II samples displayed the lowest values (color, conductivity, acidity, pH, and ash), the GU samples showed moderate values, and the CU samples exhibited the highest values, except for humidity. Chemometric analyses explained 75.5% of data variability (PCA) and successfully classified 85.3% of the samples by their origin (LDA). These findings bear implications for product differentiation and market value enhancement in Entre Ríos’ honey industry, serving as a foundation for future quality control and origin identification endeavors.

1. Introduction

Argentina stands out as one of the leading countries worldwide in the production and export of honey, ranking third and second, respectively. Exports have shown a continuous growth trend during the period 2015–2022 (FOB), representing approximately 95% of the total production [1]. In particular, the province of Entre Ríos in the northeast of Argentina positions itself as the second-largest producer in the country, with an estimated annual production of 14,000 tonnes and beehives distributed throughout the provincial territory [2]. The quality and chemical composition of honey are influenced by various factors, including its geographical origin, botanical source, climatic conditions, and seasonality. Argentina’s vast agroecological diversity offers exceptional potential for obtaining honeys with distinctive organoleptic profiles and nutritional properties [3]. Particularly, Entre Ríos presents favorable conditions for honey production as its climate varies from being subtropical with no dry season in the north to humid temperate in the plains of the south [2]. However, a high percentage of Argentine honey is sold in bulk without any geographical indication or designation of origin that could add value to the product and enhance its positioning in both international and domestic markets. On the other hand, in Argentina, the annual consumption per capita is lower than 200 g/hab/year [4]. In this context, efforts have been made to recognize and valorize the natural variability of honeys through the creation of the “Regional Honey Identity Map”. This project is based on participatory construction and aims to describe the specific characteristics of the different types of honeys produced in the country. Nevertheless, the available information is currently limited, focusing mainly on data related to the sensory characteristics and floral origin of honeys in each region [5]. To further explore this potential, a study was conducted to assess the impact of geographical origin on the physicochemical characteristics of honeys from the southeastern region of Entre Ríos, using chemometric methods to discriminate and classify honey samples according to their origin.

2. Materials and Methods

2.1. Sample Collection

In total, 100 honey samples were collected during the years 2020–2022 in 3 districts, Gualeguaychú (GU), Islas del Ibicuy (II), and Concepción del Uruguay (CU) of Entre Ríos, Argentina. The samples were stored in a dark, cool, and dry place and analyzed within the first 3 months.

2.2. Instrumental Analysis

2.2.1. Color Index

The color of the honey samples was determined following the instructions provided by Del Moro [6], using a HANNA® Instrument HI96785 Colorimeter (Hanna Instrument Argentina S.A.; Buenos Aires, Argentina). Prior to conducting the measurements, the samples were tempered (<45 °C) and centrifuged (5 min; 3000 rpm). This ensured that at the time of reading, they were clear and free of bubbles, crystals, or impurities that could potentially affect the outcomes. Each sample was placed in a cuvette for color measurement, and the results were expressed in mm Pfund.

2.2.2. Determination of Electrical Conductivity (EC)

Electrical conductivity was measured at 20 °C in the honey samples diluted with deionized water (with electrical conductivity <1 µs/cm), with a concentration of 20% solids on a dry basis, in accordance with the specifications outlined in the IRAM 15945 of 1996 [7] and the legislation of the European Union [8]. To carry out these measurements, a Milwaukee® MW801 Conductivity Meter (Milwakee Instrument; Szeged, Hungary) was utilized.

2.2.3. Determination of pH

For pH determination, the honey samples were diluted to 10% (w/v) and potentiometrically measured at 20 °C using a Milwaukee® MW801 pH meter. This procedure followed the guidelines set out in the IRAM 15938 of 1996 [9].

2.2.4. Determination of Free Acidity

To quantify the acidity of the samples, the approach adhered to the official AOAC 962.19 [10] method outlined in 1995. Briefly, the honey samples were prepared (in a 1:10 ratio) and subjected to neutralization titration with 0.1 N NaOH. The equivalence point (pH 8.2) was measured as indicated in Section 2.2.3. Each sample was evaluated in triplicate.

2.2.5. Moisture Content

The determination of moisture content in the honey samples was conducted through a measurement of their refractive index. For this purpose, a HANNA® Instrument HI96801 Digital Refractometer for Brix Analysis in Foods (Hanna Instrument Argentina S.A.; Buenos Aires, Argentina) was employed, which had been previously calibrated using deionized water. This procedure was executed in accordance with the protocols specified in the AOAC 969.38B of 1996 [11].

2.2.6. Ash Content

The ash content was measured using the official AOAC 920.181A method [12]. This procedure involved a gravimetric determination of ash within the honey samples after incineration in a Laboratory Muffle Furnace model 272. This process was conducted at a temperature of 550 °C until a constant weight and a whitish appearance were achieved.

2.3. Statistical Data Analysis

Triplicate determinations were conducted for each of the physicochemical parameters present in the samples. The obtained results were processed using the statistical software STATGRAPHICS Centurion XV.II Version 17. A one-way variance analysis (ANOVA) was carried out to ascertain which physicochemical parameters displayed significant differences in accordance with the geographical origin of the honey samples (p < 0.05). Following this, the Bonferroni multiple comparisons test was employed as a post hoc analysis to identify the mean disparities in those parameters that displayed noteworthy variations. Furthermore, the collected data underwent chemometric analyses. These assessments encompassed the application of techniques such as principal component analysis (PCA), which facilitated the determination of the physicochemical parameters that made significant contribution to the observed variations. Similarly, linear discriminant analysis (LDA) was used to characterize the distinctions among the samples from different districts that were the subjects of analysis.

3. Results and Discussion

The results obtained from the physicochemical parameter research are shown in Table 1.

3.1. Color Index (CI)

The color of the honey samples from the southeast region of Entre Ríos was classified from “White” to “Dark Amber.” The dominant categories were “Light Amber” (52% of the analyzed samples), “Amber” (28% of the analyzed samples), and “Extra Light Amber” (13% of the analyzed samples). The II honey samples (21.0 to 87.0 mm Pfund) were significantly lighter than those from the other two districts (GU values of 44.0–108.0 and CU values of 49.0–117.0 mm Pfund). The color of honey is a complex attribute influenced by various factors, such as mineral content and botanical origin of honey. Color is also related to the presence of hydroxymethylfurfural (HMF) and other compounds (some of them are colored) that develop as a result of prolonged or improper honey storage or due to excessive heating of honey. These results fall below the values reported for the province of Formosa in 2022 [13], but surpass the data presented for the province of Córdoba in 2007 [14], where honey varieties in the categories of white water, extra white, and white were predominant. In the case of Corrientes, a province that shares the same mesopotamic region, similar values to those found in the II samples [15] have been reported.

3.2. Determination of Electrical Conductivity (EC)

The electrical conductivity values for the honey samples obtained in the study region ranged from 240 to 1810 µS/cm. Significant differences (p < 0.05) were observed among districts. The II samples had the lowest electrical conductivity (240.0–630.0 µS/cm). In contrast, the CU samples exhibited the highest values in the region (389.0 to 1813.0 µS/cm). Finally, the GU samples had values that fell between the values of the other two districts (334.0 to 1218.0 µS/cm). The values of the II and GU samples were below the limits set by the Codex Alimentarius for unclassified honeys (<0.8 mS/cm), but some samples from II had higher EC. EC can be related to various factors, such as sugar concentration, the presence and quantity of minerals, acidity, and other chemical components. EC is sometimes used as an indicator of honey quality and authenticity, as different honeys can have unique mineral profiles due to their geographical and floral origin. The results obtained for the II samples are in line with the data presented by Acquarone et al. [15] for the province of Entre Ríos. In the case of the GU samples, the values could be compared to the values reported for the Argentine provinces of Formosa, Chaco, and Corrientes, while the values of the CU samples exceeded even those values [15,16,17].

3.3. Determination of Free Acidity (FA)

The analysis of free acidity resulted in a range of 10.6 to 24.8 meq/kg, which complies with the regulations established by the Codex Alimentarius for fresh honeys (50 meq/kg). The II samples had the lowest acidity, ranging from 10.6 to 20.0 meq/kg. The highest values in the region were obtained for the CU samples (16.8–24.8 meq/kg). The acidity of honey is associated with its chemical profile including organic acids. Acidity not only contributes to the distinct flavor of honey but acts as a natural preservative, inhibiting the growth of microorganisms and helping to prevent spoilage, thus ensuring that honey remains a stable and delicious product over time. The FA results obtained for the CU samples resembled the data presented by Ciapini et al. (2022) for the Entre Ríos delta [13]. However, the regional average fell below the values reported by Acquarone et al. for the province of Entre Ríos [15] and by other authors for other Argentine provinces [15,16,17].

3.4. Determination of pH

Regarding pH values, they ranged from 3.3 to 4.8. The samples from II had the lowest pH values, ranging from 3.3 to 4.5. The Gualeguychú samples displayed intermediate values for this parameter, with a range of 3.5 to 4.6. Finally, the CU samples had the highest pH values, ranging from 3.5 to 4.8. The pH results exhibited similarities with those reported for Entre Ríos in the study by Acquarone et al. [15]. In the case of the GU samples, the values were comparable to those recorded for the provinces of Chaco in 2014 [16] and Formosa in 2022 [17].

3.5. Moisture Content (MC)

The honey samples from the southeastern Entre Rios region varied in moisture content, with the moisture content ranging from 17.0% to 21.1%. The II samples showed a range of 17.4% to 21.1%, in accordance with the results reported by Ciapinni 2022 [13]. The GU samples ranged from 17.0% to 19.3%, while the CU samples ranged from 18.2% to 20.20%. Notably, the GU samples were significantly drier. It was observed that some samples slightly exceeded the maximum allowed for unclassified honeys according to the Codex (20%). The moisture content of honey is intricately linked to factors such as climate, floral source, geographical location, and the maturation process. These variables collectively influence the level of water present in honey, impacting its quality and stability. The moisture content results for the samples from the southeastern Entre Ríos region aligned with the data presented by Acquarone et al. [15]. Furthermore, the obtained MC values were slightly higher than those reported for other Argentine provinces, such as Jujuy, Corrientes, and Chaco [15,16,18].

3.6. Ash Content (AC)

Regarding the ash content percentage, the II samples had significantly lower values compared to the CU and GU samples, with ranges of 0.04–0.4, 0.29–0.48, and 0.26–0.67, respectively. The values of almost all samples remained below the maximum allowable (0.6% for flower honeys). The ash content in honey is influenced by various factors, including the floral source, geographical origin, and environmental conditions, as well as whether the honey is derived from nectar or honeydew. These variables collectively contribute to the mineral content in honey, affecting its overall composition and potential uses. The ash content results obtained for the samples from the Entre Ríos region were found to be above the results reported by other authors [19].

3.7. Principal Component Analysis (PCA)

A principal component analysis (PCA) was conducted on the physicochemical data of the 104 samples to identify the primary vectors capturing the majority of the variability and to simultaneously scrutinize the trends exhibited by the samples from different districts, as well as to assess the discriminating characteristics of the specified parameters. Figure 1a displays a biplot graph obtained for the first two principal components and the arrangement of the samples identified by geographic origin. As depicted in Figure 1b, the aforementioned two components enabled the explanation of 75.5% of data variability.
In the first principal component, the dominant variables were pH, electrical conductivity, and ash content. In the second principal component, the variables carrying more weight were humidity and free acidity.
The majority of the samples from II positioned themselves on the right-hand side of the biplot graph, which was associated with inverse values in terms of the pH, electrical conductivity, ash content, color, and free acidity variables. Conversely, the honey samples from CU situated themselves on the left-hand side of the graph, aligning with the vectors of pH, electrical conductivity, ash content, color, and free acidity, indicating higher values in these parameters. As for the samples from GU, they were situated in the lower-middle part with a tendency to the left, in contrast to the humidity vector.

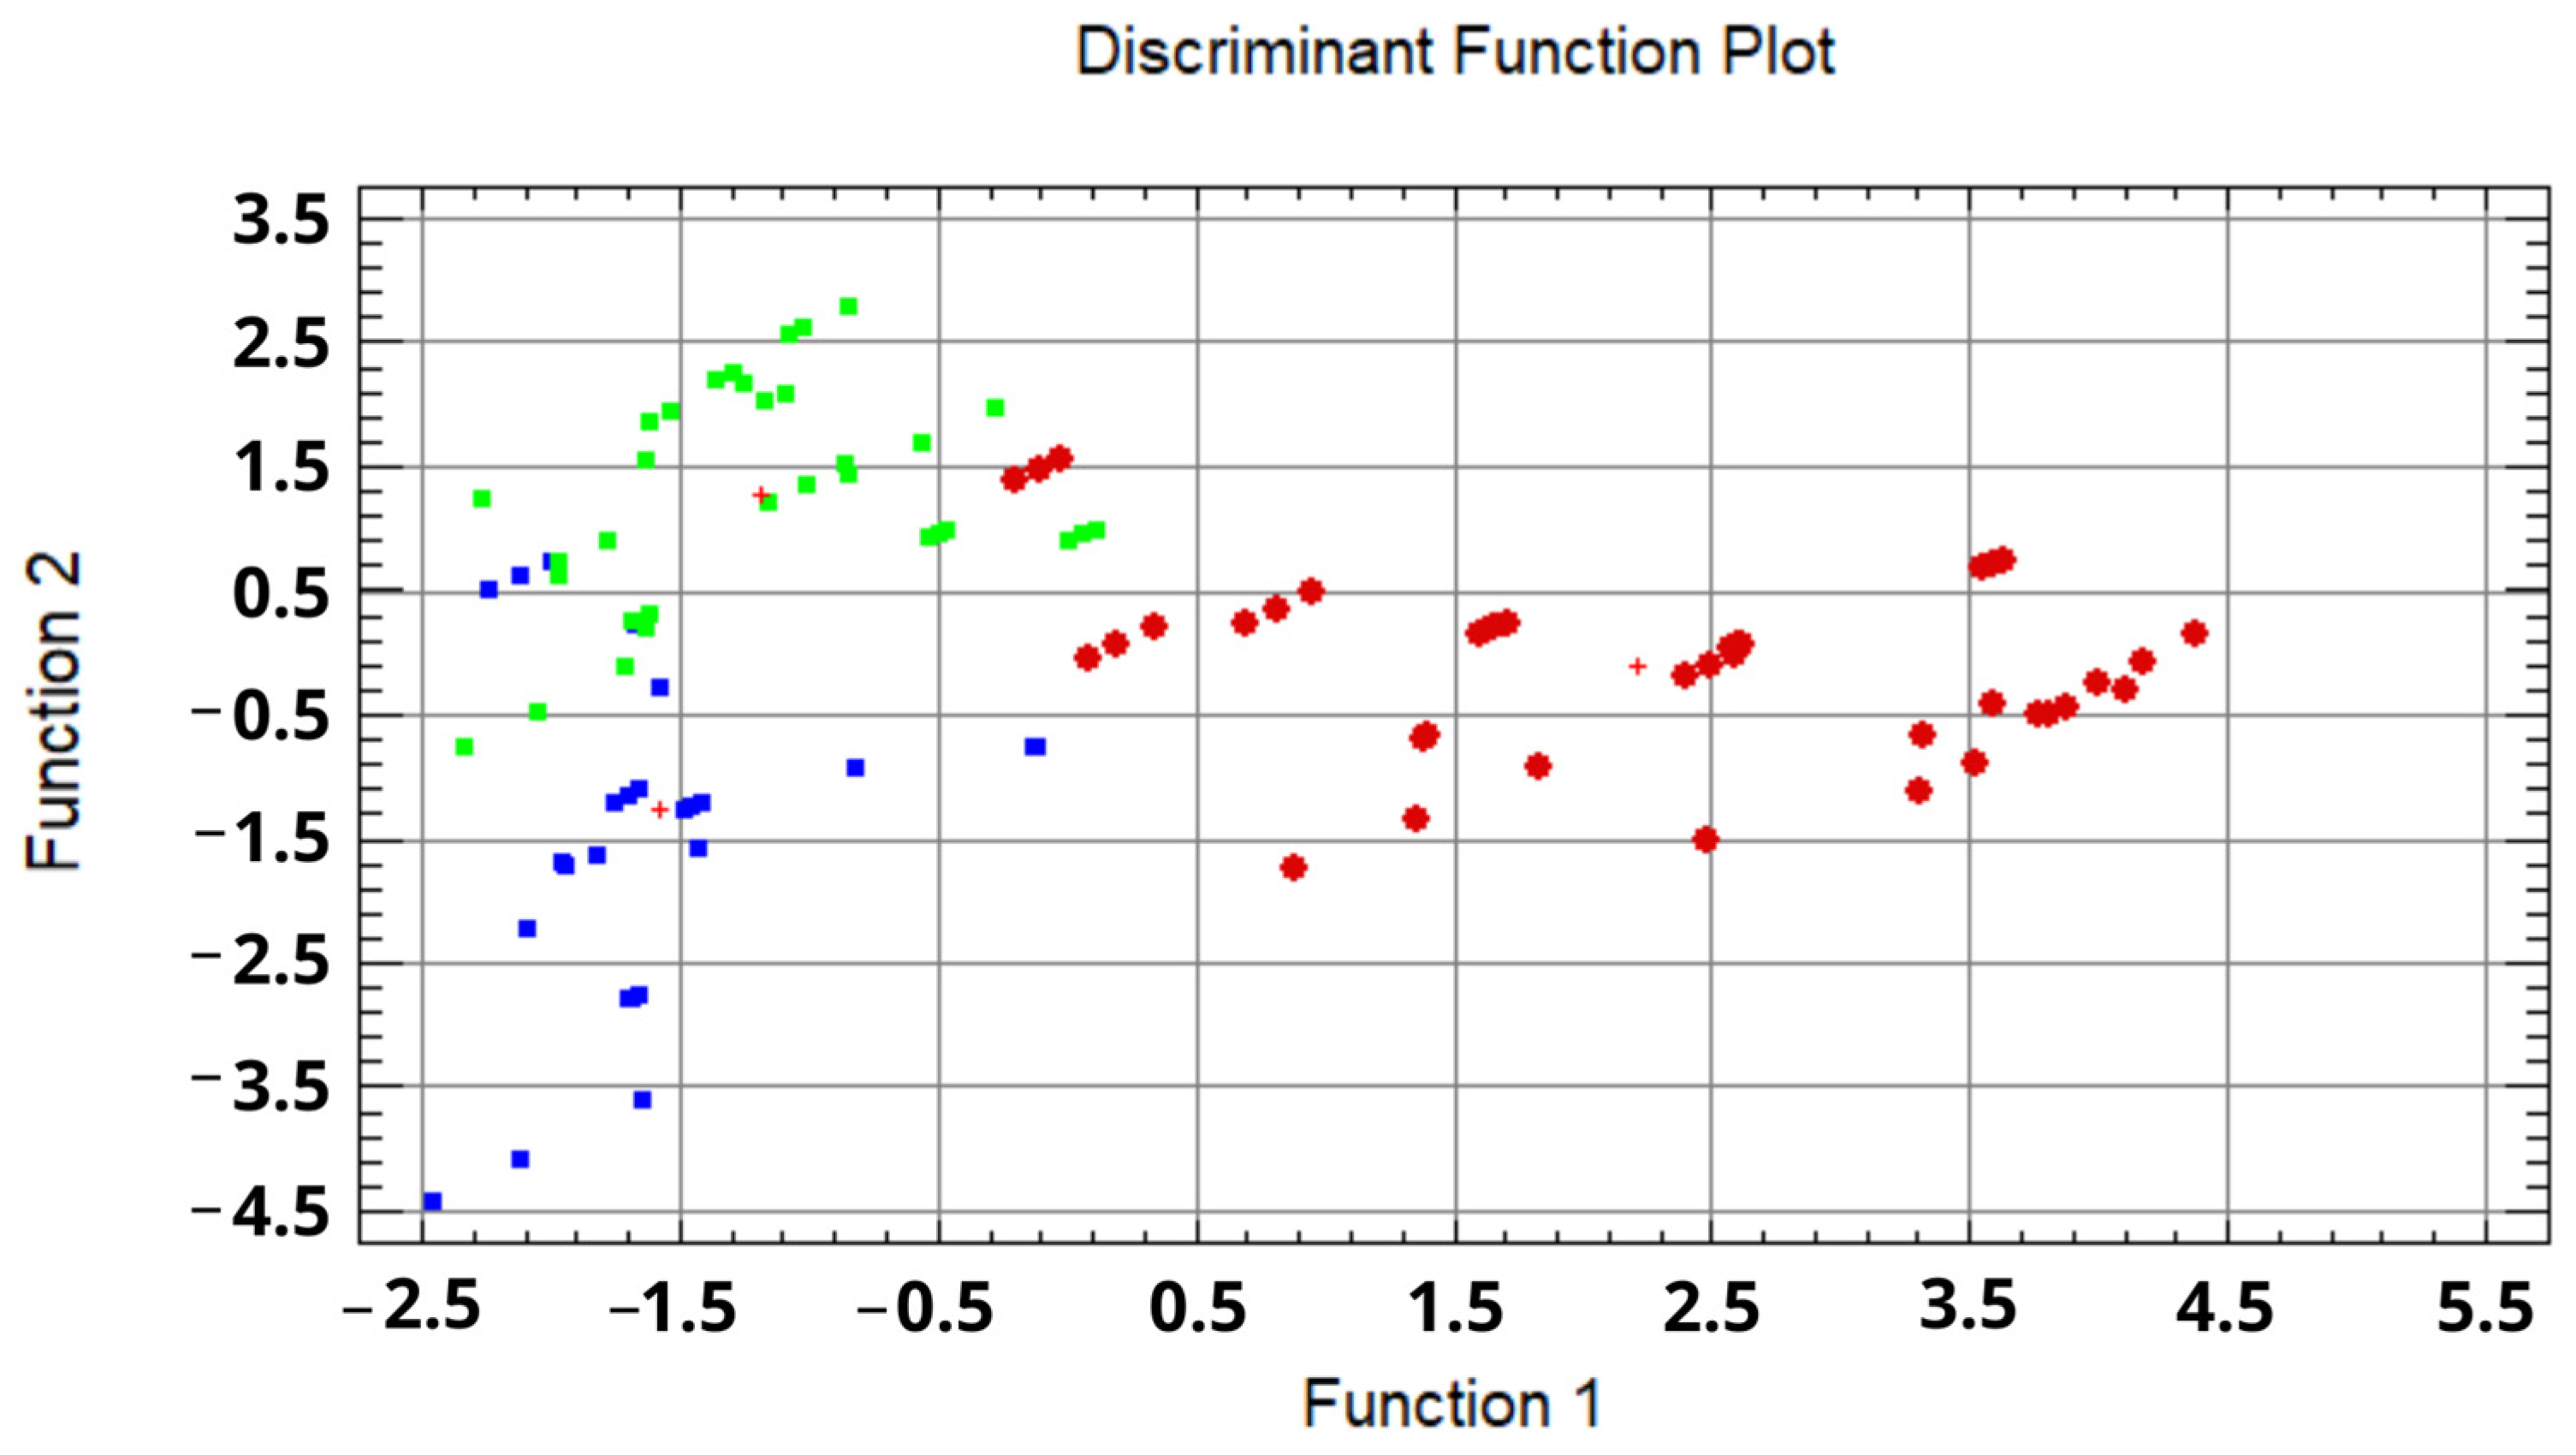
3.8. Linear Discriminant Analysis (LDA)

In the LDA, the studied physicochemical parameters successfully discriminated 90.9% of the samples from II (n = 54), 80.0% of the samples from GU (n = 20), and 84.6% of the samples from CU (n = 30). This resulted in an average discrimination power of 85.3% for the model. Figure 2 illustrates the distribution of the samples differentiated by their geographical origin based on the two obtained functions. The II samples were primarily located in the upper left quadrant, with the majority falling between scores of −2.5 and −0.5 on function 1 and between −0.5 and 2.5 on function 2. The CU samples exhibited greater dispersion along the axis of function 1, ranging from −0.5 to 4.5, whereas function 2 displayed values ranging from −1.5 to 1.5. Lastly, the GU samples were situated in the lower right quadrant, ranging from −2.5 to −0.5 on function 1 and from −4.5 to −0.5 on function 2.

4. Conclusions

Based on the results obtained from two honey harvests in the southeastern region of Entre Ríos, the significant impact of geographical origin on the studied parameters is evident, both individually and collectively, through the use of multivariate analyses. The PCA proved its utility in simplifying the complexity of the data matrix and revealing the inherent patterns in the variability of the samples from the different districts analyzed in this study. Additionally, the LDA demonstrated its ability to accurately classify a high percentage of the samples. These findings represent a significant contribution to the understanding of honeys from both the Entre Ríos province and Argentina as a whole. Furthermore, these discoveries could serve as a foundation for the implementation of geographical indications and designations of origin to enhance the value or improve the classification process of honeys produced in this region.

Author Contributions

Conceptualization, L.E.B. and V.M.B.; methodology, L.E.B.; formal analysis, L.E.B., V.M.B. and C.E.G.; investigation, L.E.B.; resources, V.M.B., D.P. and C.E.G.; writing—original draft preparation, L.E.B.; writing—review and editing, V.M.B., L.E.B. and C.E.G.; funding acquisition, C.E.G. and V.M.B. All authors have read and agreed to the published version of the manuscript.

Funding

This study was funded by the Agencia Nacional de Promoción de la Investigación, el Desarrollo Tecnológico y la Innovación (PICTO-UADER-UNER 00009), and Consejo Nacional de Investigaciones Científicas y Técnicas (PIP 11220200100095CO). Lucia E. Brelis acknowledges the latter and the Universidad Nacional de Entre Ríos for the co-funded doctoral scholarship.

Institutional Review Board Statement

Not applicable.

Informed Consent Statement

Not applicable.

Data Availability Statement

Acknowledgments

The authors thank the INTA (Project “Diferenciación y agregado de valor de mieles del bajo Río Uruguay) and the Cooperativa Apícola Gualeguaychu Ltda. for the donation of honey samples.

Conflicts of Interest

The authors declare no conflict of interest.

References

  1. Ministerio de Economía Argentina. Monitor de Productos Regionales. Available online: https://www.argentina.gob.ar/sites/default/files/monitor_productos_regionales_2023.07_web.pdf (accessed on 6 September 2023).
  2. Secretaría de Comunicación Gobierno de Entre Ríos. El crecimiento de la apicultura consolida a la provincia como segunda productora nacional. 2021. Available online: https://noticias.entrerios.gov.ar/notas/el-crecimiento-de-la-apicultura-consolida-a-la-provincia-como-segunda-productora-nacional.htm (accessed on 13 June 2023).
  3. Tarapoulouzi, M.; Mironescu, M.; Drouza, C.; Mironescu, I.D.; Agriopoulou, S. Insight into the Recent Application of Chemometrics in Quality Analysis and Characterization of Bee Honey during Processing and Storage. Foods 2023, 12, 473. [Google Scholar] [CrossRef]
  4. Prensa Gobierno de Mendoza. Miel: Solo 5% de la Producción Nacional se Consume en el Mercado Interno. Available online: https://www.mendoza.gov.ar/prensa/miel-solo-el-5-de-la-produccion-nacional-se-consume-en-el-mercado-interno/#:~:text=En%20los%20primeros%20seis%20meses,y%20al%2064%25%20del%202021 (accessed on 2 June 2023).
  5. Ministerio de Agricultura Ganadería y Pesca. Mapa Regional de Identidad de las Mieles. Gobierno de Argentina. 2023. Available online: https://magyp.gob.ar/apicultura/mapa.php (accessed on 2 June 2023).
  6. Delmoro, J.; Muñoz, D.; Nadal, V.; Clementz, A.; Pranzetti, V. El color de los alimentos: Determinación de color en mieles. Invenio 2010, 13, 145–152. [Google Scholar]
  7. IRAM 15945; Miel. Determinación de la conductividad eléctrica. Instituto Argentino de Normalización y Certificación: Buenos Aires, Argentina, 2007.
  8. Bogdanov, S.; Martin, P.; Lüllmann, C. Harmonised Methods of the European Honey Commission. Apidologie. 1997, pp. 1–59. Available online: https://www.researchgate.net/publication/292092907 (accessed on 2 June 2023).
  9. IRAM 15938; Miel. Determinación de pH. Instituto Argentino de Normalización y Certificación: Buenos Aires, Argentina, 2007.
  10. Association of Official Analytical Chemists AOAC 962.19; Official Methods of Analysis. AOAC International: Washington, DC, USA, 1995.
  11. Association of Official Analytical Chemists AOAC 969.38B; Official Methods of Analysis. AOAC International: Washington, DC, USA, 1996.
  12. Association of Official Analytical Chemists AOAC 920.181A; Official Methods of Analysis. AOAC International: Washington, DC, USA, 1995.
  13. Ciappini, M.C.; Pozzo, L.; Díaz, P.; Arias, L.M. Sensory profile and preference map for Argentine honeys of different floral origins. AgriScientia 2022, 39, 133–142. [Google Scholar]
  14. Finola, M.S.; Lasagno, M.C.; Marioli, J.M. Microbiological and chemical characterization of honeys from central Argentina. Food Chem. 2007, 100, 1649–1653. [Google Scholar] [CrossRef]
  15. Acquarone, C.; Buera, P.; Elizalde, B. Pattern of pH and electrical conductivity upon honey dilution as a complementary tool for discriminating geographical origin of honeys. Food Chem. 2007, 101, 695–703. [Google Scholar] [CrossRef]
  16. Fechner, D.C.; Moresi, A.L.; Ruiz Díaz, J.D.; Pellerano, R.G.; Vazquez, F.A. Multivariate classification of honeys from Corrientes (Argentina) according to geographical origin based on physicochemical properties. Food Biosci. 2016, 15, 49–54. [Google Scholar] [CrossRef]
  17. Rios, F.; Sanchez, A.C.; Lobo, M.; Lupo, L.; Coelho, I.; Castanheira, I.; Samman, N. A chemometric approach: Characterization of quality and authenticity of artisanal honeys from Argentina. J. Chemom. 2014, 28, 834–843. [Google Scholar] [CrossRef]
  18. Cabrera, M.; Santander, E. Physicochemical and sensory analysis of honeys from eastern Formosa province (Argentina) and its relationship with their botanical origin. Food Chem. Adv. 2022, 1, 100026. Available online: https://linkinghub.elsevier.com/retrieve/pii/S2772753X22000156 (accessed on 13 June 2023).
  19. Salgado, C.R.; Maidana, J.F. Physicochemical characterisation of honey produced in the Chaco province (Argentina). Rev. La Fac. Cienc. Agrar. UNCuyo 2014, 46, 191–201. [Google Scholar]
Figure 1. Principal components analysis of the studied variables: (a) PCA biplot and (b) principal component analysis sedimentation plot.
Blsf 26 00053 g001
Figure 2. Discriminant function plot. Green squares correspond to the Islas del Ibicuy samples, blue squares to the Gualeguaychu samples, and red circles to the Concepción del Uruguay samples. Red crosses correspond to the centroids of each group of observations.
Blsf 26 00053 g002
Table 1. Physicochemical parameters of honey samples (mean ± SD).
ParametersIslas del Ibicuy, n = 54Gualeguaychú, n = 20Concepción del Uruguay, n = 30
Color Index (mm Pfund)60.1 ± 17.4 b87.3 ± 18.5 a85.3 ± 15.3 a
Electrical Conductivity (µS/cm)380.0 ± 1.2 c678.6 ± 1.4 b1064.2 ± 1.4 a
Free Acidity (meq/kg)15.2 ± 2.3 c17.3 ± 2.0 b21.3 ± 2.6 a
pH3.8 ± 0.3 c4.1 ± 0.3 b4.3 ± 0.3 a
Moisture (%)19.3 ± 0.8 a18.4 ± 0.7 b19.3 ± 0.6 a
Ash (%)0.18 ± 0.1 b0.38 ± 0.1 a0.42 ± 0.1 a
a–c Means in the same row with different letters are significantly different at p < 0.05.
Disclaimer/Publisher’s Note: The statements, opinions and data contained in all publications are solely those of the individual author(s) and contributor(s) and not of MDPI and/or the editor(s). MDPI and/or the editor(s) disclaim responsibility for any injury to people or property resulting from any ideas, methods, instructions or products referred to in the content.

