
Factors Influencing Bioactive Constituents in Desi Chickpeas: Variety, Location, and Season †


Abstract
:1. Introduction
2. Materials and Methods
2.1. Seed Material
2.2. Seed Processing and Analysis of Physical Characteristics
2.3. Measurement of Phytochemical Composition
2.4. Statistical Analyses
3. Results and Discussion
3.1. Impact of Chickpea Variety
3.2. Impact of Growing Location
3.3. Impact of Season
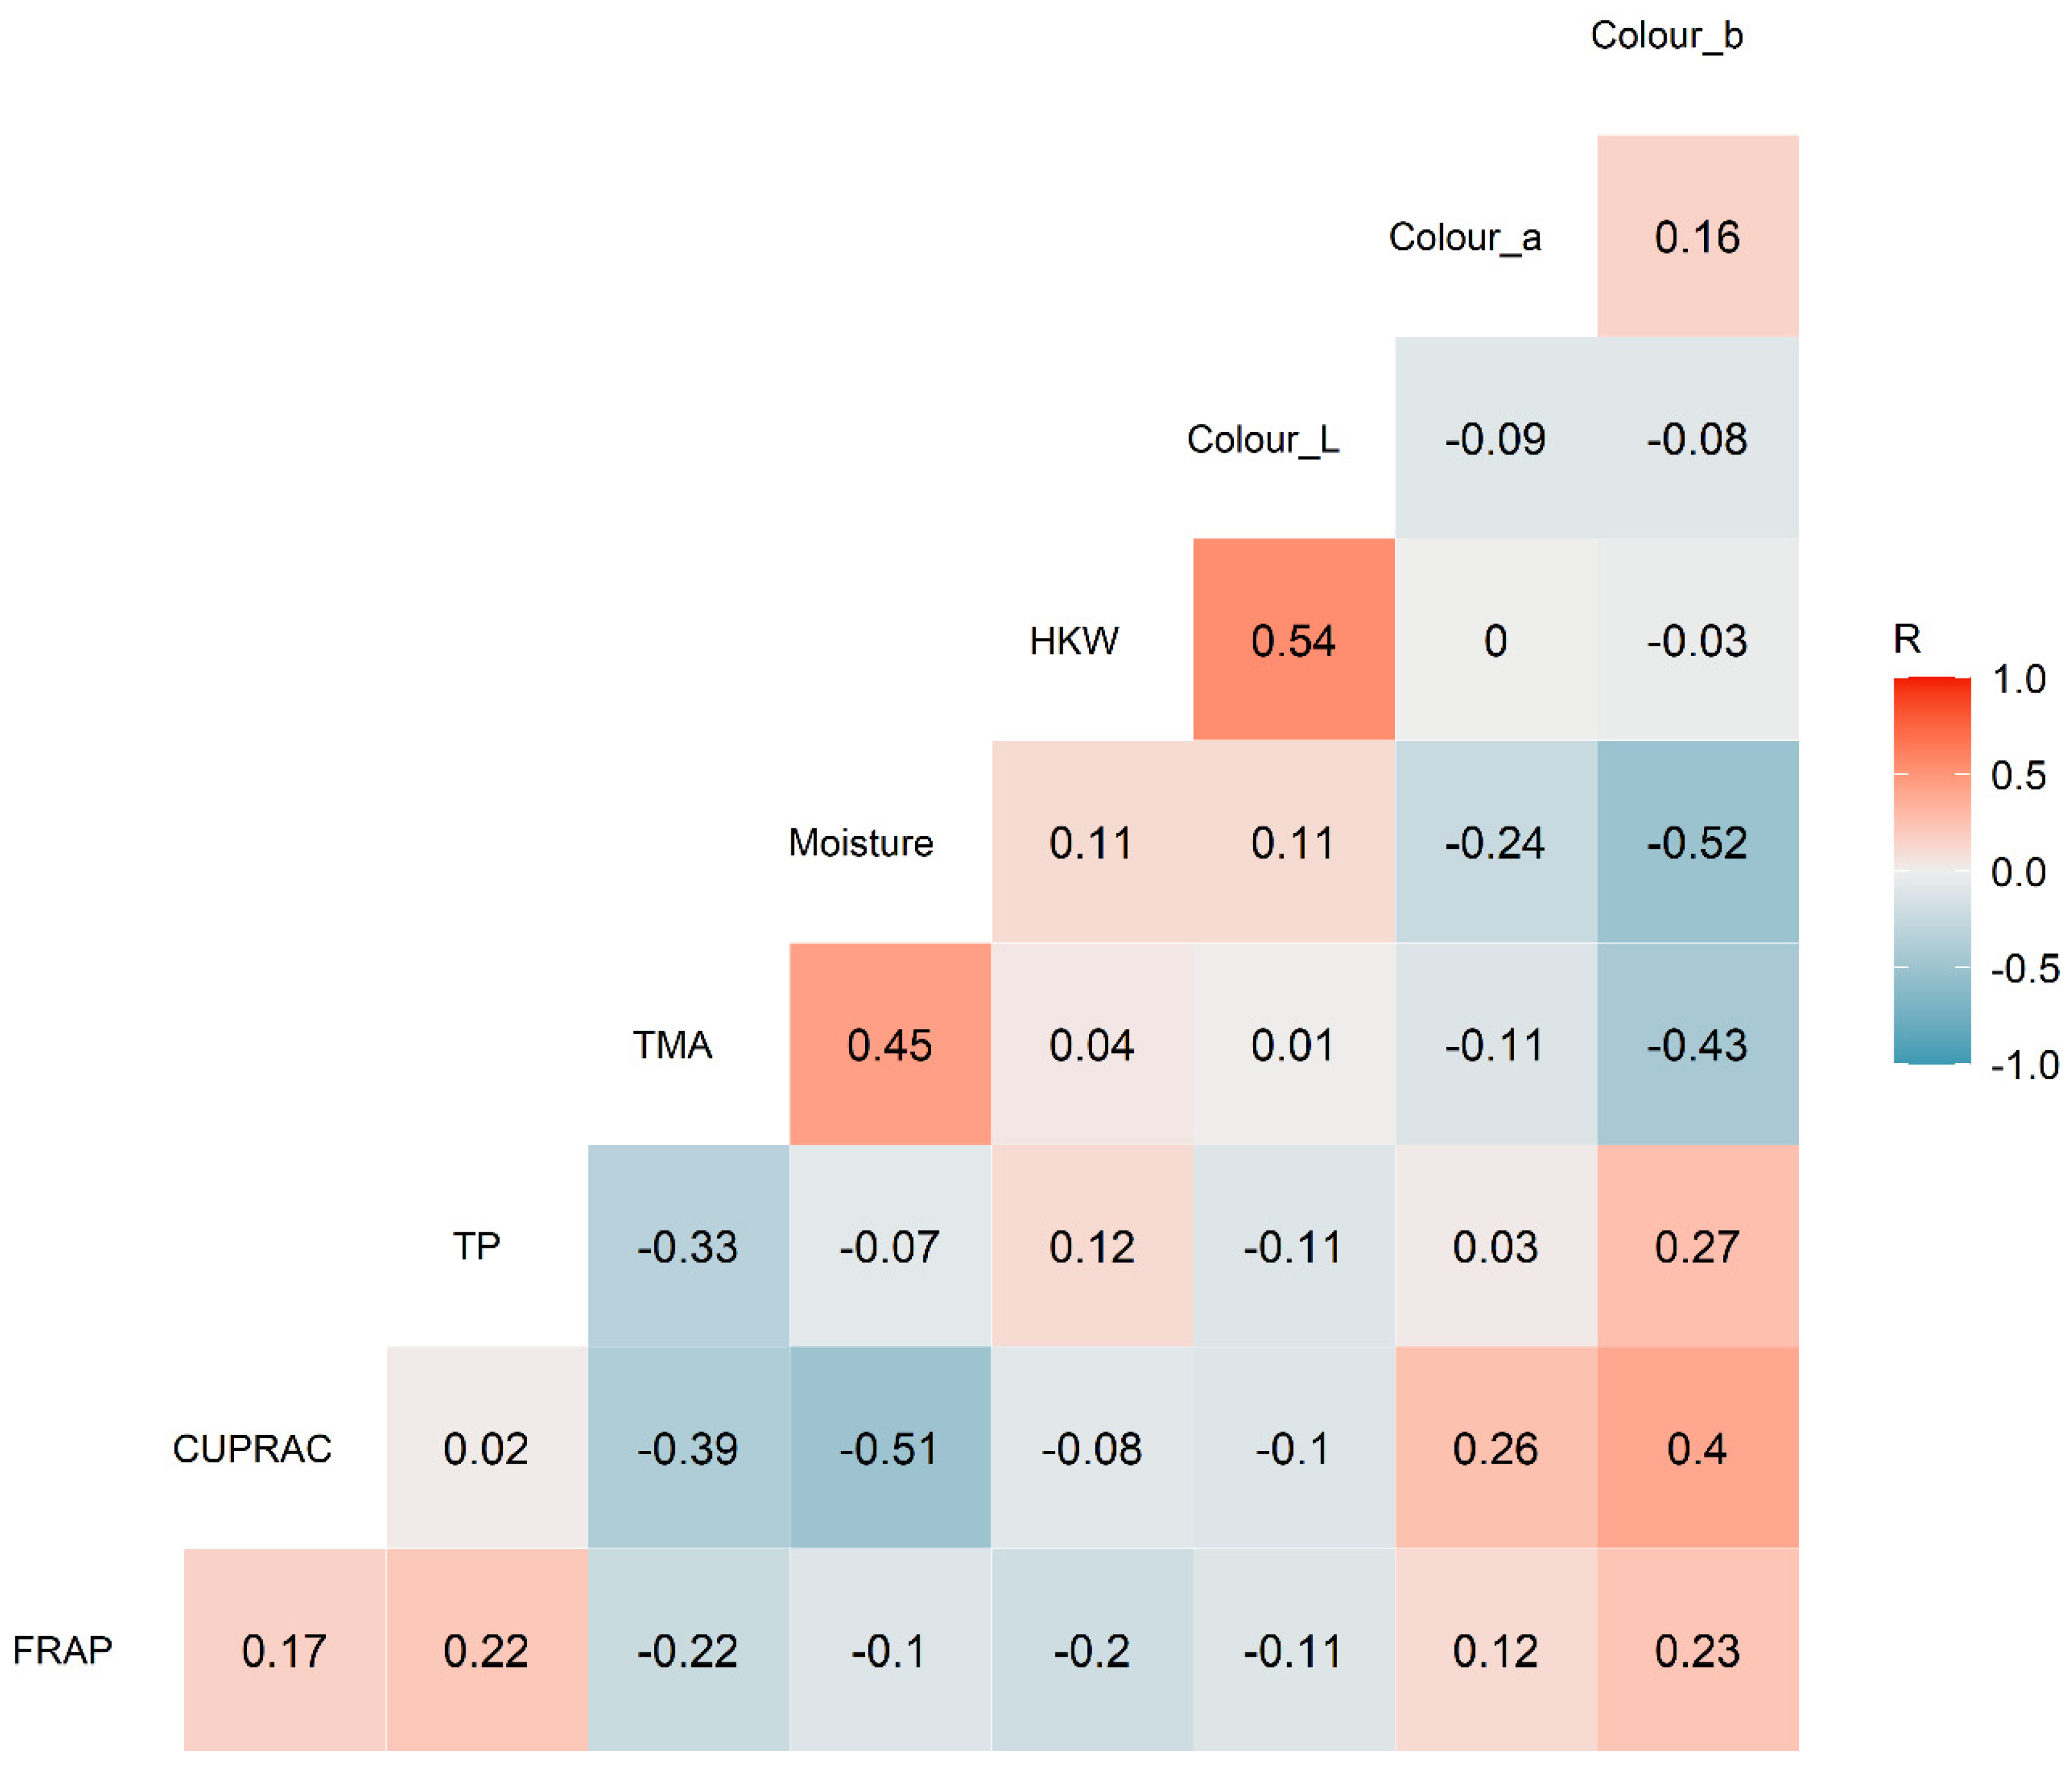
3.4. Correlation Analysis
4. Conclusions
Author Contributions
Funding
Institutional Review Board Statement
Informed Consent Statement
Data Availability Statement
Acknowledgments
Conflicts of Interest
References
- Yadav, S.S.; Chen, W. Chickpea Breeding and Management; CABI: Oxfordshire, UK, 2007. [Google Scholar]
- Abbo, S.; Berger, J.; Turner, N.C. Viewpoint: Evolution of cultivated chickpea: Four bottlenecks limit diversity and constrain adaptation. Funct. Plant Biol. 2003, 30, 1081–1087. [Google Scholar] [CrossRef]
- FAO. FAOSTAT. Available online: http://www.fao.org/faostat/en/#data/QC (accessed on 12 January 2023).
- Pendergast, L.; Bhattarai, S.P.; Midmore, D.J. Evaluation of aerated subsurface drip irrigation on yield, dry weight partitioning and water use efficiency of a broad-acre chickpea (Cicer arietinum, L.) in a vertosol. Agric. Water Manag. 2019, 217, 38–46. [Google Scholar] [CrossRef]
- Siddique, K.; Brinsmead, R.; Knight, R.; Knights, E.; Paull, J.; Rose, I. Adaptation of chickpea (Cicer arietinum L.) and faba bean (Vicia faba L.) to Australia. In Linking Research and Marketing Opportunities for Pulses in the 21st Century; Knight, R., Ed.; Current Plant Science and Biotechnology in Agriculture; Springer: Berlin/Heidelberg, Germany, 2000; pp. 289–303. [Google Scholar]
- Pulse Australia. Chickpea Production: Northern Region. Available online: http://www.pulseaus.com.au/growing-pulses/bmp/chickpea/northern-guide (accessed on 19 March 2023).
- Jain, S.K.; Wettberg, E.J.v.; Punia, S.S.; Parihar, A.K.; Lamichaney, A.; Kumar, J.; Gupta, D.S.; Ahmad, S.; Pant, N.C.; Dixit, G.P.; et al. Genomic-Mediated Breeding Strategies for Global Warming in Chickpeas (Cicer arietinum L.). Agriculture 2023, 13, 1721. [Google Scholar] [CrossRef]
- Wood, J.A.; Scott, J.F. Economic impacts of chickpea grain classification: How ‘seed quality is Queen’ must be considered alongside ‘yield is King’ to provide a princely income for farmers. Crop Pasture Sci. 2021, 72, 136–145. [Google Scholar] [CrossRef]
- Johnson, J.B.; Walsh, K.B.; Bhattarai, S.P.; Naiker, M. Partitioning of nutritional and bioactive compounds between the kernel, hull and husk of five new chickpea genotypes grown in Australia. Future Foods 2021, 4, 100065. [Google Scholar] [CrossRef]
- KPMG. North Queensland Market and Agricultural Supply Chain Study; Townsville Enterprise Limited: Townsville, Australia, 2019. [Google Scholar]
- Clemente, A.; Vioque, J.; Sánchez-Vioque, R.; Pedroche, J.; Bautista, J.; Millán, F. Protein quality of chickpea (Cicer arietinum L.) protein hydrolysates. Food Chem. 1999, 67, 269–274. [Google Scholar] [CrossRef]
- Boukid, F. Chickpea (Cicer arietinum L.) protein as a prospective plant-based ingredient: A review. Int. J. Food Sci. Technol. 2021, 56, 5435–5444. [Google Scholar] [CrossRef]
- Faridy, J.-C.M.; Stephanie, C.-G.M.; Gabriela, M.-M.O.; Cristian, J.-M. Biological Activities of Chickpea in Human Health (Cicer arietinum L.). A Review. Plant Foods Hum. Nutr. 2020, 75, 142–153. [Google Scholar] [CrossRef]
- Wallace, T.C.; Murray, R.; Zelman, K.M. The Nutritional Value and Health Benefits of Chickpeas and Hummus. Nutrients 2016, 8, 766. [Google Scholar] [CrossRef]
- de Camargo, A.C.; Favero, B.T.; Morzelle, M.C.; Franchin, M.; Alvarez-Parrilla, E.; de la Rosa, L.A.; Geraldi, M.V.; Maróstica Júnior, M.R.; Shahidi, F.; Schwember, A.R. Is Chickpea a Potential Substitute for Soybean? Phenolic Bioactives and Potential Health Benefits. Int. J. Mol. Sci. 2019, 20, 2644. [Google Scholar] [CrossRef]
- Kaur, R.; Prasad, K. Technological, processing and nutritional aspects of chickpea (Cicer arietinum)—A review. Trends Food Sci. Technol. 2021, 109, 448–463. [Google Scholar] [CrossRef]
- Domínguez-Arispuro, D.M.; Cuevas-Rodríguez, E.O.; Milán-Carrillo, J.; León-López, L.; Gutiérrez-Dorado, R.; Reyes-Moreno, C. Optimal germination condition impacts on the antioxidant activity and phenolic acids profile in pigmented desi chickpea (Cicer arietinum L.) seeds. J. Food Sci. Technol. 2018, 55, 638–647. [Google Scholar] [CrossRef]
- Gupta, N.; Bisen, P.S.; Bhagyawant, S.S. Chickpea Lectin Inhibits Human Breast Cancer Cell Proliferation and Induces Apoptosis Through Cell Cycle Arrest. Protein Pept. Lett. 2018, 25, 492–499. [Google Scholar] [CrossRef] [PubMed]
- Gupta, N.; Bhagyawant, S.S. Enzymatic treatment improves ACE-I inhibiton and antiproliferative potential of chickpea. Vegetos 2019, 32, 363–369. [Google Scholar] [CrossRef]
- Bochenek, H.F.; Santhakumar, A.B.; Francis, N.; Blanchard, C.L.; Chinkwo, K.A. Anti-cancer effects of chickpea extracts. In Proceedings of the 69th Australasian Grain Science Conference, Melbourne, Australia, 27–29 August 2019. [Google Scholar]
- Myint, H.; Kishi, H.; Koike, S.; Kobayashi, Y. Effect of chickpea husk dietary supplementation on blood and cecal parameters in rats. Anim. Sci. J. 2017, 88, 372–378. [Google Scholar] [CrossRef]
- Yust, M.d.M.; Millán-Linares, M.d.C.; Alcaide-Hidalgo, J.M.; Millán, F.; Pedroche, J. Hypocholesterolaemic and antioxidant activities of chickpea (Cicer arietinum L.) protein hydrolysates. J. Sci. Food Agric. 2012, 92, 1994–2001. [Google Scholar] [CrossRef]
- Akhtar, H.M.S.; Abdin, M.; Hamed, Y.S.; Wang, W.; Chen, G.; Chen, D.; Chen, C.; Li, W.; Mukhtar, S.; Zeng, X. Physicochemical, functional, structural, thermal characterization and α-amylase inhibition of polysaccharides from chickpea (Cicer arietinum L.) hulls. LWT-Food Sci. Technol. 2019, 113, 108265. [Google Scholar] [CrossRef]
- Ercan, P.; El, S.N. Inhibitory effects of chickpea and Tribulus terrestris on lipase, α-amylase and α-glucosidase. Food Chem. 2016, 205, 163–169. [Google Scholar] [CrossRef]
- Sreerama, Y.N.; Sashikala, V.B.; Pratape, V.M. Phenolic compounds in cowpea and horse gram flours in comparison to chickpea flour: Evaluation of their antioxidant and enzyme inhibitory properties associated with hyperglycemia and hypertension. Food Chem. 2012, 133, 156–162. [Google Scholar] [CrossRef]
- Mamilla, R.K.; Mishra, V.K. Effect of germination on antioxidant and ACE inhibitory activities of legumes. LWT-Food Sci. Technol. 2017, 75, 51–58. [Google Scholar] [CrossRef]
- Mokni Ghribi, A.; Sila, A.; Maklouf Gafsi, I.; Blecker, C.; Danthine, S.; Attia, H.; Bougatef, A.; Besbes, S. Structural, functional, and ACE inhibitory properties of water-soluble polysaccharides from chickpea flours. Int. J. Biol. Macromol. 2015, 75, 276–282. [Google Scholar] [CrossRef] [PubMed]
- Mahbub, R.; Francis, N.; Blanchard, C.; Santhakumar, A. The anti-inflammatory and antioxidant properties of chickpea hull phenolic extracts. Food Biosci. 2021, 40, 100850. [Google Scholar] [CrossRef]
- Milán-Noris, A.K.; Gutiérrez-Uribe, J.A.; Santacruz, A.; Serna-Saldívar, S.O.; Martínez-Villaluenga, C. Peptides and isoflavones in gastrointestinal digests contribute to the anti-inflammatory potential of cooked or germinated desi and kabuli chickpea (Cicer arietinum L.). Food Chem. 2018, 268, 66–76. [Google Scholar] [CrossRef] [PubMed]
- Heiras-Palazuelos, M.J.; Ochoa-Lugo, M.I.; Gutiérrez-Dorado, R.; López-Valenzuela, J.A.; Mora-Rochín, S.; Milán-Carrillo, J.; Garzón-Tiznado, J.A.; Reyes-Moreno, C. Technological properties, antioxidant activity and total phenolic and flavonoid content of pigmented chickpea (Cicer arietinum L.) cultivars. Int. J. Food Sci. Nutr. 2013, 64, 69–76. [Google Scholar] [CrossRef] [PubMed]
- Sharma, S.; Yadav, N.; Singh, A.; Kumar, R. Nutritional and antinutritional profile of newly developed chickpea (Cicer arietinum L.) varieties. Int. Food Res. J. 2013, 20, 805–810. [Google Scholar]
- Quintero-Soto, M.F.; Saracho-Peña, A.G.; Chavez-Ontiveros, J.; Garzon-Tiznado, J.A.; Pineda-Hidalgo, K.V.; Delgado-Vargas, F.; Lopez-Valenzuela, J.A. Phenolic profiles and their contribution to the antioxidant activity of selected chickpea genotypes from Mexico and ICRISAT collections. Plant Foods Hum. Nutr. 2018, 73, 122–129. [Google Scholar] [CrossRef]
- Rezaei, M.K.; Deokar, A.A.; Arganosa, G.; Roorkiwal, M.; Pandey, S.K.; Warkentin, T.D.; Varshney, R.K.; Tar’an, B. Mapping Quantitative Trait Loci for Carotenoid Concentration in Three F2 Populations of Chickpea. Plant Genome 2019, 12, 190067. [Google Scholar] [CrossRef] [PubMed]
- Serrano, C.; Carbas, B.; Castanho, A.; Soares, A.; Patto, M.C.V.; Brites, C. Characterisation of nutritional quality traits of a chickpea (Cicer arietinum) germplasm collection exploited in chickpea breeding in Europe. Crop Pasture Sci. 2017, 68, 1031–1040. [Google Scholar] [CrossRef]
- Bhagyawant, S.S.; Gautam, A.K.; Narvekar, D.T.; Gupta, N.; Bhadkaria, A.; Srivastava, N.; Upadhyaya, H.D. Biochemical diversity evaluation in chickpea accessions employing mini-core collection. Physiol. Mol. Biol. Plants 2018, 24, 1165–1183. [Google Scholar] [CrossRef]
- Valente, I.M.; Maia, M.R.G.; Malushi, N.; Oliveira, H.M.; Papa, L.; Rodrigues, J.A.; Fonseca, A.J.M.; Cabrita, A.R.J. Profiling of phenolic compounds and antioxidant properties of European varieties and cultivars of Vicia faba L. pods. Phytochemistry 2018, 152, 223–229. [Google Scholar] [CrossRef]
- Kim, J.-K.; Kim, E.-H.; Lee, O.-K.; Park, S.-Y.; Lee, B.; Kim, S.-H.; Park, I.; Chung, I.-M. Variation and correlation analysis of phenolic compounds in mungbean (Vigna radiata L.) varieties. Food Chem. 2013, 141, 2988–2997. [Google Scholar] [CrossRef]
- Xiang, J.; Apea-Bah, F.B.; Ndolo, V.U.; Katundu, M.C.; Beta, T. Profile of phenolic compounds and antioxidant activity of finger millet varieties. Food Chem. 2019, 275, 361–368. [Google Scholar] [CrossRef] [PubMed]
- Johnson, J. Investigation of the Phenolic and Antioxidant Content in Australian Grains Using Traditional and Non-Invasive Analytical Techniques. Master’s Thesis, CQUniversity, Rockhampton, Australia, 2022. [Google Scholar]
- R Core Team. R: A Language and Environment for Statistical Computing, version 4.2.3; R Foundation for Statistical Computing: Vienna, Austria, 2023.
- Johnson, J.; Collins, T.; Skylas, D.; Quail, K.; Blanchard, C.; Naiker, M. Profiling the varietal antioxidative content and macrochemical composition in Australian faba beans (Vicia faba L.). Legume Sci. 2020, 2, e28. [Google Scholar] [CrossRef]
- Johnson, J.; Collins, T.; Skylas, D.; Naiker, M. ATR-MIR: A valuable tool for the rapid assessment of biochemically active compounds in grains. In Proceedings of the 69th Australasian Grain Science Conference, Melbourne, Australia, 27–29 August 2019; pp. 73–79. [Google Scholar]
- Segev, A.; Badani, H.; Galili, L.; Hovav, R.; Kapulnik, Y.; Shomer, I.; Galili, S. Total Phenolic Content and Antioxidant Activity of Chickpea (Cicer arietinum L.) as Affected by Soaking and Cooking Conditions. Food Nutr. Sci. 2011, 2, 724–730. [Google Scholar] [CrossRef]
- Nasar-Abbas, S.; Siddique, K.; Plummer, J.; White, P.; Harris, D.; Dods, K.; D’antuono, M. Faba bean (Vicia faba L.) seeds darken rapidly and phenolic content falls when stored at higher temperature, moisture and light intensity. LWT-Food Sci. Technol. 2009, 42, 1703–1711. [Google Scholar] [CrossRef]
- Ziegler, V.; Vanier, N.L.; Ferreira, C.D.; Paraginski, R.T.; Monks, J.L.F.; Elias, M.C. Changes in the Bioactive Compounds Content of Soybean as a Function of Grain Moisture Content and Temperature during Long-Term Storage. J. Food Sci. 2016, 81, H762–H768. [Google Scholar] [CrossRef]
- Johnson, J.B. Phenolics in Australian Grain Crops. Mendeley Data, v. 1, 2022. Available online: https://data.mendeley.com/datasets/8bb2d725sd/1 (accessed on 12 October 2023).

| Parameters | Howzat (n = 10) | Kyabra (n = 14) | PBA Slasher (n = 11) | PBA Striker (n = 20) | Sonali (n = 10) | p Value |
|---|---|---|---|---|---|---|
| HKW (g/100) | 18.6 ± 1.7 bc | 23.0 ± 1.9 a | 18.8 ± 1.2 bc | 20.2 ± 2.6 b | 16.6 ± 0.8 c | <0.001 *** |
| Flour colour—L* | 78.05 ± 1.41 | 80.66 ± 0.79 | 78.18 ± 6.30 | 79.28 ± 1.37 | 77.72 ± 1.10 | 0.066 NS |
| Flour colour—a* | 1.93 ± 0.86 | 1.74 ± 0.39 | 1.78 ± 0.20 | 1.41 ± 0.60 | 1.51 ± 0.41 | 0.096 NS |
| Flour colour—b* | 27.04 ± 1.65 a | 26.09 ± 1.28 ab | 24.96 ± 1.27 b | 26.27 ± 1.52 ab | 26.44 ± 0.30 ab | 0.013 * |
| Moisture (%) | 9.21 ± 0.86 | 9.13 ± 0.83 | 9.24 ± 0.83 | 8.86 ± 0.72 | 8.39 ± 0.75 | 0.087 NS |
| FRAP (mg TE/100 g) | 40.3 ± 16.2 a | 29.5 ± 6.7 ab | 24.9 ± 8.9 b | 33.1 ± 10.4 ab | 28.5 ± 13.3 ab | 0.028 * |
| CUPRAC (mg TE/100 g) | 124 ± 20 | 129 ± 21 | 123 ± 17 | 132 ± 42 | 150 ± 26 | 0.232 NS |
| TPC (mg GAE/100 g) | 93.7 ± 11.6 a | 80.3 ± 14.1 ab | 72.6 ± 8.8 b | 91.1 ± 9.5 a | 82.2 ± 13.7 ab | <0.001 *** |
| TMAC (mg cyd-3-glu/100 g) | 5.8 ± 1.5 ab | 5.0 ± 3.2 ab | 7.2 ± 1.5 a | 4.2 ± 2.0 b | 4.5 ± 1.4 b | 0.006 ** |
| Parameters | Banyena (n = 25) | Curyo (n = 18) | Horsham (n = 49) | p Value |
|---|---|---|---|---|
| HKW (g/100) | 20.1 ± 2.6 a | 17.4 ± 1.2 b | 19.8 ± 3.1 a | 0.003 ** |
| Flour colour—L* | 79.80 ± 1.06 a | 77.81 ± 1.17 b | 79.70 ± 1.46 a | <0.001 *** |
| Flour colour—a* | 1.67 ± 0.25 a | 1.26 ± 0.74 b | 1.98 ± 0.56 a | <0.001 *** |
| Flour colour—b* | 24.95 ± 0.68 c | 26.86 ± 1.04 b | 27.77 ± 0.98 a | <0.001 *** |
| Moisture (%) | 9.34 ± 0.51 a | 9.05 ± 0.48 a | 8.20 ± 0.96 b | <0.001 *** |
| FRAP (mg TE/100 g) | 27.0 ± 6.9 b | 38.3 ± 13.9 a | 34.9 ± 11.6 a | 0.002 ** |
| CUPRAC (mg TE/100 g) | 114 ± 18 b | 133 ± 23 b | 157 ± 36 a | <0.001 *** |
| TPC (mg GAE/100 g) | 74.1 ± 6.9 b | 92.8 ± 13.9 a | 87.0 ± 11.6 a | <0.001 *** |
| TMAC (mg cyd-3-glu/100 g) | 6.6 ± 2.5 a | 5.0 ± 1.5 b | 3.5 ± 1.4 c | <0.001 *** |
| Parameters | 2017 (n = 30) | 2019 (n = 53) | 2020 (n = 14) | p Value |
|---|---|---|---|---|
| HKW (g/100) | 20.2 ± 2.4 a | 19.3 ± 2.8 a | 18.5 ± 3.1 a | 0.003 ** |
| Flour colour—L* | 80.00 ± 1.14 a | 79.09 ± 1.71 b | 79.57 ± 1.12 ab | <0.001 *** |
| Flour colour—a* | 1.68 ± 0.27 b | 1.62 ± 0.65 b | 2.42 ± 0.40 a | <0.001 *** |
| Flour colour—b* | 24.82 ± 0.74 b | 27.54 ± 1.12 a | 27.48 ± 0.88 a | <0.001 *** |
| Moisture (%) | 9.46 ± 0.56 a | 8.45 ± 0.97 b | 8.35 ± 0.81 b | <0.001 *** |
| FRAP (mg TE/100 g) | 26.9 ± 6.4 c | 33.8 ± 11.9 b | 43.7 ± 10.1 a | 0.002 ** |
| CUPRAC (mg TE/100 g) | 116 ± 18 c | 142 ± 32 b | 181 ± 28 a | <0.001 *** |
| TPC (mg GAE/100 g) | 76.4 ± 8.8 b | 88.7 ± 12.2 a | 88.3 ± 10.6 a | <0.001 *** |
| TMAC (mg cyd-3-glu/100 g) | 6.4 ± 2.4 a | 4.0 ± 1.6 b | 3.6 ± 1.0 b | <0.001 *** |
Disclaimer/Publisher’s Note: The statements, opinions and data contained in all publications are solely those of the individual author(s) and contributor(s) and not of MDPI and/or the editor(s). MDPI and/or the editor(s) disclaim responsibility for any injury to people or property resulting from any ideas, methods, instructions or products referred to in the content. |
© 2023 by the authors. Licensee MDPI, Basel, Switzerland. This article is an open access article distributed under the terms and conditions of the Creative Commons Attribution (CC BY) license (https://creativecommons.org/licenses/by/4.0/).
Share and Cite
Johnson, J.B.; Naiker, M. Factors Influencing Bioactive Constituents in Desi Chickpeas: Variety, Location, and Season. Biol. Life Sci. Forum 2023, 26, 5. https://doi.org/10.3390/Foods2023-14994
Johnson JB, Naiker M. Factors Influencing Bioactive Constituents in Desi Chickpeas: Variety, Location, and Season. Biology and Life Sciences Forum. 2023; 26(1):5. https://doi.org/10.3390/Foods2023-14994
Chicago/Turabian StyleJohnson, Joel B., and Mani Naiker. 2023. "Factors Influencing Bioactive Constituents in Desi Chickpeas: Variety, Location, and Season" Biology and Life Sciences Forum 26, no. 1: 5. https://doi.org/10.3390/Foods2023-14994
APA StyleJohnson, J. B., & Naiker, M. (2023). Factors Influencing Bioactive Constituents in Desi Chickpeas: Variety, Location, and Season. Biology and Life Sciences Forum, 26(1), 5. https://doi.org/10.3390/Foods2023-14994