
Meta-Analysis of RNA-Seq Data Identifies Potent Biomarkers for Intellectual Disability Disorder (IDD) †

Abstract
:1. Introduction
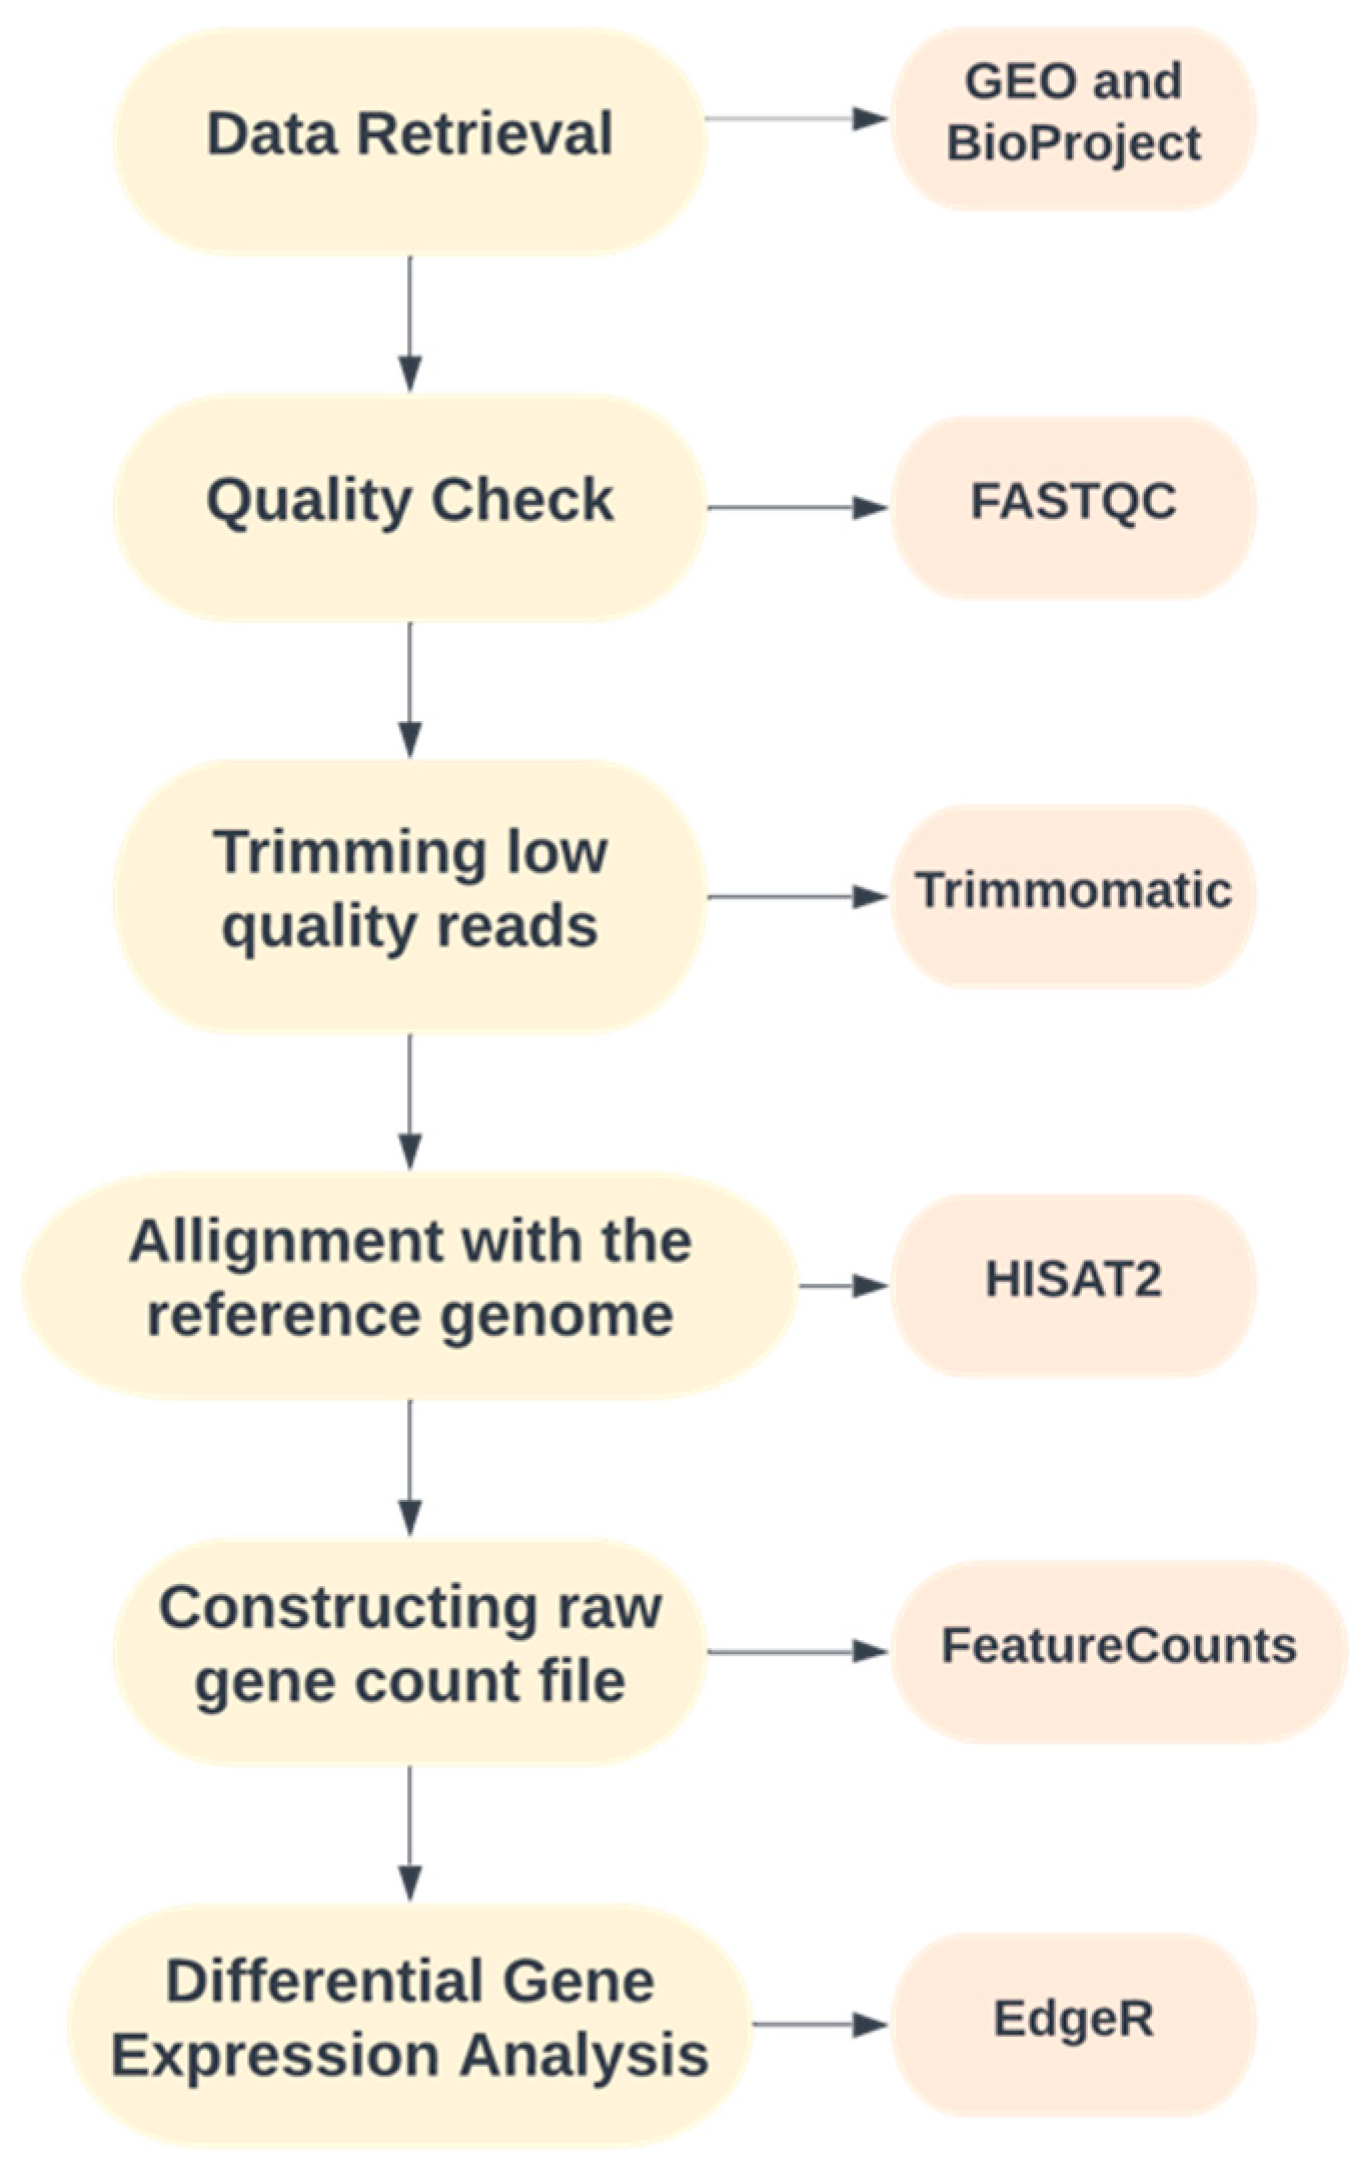
2. Methods
2.1. Data Retrieval
2.2. Quality Control, Trimming and Alignment
2.3. Differential Gene Expression Analysis
3. Results and Discussion
3.1. Data Retrieved
3.2. Pre-Processing and Alignment
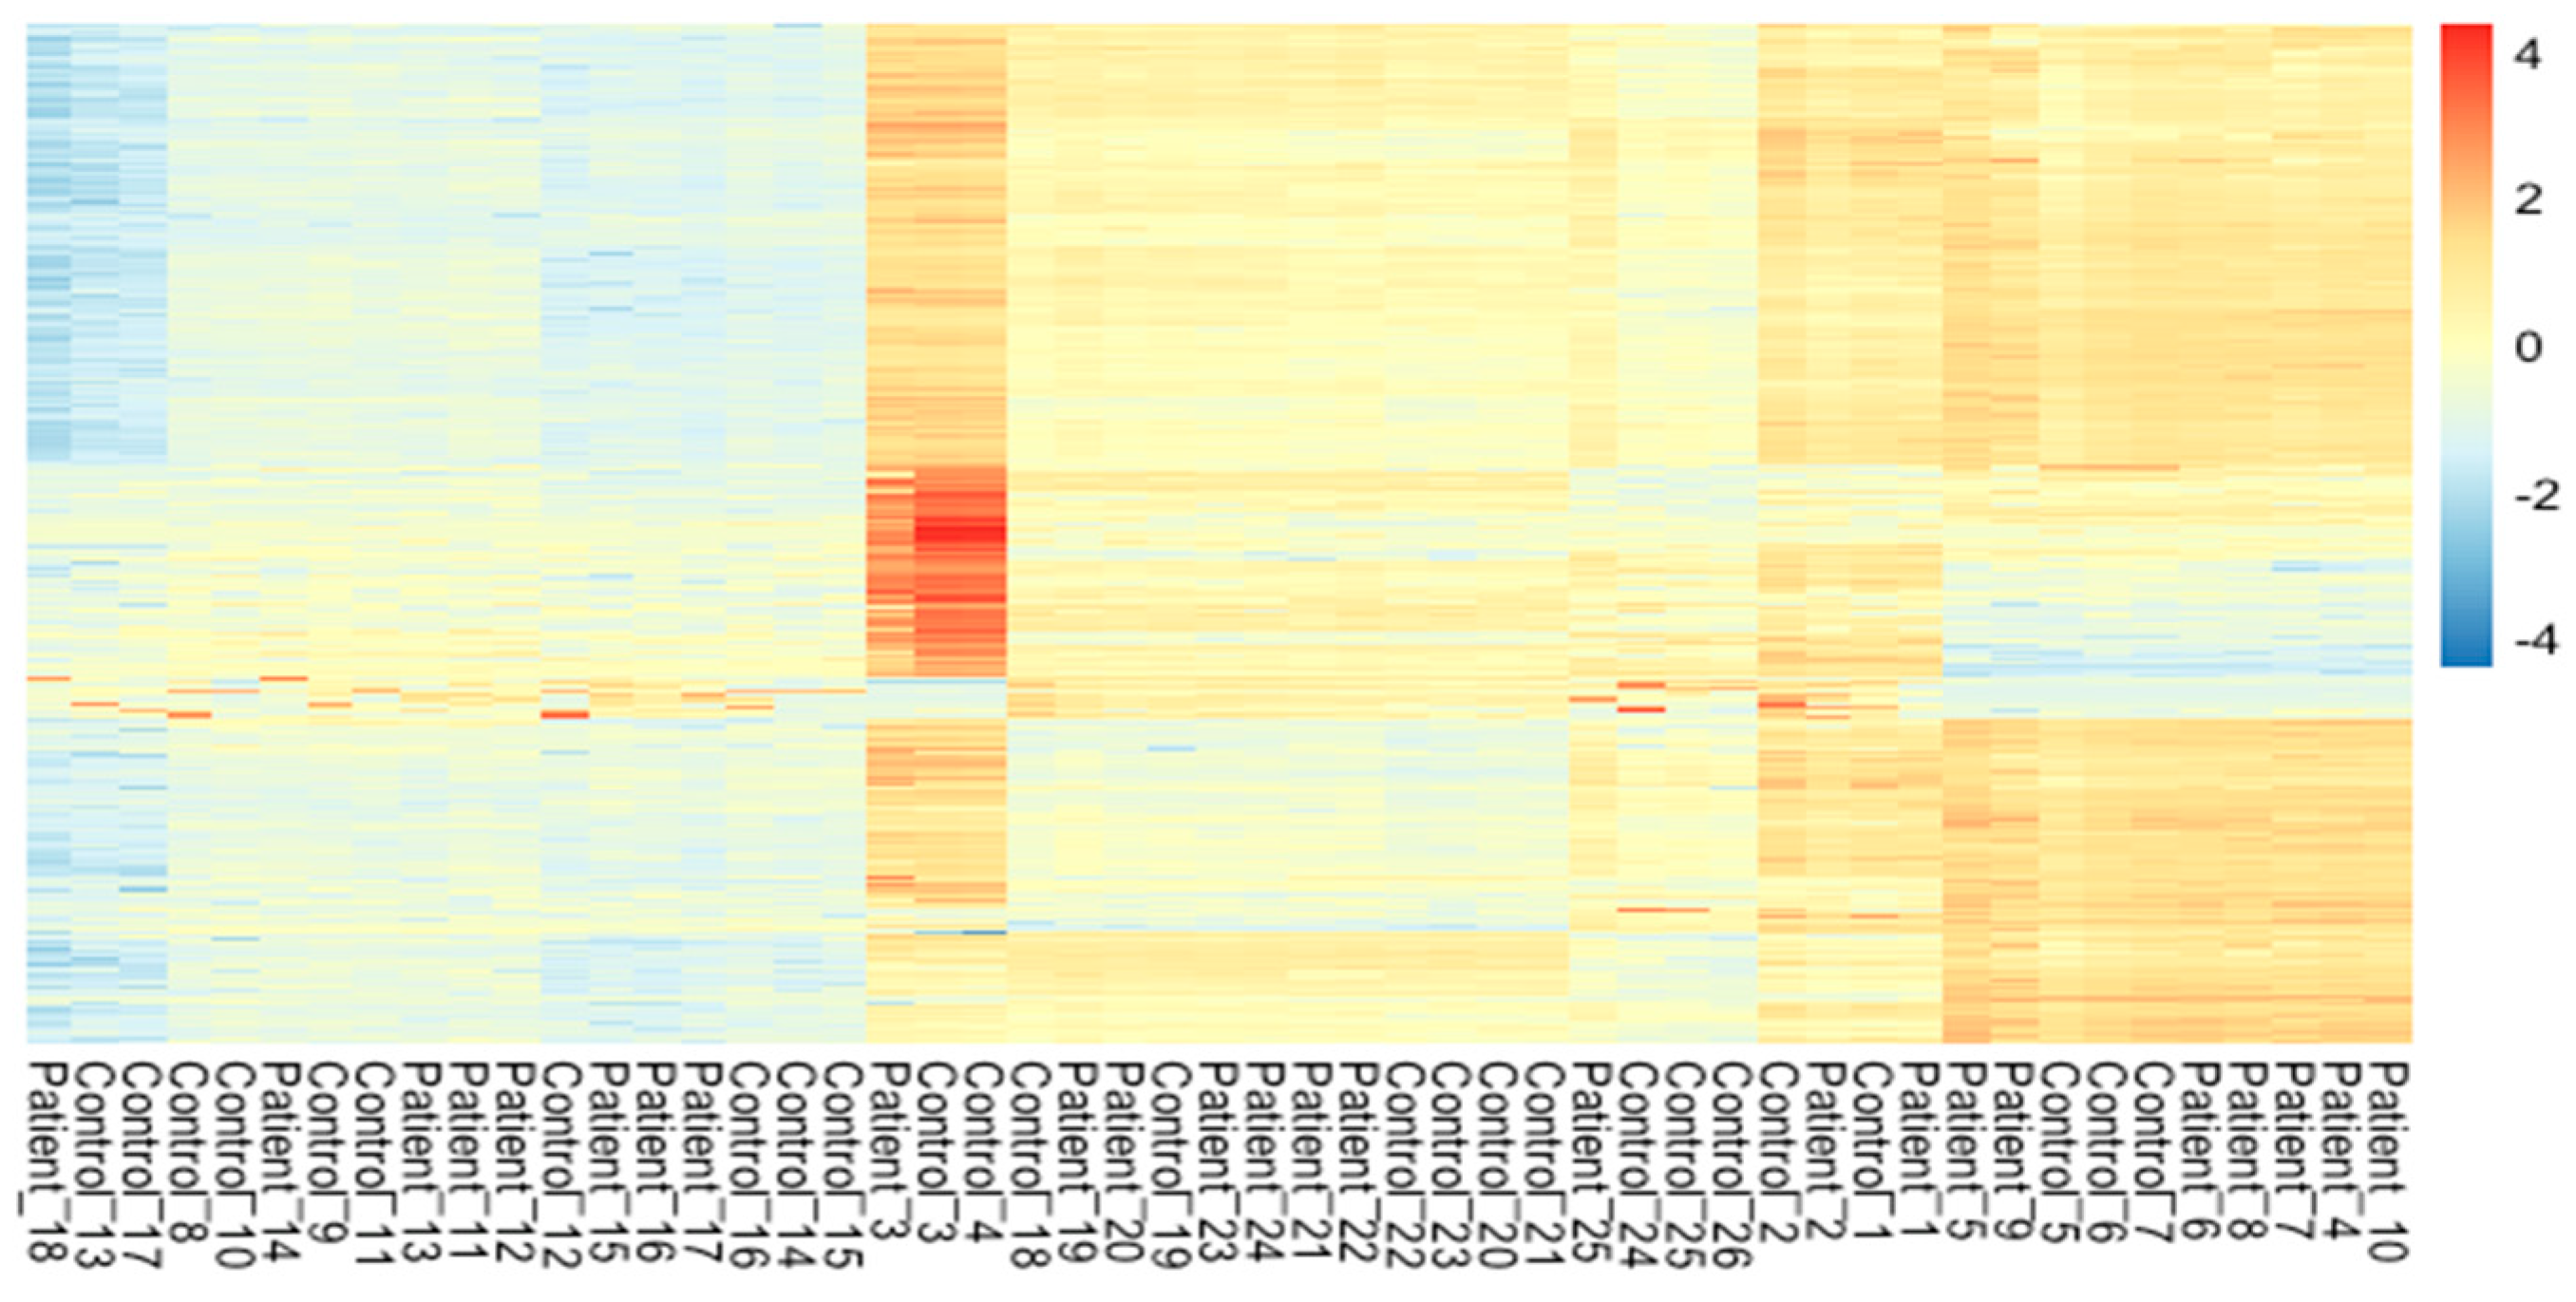
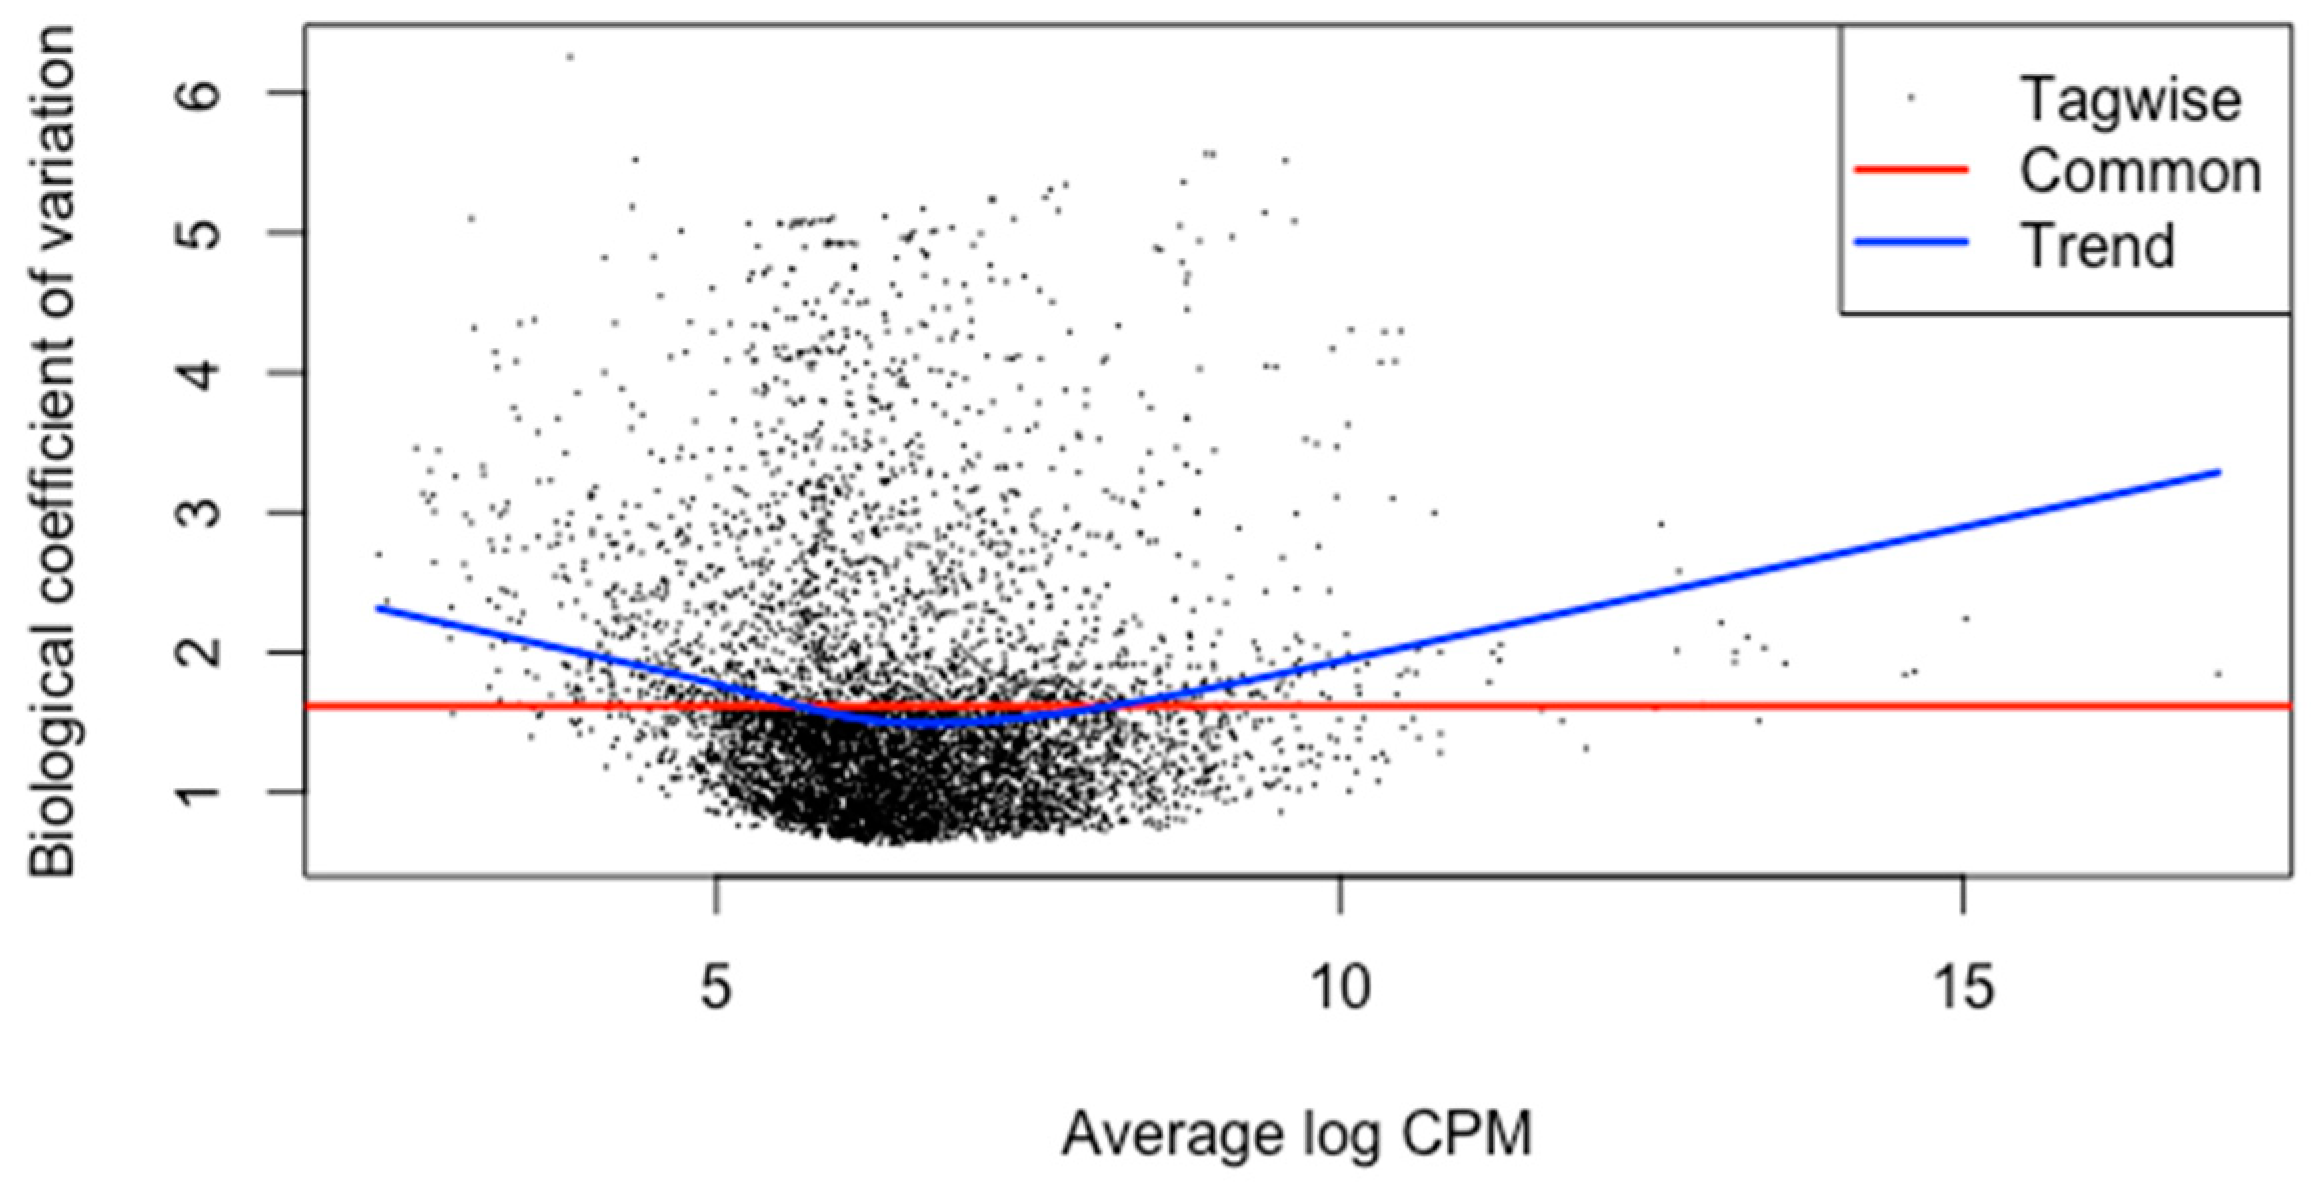
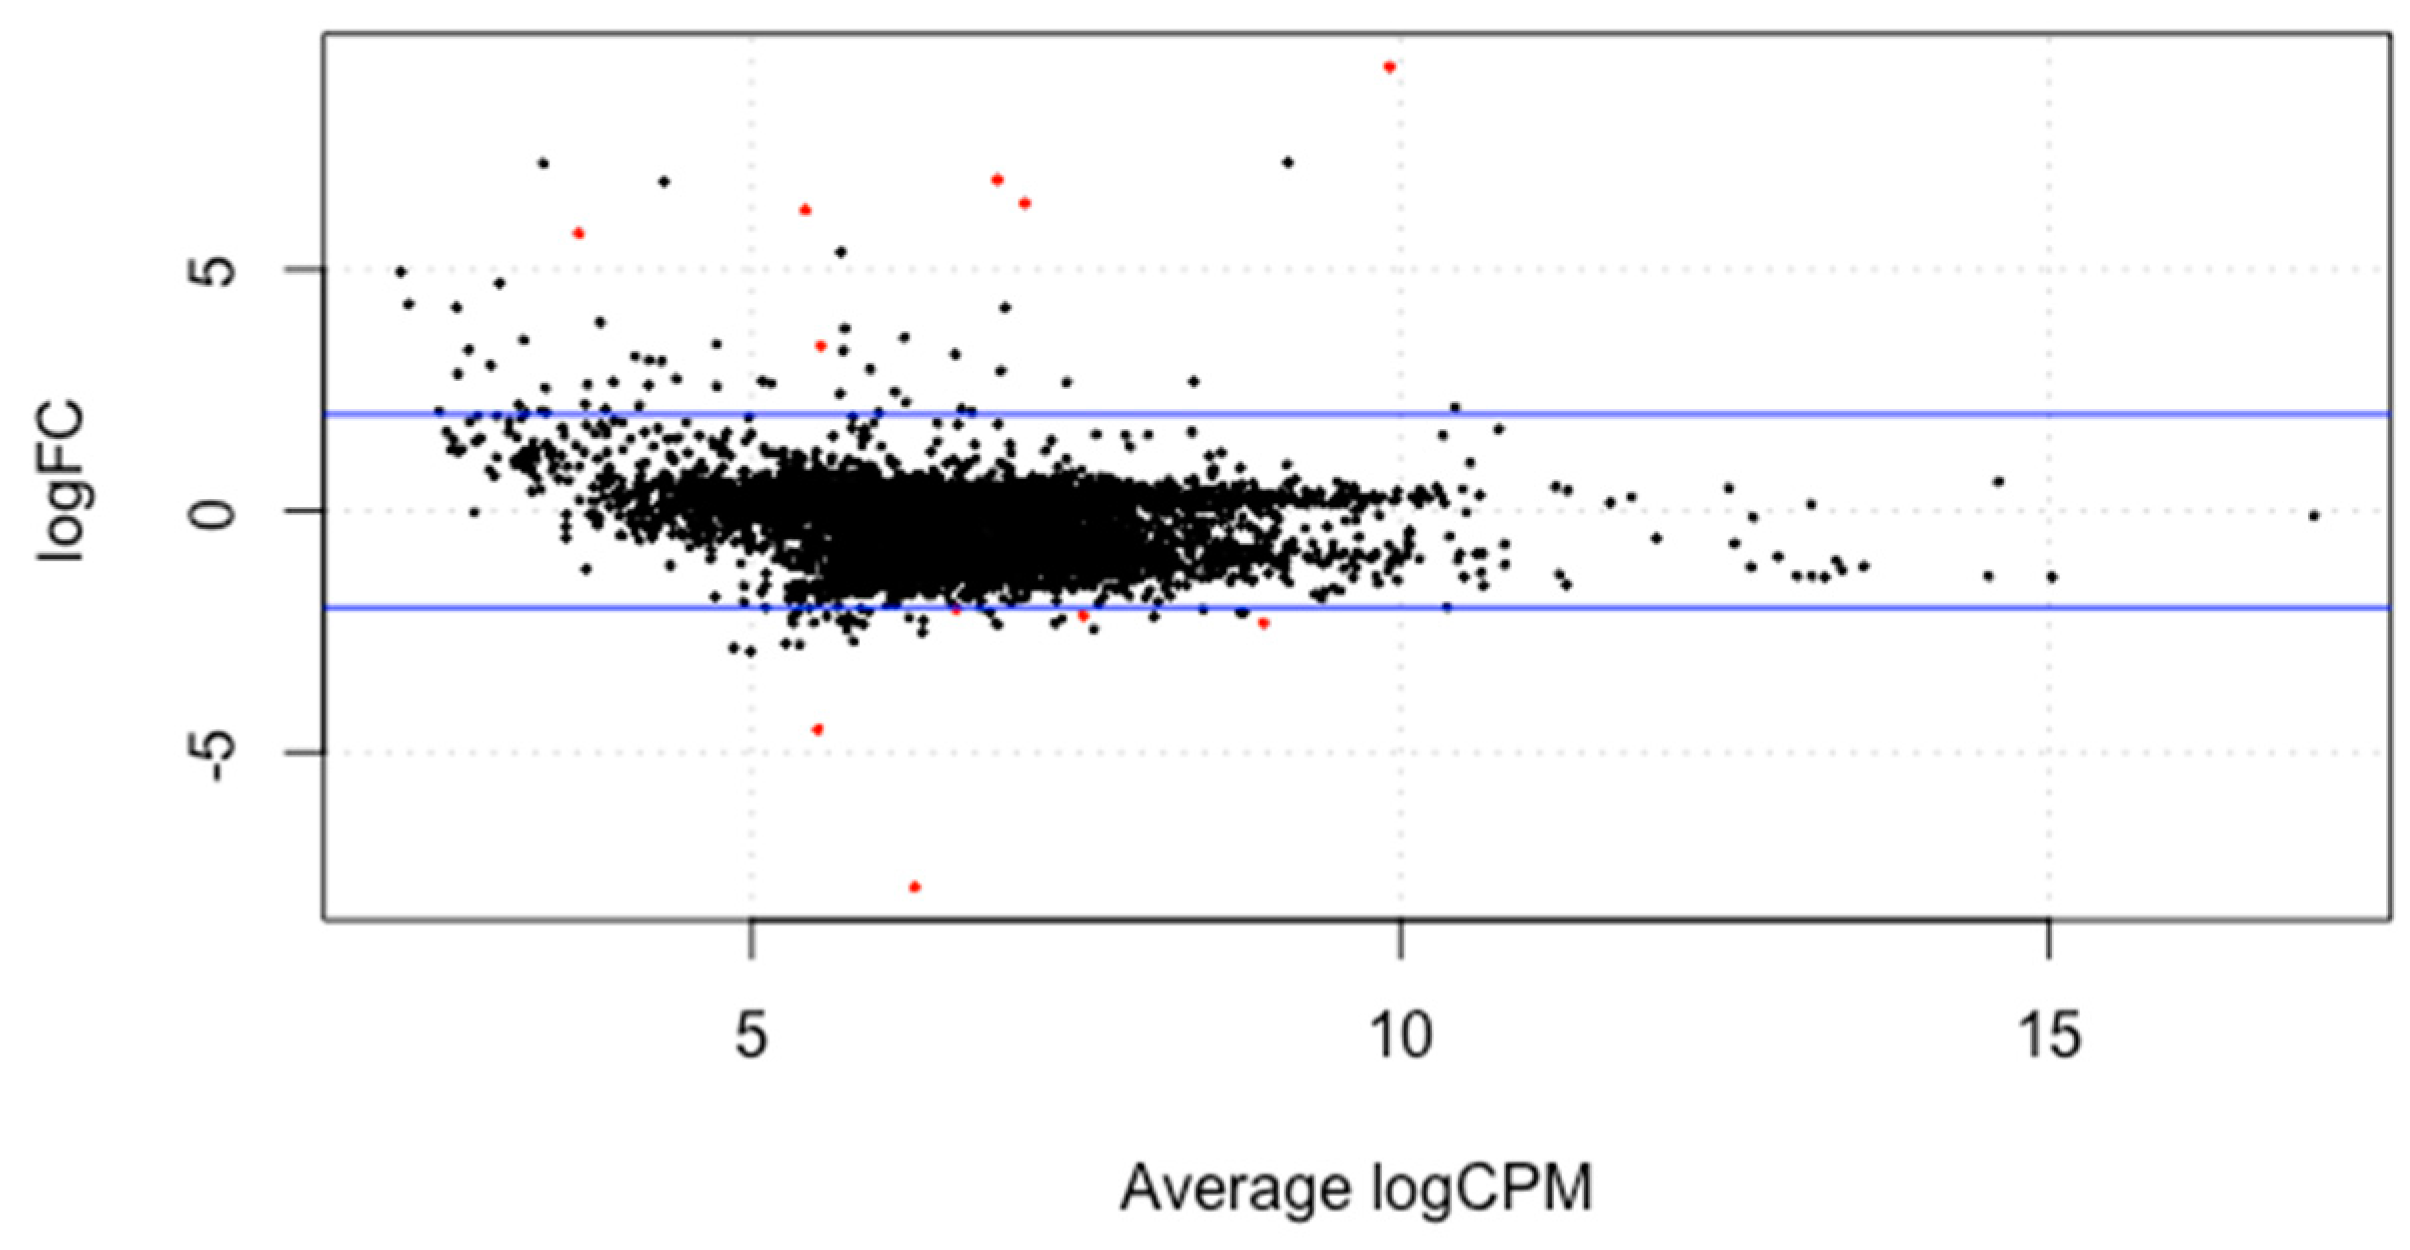
3.3. Differential Gene Expression Analysis
4. Conclusions
Author Contributions
Funding
Institutional Review Board Statement
Informed Consent Statement
Data Availability Statement
Conflicts of Interest
References
- Mortazavi, A.; Williams, B.A.; McCue, K.; Schaeffer, L. Wold B: Mapping and quantifying mammalian transcriptomes by RNA-Seq. Nat. Methods 2008, 5, 621–628. [Google Scholar] [CrossRef] [PubMed]
- Berger, M.F.; Levin, J.Z.; Vijayendran, K.; Sivachenko, A.; Adiconis, X.; Maguire, J.; Johnson, L.A.; Robinson, J.; Verhaak, R.G.; Sougnez, C.; et al. Integrative analysis of the melanoma transcriptome. Genome Res. 2010, 20, 413–427. [Google Scholar] [CrossRef] [PubMed]
- Rapaport, F.; Khanin, R.; Liang, Y.; Pirun, M.; Krek, A.; Zumbo, P.; Mason, C.E.; Socci, N.D.; Betel, D. Comprehensive evaluation of differential gene expression analysis methods for RNA-seq data. Genome Biol. 2013, 14, 3158. [Google Scholar] [CrossRef] [PubMed]
- Clough, E.; Barrett, T. The Gene Expression Omnibus Database. Methods Mol. Biol. 2016, 1418, 93–110. [Google Scholar] [CrossRef] [PubMed]
- Leinonen, R.; Sugawara, H.; Shumway, M. International Nucleotide Sequence Database Collaboration. The sequence read archive. Nucleic Acids Res. 2011, 39, D19–D21. [Google Scholar] [CrossRef] [PubMed]
- Barrett, T.; Clark, K.; Gevorgyan, R.; Gorelenkov, V.; Gribov, E.; Karsch-Mizrachi, I.; Kimelman, M.; Pruitt, K.D.; Resenchuk, S.; Tatusova, T.; et al. BioProject and BioSample databases at NCBI: Facilitating capture and organization of metadata. Nucleic Acids Res. 2012, 40, D57–D63. [Google Scholar] [CrossRef] [PubMed]
- Andrews, S. FastQC A Quality Control Tool for High throughput Sequence Data. Available online: http://www.bioinformatics.babraham.ac.uk/projects/fastqc/ (accessed on 29 September 2022).
- Bolger, A.M.; Lohse, M.; Usadel, B. Trimmomatic: A flexible trimmer for Illumina Sequence Data. Bioinformatics 2014, 30, 2114–2120. [Google Scholar] [CrossRef] [PubMed]
- Jalili, V.; EnisAfgan; Gu, Q.; Clements, D.; Blankenberg, D.; Goecks, J.; Taylor, J.; Nekrutenko, A. The Galaxy platform for accessible, reproducible and collaborative biomedical analyses: 2020 update. Nucleic Acids Res. 2020, 48, 8205–8207. [Google Scholar] [CrossRef] [PubMed]
- Kim, D.; Langmead, B.; Salzberg, S.L. HISAT: A fast spliced aligner with low memory requirements. Nat. Methods 2015, 12, 357–360. [Google Scholar] [CrossRef] [PubMed]
- Liao, Y.; Smyth, G.K.; Shi, W. featureCounts: An efficient general purpose program for assigning sequence reads to genomic features. Bioinformatics 2013, 30, 923–930. [Google Scholar] [CrossRef] [PubMed]
- McCarthy, D.J.; Chen, Y.; Smyth, G.K. Differential expression analysis of multifactor RNA-Seq experiments with respect to biological variation. Nucleic Acids Res. 2012, 40, 4288–4297. [Google Scholar] [CrossRef] [PubMed]
- RStudio Team. RStudio: Integrated Development for R. RStudio; PBC: Boston, MA, USA, 2020; Available online: http://www.rstudio.com/ (accessed on 29 September 2022).
- Robinson, M.D.; McCarthy, D.J.; Smyth, G.K. edgeR: A Bioconductor package for differential expression analysis of digital gene expression data. Bioinformatics 2010, 26, 139–140. [Google Scholar] [CrossRef] [PubMed]
- Maduro, V.; Pusey, B.N.; Cherukuri, P.F.; Atkins, P.; du Souich, C.; Rupps, R.; Limbos, M.; Adams, D.R.; Bhatt, S.S.; Eydoux, P.; et al. Complex translocation disrupting TCF4 and altering TCF4 isoform expression segregates as mild autosomal dominant intellectual disability. Orphanet J. Rare Dis. 2016, 11, 62. [Google Scholar] [CrossRef] [PubMed]
- Harms, F.L.; Girisha, K.M.; Hardigan, A.A.; Kortüm, F.; Shukla, A.; Alawi, M.; Dalal, A.; Brady, L.; Tarnopolsky, M.; Bird, L.M.; et al. Mutations in EBF3 Disturb Transcriptional Profiles and Cause Intellectual Disability, Ataxia, and Facial Dysmorphism. Am. J. Hum. Genet. 2017, 100, 117–127. [Google Scholar] [CrossRef] [PubMed]
- Gabriele, M.; Vulto-van Silfhout, A.T.; Germain, P.L.; Vitriolo, A.; Kumar, R.; Douglas, E.; Haan, E.; Kosaki, K.; Takenouchi, T.; Rauch, A.; et al. YY1 Haploinsufficiency Causes an Intellectual Disability Syndrome Featuring Transcriptional and Chromatin Dysfunction. Am. J. Hum. Genet. 2017, 100, 907–925. [Google Scholar] [CrossRef] [PubMed]
- Lee, Y.R.; Khan, K.; Armfield-Uhas, K.; Srikanth, S.; Thompson, N.A.; Pardo, M.; Yu, L.; Norris, J.W.; Peng, Y.; Gripp, K.W.; et al. Mutations in FAM50A suggest that Armfield XLID syndrome is a spliceosomopathy. Nat. Commun. 2020, 11, 3698. [Google Scholar] [CrossRef] [PubMed]


| Accession ID | Number of Control Samples | Number of Patient Samples | Cell/Tissue Type | Type of ID | Reference |
|---|---|---|---|---|---|
| GSE77742 | 2 | 1 | Skin fibroblast | ADID | [15] |
| GSE74263 | 2 | 2 | Lymphocytes | XID | |
| GSE90682 | 3 | 7 | SK-N-SH Cell line | ARID | [16] |
| GSE98476 | 10 | 8 | Immortalized lymphoblastoid cell line (LC) | Idiopathic ID | [17] |
| GSE108887 | 6 | 6 | Blood | ARID | |
| PRJEB21964 | 3 | 1 | Peripheral blood mononuclear cell | Idiopathic XID | |
| GSE145710 | 3 | 6 | Transformed Lymphocyte Cell Line | XID | [18] |
Disclaimer/Publisher’s Note: The statements, opinions and data contained in all publications are solely those of the individual author(s) and contributor(s) and not of MDPI and/or the editor(s). MDPI and/or the editor(s) disclaim responsibility for any injury to people or property resulting from any ideas, methods, instructions or products referred to in the content. |
© 2022 by the authors. Licensee MDPI, Basel, Switzerland. This article is an open access article distributed under the terms and conditions of the Creative Commons Attribution (CC BY) license (https://creativecommons.org/licenses/by/4.0/).
Share and Cite
Garg, P.; Jamal, F.; Srivastava, P. Meta-Analysis of RNA-Seq Data Identifies Potent Biomarkers for Intellectual Disability Disorder (IDD). Biol. Life Sci. Forum 2022, 19, 20. https://doi.org/10.3390/IECBS2022-12945
Garg P, Jamal F, Srivastava P. Meta-Analysis of RNA-Seq Data Identifies Potent Biomarkers for Intellectual Disability Disorder (IDD). Biology and Life Sciences Forum. 2022; 19(1):20. https://doi.org/10.3390/IECBS2022-12945
Chicago/Turabian StyleGarg, Prekshi, Farrukh Jamal, and Prachi Srivastava. 2022. "Meta-Analysis of RNA-Seq Data Identifies Potent Biomarkers for Intellectual Disability Disorder (IDD)" Biology and Life Sciences Forum 19, no. 1: 20. https://doi.org/10.3390/IECBS2022-12945
APA StyleGarg, P., Jamal, F., & Srivastava, P. (2022). Meta-Analysis of RNA-Seq Data Identifies Potent Biomarkers for Intellectual Disability Disorder (IDD). Biology and Life Sciences Forum, 19(1), 20. https://doi.org/10.3390/IECBS2022-12945