Proceeding Paper

Transcriptomic Diversity of Solanum tuberosum Varieties: A Drive towards Future Analysis of Its Polyploidy Genome †

by
Timothy P. C. Ezeorba
1,2,*,
Emmanuel S. Okeke
1,
Innocent U. Okagu
1,
Ekene J. Nweze
1,
Rita O. Asomadu
1,
Wisdom F. C. Ezeorba
3,
Ifeoma F. Chukwuma
1,
Chidinma P. Ononiwu
1,
Chinonso A. Ezema
4,
Ekezie M. Okorigwe
1,
Valentine O. Nwanelo
1 and
Parker E. Joshua
1,*
1
Department of Biochemistry, Faculty of Biological Sciences, University of Nigeria, Nsukka 410001, Nigeria
2
Department of Molecular Biotechnology, School of Biosciences, University of Birmingham, Edgbaston, Birmingham B15 2TT, UK
3
Department of Chemistry Education, Ekiti State University, Ado-Ekiti 362103, Nigeria
4
Department of Microbiology, Faculty of Biological Sciences, University of Nigeria, Nsukka 410001, Nigeria
*
Authors to whom correspondence should be addressed.
Presented at the 2nd International Electronic Conference on Plant Sciences—10th Anniversary of Journal Plants, 1–15 December 2021; Available online: https://iecps2021.sciforum.net/.
Biol. Life Sci. Forum 2022, 11(1), 46; https://doi.org/10.3390/IECPS2021-12058
Published: 8 December 2021

Abstract

:
Despite the significance of potatoes in combating hunger and ensuring global food security, their potential for fostering a sustainable society has not been fully exploited due to potatoes’ complex biological system as a polyploid. Therefore, there is a need for a more gene-informed potato breeding program to improve yields, nutrient content and other market characteristics. This study aimed at analysing the RNA-seq data from leaf samples of four potato varieties annotated as HJ, HL, LS and V7, to understand the transcriptomic diversity among the varieties. A pipeline was developed and used for the analyses of the fragments reads from each potato variety. A significant amount (>85%) of fragment reads in all samples were mapped to the reference genome. Out of 27,356 gene features obtained from this study, 65.93% were expressed in all samples, and 4.5% were unique to individual potato species. Although all potato varieties’ top 10 expressed genes were associated with chloroplastic proteins/enzymes, other highly unique genes are yet to be fully annotated. Furthermore, the result from fold-change analysis, hierarchical-cluster plot and heatmap showed potato varieties HJ as the most distant species, whereas potato varieties HL and V7 are most similar. More so, the heatmap showed that genes expressed in HJ had the most similar cluster among themselves. Although limited by the unavailability of phenotype information and sample replicates, this study has shown that potato varieties, even with the same polyploid number, express a significant level of diversity in their transcriptome under the same condition.

1. Introduction

Cultivated potato (Solanum tuberosum L.) is a tuber crop grown globally for food because of its high nutrient content. Ever since it was first discovered in South America and domesticated over about 8000 years ago, its global significance for combating hunger and ensuring food security has grown tremendously [1]. Presently, cultivated potato is the third most important food crop in the world after rice and wheat. It is cultivated in more than 125 countries with over a billion people consuming it daily [2]. Over 376 million tonnes of potatoes are globally produced annually, with China being the number one producer [3]. Potatoes are relatively easy to cultivate. Although some species especially diploid potatoes can be grown from botanical seeds, most potatoes cultivated for food are autotetraploid and propagated vegetatively by planting pieces of tubers containing axillary dominant bud (eyes)—from which new shoots sprout out. The underground stem of potatoes morphologically changes into a stolon which then develops into a tuber as the cultivated potato matures [3].
Although cultivated potatoes are broadly grouped into landraces, native varieties and improved varieties, taxonomically classifying over a thousand species belonging to the genus solanum has not been straightforward [4]. Several authors have recently presented different taxonomically classification for cultivated potatoes [4]. The challenges of potato taxonomy are as a result of the complexity of the potatoes’ genome which arises due to gene introgression, interspecific hybridization, auto/allopolyploidy, sexual compatibility, toggling between sexual and asexual reproduction, recent species divergence, phenotypic plasticity and consequently high morphological similarity among species [4].
Polyploidy, which is a major cause of potato diversity, accounts for why potato varieties with a base chromosome number of n = 12 do exist as either diploids (2n = 2x = 24), triploids (3n = 3x = 36), tetraploids (4n = 4x = 48) and pentaploids (5n = 5x = 60). Nowadays, most of the cultivated potatoes grown for food are autotetraploids. There are well established theories and methods for quantitative genetic analysis of many important diploid species which have become invaluable tools for understanding the evolutionary, agronomy and medical significance of genes responsible for desired quantitative trait [5]. However, the genetic analysis of autotetraploid species (potato) has not been as straightforward as their diploid counterpart and the development of its methods has lagged for many years for several reasons [6,7].
RNA-seq is revolutionising the field of Agri-genomics and has continued to drive the sustainable productivity of plants and animals to ensure global food security [8]. The advent of RNA-seq has also made the sequencing of many polyploid plants a possibility and has revived the genetic analysis of many polyploids species. The overwhelming time and cost reduction which the technology proffers allow researchers not only to perform sequencing experiments at varying conditions of a cell but also perform replications for a more precise and accurate inference [9]. This study aimed at performing comparative analysis of RNA-seq data from leaf samples of four potato varieties annotated as HJ, HL, LS and V7 (all autotetraploid), to understand the transcriptomic diversity among the varieties.

2. Materials and Methods

2.1. Materials

2.1.1. Potato Cultivars

Four varieties of autotetraploid potato, Solanum tuberosum (HJ, HL, LS and V7) were grown under field conditions at the Qinghai Academy of Agriculture and Forestry Sciences, China (QAAFS). Leaf samples from each cultivar were harvested at the tuber filling stage (45–55 days after cultivation) for RNA extraction and Illumina sequencing analysis.

2.1.2. RNA Extraction and Illumina Sequencing Analysis

The RNA of the four potato cultivars were extracted from their harvested leaves using the Qiagen RNeasy Kit. The extracted RNA samples were sent to the Gene Energy Company (http://www.genenergy.cn/ (accessed on 5 December 2021) for Illumina sequencing. There were no replicates for each sample that were sequenced (2 × 150 bp paired end reads) for this pilot study.

2.1.3. Research Data Storage

All RNA-seq datasets of the four potato cultivars, their reference indexes and gene annotations used for this study were securely stored in a 3-terabyte allocated space of the Birmingham Environment for Academic Research (BEAR) central Research Data Store (RDS)—a facility of the University of Birmingham.

2.1.4. Computation Services and Analysis Software

All analysis performed on the RNA-seq datasets were conducted on the BEAR Linux high performance computing (HPC) environment (bash shell), also known as the blueBEAR. An SSH client software (PuTTY) was used to gain access to all blueBEAR services and software packages from an 8GB RAM personal computer. All software packages used for this study are highlighted in Table 1.

2.2. Methods

The RNA_Seq data were analysed using the summarized pipeline from Table 1, according to methods detailed by Pertea et al. (2016).

3. Results

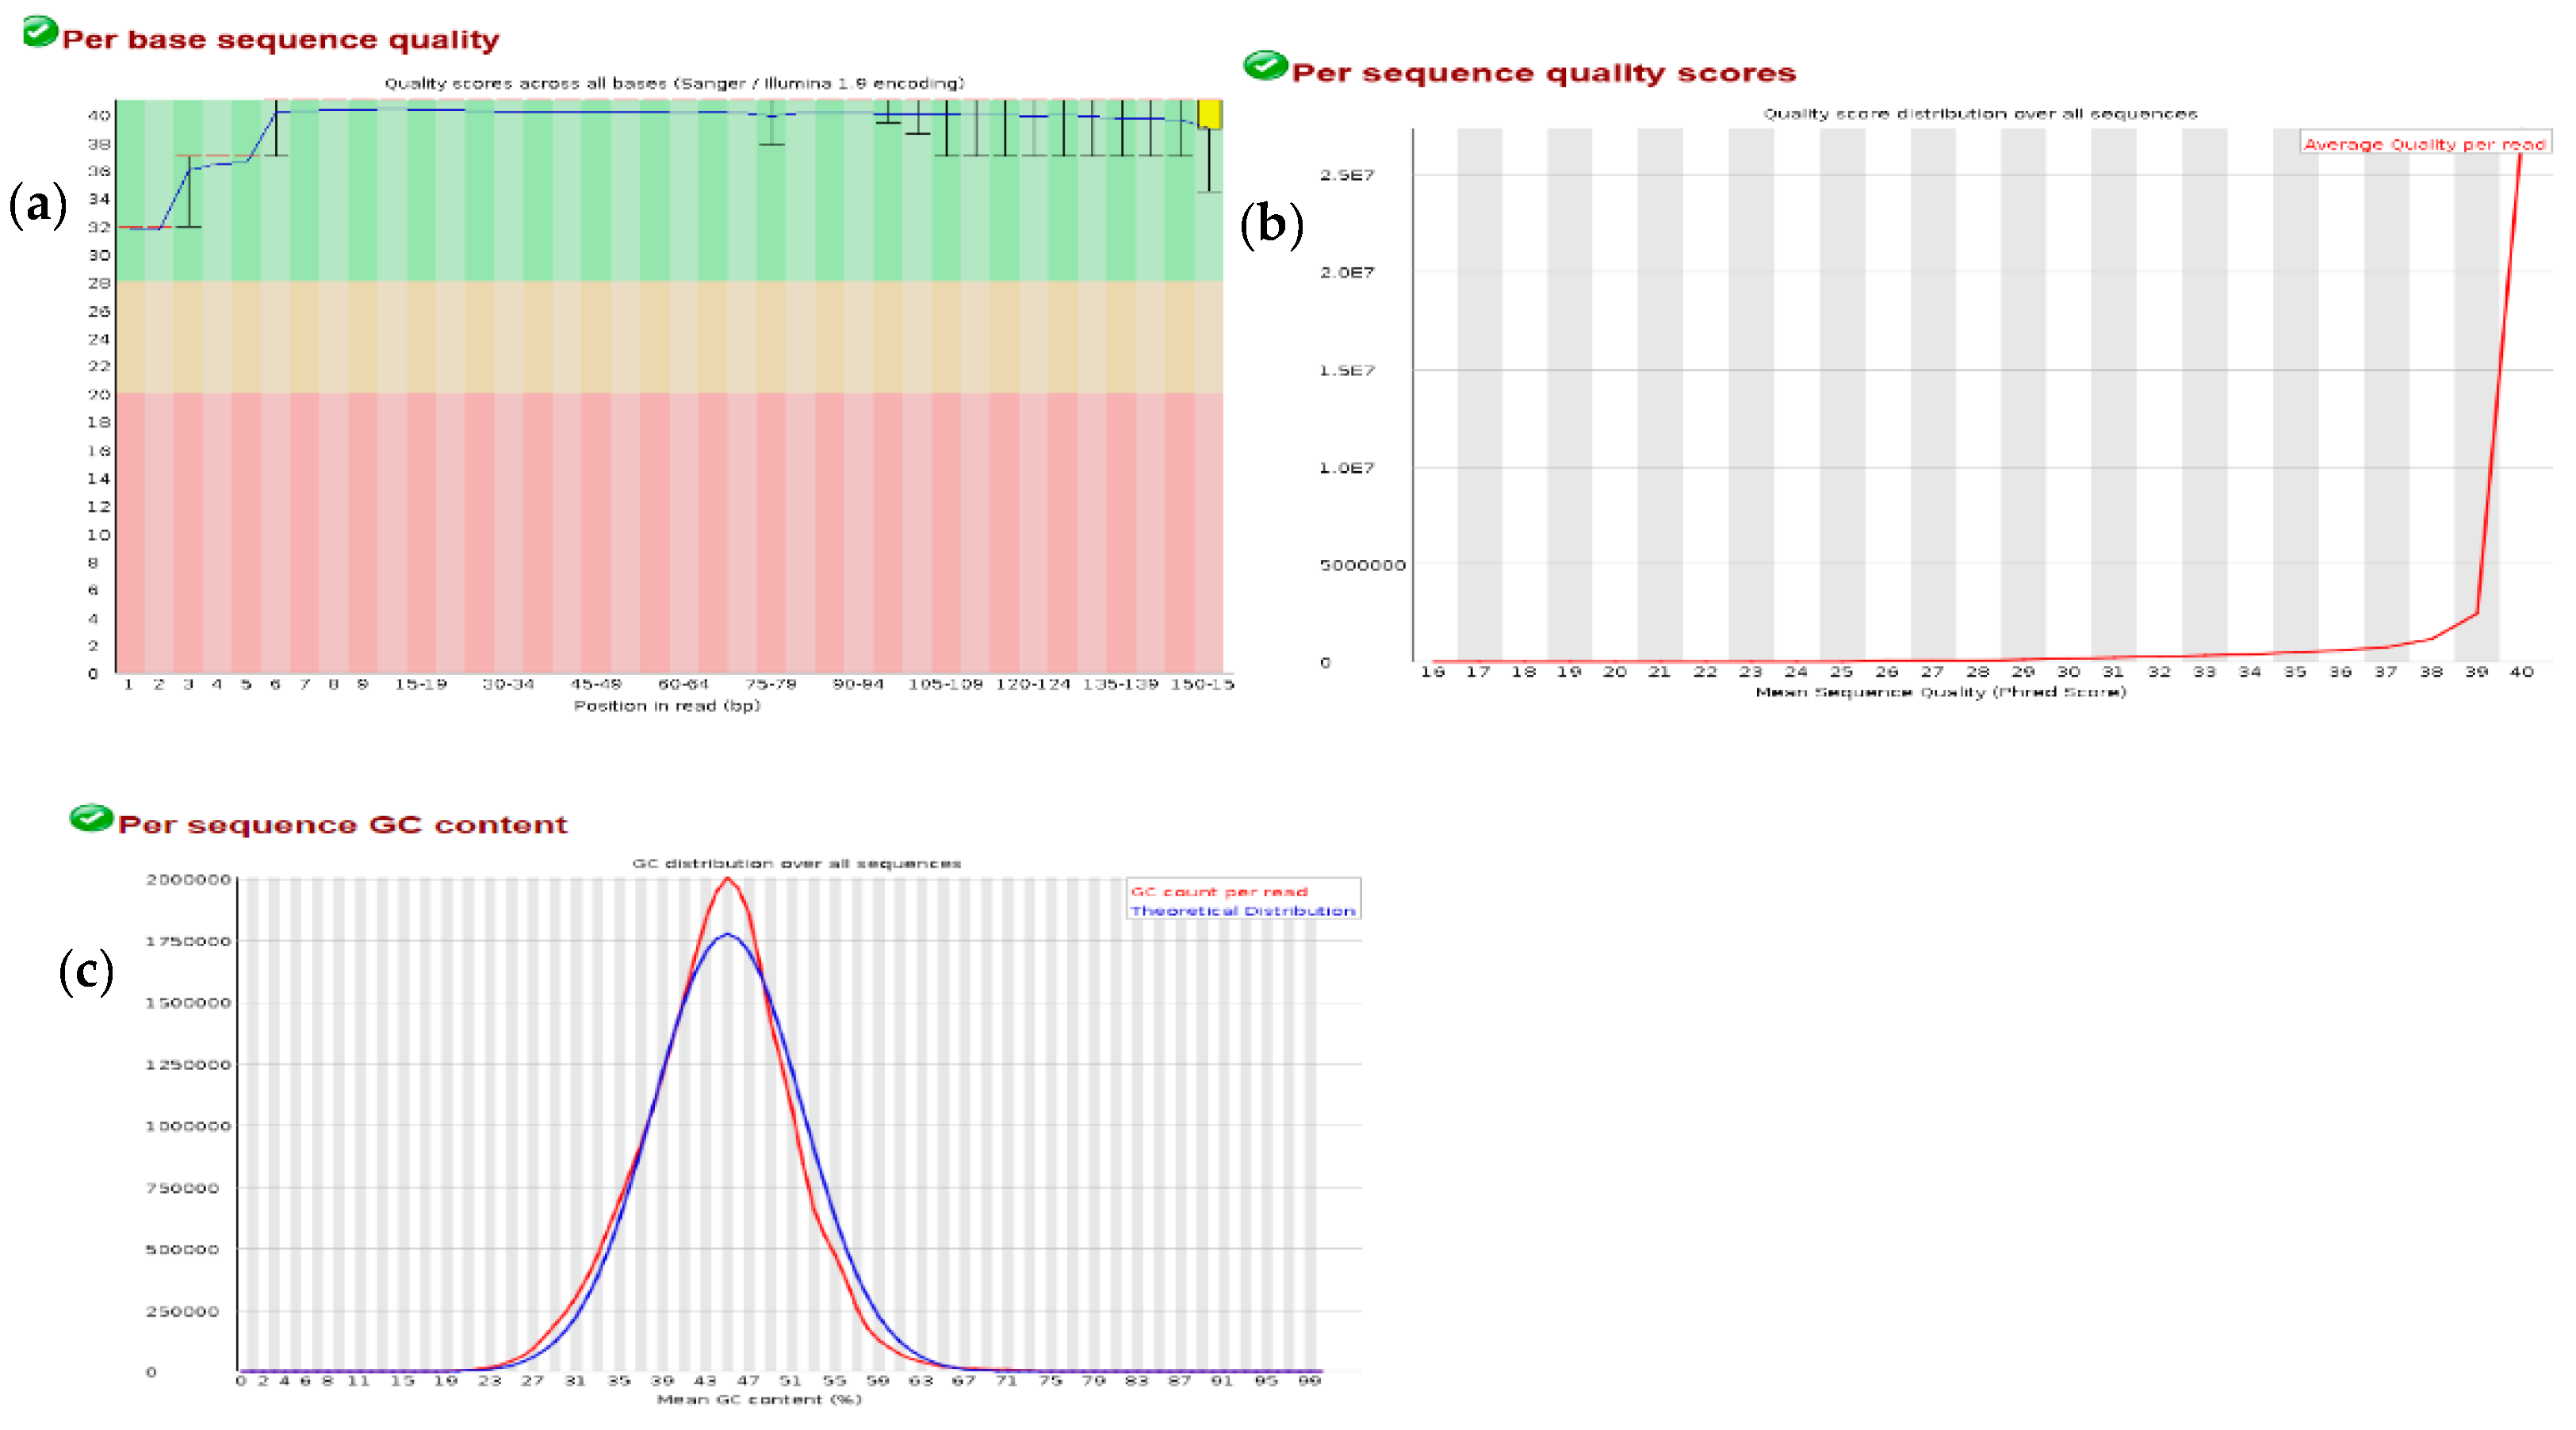
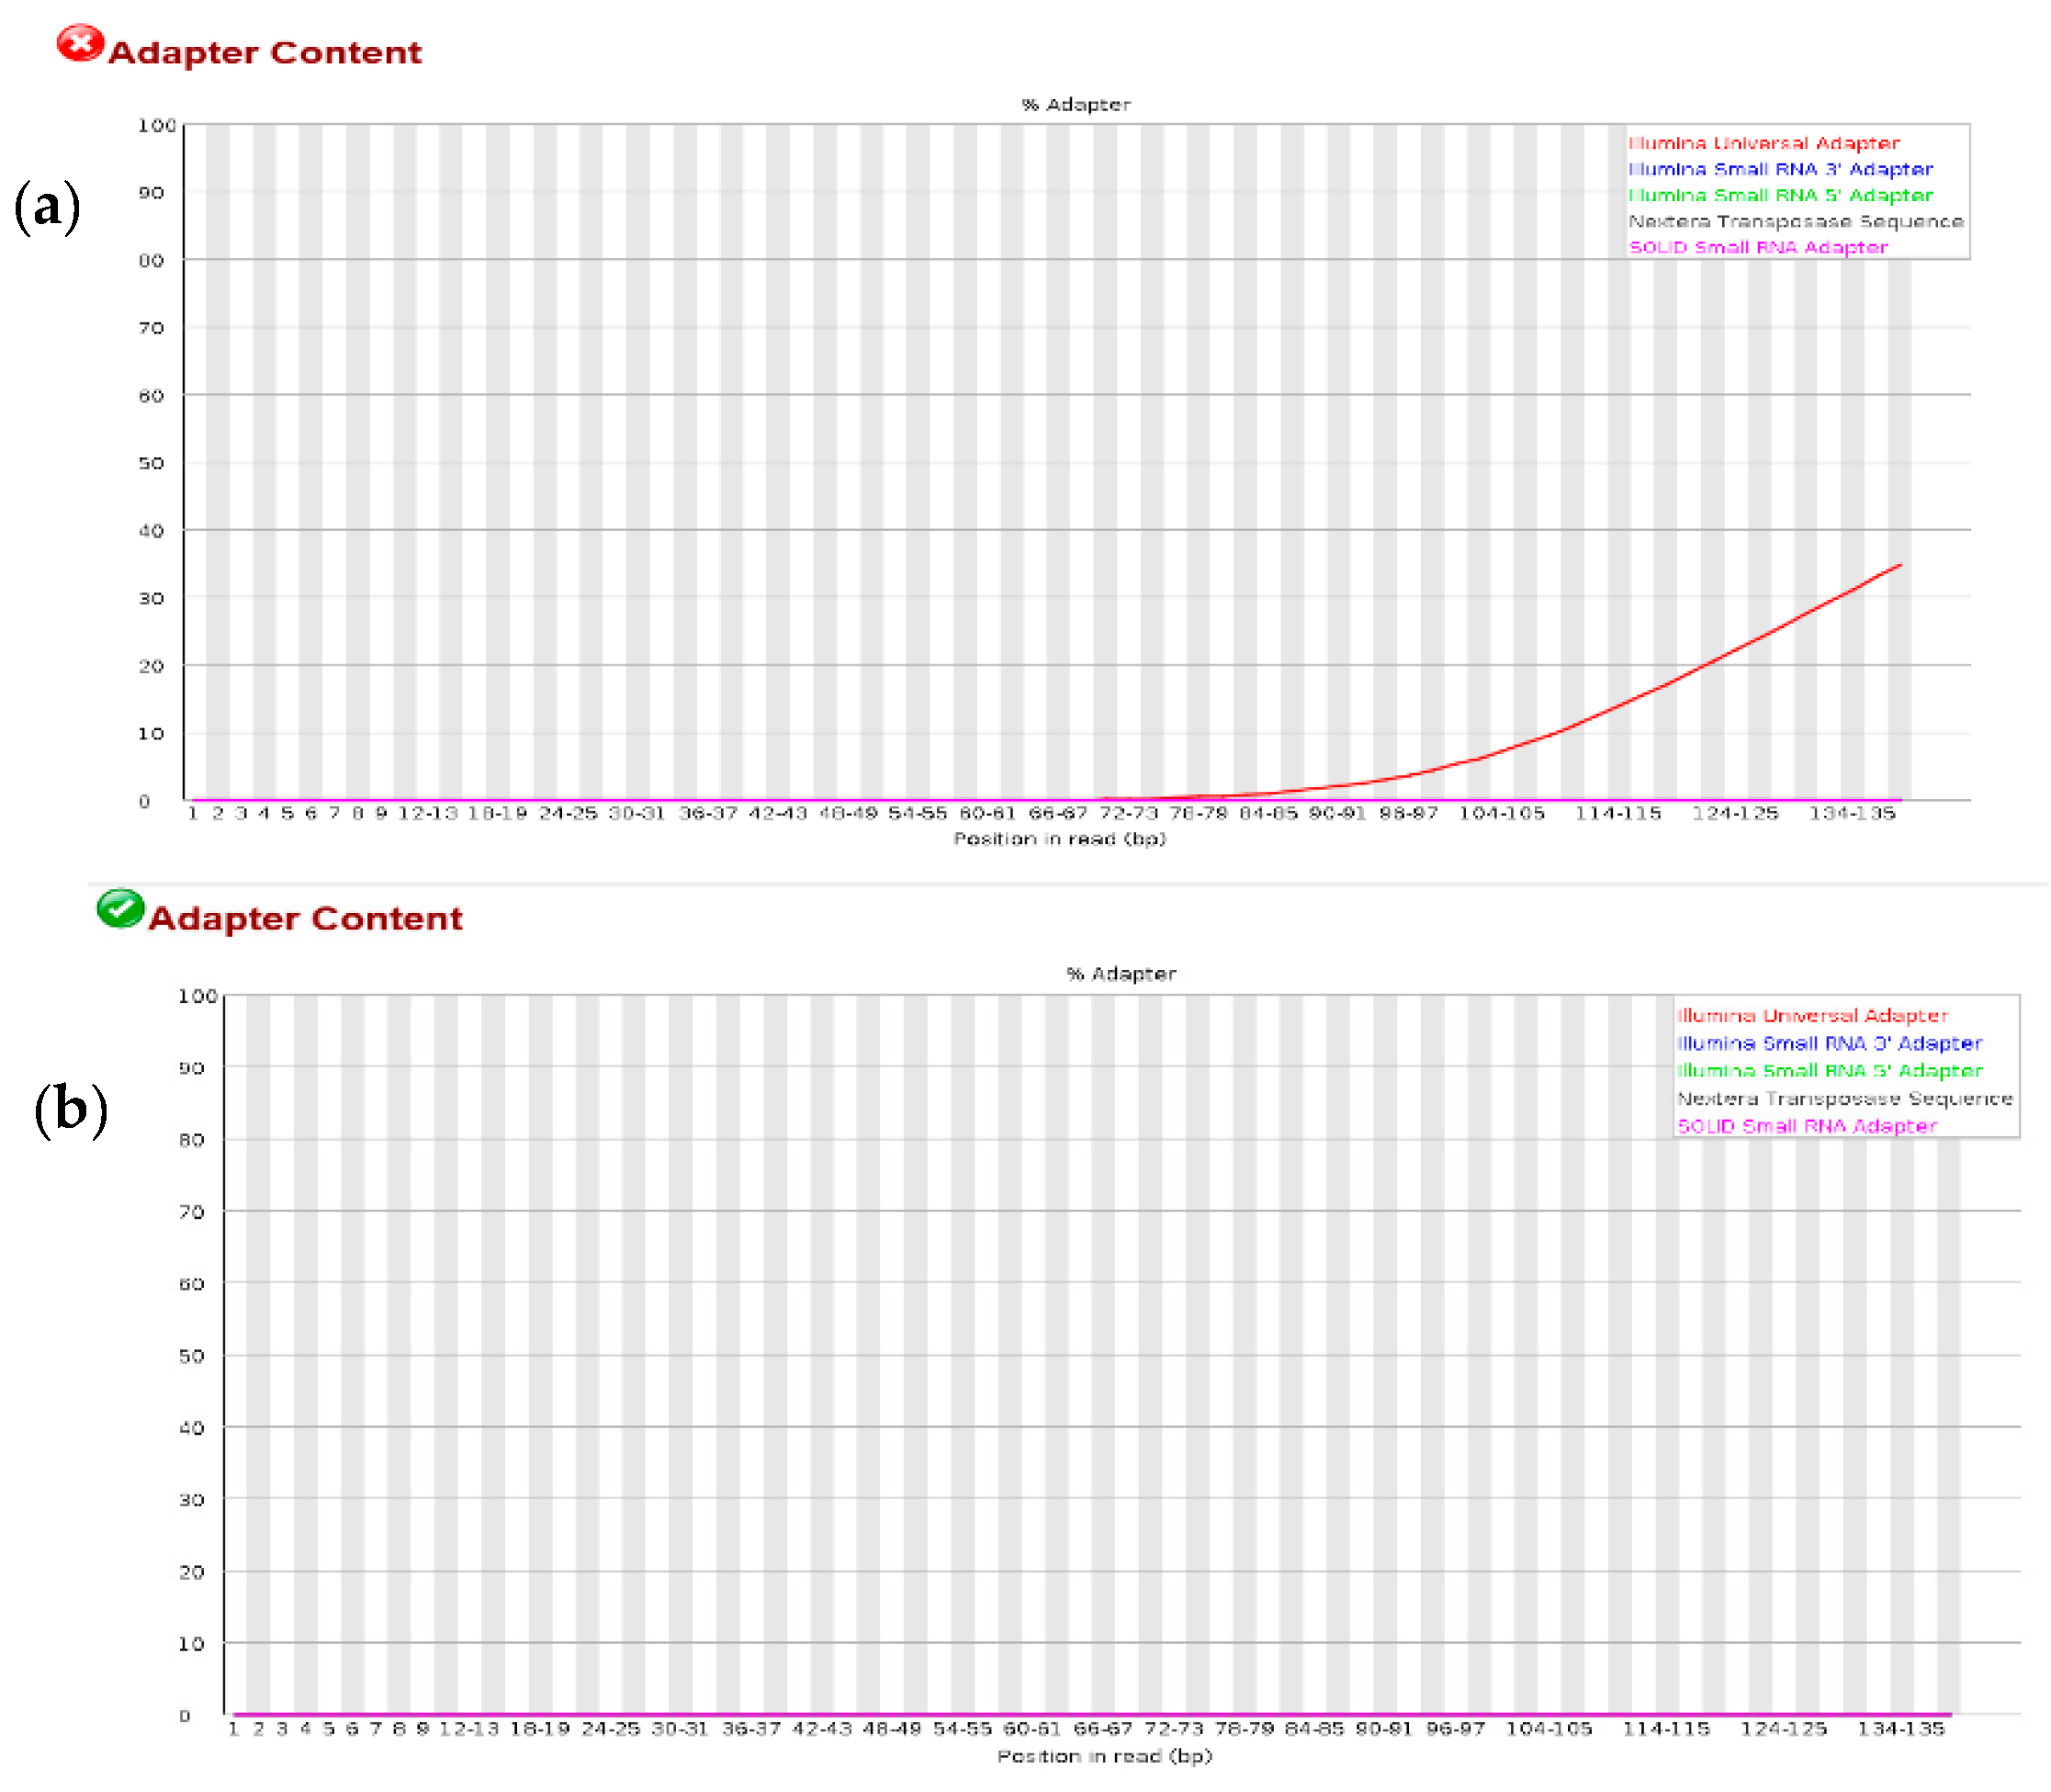
3.1. Quality Check on RNA-Seq Data

The first stage of the analysis pipeline was the trimming of the adapter sequence with Cutadapt and a general quality check of the sequence reads with FASTQC before and after trimming. All the RNA-seq datasets produced similar graphical output showing an excellent per base sequence quality and per sequence quality score even before the trimming-adapter operation.
As shown in Figure A1a,b, Phred quality scores of above 32 were assigned to each of the base-calling positions with an average quality per read of 40. Since the Phred quality score (Q) given by the equation Q = −10 log P is the logarithmic transformation of the probability (P) for having base-calling error, it therefore means that the chance for an erroneous base call in each sequence was 1 in 10,000 or simply put each base call has an average of 99.99% accuracy. Furthermore, the high quality of the dataset was also shown by the GC distribution plot (Figure A1c), as the normal distribution of the GC count per reads over all sequences followed the theoretical distribution. Based on these results, it implies that the RNA-seq experiment was free of contamination and sequence library bias.
In the same vein, the efficiency of the adapter trimming process was assessed by performing quality check with FASTQC before and after adapter trimming. As shown in Figure A2a, the Illumina universal adapter sequence was the only adapter sequence discovered in all the datasets beginning from a base calling position of about 72–73 bp. The process for trimming adapter sequence was thorough and very accurate, as no adapter sequence was discovered in all datasets after trimming (Figure A2b). It was therefore concluded by the quality check data that the Illumina sequencing experiment was performed with minimal systematic errors that could potentially affect further analysis down the pipeline.

3.2. Statistics for Mapping Sequences to Reference Genome

Subsequent to performing quality checks on the RNA-seq datasets, the sequence reads were mapped to the reference potato genome with HISAT2. Using SAMtools, the resulting sequence alignment/maps were then converted to binary alignment/maps which were more compressed in binary formats and compatible with other computational packages down the pipeline. Table 2 summarizes the mapping statistics generated with the SAMtools—flagstat functions. As shown in Table 2, the sequence reads from the four potato cultivars were significantly mapped (>85%) to the reference genome. It was then concluded by the mapping statistic that the assembly of transcript with StringTie, which was next in the pipeline will yield a true representative of the actual transcriptome and was essential for an accurate comparison of how much expression variation exists among the potato varieties.

3.3. Top 10 Most Expressed Genes among Potato Varieties

As shown in Table A1, seven genes were expressed across all varieties, with the first three genes having the same position in a list of top 10 most expressed genes. Furthermore, most of the genes highly expressed (Table A1) were associated with chloroplastic enzymes—involved in photosynthesis.

3.4. Number of Similar and Unique Genes among Samples

The Venn diagram package on R was used to analyse the number of genes that were unique to individual potato variety and similar across pairs, triads and all samples. As shown in Figure 1, 18,036 gene features were expressed in all potato varieties. Also, variety HJ had the highest number of 343 unique gene features, whereas V7 only had the lowest. The names and functions of the top 10 genes that were unique to the potato varieties HJ, HL, LS and V7 were summarised in Table A2, Table A3, Table A4 and Table A5, respectively.

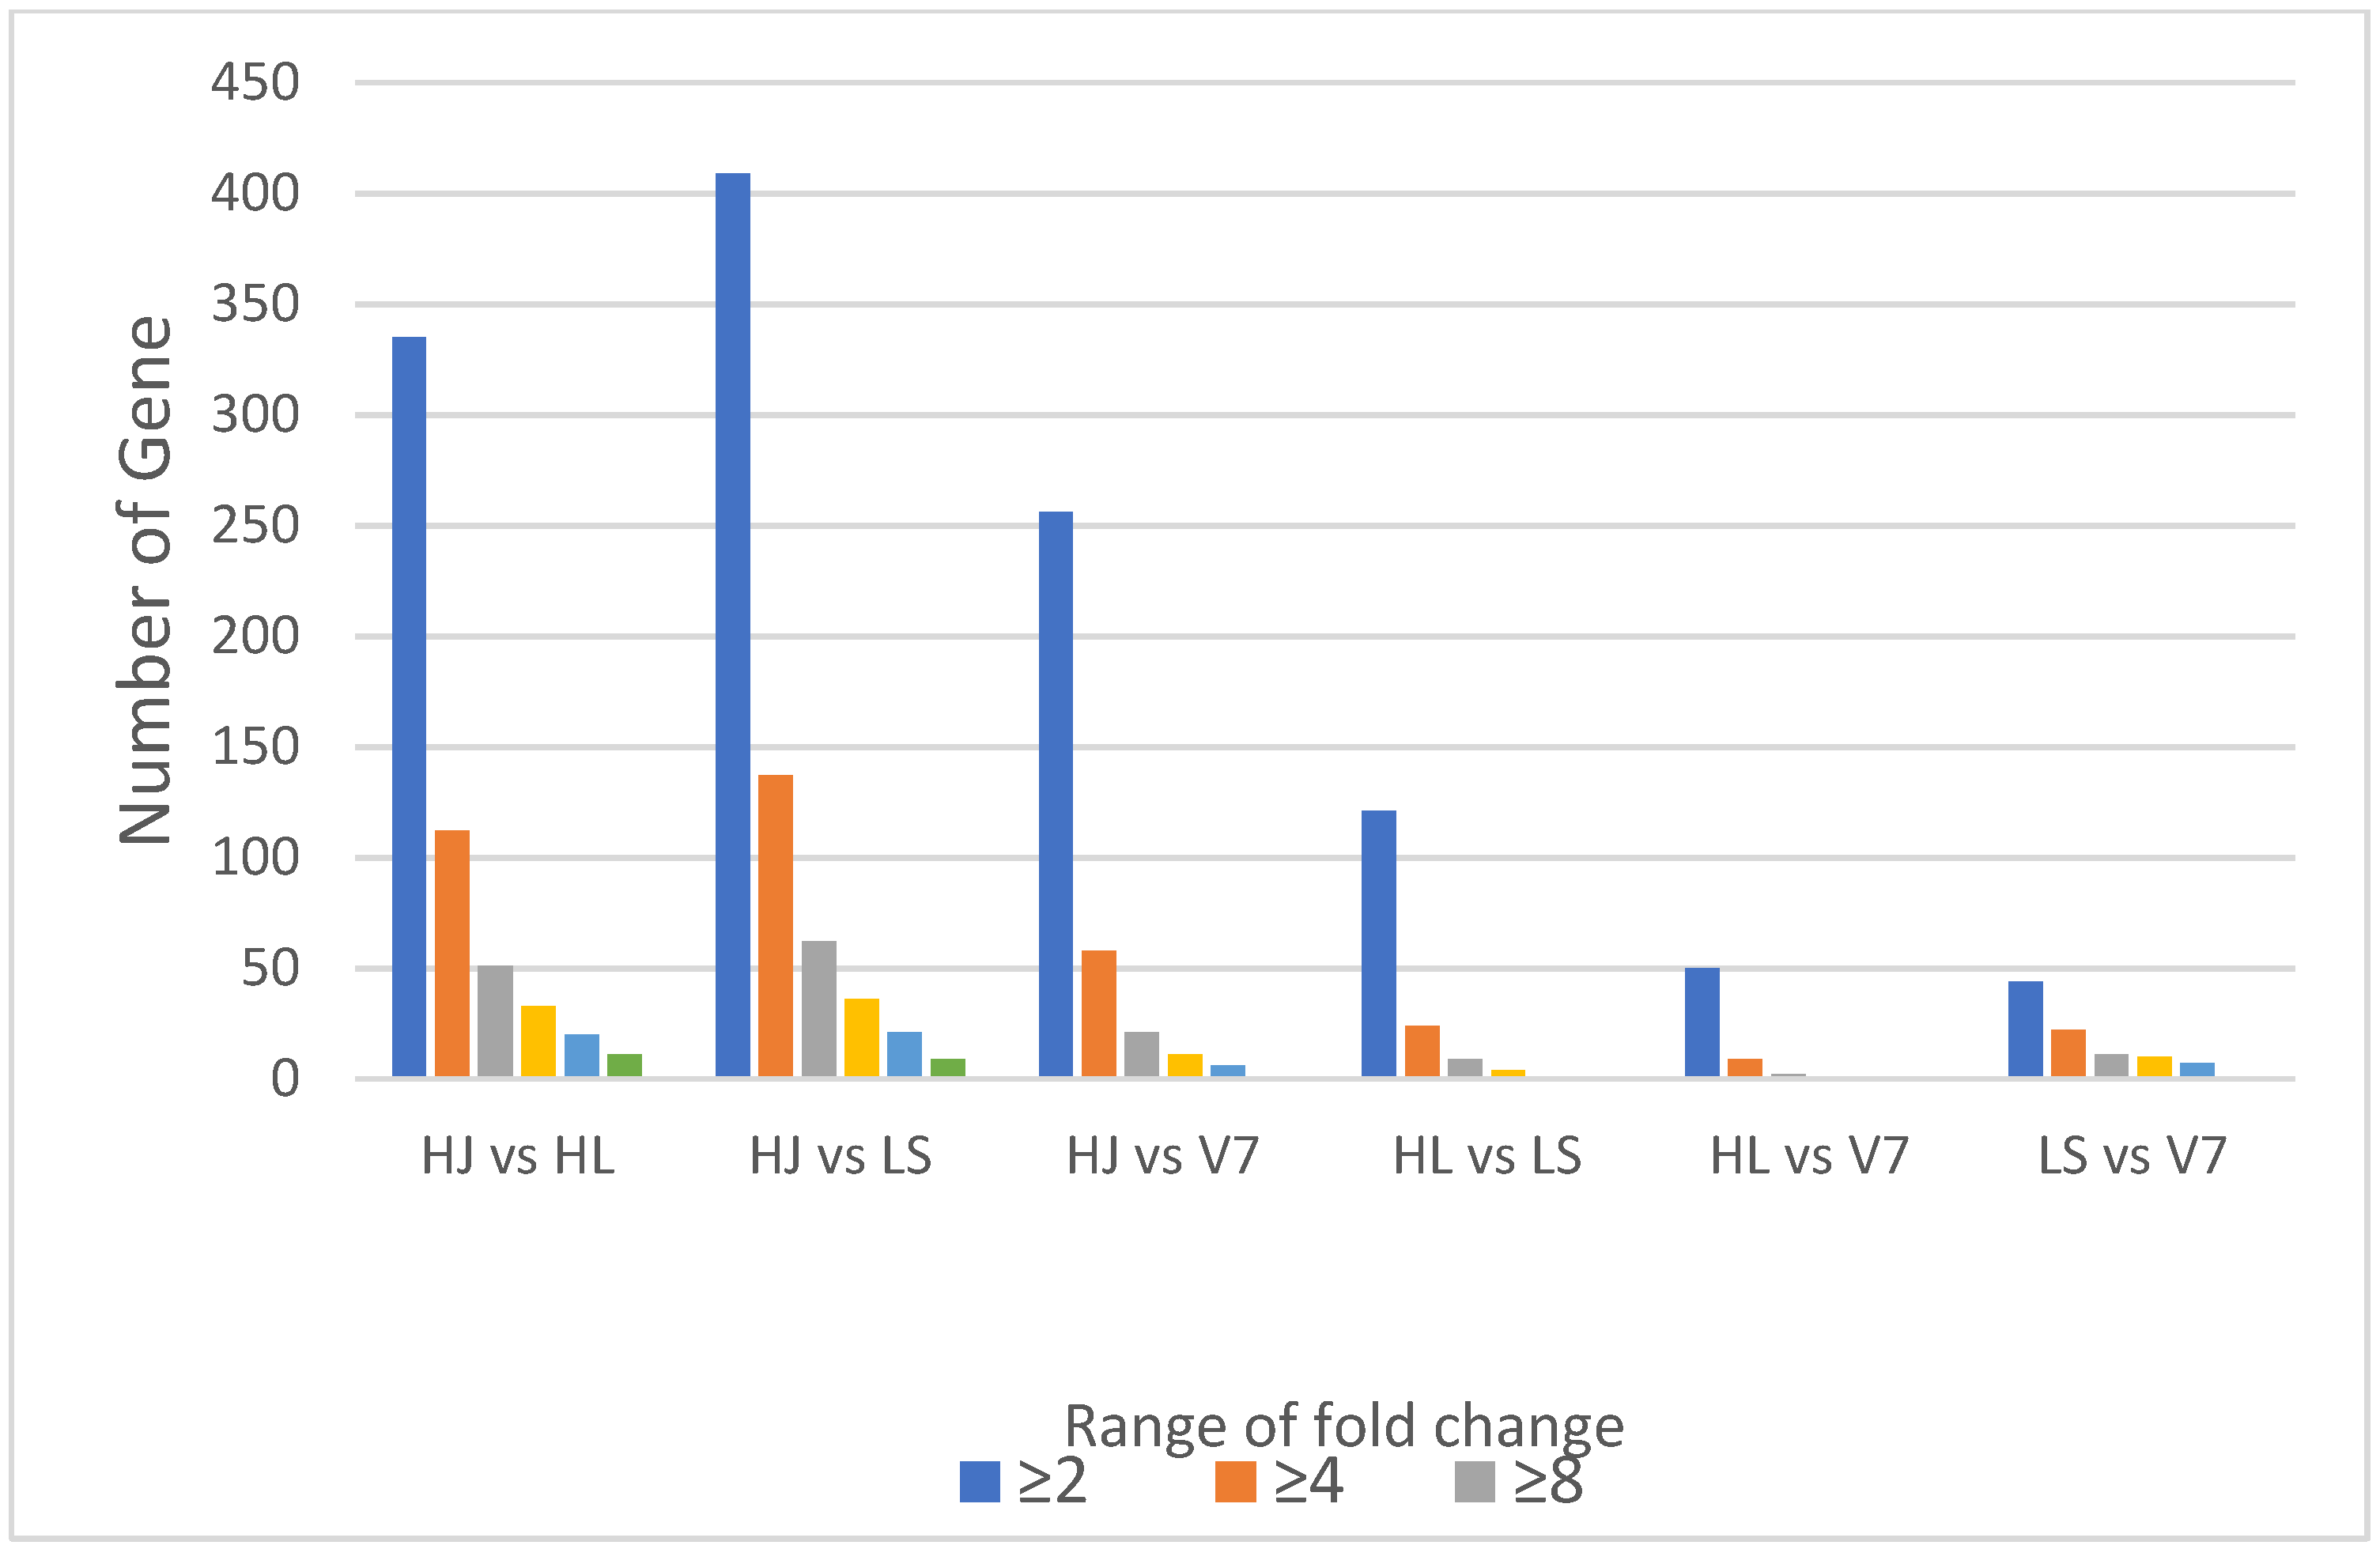
3.5. Fold Change Analysis for Differential Variation in Gene Expression

Fold change analysis was performed among samples in pairs by using the fold change package in R. Differential genes were grouped under different range of fold change using the logic operators and length functions also in R. As shown in the Figure 2, potato HL and V7 varieties were the most similar pair as they had the least fold change, whereas the HJ and LS pair are most distant in expression variation. It was also deduced from the analysis (Figure 2) that the HJ variety is the most distant species which also was consistent with the result from the Hierarchical dendrogram (Figure 3a).

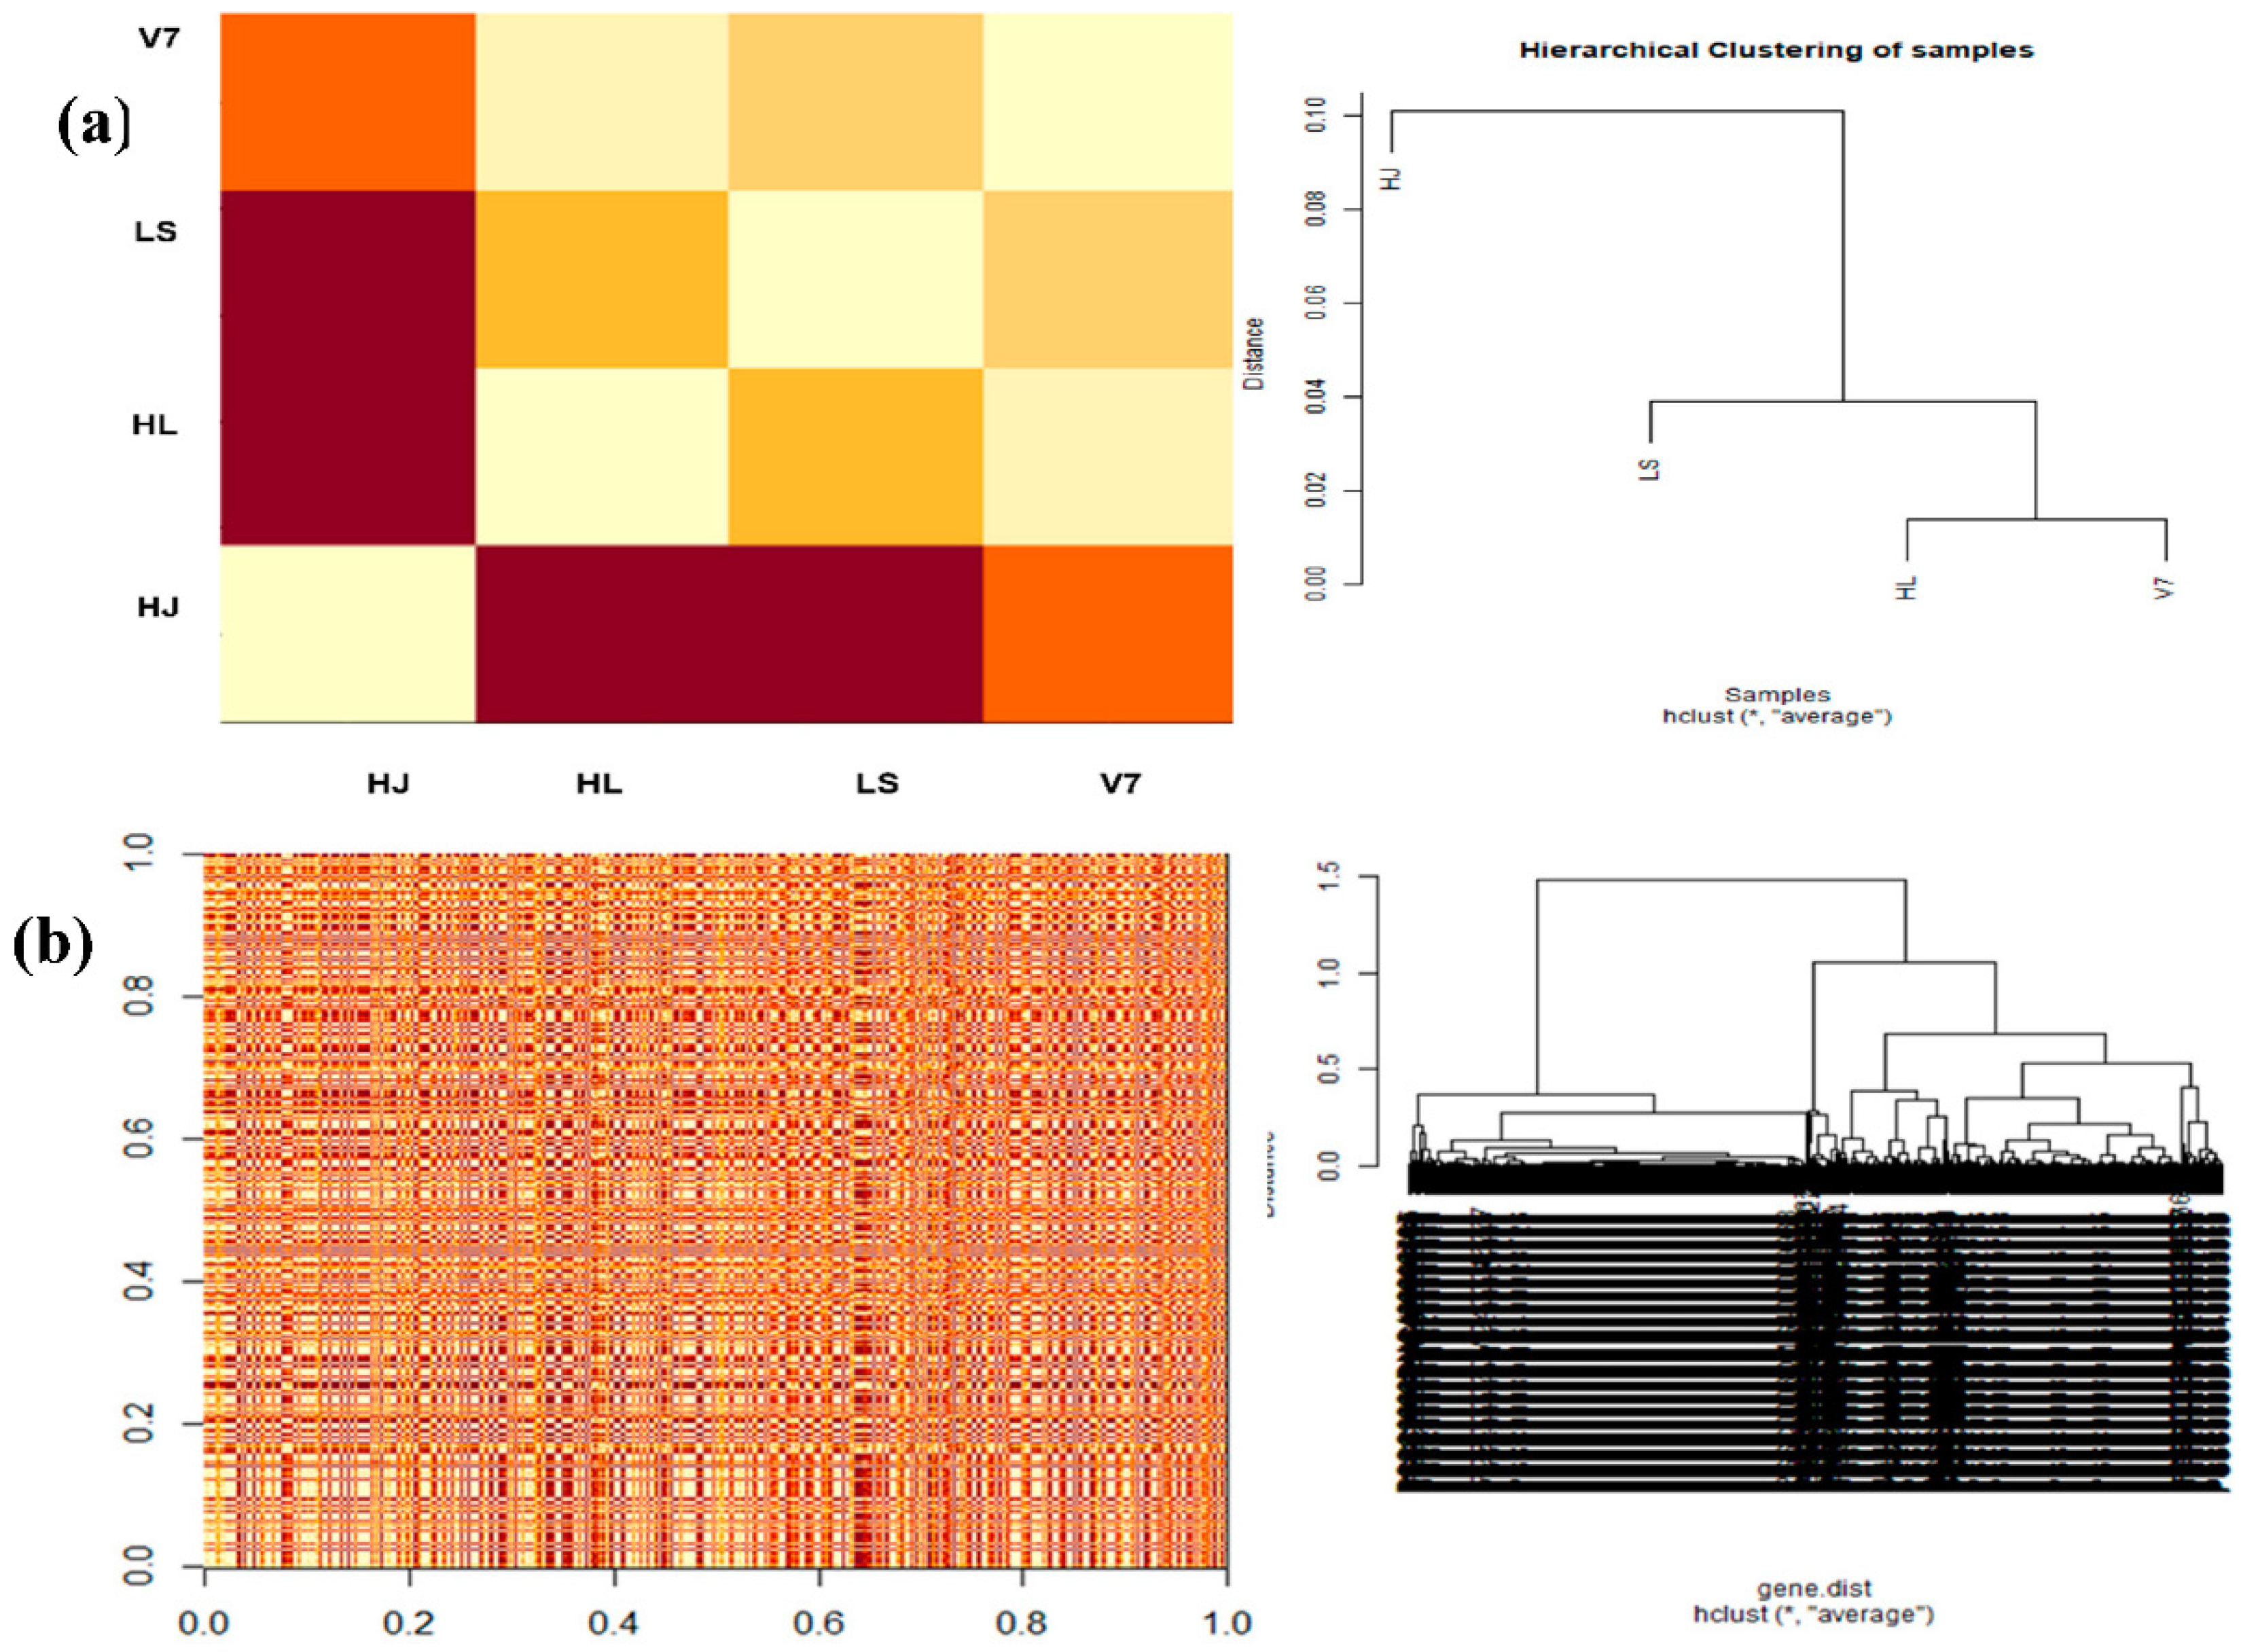
3.6. Estimating Gene and Sample Distance
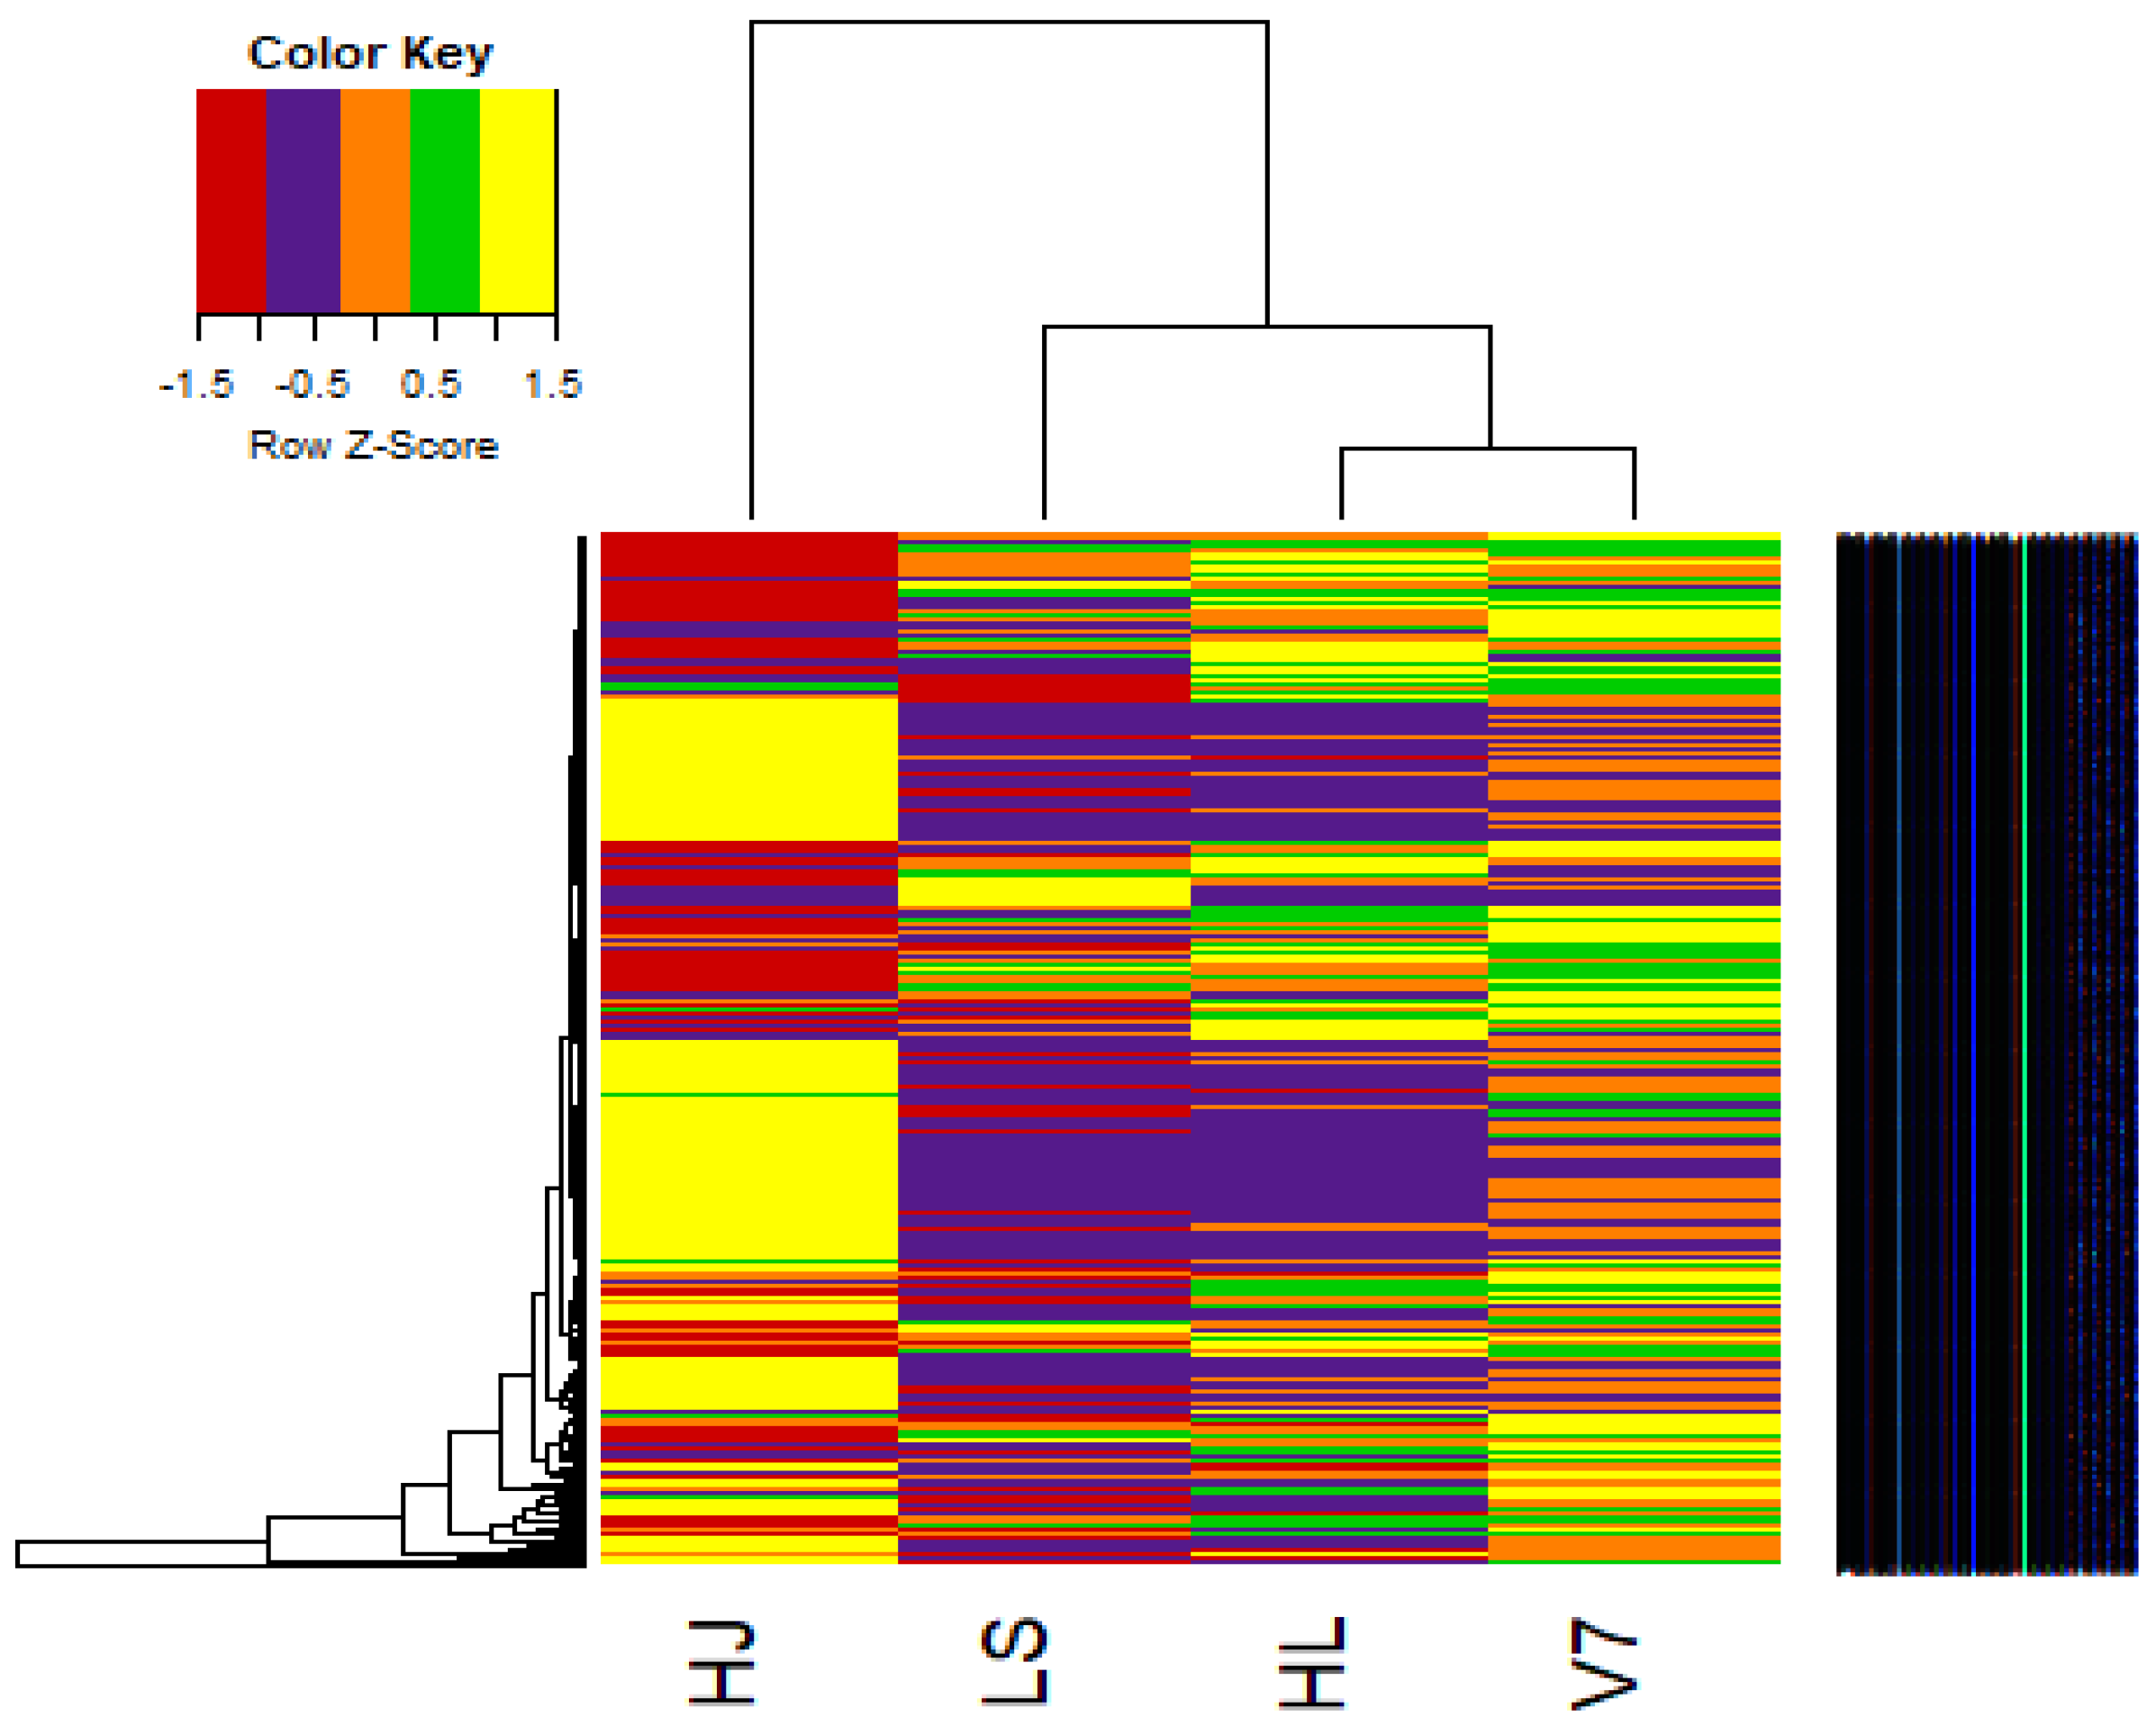
The pairwise correlation was estimated between the samples (n = 4) and between significantly expressed genes (n = 1000). The dist function on R was used to estimate the distance between sample pairs or gene pairs.
As shown in the Figure 3a, sample HJ was the most distant potato variety, whereas HL, LS and V7 were closely related. The distance in the relationship between genes was also shown in Figure 3b.

3.7. Heat Maps

The heatmap2 function on R-packages was used to generate a heatmap plot from both hierarchical clustering of samples and genes (Figure 4). The heatmap is an excellent pictorial tool for depicting variation between several variables. So, the heatmap was very useful for estimating the variation in gene expression among the four potato varieties (HJ, HL, LS and V7). Similar to the other results previously presented, the heatmap (Figure 4) showed that the variety HJ had the most variation in gene expression when compared with other varieties HL, LS and V7. Furthermore, it was also deduced from the heatmap that more than 50% of the genes expressed in sample HJ are closely related, as depicted by the yellow cluster of genes in the heatmap (Figure 4), whereas the genes expressed in HL, LS and V7 are more dispersed.

4. Discussion

Cultivated potatoes are the third most important food crops in the world and offer better carbohydrate to protein ratio, vitamin and antioxidant content when compared with rice and wheat. Hence, it was named as the future food crop by the FAO in 2008. Despite the vast significance of potatoes in combating hunger and ensuring global food security, its potential for a sustainable society has not been fully exploited. Several potato breeding programs aimed at improving yields, nutrient content and other important market characteristics of potatoes have been limited by its complex biological system. The diversity in potato varieties can be accounted for from the complex nature of its genome owing to autotetraploidy, extreme heterozygosity and the vegetative means of propagation. Recent advances in next generation sequencing technology have fostered advanced studies of quantitative traits and the discovery of novel genes that control desirable phenotypes for an informed breeding program.
In this study, RNA sequencing by Illumina technology was adopted to capture the transcriptome expressed in leaf samples of four potato varieties, HJ, HL, LS and V7, all grown in field conditions. A pipeline consisting of several software and bash scripts was developed and used for the analysis of the fragments reads from each potato variety. An exploratory snapshot of the transcriptome was obtained from computational analysis with the pipeline, which served as the basis for measuring the extent of diversity (distance) among the varieties.
Despite the usefulness of NGS technologies in terms of high speed and cost effectiveness, the genomic datasets generated normally contain some kinds of sequencing artefacts such as low-quality reads, contaminating reads and non-uniform coverage which compromises downstream analysis. Therefore, it is necessary to process the fragment reads by trimming off adapter sequences and low-quality reads, and then perform a quality check on the resulting sequence. For all the RNA-seq datasets analysed in this study, an average Phred quality score of about 40 was assigned to all fragment reads by the FASTQC algorithm, meaning that the probability of obtaining a base-call error is 1 in 10,000 calls (Figure A1). Furthermore, the excellent GC normal distribution curve (Figure A1c) and the adapter-trimming operation by Trim Galore algorithm (Figure A2), assured that the fragment sequences used for subsequent mapping step and downstream operation were accurate, for a reliable conclusion on varieties distance. Although different software for quality control have been reported in the past, several recent studies adopted the FASTQC for pre-processing/quality control of RNA-seq data due to its efficient runtime and memory utilization [10,11,12].
Going forward, the mapping statistics (Table 2 portrayed an excellent mapping operation performed by the “new tuxedo” package—HISAT2 [13]. Conesa et al. (2016) opined that an excellent mapping operation should have about 80% fragment reads mapped to the reference genome. Similarly, Sims et al. (2014) estimated that 80% of transcripts that are expressed in human cells can be accurately quantified with about 36 million 100-bp paired-end sequenced reads mapped to the human reference genome. In this study, more than 50 million 150-bp paired end reads were mapped unto the potato reference genome (Table 2). Since the human reference genome (3234.83 Mb) is larger than the potato reference genome (840 Mb), obtaining a higher amount of pair-end reads mapped to the potato reference genome in this study, than the number reported by Sims et al. [14], was an indication of an excellent mapping operation.
A document containing gene features count for each potato variety was generated after running all the scripts for different software packages in the analysis pipeline that was developed in this study (method section). On further analysis of the count file with R-packages exploratory results were generated as tables and figures. Results from Table A1 showed the top 10 expressed genes in the four potato varieties. Since the RNA samples used for this study were extracted from the plant leaves, our results showed that 90% of the top 10 expressed genes were associated with chloroplastic proteins/enzymes, involved in plant photosynthesis and the Calvin cycle (Table A1). Furthermore, Calmodulin binding protein (CBP) sequence was also highly expressed in all samples (Table A1). Previous studies have shown that CBP is involved in calcium signalling pathways and interacts non-covalently with DNA in plants such as tomatoes—Solanum lycopersicum [15]. The CBP nucleotide sequence was not well annotated in the reference genome of the potato. Hence, there is a need for further studies on CBP’s gene sequence in potatoes, to elucidate more of its function.
Out of a total of 27,356 gene features obtained from this study, 65.93% (18,036 genes) were expressed in all samples. About 4.5% of the total genes were unique to individual potato species (Figure 1). Of all the varieties, the top 10 uniquely expressed genes, as shown in Table A2, Table A3, Table A4 and Table A5, are yet to be properly annotated or assign a function. Although these unique gene sequences were not significantly expressed in the potato leaves, they may be involved in expressing distinguishing phenotypic characteristics among the varieties. Further studies on these unique gene sequences will benefit an informative potato breeding program.
The fold change analysis (Figure 2) and hierarchical cluster plot (Figure 3) showed potato varieties HJ as the most distant species, whereas potato varieties HL and V7 are the closest in similarity. Furthermore, the heat map (Figure 4) clearly depicted the transcriptome diversity among the potato varieties HJ, HL, LS and V7. Although genes expressed in HJ were most diverse when compared with other varieties, they had the most similar cluster among themselves (yellow colour in the heatmap). A recent study conducted by Hardigan et al. [16] on the genomic diversity among different potato varieties was used to uncover evolutionary history and gene targets for potato domestication/breed improvement. Similarly, this study, although limited by the unavailability of phenotype information and sample replicates, has shown that potato varieties, even with the same polyploid number (autotetraploid), express a significant level of diversity in their transcriptome under the same condition.
In conclusion, a workable pipeline for analysis of autotetraploids RNA-seq datasets was developed in this study, which can be employed for future analysis. Only from the conducted exploratory transcriptome analysis, we discovered that potato variety HJ was the most distant among the four varieties studied. There is a need for future differential expression studies to correctly identify differentially expressed genes (DEGs) in the four potato varieties, under specific conditions. Consequently, obtaining a clear analysis of DEGs will foster a deeper understanding on the phenotypic variation among the potato varieties, and will aid the development of workable models for mapping complex traits to genome loci in polyploids.

Author Contributions

Methodology, T.P.C.E.; software, T.P.C.E.; validation, T.P.C.E.; formal analysis, T.P.C.E.; investigation, T.P.C.E.; resources, T.P.C.E.; data curation, T.P.C.E.; writing—original draft preparation, T.P.C.E., P.E.J., C.A.E., E.M.O., V.O.N. and I.U.O.; writing—review and editing, T.P.C.E., E.S.O., E.J.N., I.U.O., R.O.A., W.F.C.E., I.F.C. and C.P.O.; visualization, T.P.C.E. All authors have read and agreed to the published version of the manuscript.

Funding

This research was funded partly by Prof. Zewei Luo Lab, School of Biosciences, University of Birmingham, UK and Petroleum Technology Development Fund (PTDF), Nigeria.

Institutional Review Board Statement

Not applicable.

Informed Consent Statement

Not applicable.

Data Availability Statement

Not applicable.

Acknowledgments

First and foremost, I would like to specially thank my supervisor, Lindsey Leach for her relentless support and guidance all through my project. Additionally, many thanks go to Zewei Luo for all his support during the project. I will also acknowledge the Qinghai Academy of Agriculture and Forestry Sciences, China (QAAFS) for growing the potato cultivars under standard field conditions and the Gene Energy Company for performing the RNA sequencing with Illumina Technology. Lastly, I thank the Petroleum Technology Development Fund (PTDF) for awarding me a full scholarship to study at the University of Birmingham.

Conflicts of Interest

The authors declare no conflict of interest.

Appendix A

Figure A1. Representative plots for quality control of all RNA-seq datasets. (a) Shows a Phred quality score across all base-calling positions in the sequence reads. The plot was segmented into green, brown and red partitions. Phred scores that fall within the green partition are excellent, whereas scores in the brown partition are good and scores in the red segments are poor. (b) Shows the distribution of the mean quality score across all sequence reads in the datasets. (c) Comparison of the actual distribution of the GC content across sequence reads (red plot) to the theoretical distribution (blue plot).
Blsf 11 00046 g0a1
Figure A2. Distribution of adapter content in sequence reads. (a) Shows the adapter distribution before the trimming of the adapter. (b) Shows the adaptor distribution after trimming. A red plot represents Illumina universal adapter, blue represents small RNA 3′ adapter, green represents small RNA 5′ adapter, black represents nextera transposase sequence and purple represents SOLID small RNA ad.
Blsf 11 00046 g0a2
Table A1. Top 10 expressed genes in each of the potato varieties (HJ, HL, LS and V7) and their functions.
Feature Count in HJFeature Count in HLFeature Count in LSFeature Count in V7Functions
PGSC0003DMT4000503811,237,227 a824,318 a647,927 a1,043,868 aRibulose bisphosphate carboxylase small chain 1, chloroplastic
PGSC0003DMT400049256769,766 b660,312 b448,042 b812,577 bRibulose bisphosphate carboxylase/oxygenase activase
PGSC0003DMT400015740467,111 c446,234 c373,783 c595,895 cChlorophyll a-b binding protein 4, chloroplastic
PGSC0003DMT400022072391,269 d219,183 e155,481 h282,483 eChlorophyll a-b binding protein 13, chloroplastic
PGSC0003DMT400062138375,606 e 133,281 j222,351 jRibulose bisphosphate carboxylase small chain C, chloroplastic
PGSC0003DMT400021871371,548 f194,143 h 257,340 gChloroplast pigment-binding protein CP29
PGSC0003DMT400057257360,544 g418,762 d343,654 d553,961 dPhotosystem II 10 kDa polypeptide, chloroplastic
MSTRG.21453.1351,809 h194,605 g146,314 1252,948 hCalmodulin binding protein
PGSC0003DMT400050232333,341 i173,647 j189,848 e257,393 fChlorophyll a/b binding protein
PGSC0003DMT400007189248,230 j 163,987 g Oxygen-evolving enhancer protein 1, chloroplastic
PGSC0003DMT400049574 198,114 f179,139 f Chloroplast thiazole biosynthetic protein
PGSC0003DMT400031351 173,794 i Fructose-bisphosphate aldolase
PGSC0003DMT400045248 235,947 iPhotosystem II 22 kDa protein, chloroplastic
Superscript from “a to j” indicates the ranking of the genes based on the feature counts from highest to lowest in each of the potato varieties (HJ, HL, LS and V7), respectively. Superscript a indicate the gene with the highest number of features, whereas superscript j indicates the gene with the least (10th position) number of features.
Table A2. Top 10 unique genes expressed in sample HJ and their functions.
GeneCountFunctions
MSTRG.392.1358Gene of unknown function
PGSC0003DMT400057507332Conserved gene of unknown function
MSTRG.9424.1212Gene of unknown function
PGSC0003DMT400071789202Gene of unknown function
PGSC0003DMT400066793158YABBY1
PGSC0003DMT400074800154Mta/sah nucleosidase
MSTRG.10422.1104Gene of unknown function
PGSC0003DMT40002101992Glucosyltransferase
PGSC0003DMT400037714863-ketoacyl-CoA synthase
MSTRG.11977.183RanGAP1 interacting protein
Table A3. Top 10 unique genes expressed in sample HL and their functions.
GeneCountFunctions
MSTRG.25046.1575Gene of unknown function
MSTRG.1846.1390Glycosyltransferase
MSTRG.13022.1380Gene of unknown function
MSTRG.13023.1257Gene of unknown function
MSTRG.9940.1137Gene of unknown function
PGSC0003DMT400028158127Lipoxygenase
MSTRG.23937.1118Gene of unknown function
MSTRG.19592.1115Gene of unknown function
MSTRG.13282.1114Gene of unknown function
MSTRG.17640.1109Gene of unknown function
Table A4. Top 10 unique genes expressed in sample LS and their functions.
GeneCountFunctions
MSTRG.24645.1217Gene of unknown function
PGSC0003DMT400021314156Wound-responsive AP2-like factor 2
MSTRG.9415.1152Gene of unknown function
PGSC0003DMT400008021145Gene of unknown function
MSTRG.6112.1140Gene of unknown function
MSTRG.10787.1137Gene of unknown function
MSTRG.15651.1135Gene of unknown function
MSTRG.4193.1130Conserved gene of unknown function
MSTRG.4684.1130Conserved gene of unknown function
PGSC0003DMT400037122123CRT binding factor 3
Table A5. Top 10 expressed genes in sample V7 and their functions.
GeneCountFunctions
MSTRG.519.1652Gene of unknown function
MSTRG.9306.1392Gene of unknown function
MSTRG.82.1291Late blight resistance protein
MSTRG.3637.1175Gene of unknown function
MSTRG.24469.1132Gene of unknown function
MSTRG.18347.1105Pentatricopeptide repeat-containing protein
MSTRG.15759.1104Gene of unknown function
MSTRG.17428.1104Gene of unknown function
MSTRG.23833.1102Gene of unknown function
MSTRG.6288.1100Gene of unknown function

References

  1. Camire, M.E. Potatoes and Human Health. Adv. Potato Chem. Technol. 2016, 8398, 685–704. [Google Scholar] [CrossRef]
  2. Hirsch, C.N.; Hirsch, C.; Felcher, K.; Coombs, J.; Zarka, D.; Van Deynze, A.; De Jong, W.; Veilleux, R.E.; Jansky, S.; Bethke, P.; et al. Retrospective View of North American Potato (Solanum tuberosum L.) Breeding in the 20th and 21st Centuries. G3: Genes|Genomes|Genetics 2013, 3, 1003–1013. [Google Scholar] [CrossRef] [PubMed] [Green Version]
  3. Upadhyay, C.P. Biotechnological improvement of nutritional and therapeutic value of cultivated potato. Front. Biosci. 2018, 10, 217–228. [Google Scholar] [CrossRef] [PubMed] [Green Version]
  4. Gavrilenko, T.; Antonova, O.; Shuvalova, A.; Krylova, E.; Alpatyeva, N.; Spooner, D.M.; Novikova, L. Genetic diversity and origin of cultivated potatoes based on plastid microsatellite polymorphism. Genet. Resour. Crop. Evol. 2013, 60, 1997–2015. [Google Scholar] [CrossRef]
  5. Chen, J.; Zhang, F.; Wang, L.; Leach, L.; Luo, Z. Orthogonal contrast based models for quantitative genetic analysis in autotetraploid species. New Phytol. 2018, 220, 332–346. [Google Scholar] [CrossRef] [PubMed] [Green Version]
  6. Conesa, A.; Madrigal, P.; Tarazona, S.; Gomez-Cabrero, D.; Cervera, A.; McPherson, A.; Szcześniak, M.W.; Gaffney, D.J.; Elo, L.L.; Zhang, X.; et al. A survey of best practices for RNA-seq data analysis. Genome Biol. 2016, 17, 13. [Google Scholar] [CrossRef] [PubMed] [Green Version]
  7. Jiang, N.; Zhang, F.; Wu, J.; Chen, Y.; Hu, X.; Fang, O.; Leach, L.J.; Wang, D.; Luo, Z. A highly robust and optimized sequence-based approach for genetic polymorphism discovery and genotyping in large plant populations. Theor. Appl. Genet. 2016, 129, 1739–1757. [Google Scholar] [CrossRef] [PubMed] [Green Version]
  8. The Potato Genome Sequencing Consortium. Genome sequence and analysis of the tuber crop potato. Nat. Cell Biol. 2011, 475, 189–195. [Google Scholar] [CrossRef] [Green Version]
  9. Bourke, P.M.; Voorrips, R.E.; Visser, R.G.F.; Maliepaard, C. Tools for Genetic Studies in Experimental Populations of Polyploids. Front. Plant Sci. 2018, 9, 513. [Google Scholar] [CrossRef] [PubMed] [Green Version]
  10. Costa-Silva, J.; Domingues, D.; Lopes, F.M. RNA-Seq differential expression analysis: An extended review and a software tool. PLoS ONE 2017, 12, e0190152. [Google Scholar] [CrossRef] [PubMed] [Green Version]
  11. Trivedi, U.H.; Cézard, T.; Bridgett, S.; Montazam, A.; Nichols, J.; Blaxter, M.; Gharbi, K.; Cezard, T. Quality control of next-generation sequencing data without a reference. Front. Genet. 2014, 5, 111. [Google Scholar] [CrossRef] [PubMed] [Green Version]
  12. Zhou, Q.; Su, X.; Wang, A.; Xu, J.; Ning, K. QC-Chain: Fast and Holistic Quality Control Method for Next-Generation Sequencing Data. PLoS ONE 2013, 8, e60234. [Google Scholar] [CrossRef] [PubMed]
  13. Pertea, M.; Kim, D.; Pertea, G.M.; Leek, J.T.; Salzberg, S.L. Transcript-level expression analysis of RNA-seq experiments with HISAT, StringTie and Ballgown. Nat. Protoc. 2016, 11, 1650–1667. [Google Scholar] [CrossRef] [PubMed]
  14. Sims, D.; Sudbery, I.; Ilott, N.E.; Heger, A.; Ponting, C.P. Sequencing depth and coverage: Key considerations in genomic analyses. Nat. Rev. Genet. 2014, 15, 121–132. [Google Scholar] [CrossRef] [PubMed]
  15. Munir, S.; Khan, M.R.G.; Song, J.; Munir, S.; Zhang, Y.; Ye, Z.; Wang, T. Genome-wide identification, characterization and expression analysis of calmodulin-like (CML) proteins in tomato (Solanum lycopersicum). Plant Physiol. Biochem. 2016, 102, 167–179. [Google Scholar] [CrossRef] [PubMed]
  16. Hardigan, M.A.; Laimbeer, F.P.E.; Newton, L.; Crisovan, E.; Hamilton, J.; Vaillancourt, B.; Wiegert-Rininger, K.; Wood, J.; Douches, D.S.; Farré, E.M.; et al. Genome diversity of tuber-bearing Solanum uncovers complex evolutionary history and targets of domestication in the cultivated potato. Proc. Natl. Acad. Sci. USA 2017, 114, E9999–E10008. [Google Scholar] [CrossRef] [PubMed] [Green Version]
Figure 1. Venn diagrams showing the number of unique genes of individual potato varieties and the number of genes that are similar among pairs, triad and all sample. The size of all sectors of the Venn diagram were not drawn to scale to correlate with the amount or size of the values. The different coloured circles represent different potato varieties, as indicated by the colour legend, and the value of the sectors where different coloured intersects give the number of genes unique only to either pairs, triads or all samples.
Blsf 11 00046 g001
Figure 2. Fold change analysis of samples grouped in pairs to estimate variation in gene expression among samples. The ranges of fold change (≥2, ≥4, ≥8, ≥16, ≥32, ≥100) were indicated by the colour legend.
Blsf 11 00046 g002
Figure 3. Distance matrixes (left) and hierarchical clustering (right) of both sample and genes. (a) Pairwise estimation of sample distance among potato varieties (HJ, HL, LS and V7). (b) Pairwise distance estimation among selected genes (n = 1000). In both (a,b), dark red colour depicts the farthest distant relationship, whereas light cream colour depicts high similarity.
Blsf 11 00046 g003
Figure 4. Heatmap demonstrating the clustering of gene features from four potato varieties based on expression level calculated from read counts. The distance scores are indicated by the colour key.
Blsf 11 00046 g004
Table 1. Software packages used for Potato RNA-seq data analysis.
SoftwareStage of Analysis
1Trim Galore! version 0.4.2 and Cutadapt version 1.16Trim adapter sequences
FastQC version 0.11.5Perform sequence reading quality checks
2HISAT2 version 2.1.0Mapping sequence reads to reference genome
3SAMtools version 1.8i. Convert. sam file to .bam files
ii. estimating genome coverage and percentage mapped to reference genome
4StringTie version 1.3.3i. Assembling transcripts from individual samples
ii. Merged assembled transcriptomes from all samples
5GffCompare version 0.10.2Compare the assembled transcriptome to reference genome files.
6Subread version 1.5.3 (featurecount)Generate the number of reads mapped to each gene for each sample.
7R version 3.5.0Analysis of reads mapped to each gene and generating informative graphs.
Table 2. Statistic for the sequence reads mapped to reference genome.
Potato VarietiesNumber of Paired ReadsNumber Mapped to Reference Genome% Mapped to Reference Genome
HJ81,938,94573,194,04989.33
HL69,099,62361,511,49989.02
LS61,462,78453,486,30987.02
V783,537,64474,357,90589.01
Publisher’s Note: MDPI stays neutral with regard to jurisdictional claims in published maps and institutional affiliations.

