Achieving Optimal Value of Solar: A Municipal Utility Rate Analysis
Abstract
:1. Introduction
2. Materials and Methods
2.1. Value of Solar (VOS)
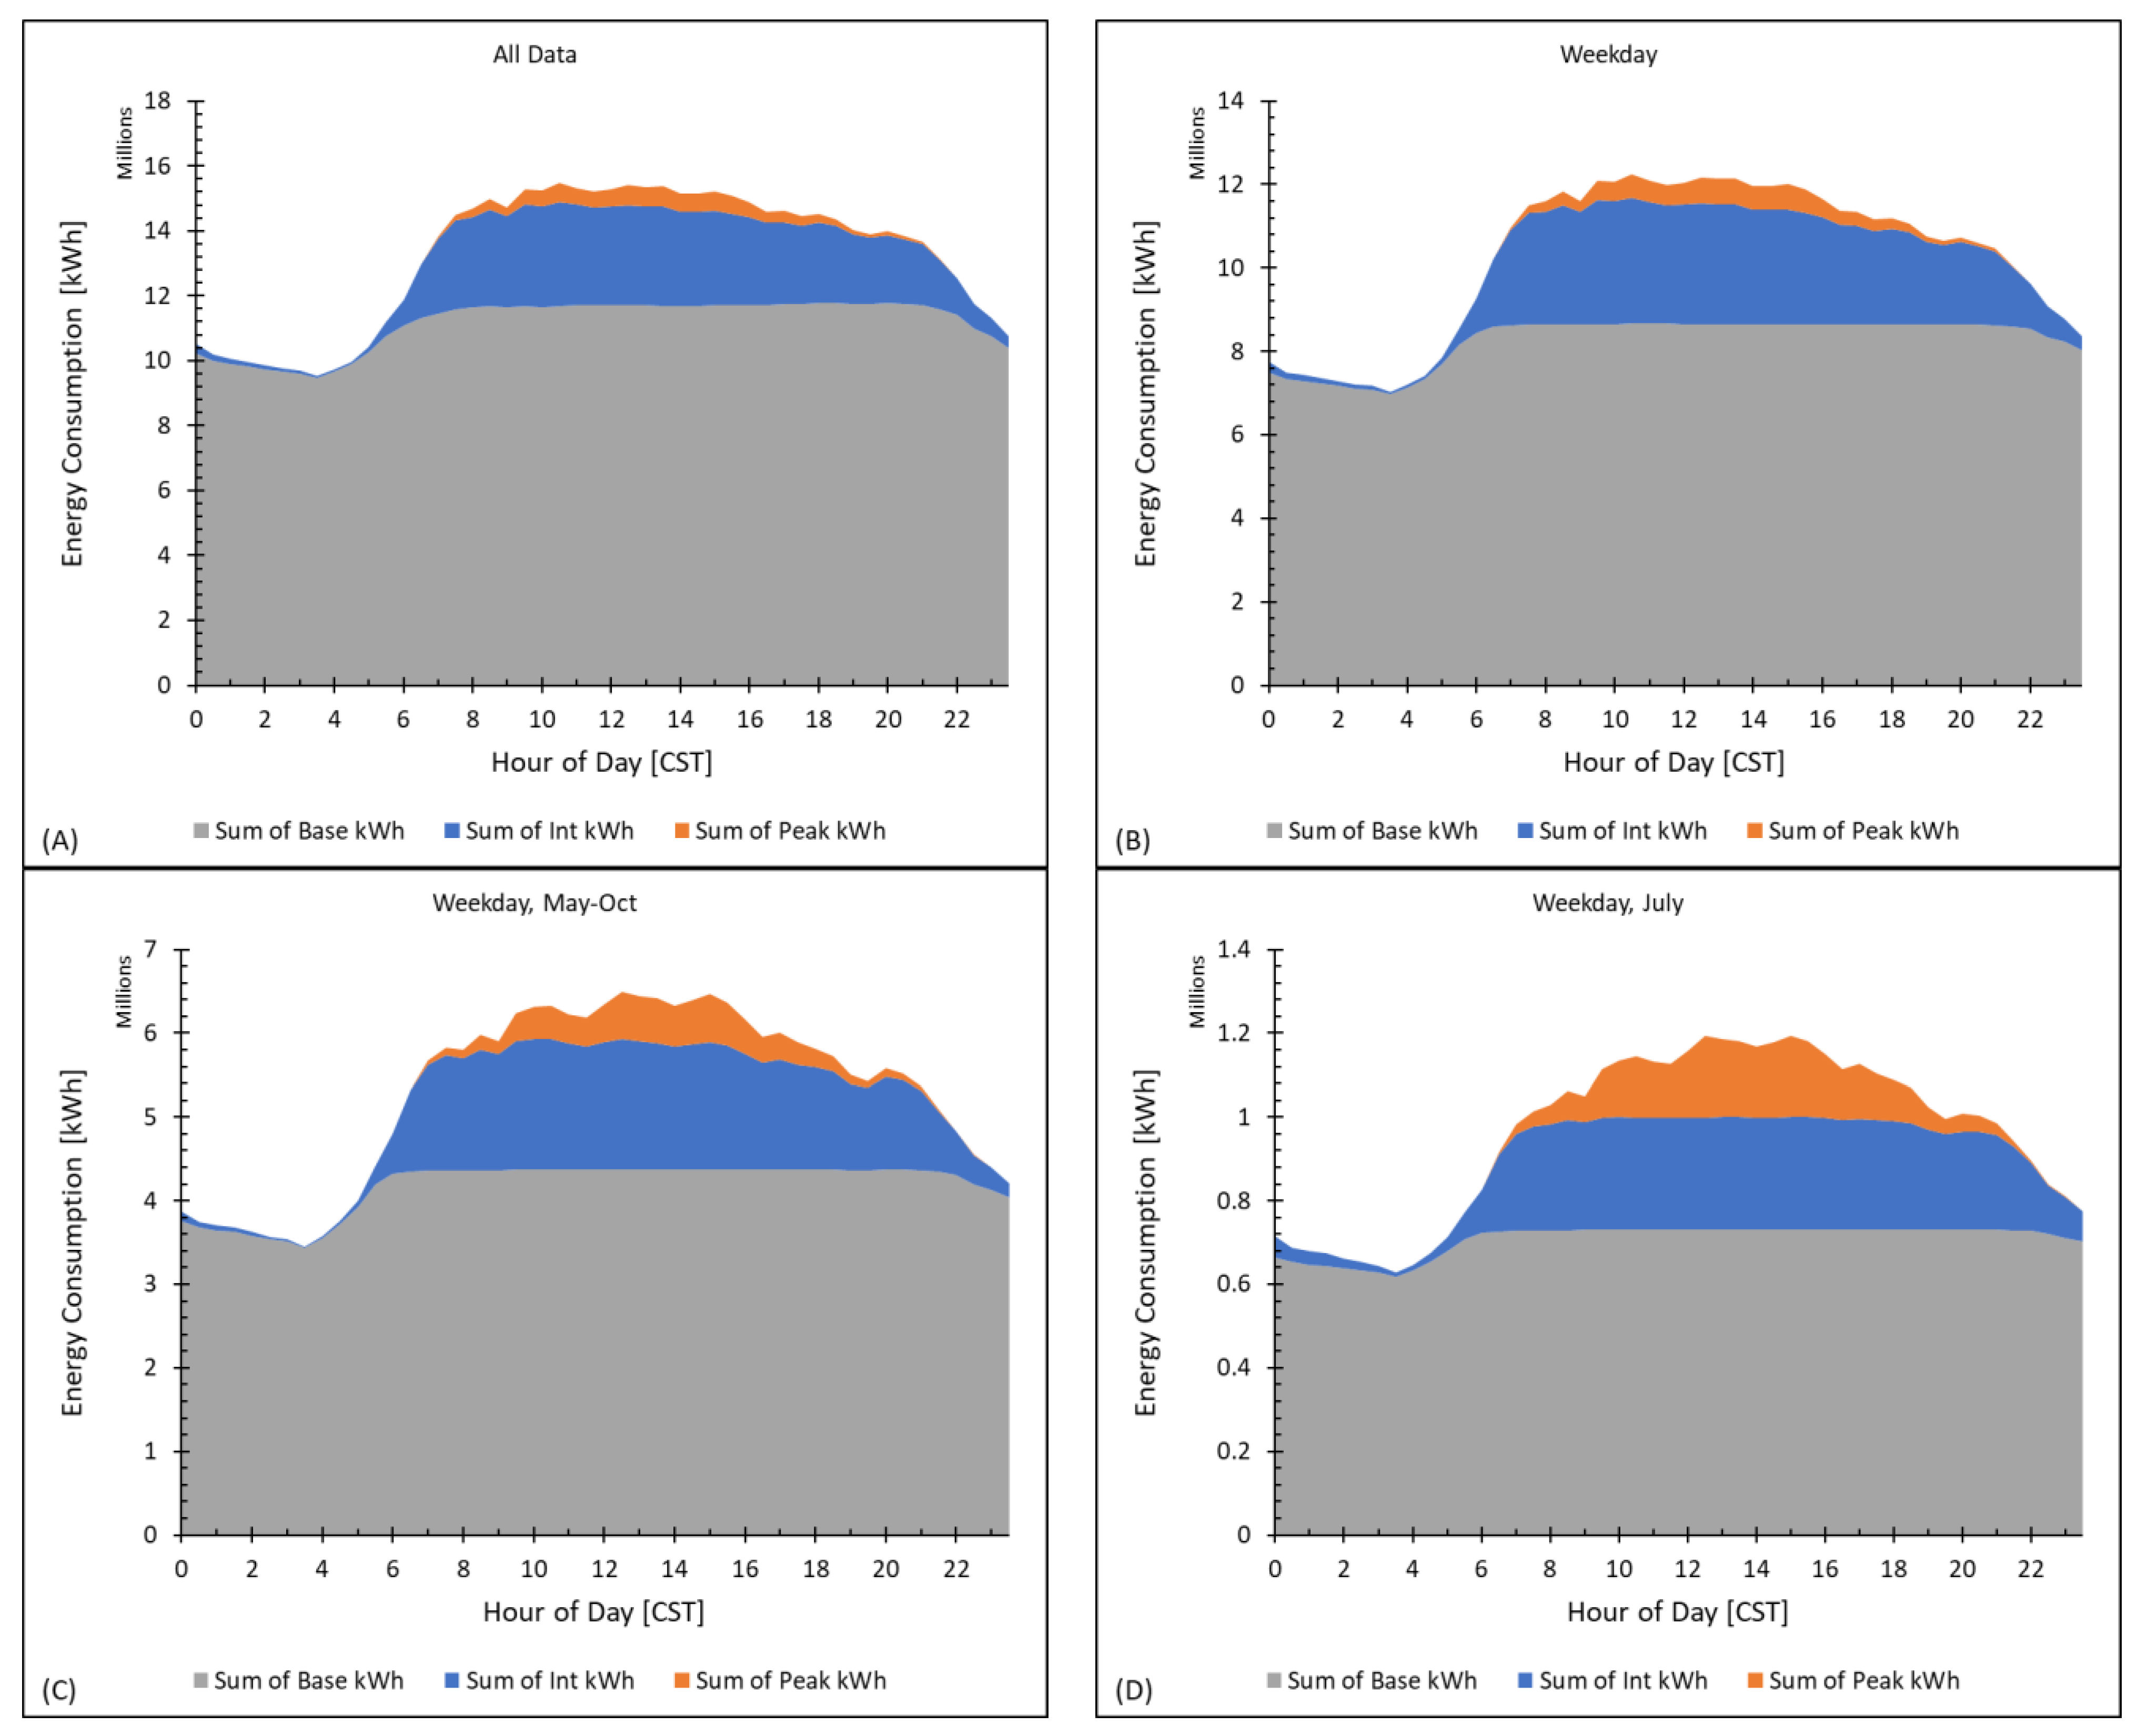
2.2. Load Characterization
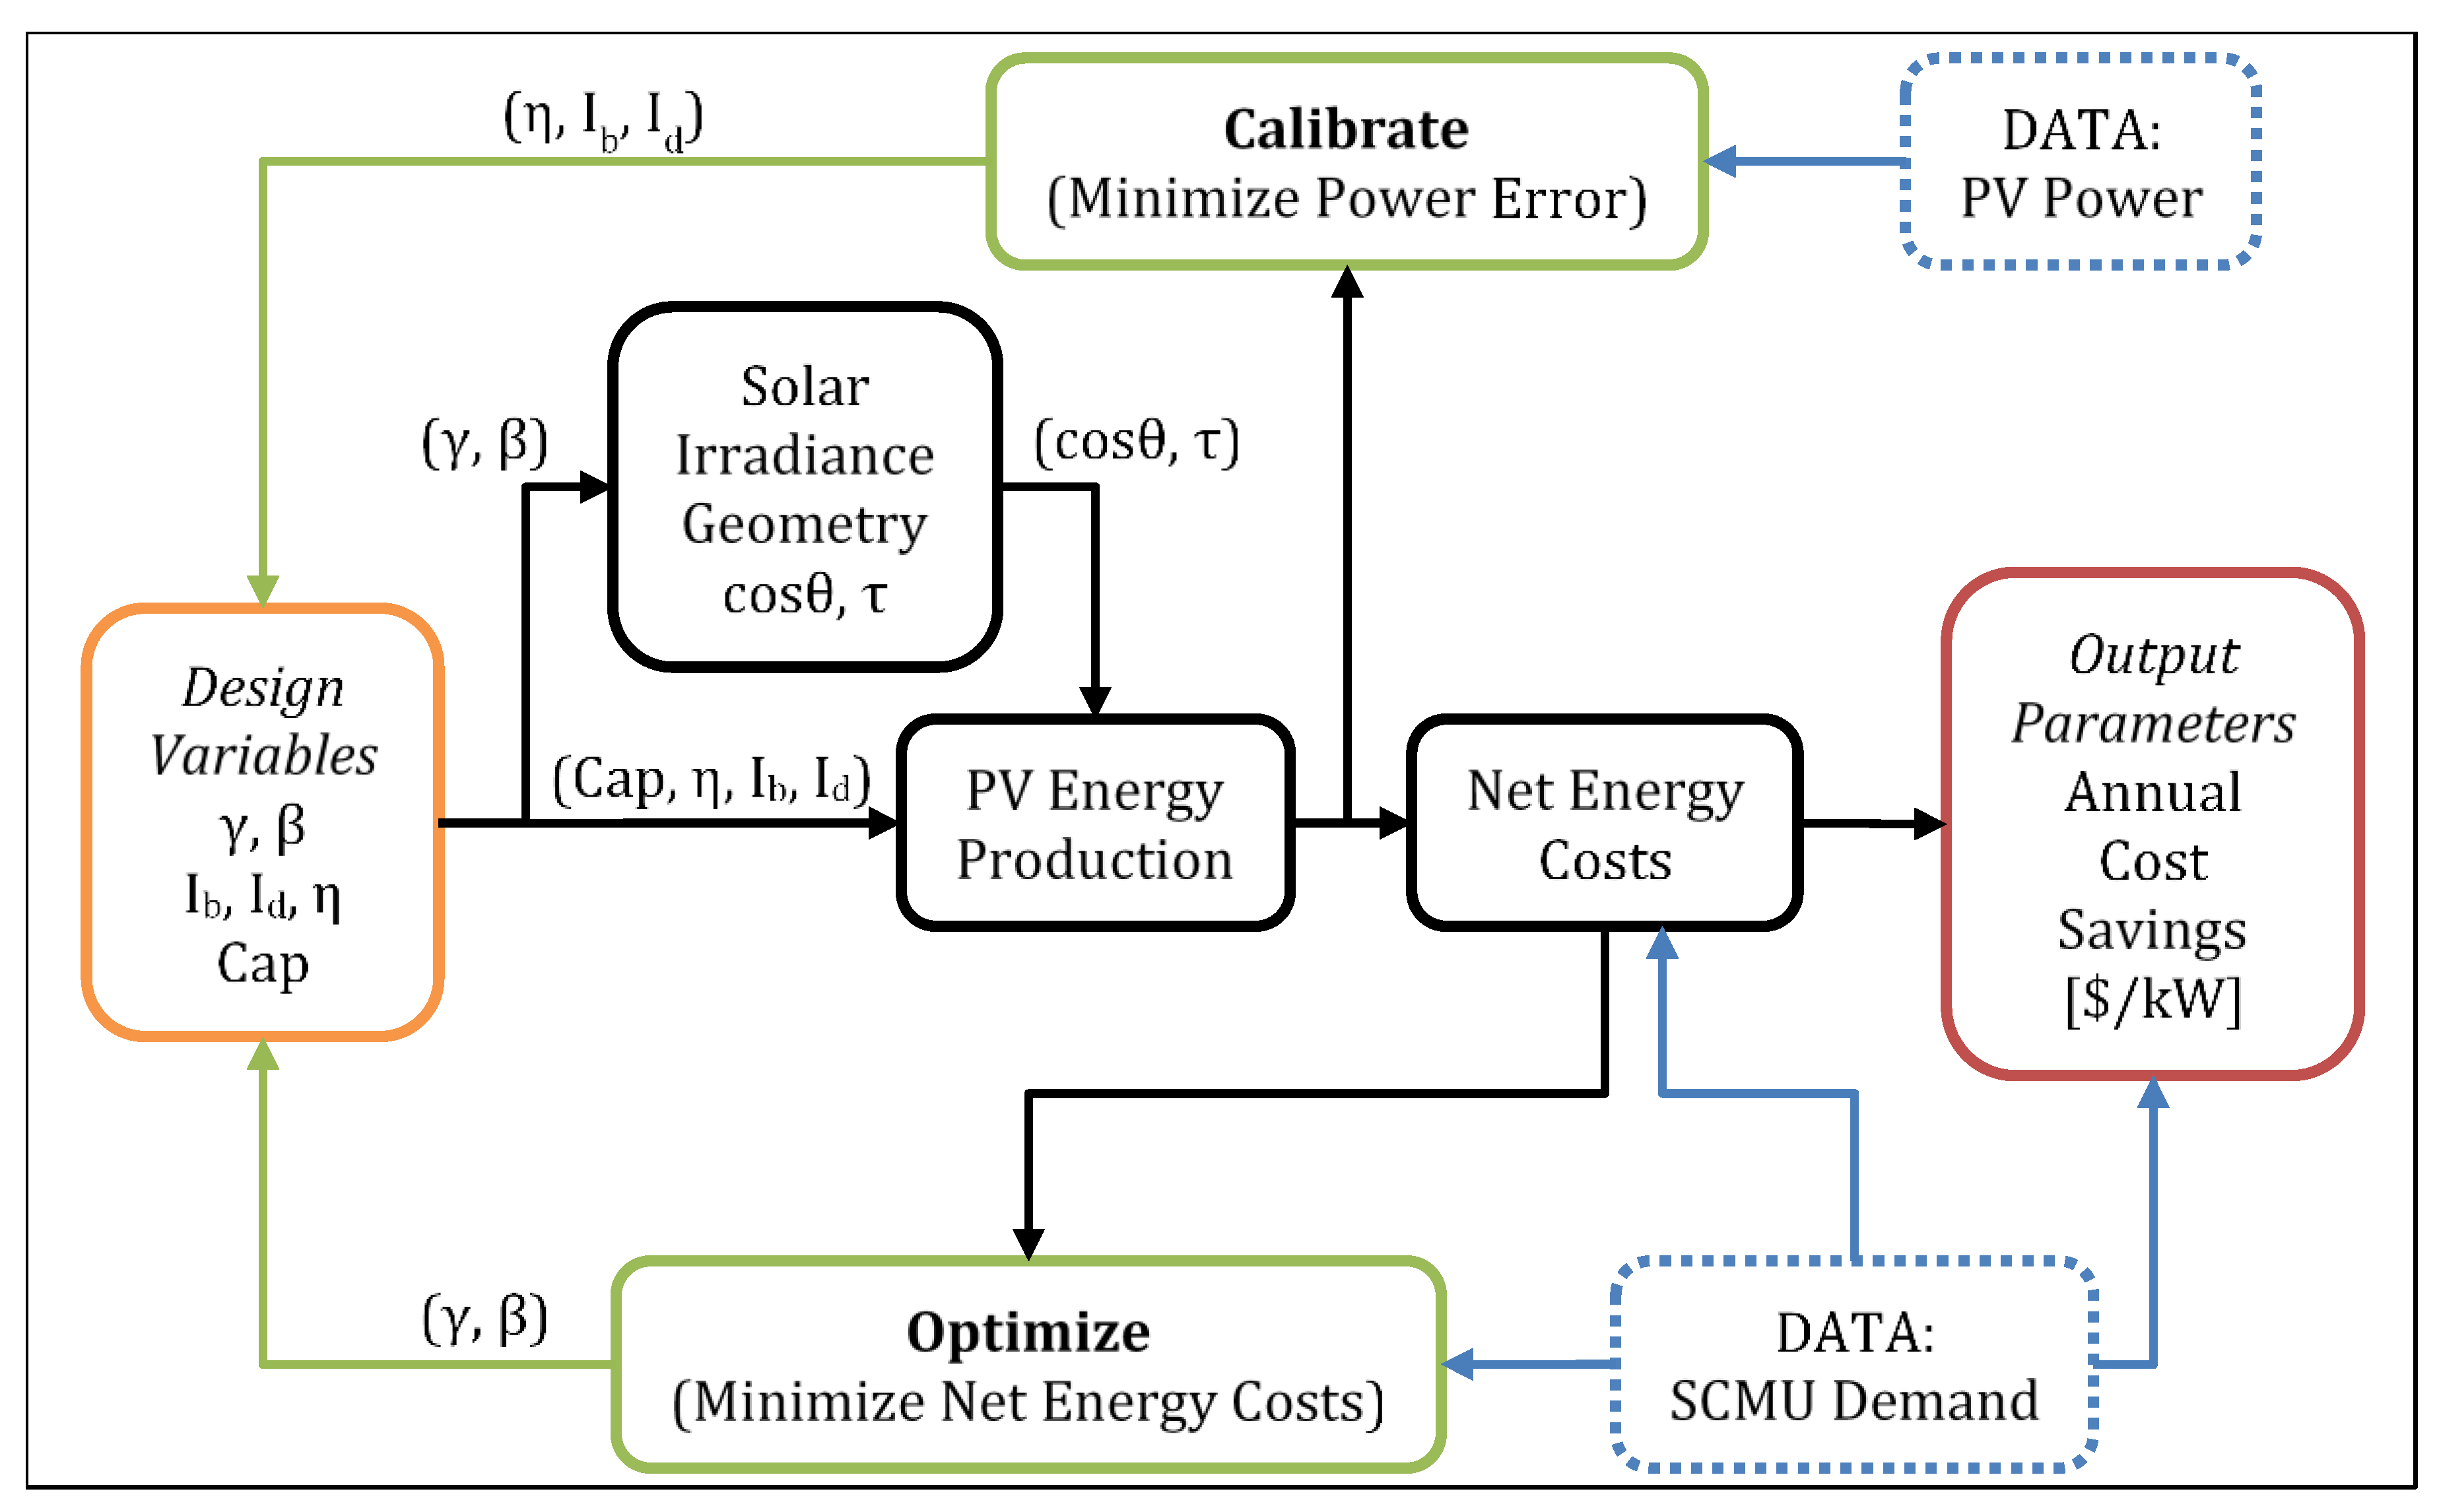
2.3. PV Optimization and Uncertainty
2.4. Alternate Rate Structures
2.5. Financial Analysis
3. Results and Discussion
3.1. VOS Optimization
3.2. Orientation Optimization
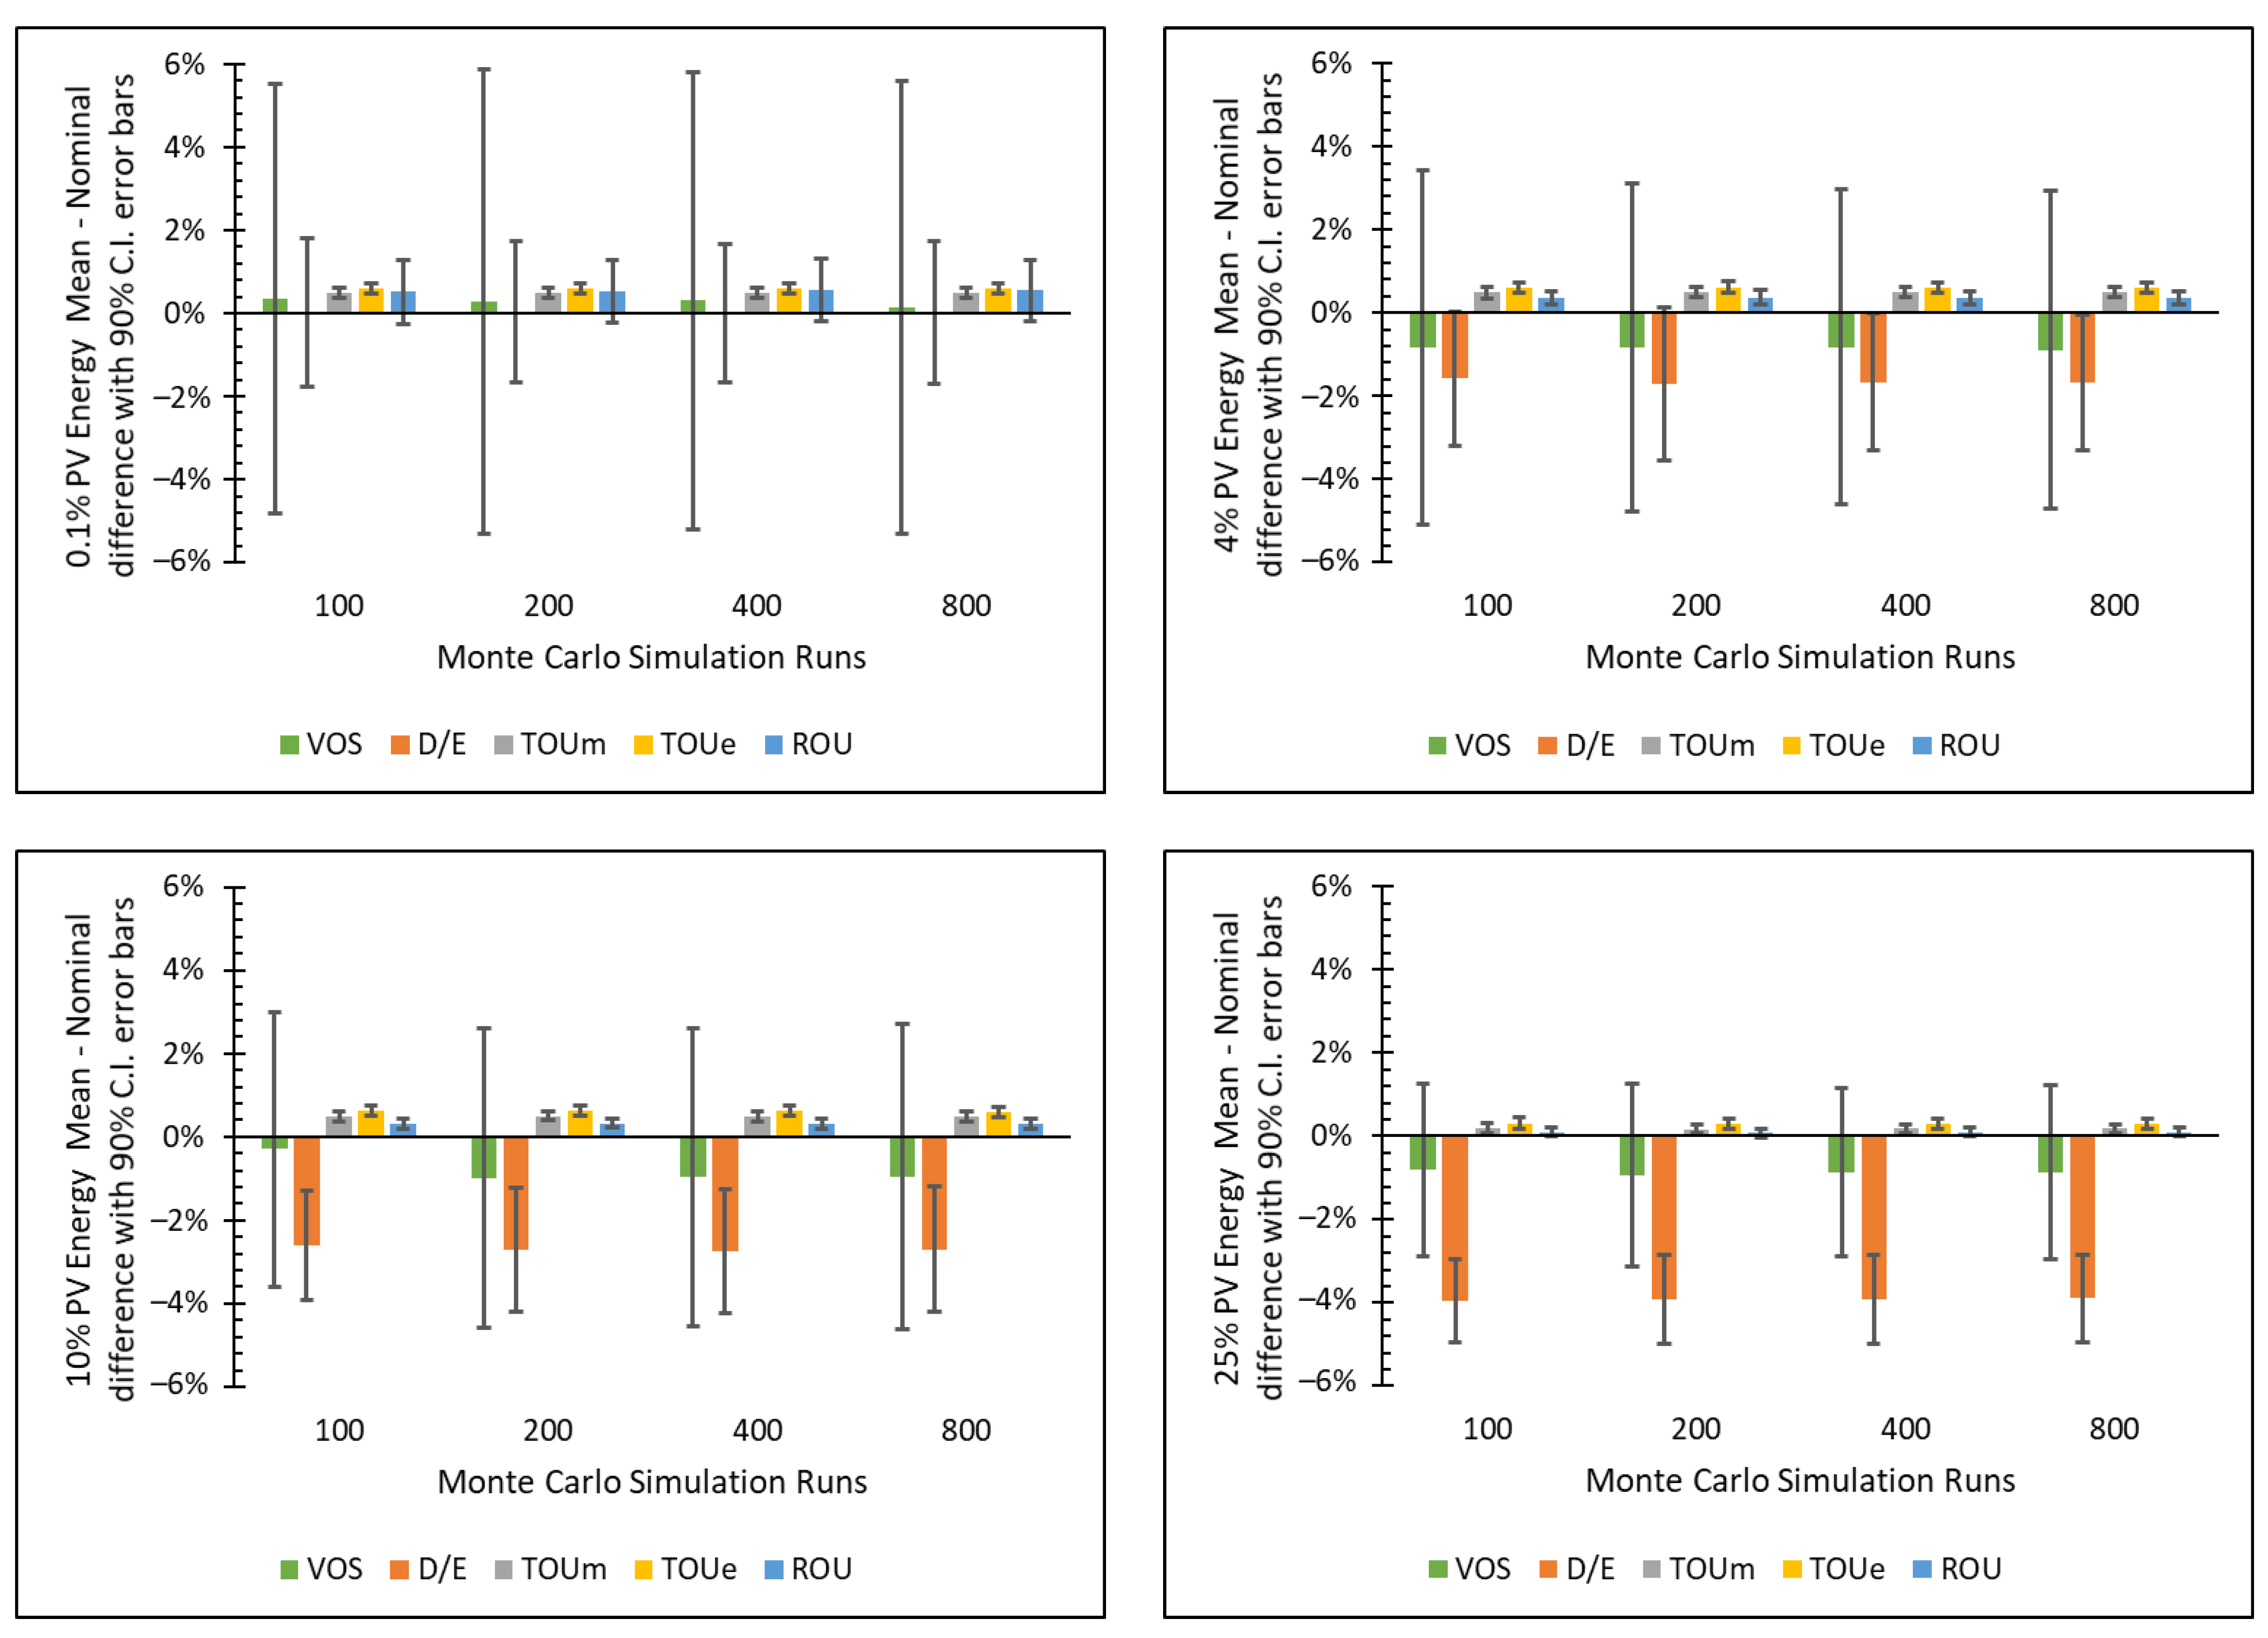
3.3. Investment Analysis
4. Conclusions
Author Contributions
Funding
Data Availability Statement
Acknowledgments
Conflicts of Interest
Abbreviations
| ATB | Annual Technology Baseline |
| CAPEX | Capital Expenditures |
| CC | Combined Cycle |
| CT | Combustion Turbine |
| CF | Capacity Factor |
| DF | Debt Fraction |
| FCR | Fixed Charge Rate |
| FOM | Fixed Operation and Maintenance |
| IR | Interest Rate |
| LAC | Levelized Annual Cost |
| LCOE | Levelized Cost of Energy |
| LDC | Load Duration Curve |
| MACRS | Modified Accelerated Cost Recovery System |
| NPV | Net Present Value |
| NREL | National Renewable Energy Lab |
| PV | Photovoltaic |
| RES | Renewable Energy Systems |
| RLDC | Residual Load Duration Curve |
| RMSE | Root Mean Square Error |
| ROU | Rate-of-Use |
| RROE | Rate of Return on Equity |
| SCMU | Sioux Center Municipal Utilities |
| SSW | South-Southwest |
| T&D | Transmission and Distribution |
| TOUm | Time-of-Use midday |
| TOUe | Time-of-Use evening |
| TMY | Typical Meteorological Year |
| TR | Tax Rate |
| U.S. EIA | United States Energy Information Administration |
| VOM | Variable Operation and Maintenance |
| VOR | Value of Resource |
| VOS | Value of Solar |
| WACC | Weighted Average Cost of Capital |
| WWSIS | Western Wind and Solar Integration Study |
Appendix A

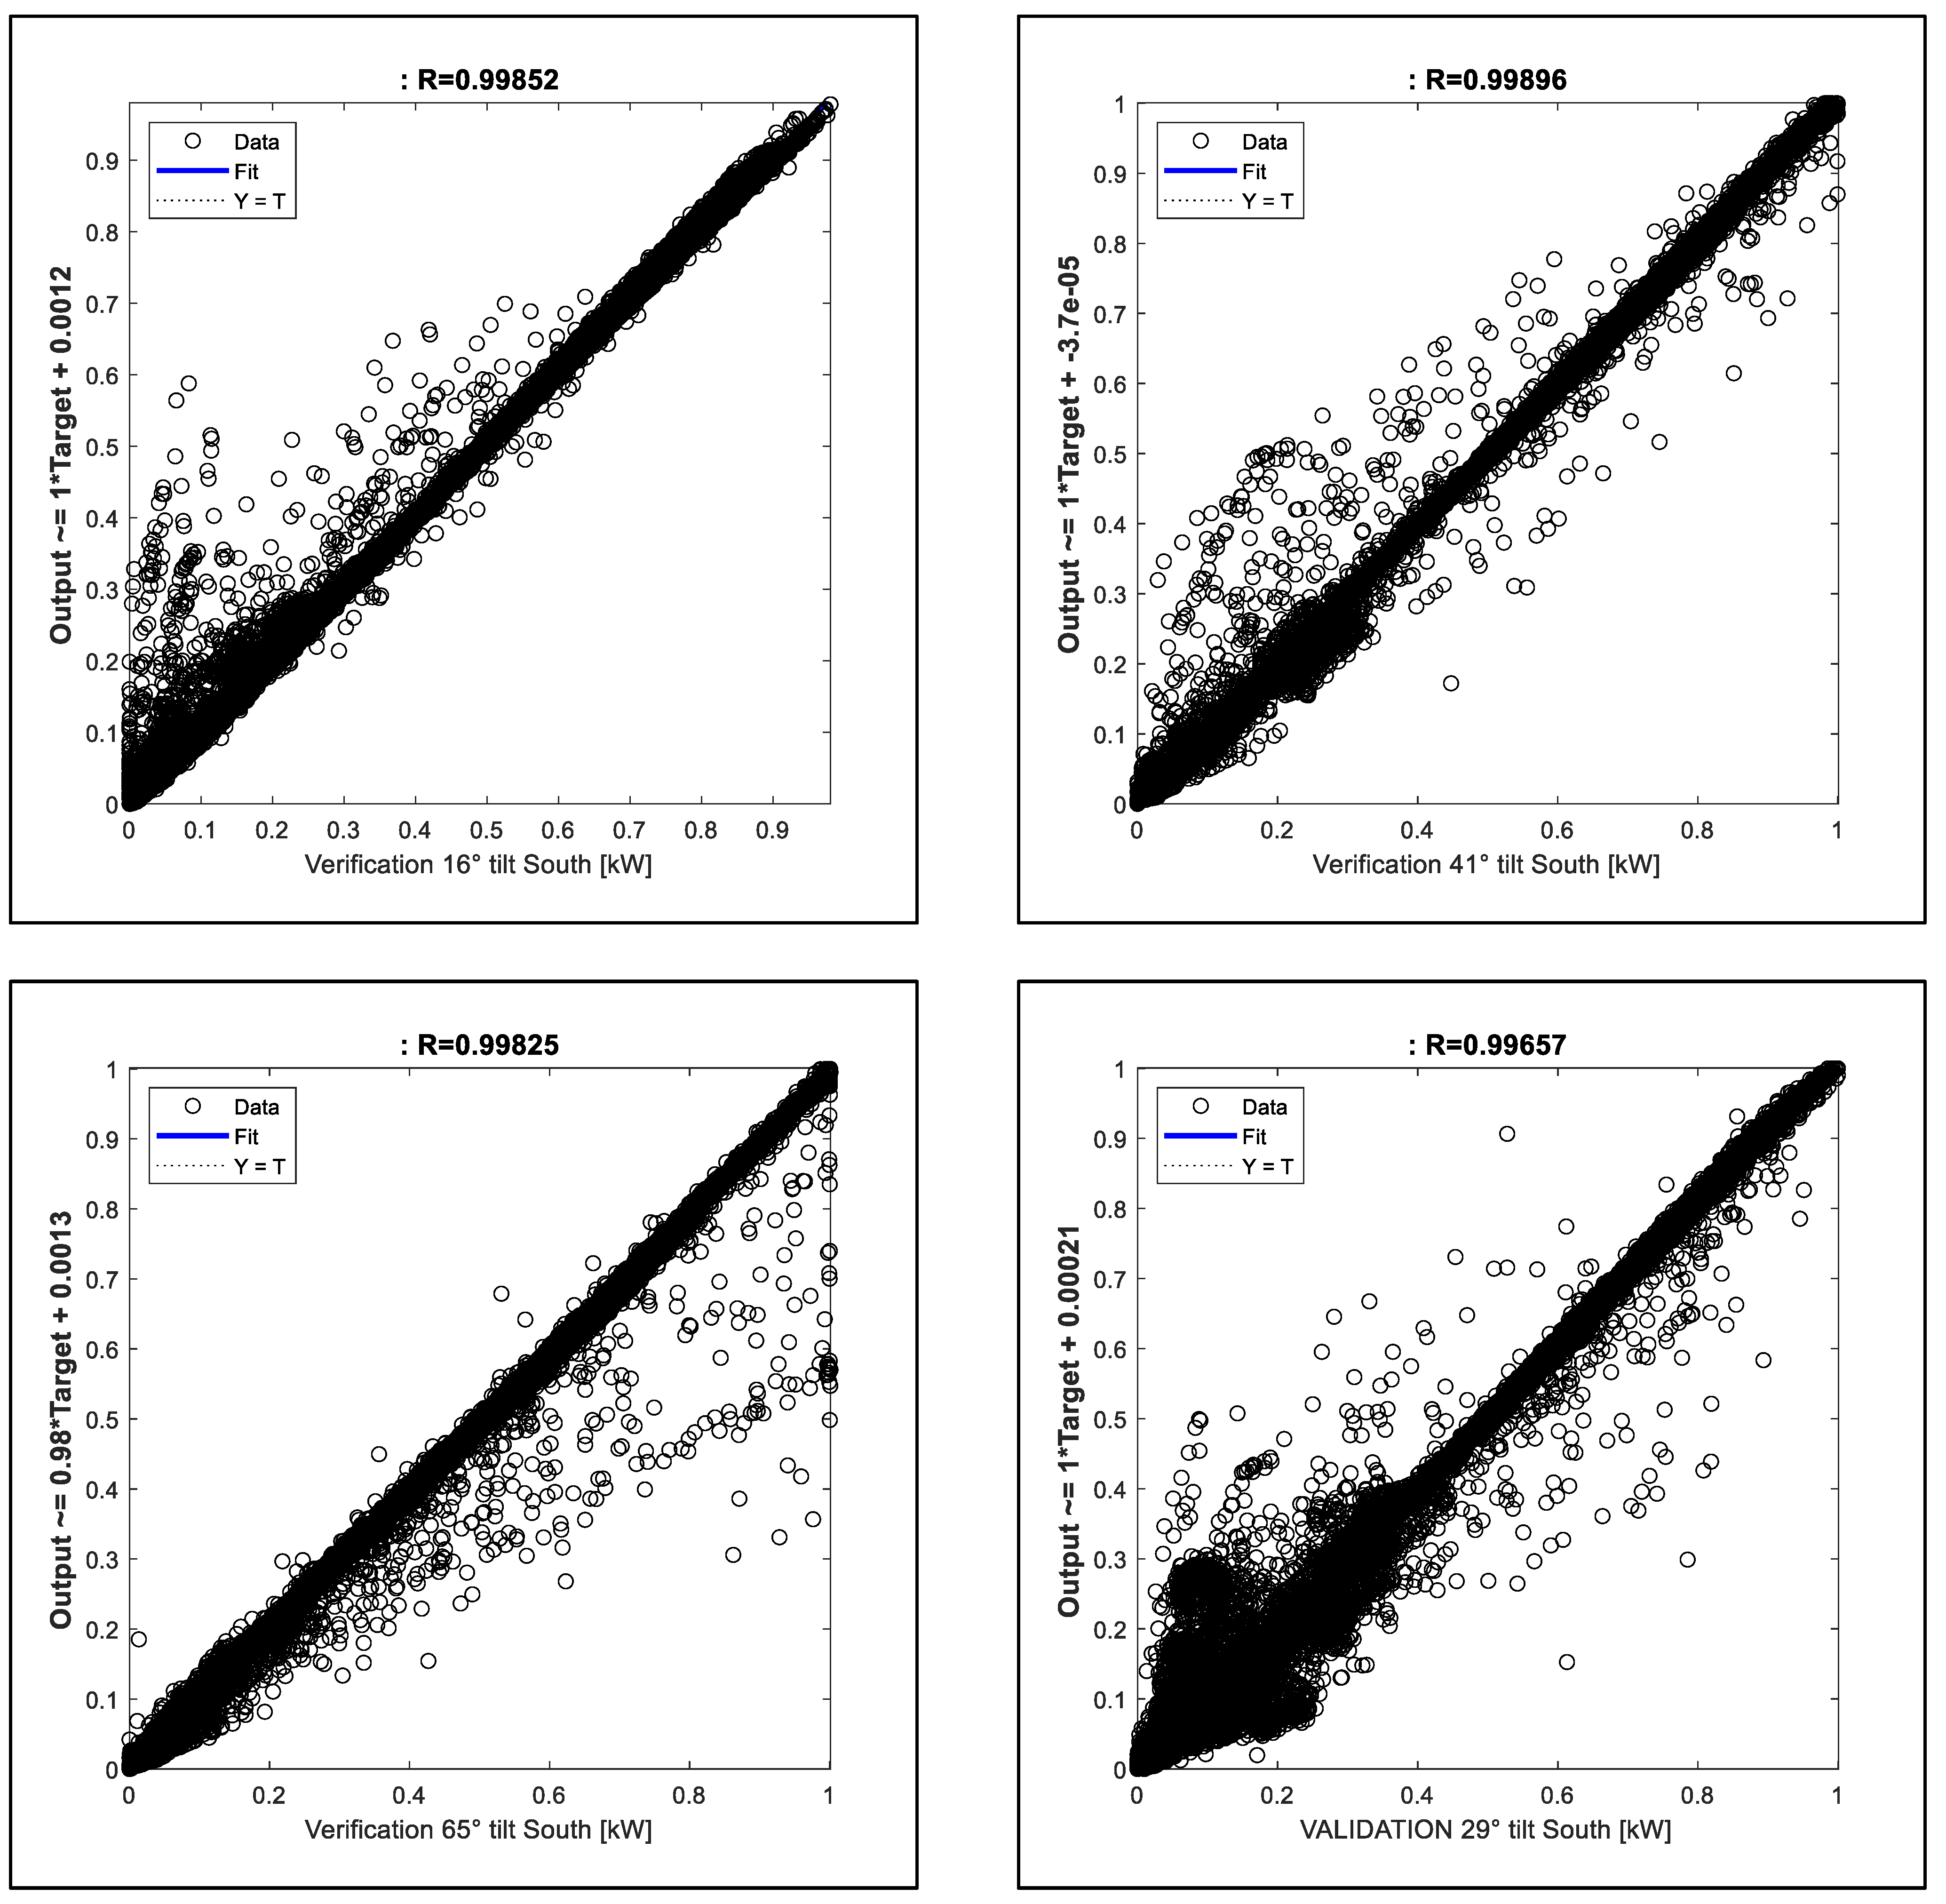
| Configuration | Data Annual Energy [kWh/kW] | TMY Annual Energy [kWh/kW] | TMY to Data Difference | Production Data Model Annual [kWh/kW] | Model to Data Difference |
|---|---|---|---|---|---|
| South, 16° Tilt | 1383 | 1390 | +0.5% | 1400 | +1.2% |
| South, 29° Tilt | 1459 | 1464 | +0.3% | 1465 | +0.4% |
| South, 41° Tilt | 1476 | 1479 | +0.2% | 1475 | −0.1% |
| South, 65° Tilt | 1366 | 1359 | −0.5% | 1355 | −0.8% |
| One-Axis Tracking | - | 1616 | - | 1571 | - |
References
- U.S. EIA. Electricity: Detailed State Data 2021. Available online: https://www.eia.gov/electricity/data/state/ (accessed on 28 June 2021).
- U.S. EIA. Annual Energy Outlook 2020 with Projections to 2050; U.S. Energy Information Administration: Washington, DC, USA, 2020.
- Bloom, A.; Townsend, A.; Palchak, D.; Novacheck, J.; King, J.; Barrows, C.; Ibanez, E.; O’Connell, M.; Jordan, G.; Roberts, B.; et al. Eastern Renewable Generation Integration Study; TP-6A20-64; National Renewable Energy Laboratory: Golden, CO, USA, 2016.
- Miller, N.W.; Shao, M.; Pajic, S.; D’Aquila, R. Western Wind and Solar Integration Study Phase 3: Frequency Response and Transient Stability; National Renewable Energy Laboratory: Golden, CO, USA, 2014; pp. 1–213.
- Lew, D.; Piwko, D.; Miller, N.; Jordan, G.; Clark, K.; Freeman, L. How Do High Levels of Wind and Solar Impact the Grid? The Western Wind and Solar Integration Study; TP-5500-50057; National Renewable Energy Laboratory: Golden, CO, USA, 2010; pp. 1–11.
- Hirth, L.; Ueckerdt, F.; Edenhofer, O. Integration costs revisited—An economic framework for wind and solar variability. Renew. Energy 2015, 74, 925–939. [Google Scholar] [CrossRef]
- Heptonstall, P.J.; Gross, R.J.K. A systematic review of the costs and impacts of integrating variable renewables into power grids. Nat. Energy 2021, 6, 72–83. [Google Scholar] [CrossRef]
- Lew, D.; Miller, N.; Clark, K.; Jordan, G. Impact of High Solar Penetration in the Western Interconnection; National Renewable Energy Laboratory: Golden, CO, USA, 2010; pp. 1–9.
- Taylor, M.; McLaren, J.; Cory, K.; Davidovich, T.; Sterling, J.; Makhyoun, M. Value of Solar: Program Design and Implementation Considerations; National Renewable Energy Laboratory: Golden, CO, USA, 2015.
- National Association of Regulatory Utility Commissioners. Distributed Energy Resources Rate Design and Compensation; National Association of Regulatory Utility Commissioners: Washington, DC, USA, 2016. [Google Scholar]
- U.S. EIA. Levelized Cost and Levelized Avoided Cost of New Generation Resources in the Annual Energy Outlook 2020; U.S. Energy Information Administration: Washington, DC, USA, 2020.
- U.S. EIA. Assumptions to the Annual Energy Outlook 2020: Electricity Market Module; U.S. Energy Information Administration: Washington, DC, USA, 2020.
- Denholm, P.; Margolis, R.; Palmintier, B.; Barrows, C.; Ibanez, E.; Bird, L. Methods for Analyzing the Benefits and Costs of Distributed Photovoltaic Generation to the U.S. Electric Utility System; National Renewable Energy Laboratory: Golden, CO, USA, 2014.
- O’Shaughnessy, E.; Ardani, K. Distributed rate design: A review of early approaches and practical considerations for value of solar tariffs. Electr. J. 2020, 33, 106713. [Google Scholar] [CrossRef]
- Zummo, P. Rate Design for Distributed Generation Net Metering Alternatives With Public Power Case Studies; American Public Power Association: Arlington, VA, USA, 2015. [Google Scholar]
- Zummo, P.; Cartes, J.; Cater, J. Rate Design Options for Distributed Energy Resources; American Public Power Association: Arlington, VA, USA, 2016. [Google Scholar]
- Hansen, L.; Lacy, V.; Glick, D. A Review of Solar PV Benefit and Cost Studies; Rocky Mountain Institute (RMI): Basalt, CO. USA, 2013; Volume 59. [Google Scholar]
- Brown, P.R.; O’Sullivan, F.M. Spatial and temporal variation in the value of solar power across United States electricity markets. Renew. Sustain. Energy Rev. 2020, 121, 109594. [Google Scholar] [CrossRef]
- Schulte, R.H.; Fletcher, F.C. Why individual electric utilities cannot achieve 100 % clean energy. Electr. J. 2021, 34, 106909. [Google Scholar] [CrossRef]
- Cole, W.; Frazier, A.W. Impacts of increasing penetration of renewable energy on the operation of the power sector. Electr. J. 2018, 31, 24–31. [Google Scholar] [CrossRef]
- MATLAB. R2019b Update 5 (9.7.0.1319299); The Mathworks Inc.: Natick, MA, USA, 2020. [Google Scholar]
- Lave, M.; Kleissl, J. Optimum fixed orientations and benefits of tracking for capturing solar radiation in the continental United States. Renew. Energy 2011, 36, 1145–1152. [Google Scholar] [CrossRef] [Green Version]
- Rhodes, J.D.; Upshaw, C.R.; Cole, W.J.; Holcomb, C.L.; Webber, M.E. A multi-objective assessment of the effect of solar PV array orientation and tilt on energy production and system economics. Sol. Energy 2014, 108, 28–40. [Google Scholar] [CrossRef] [Green Version]
- Milligan, M.; Ela, E.G.; Hodge, B.-M.S.; Kirby, B.; Lew, D.; Clark, C.; Decesaro, J. Integration of Variable Generation, Cost-Causation, and Integration Costs. Electr. J. 2011, 24, 51–63. [Google Scholar] [CrossRef]
- GE Energy. Western Wind and Solar Integration Study; National Renewable Energy Laboratory: Golden, CO, USA, 2010.
- Lew, D.; Brinkman, G.; Ibanez, E.; Hodge, B.; King, J. The western wind and solar integration study phase 2. Contract 2013, 303, 275–3000. [Google Scholar]
- Missouri River Energy Services. MRES Energy Resources Generation 2020. Available online: https://www.mrenergy.com/energy-resources/generation (accessed on 10 March 2022).
- Ueckerdt, F.; Hirth, L.; Luderer, G.; Edenhofer, O. System LCOE: What are the costs of variable renewables? Energy 2013, 63, 61–75. [Google Scholar] [CrossRef]
- EBP US. Failure to Act: Electric Infrastructure Investment Gaps in a Rapidly Changing Environment, 2020; EBP US: Boston, MA, USA, 2020. [Google Scholar] [CrossRef] [Green Version]
- U.S. EIA. Natural Gas Explained: Natural Gas and the Environment 2020. Available online: https://www.eia.gov/energyexplained/natural-gas/natural-gas-and-the-environment.php (accessed on 15 October 2020).
- Lew, D.; Brinkman, G.; Kumar, N.; Besuner, P.; Agan, D.; Lefton, S. Impacts of Wind and Solar on Fossil-Fueled Generators. In Proceedings of the IEEE Power and Energy Society General Meeting, San Diego, CA, USA, 22–26 July 2012; pp. 1–8. [Google Scholar]
- U.S. Government. Technical Support Document: Technical Update of the Social Cost of Carbon for Regulatory Impact Analysis under Executive Order No. 12866; Office of Management and Budget: Washington, DC, USA, 2015; pp. 65–88.
- Black & Veatch. Power Plant Engineering; Chapman & Hall: New York, NY, USA, 1996. [Google Scholar]
- Perez, R.; Ineichen, P.; Seals, R.; Michalsky, J.; Stewart, R. Modeling daylight availability and irradiance components from direct and global irradiance. Sol. Energy 1990, 44, 271–289. [Google Scholar] [CrossRef] [Green Version]
- Dobos, A.P. PVWatts Version 5 Manual (NREL/TP-6A20-62641); U.S. Energy Information Administration: Washington, DC, USA, 2014; Volume 20. [CrossRef] [Green Version]
- NREL. NREL’s PVWatts® Calculator 2019. Available online: http://pvwatts.nrel.gov/ (accessed on 8 May 2020).
- NREL. Equations and Variables in ATB. Annual Technology Baseline 2021. Available online: https://atb.nrel.gov/electricity/2021/equations_&_variables (accessed on 10 March 2022).
- Feldman, D.; Ramasamy, V.; Fu, R.; Ramdas, A.; Desai, J.; Margolis, R. U.S. Solar Photovoltaic System and Energy Storage Cost Benchmark: Q1 2020; National Renewable Energy Laboratory: Golden, CO, USA, 2021; pp. 1–120.
- Southern California Edison. Time-of-Use (TOU) Rate Plans 2021. Available online: https://www.sce.com/residential/rates/Time-Of-Use-Residential-Rate-Plans (accessed on 5 June 2021).
- Hydro One. Electricity Pricing and Costs 2021. Available online: https://www.hydroone.com/rates-and-billing/rates-and-charges/electricity-pricing-and-costs (accessed on 5 June 2021).
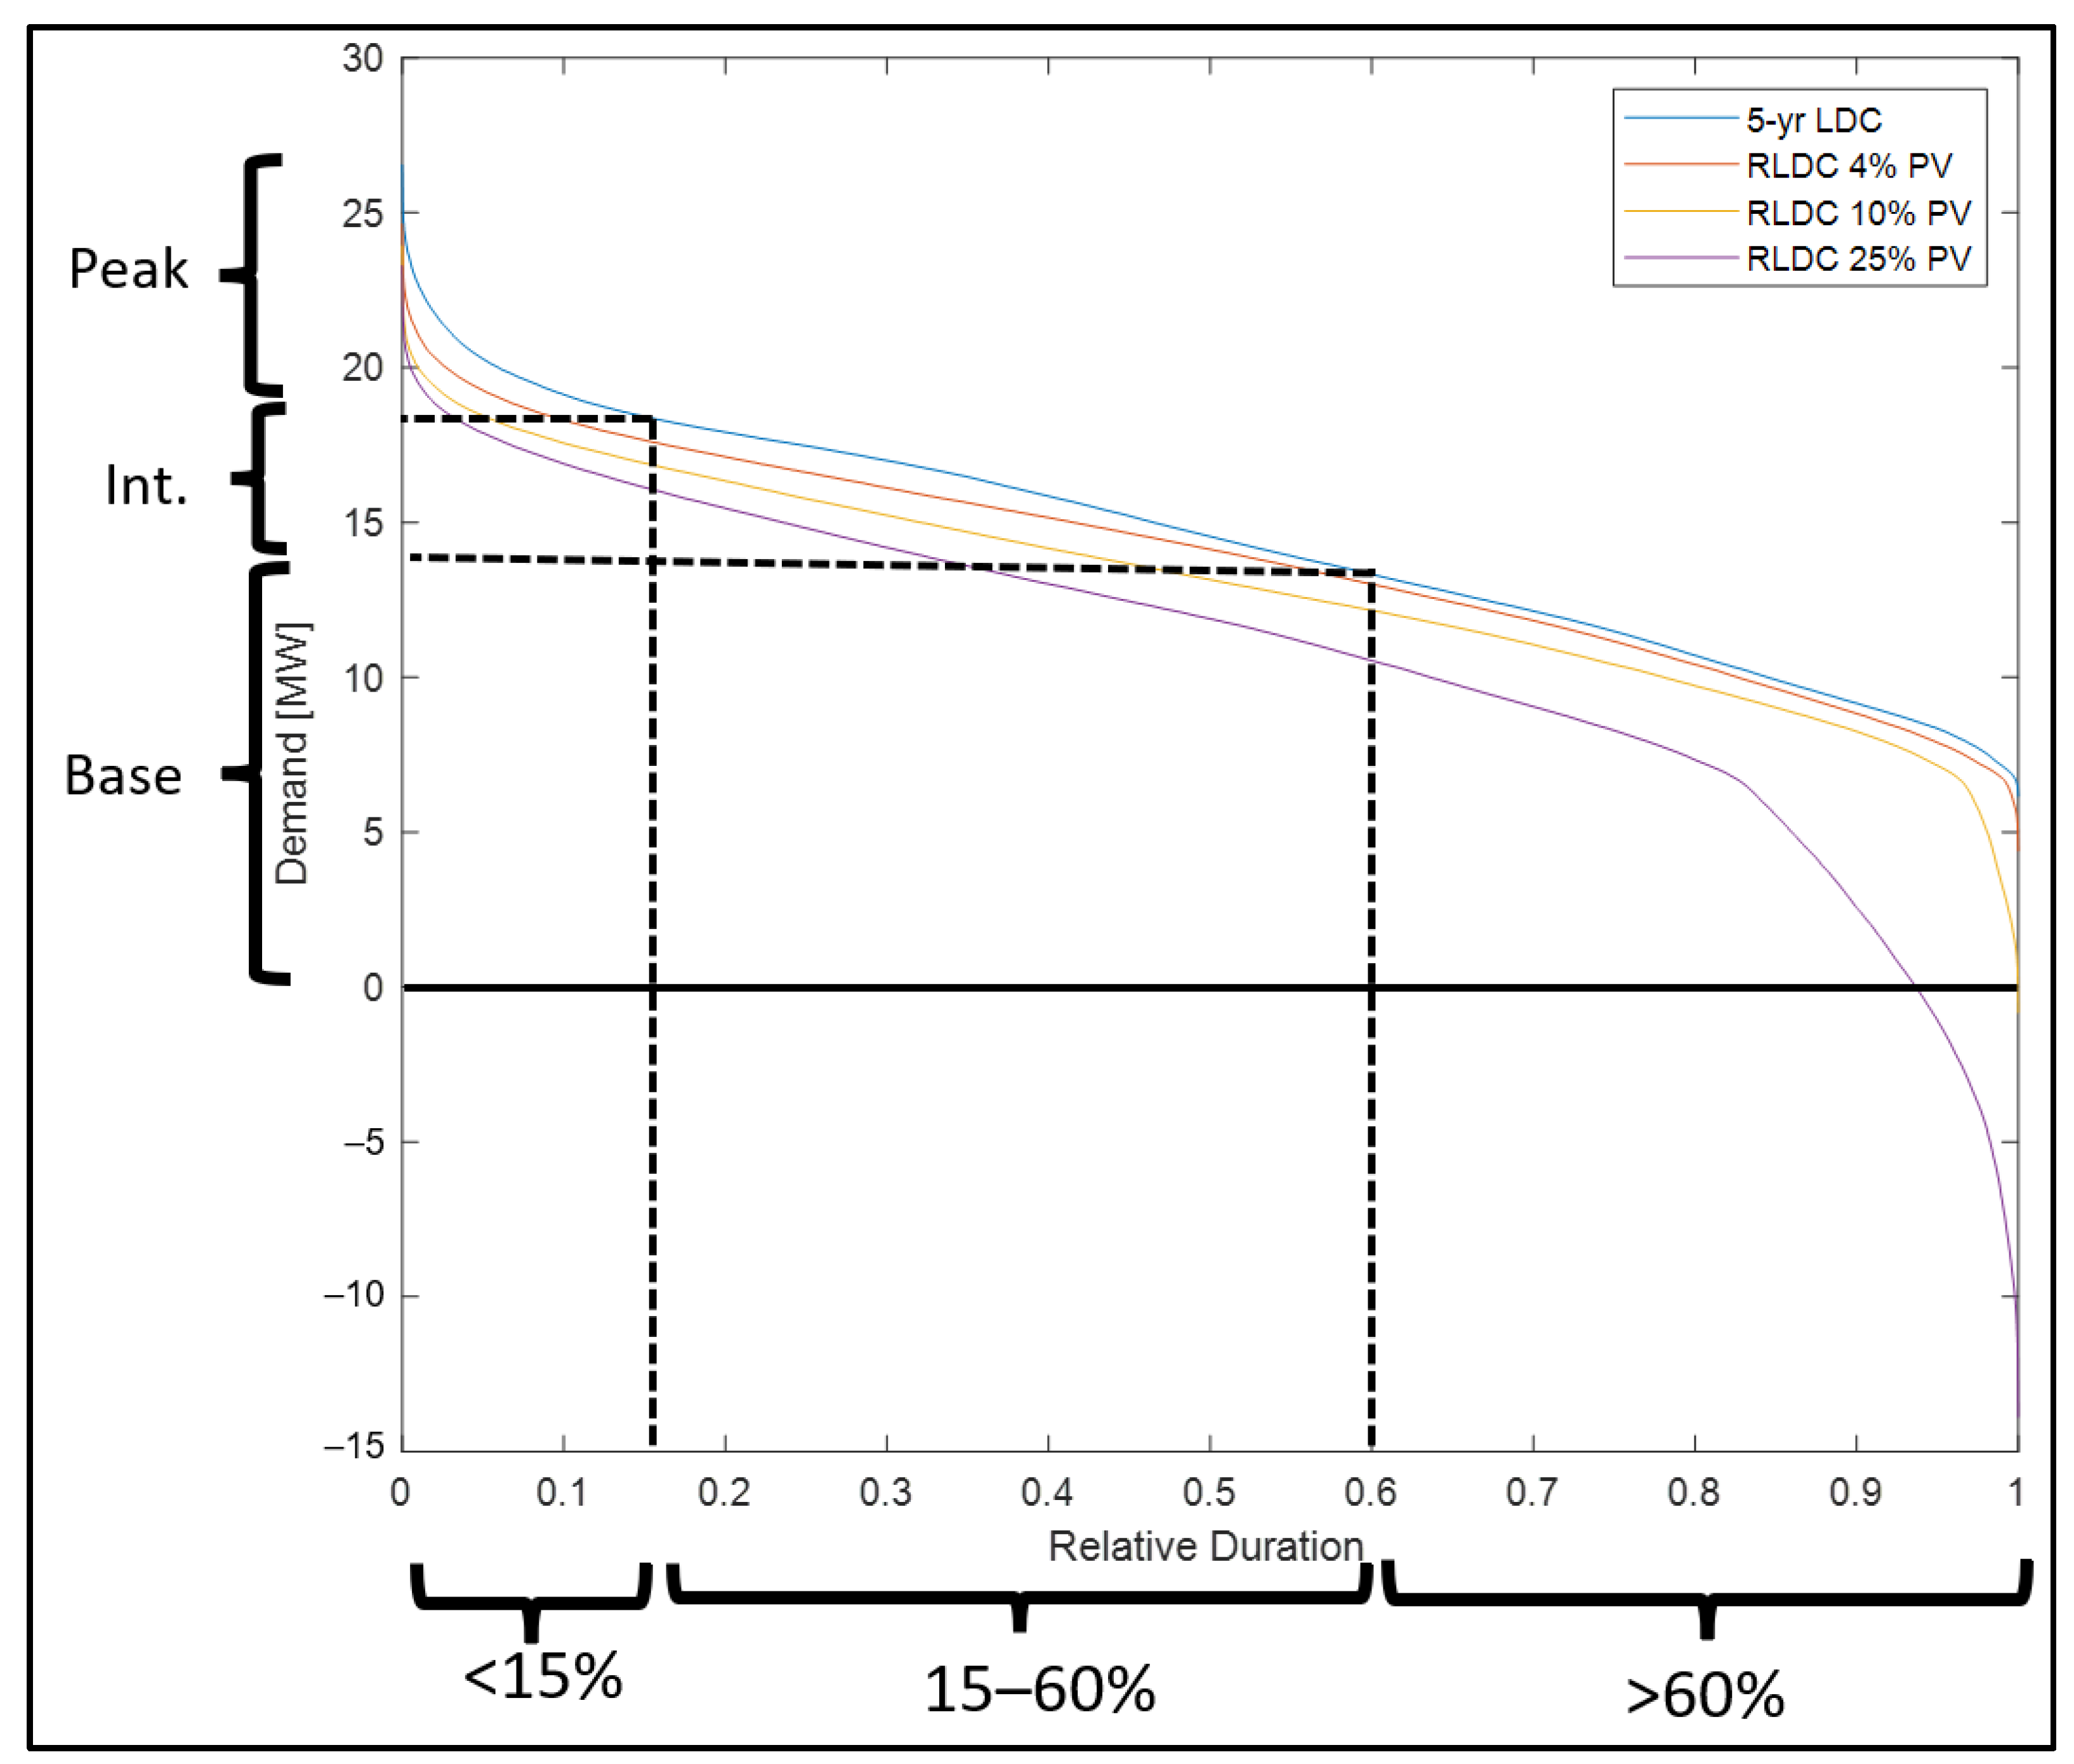
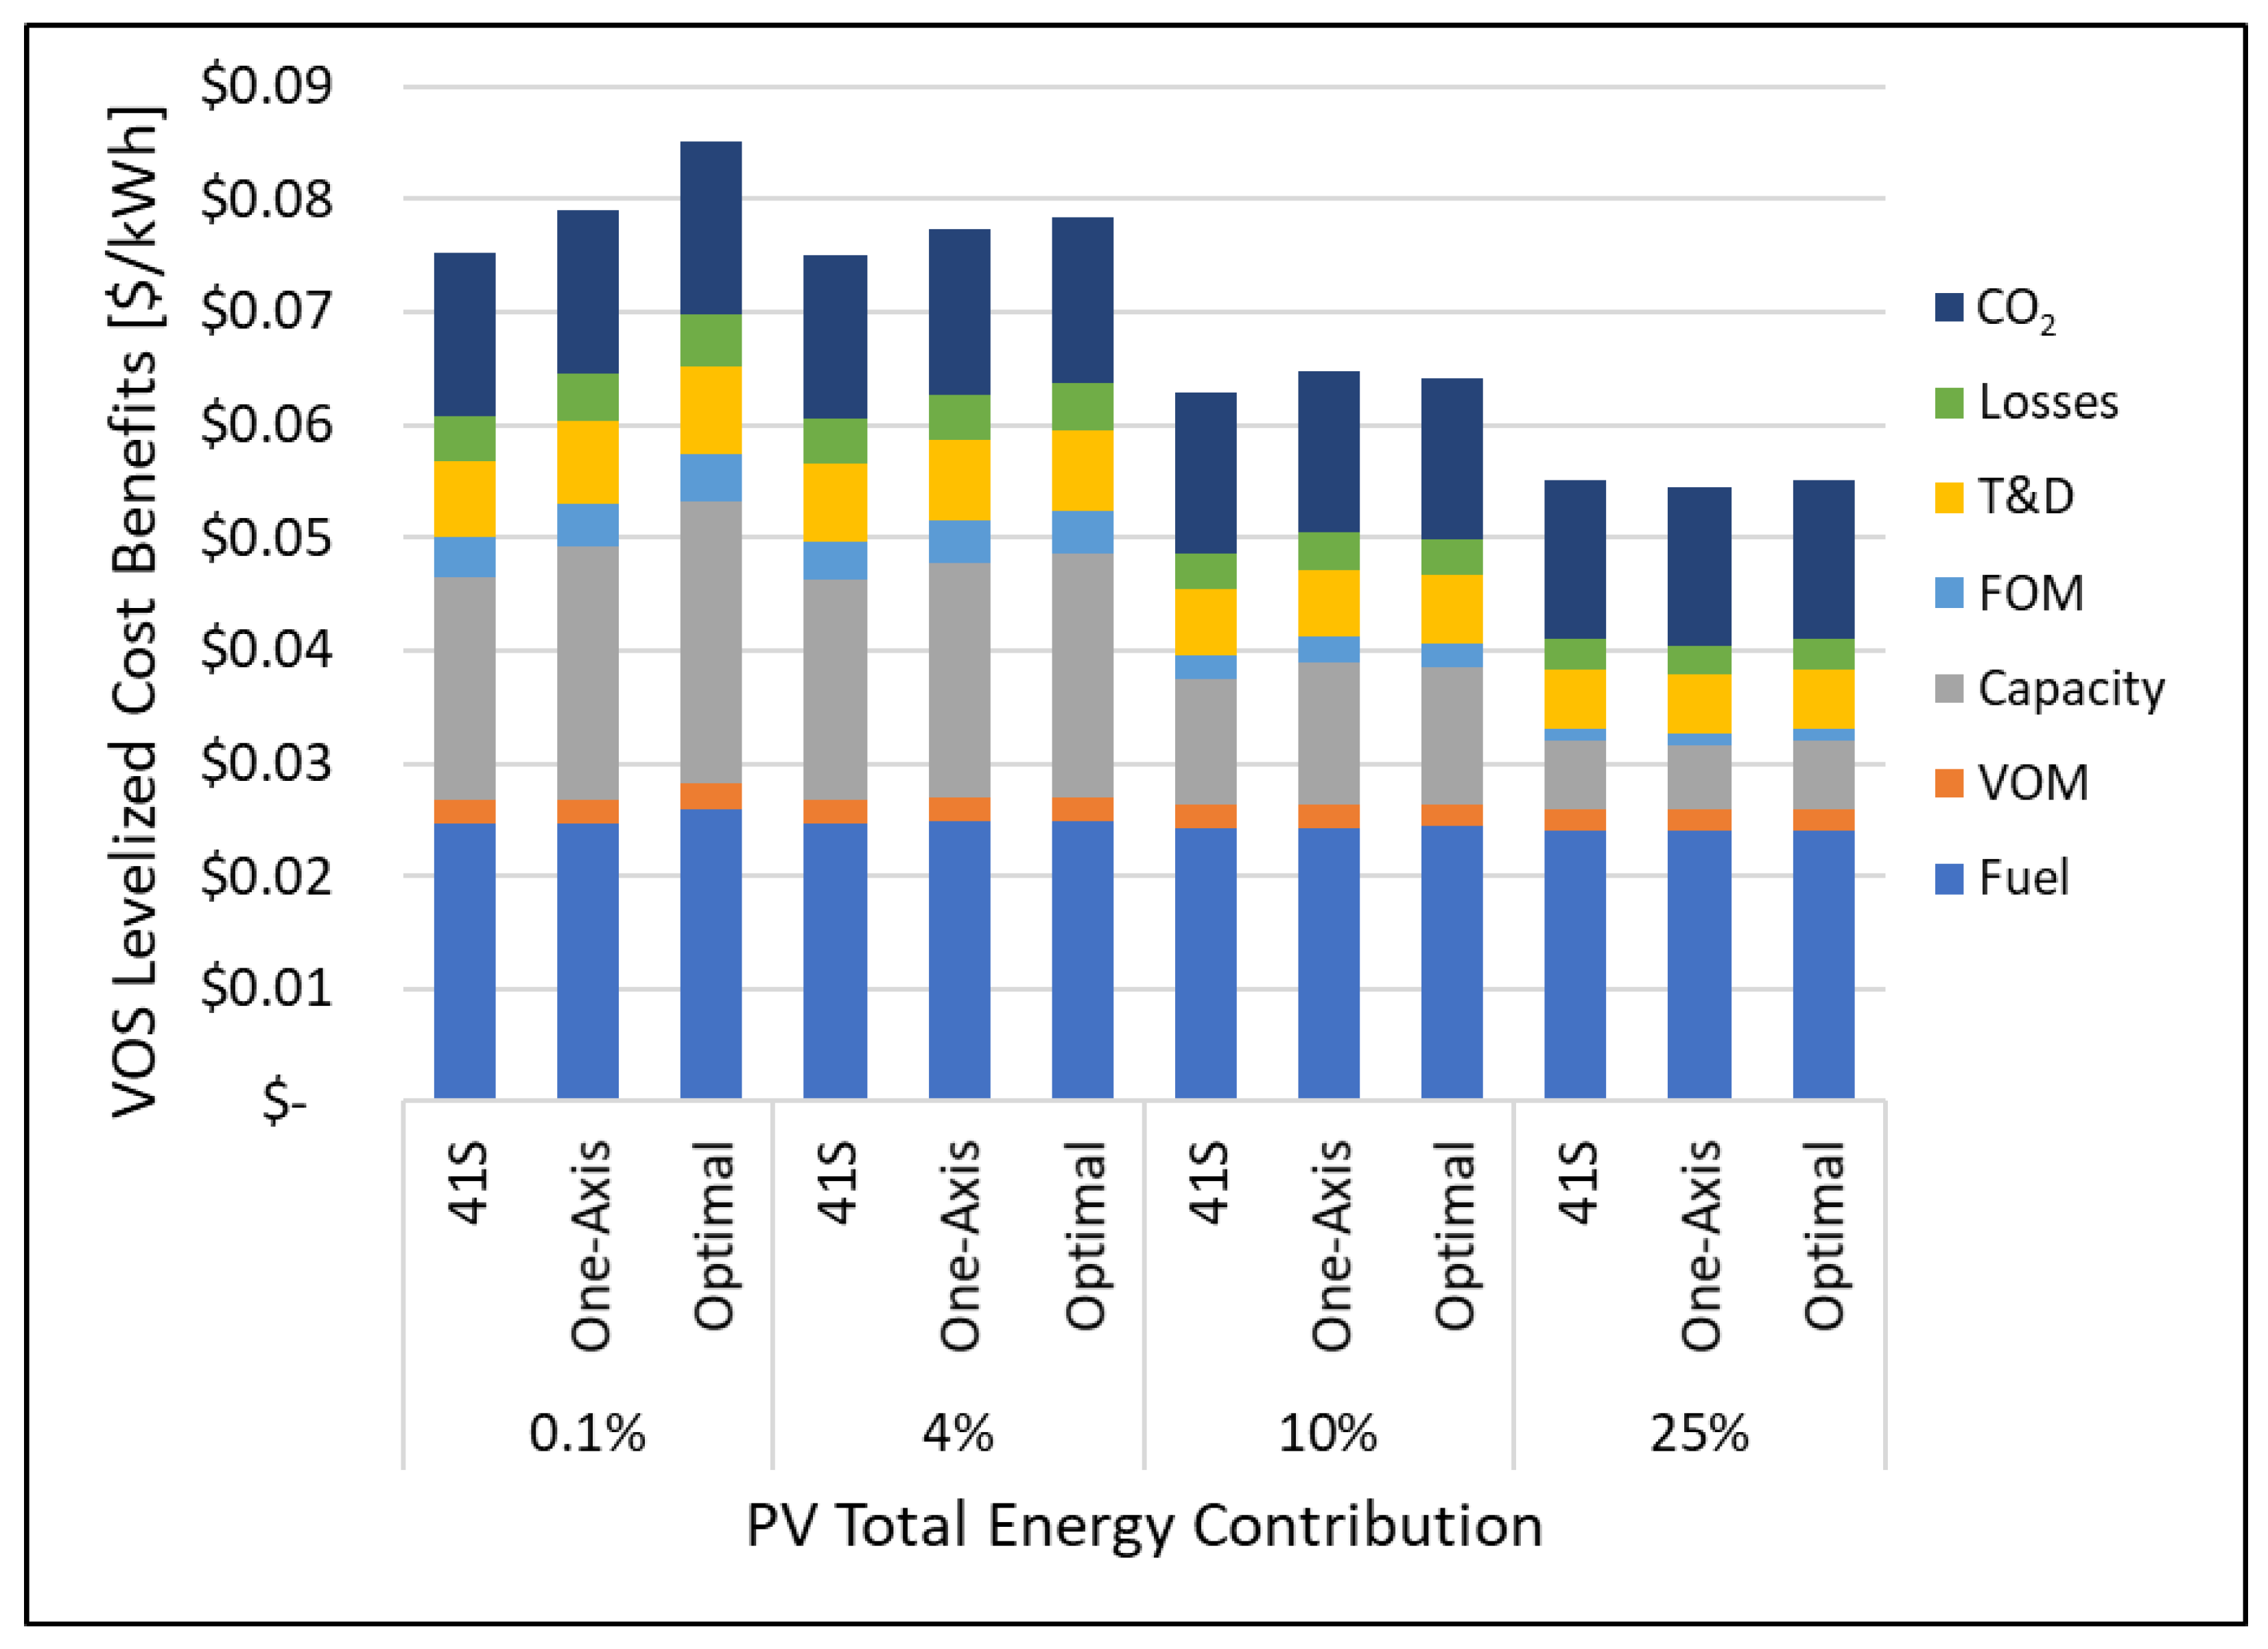
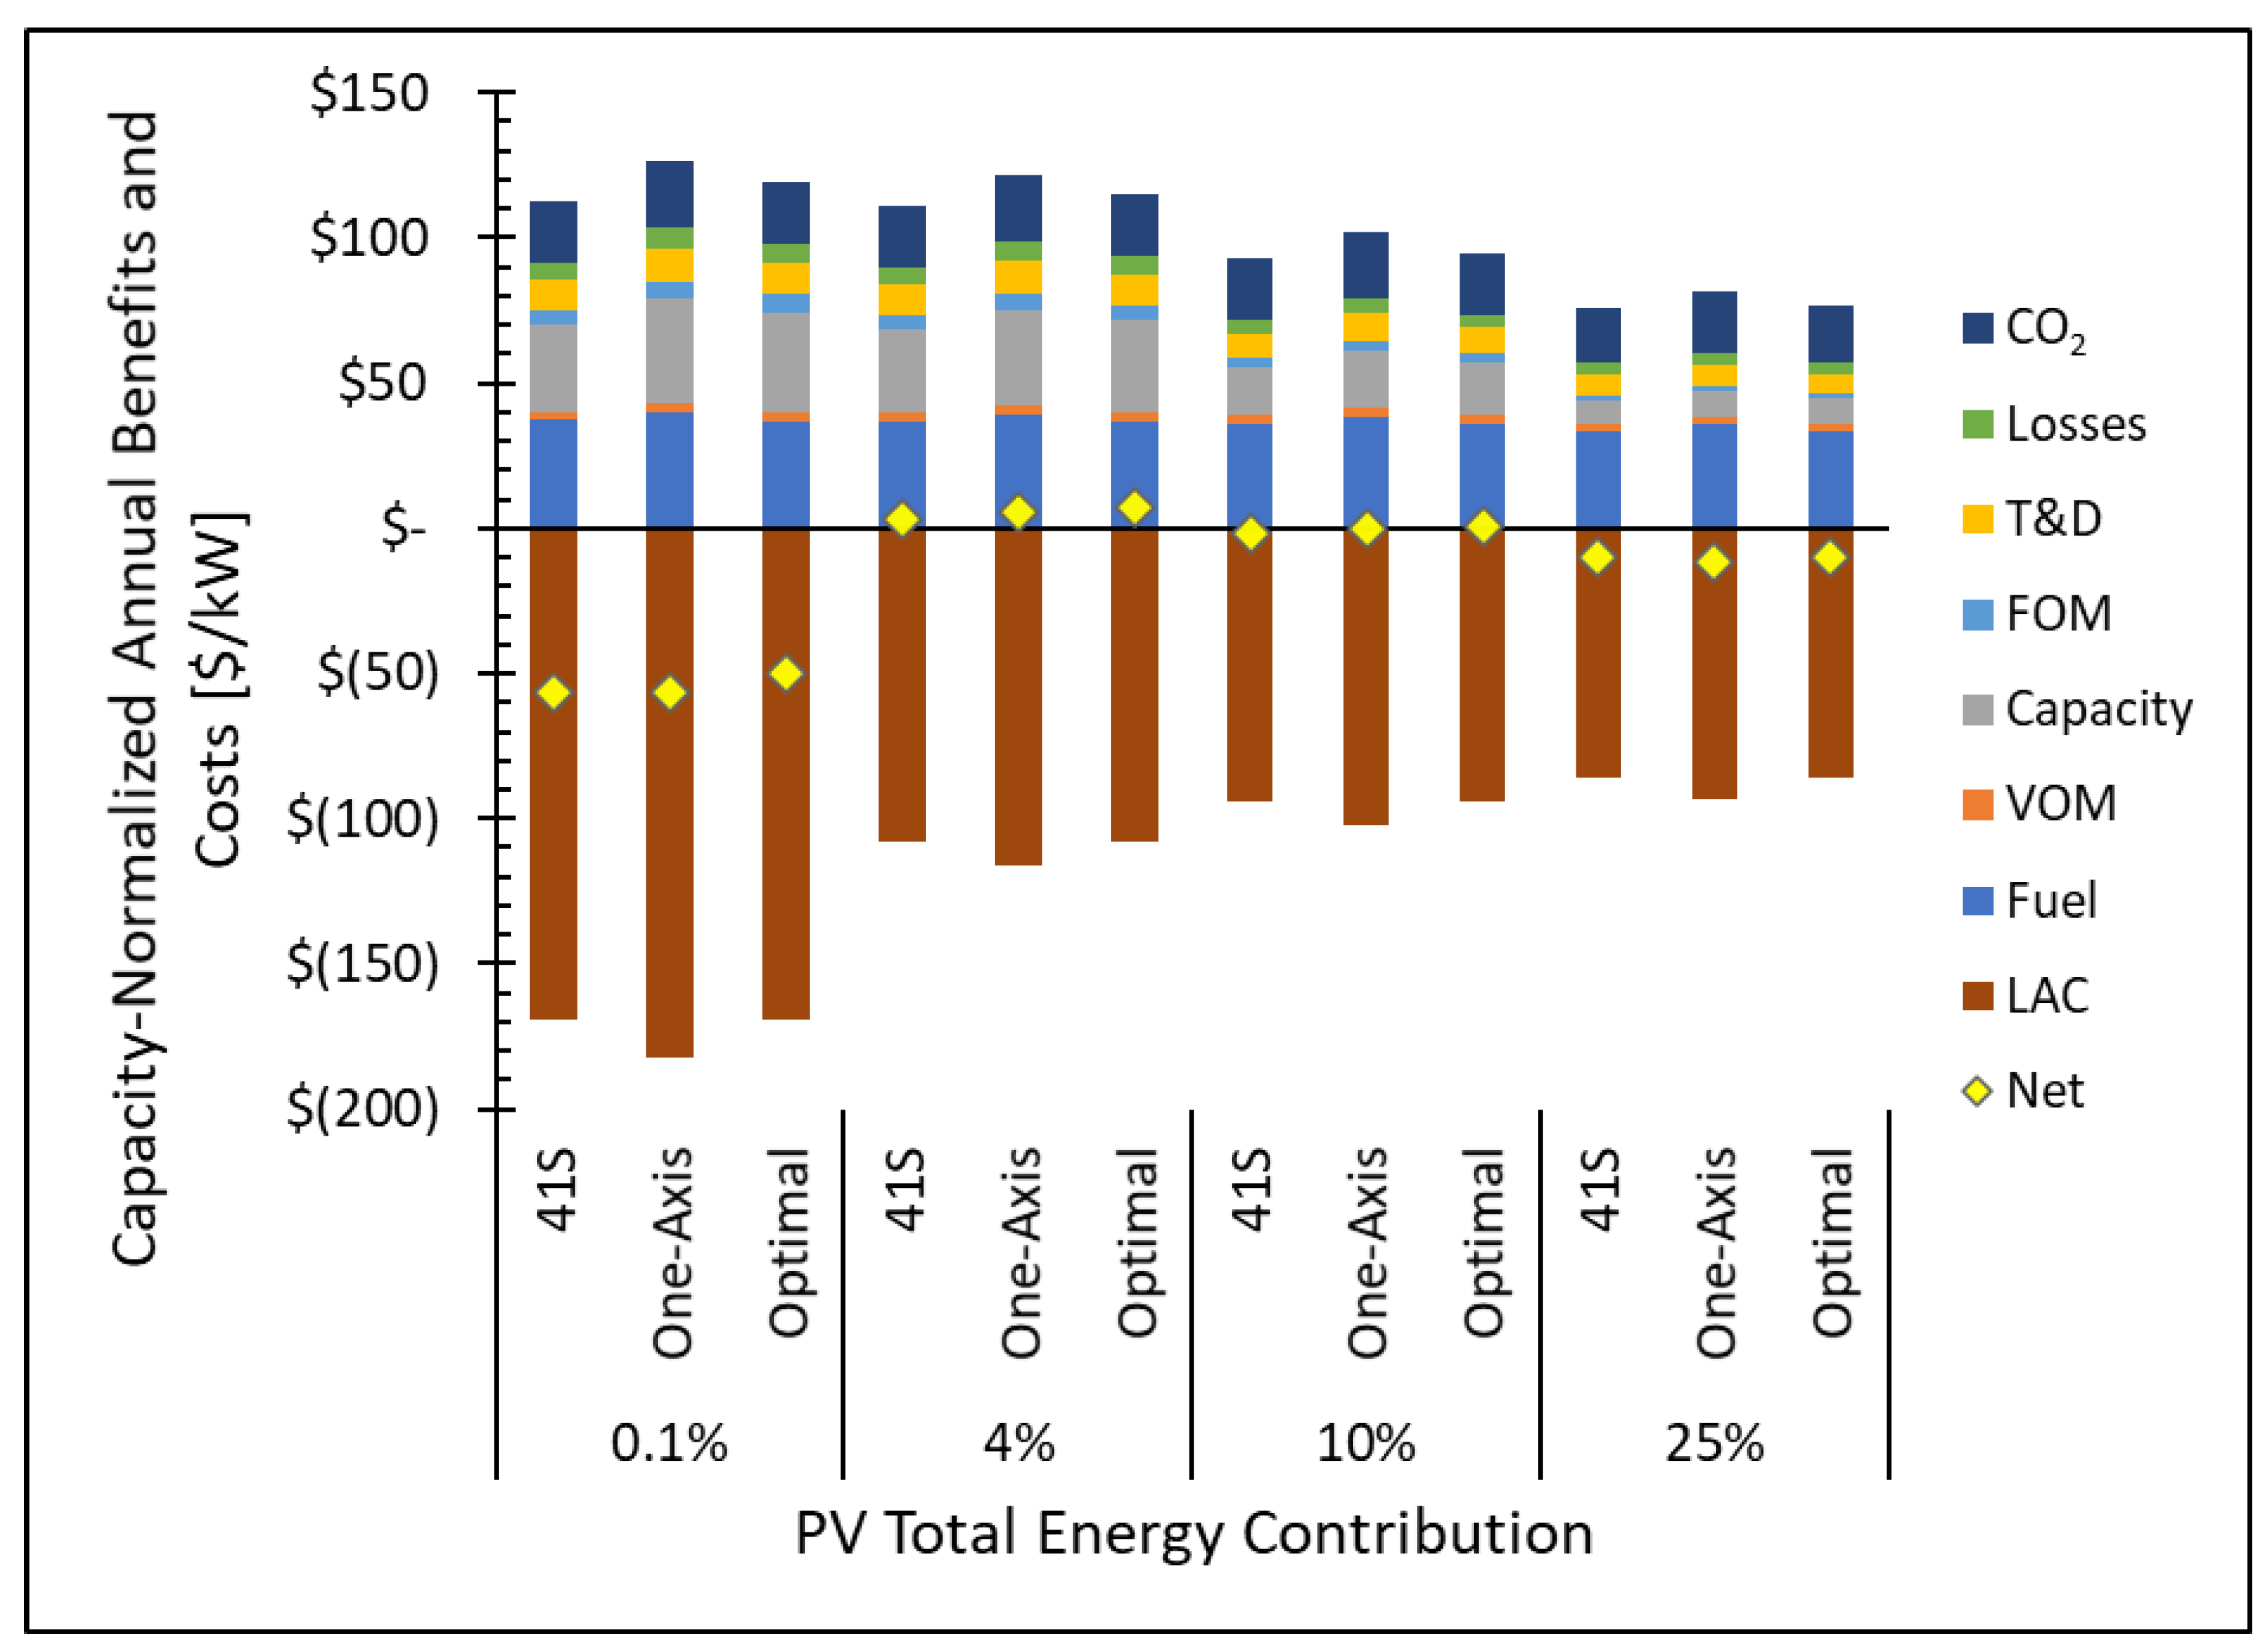
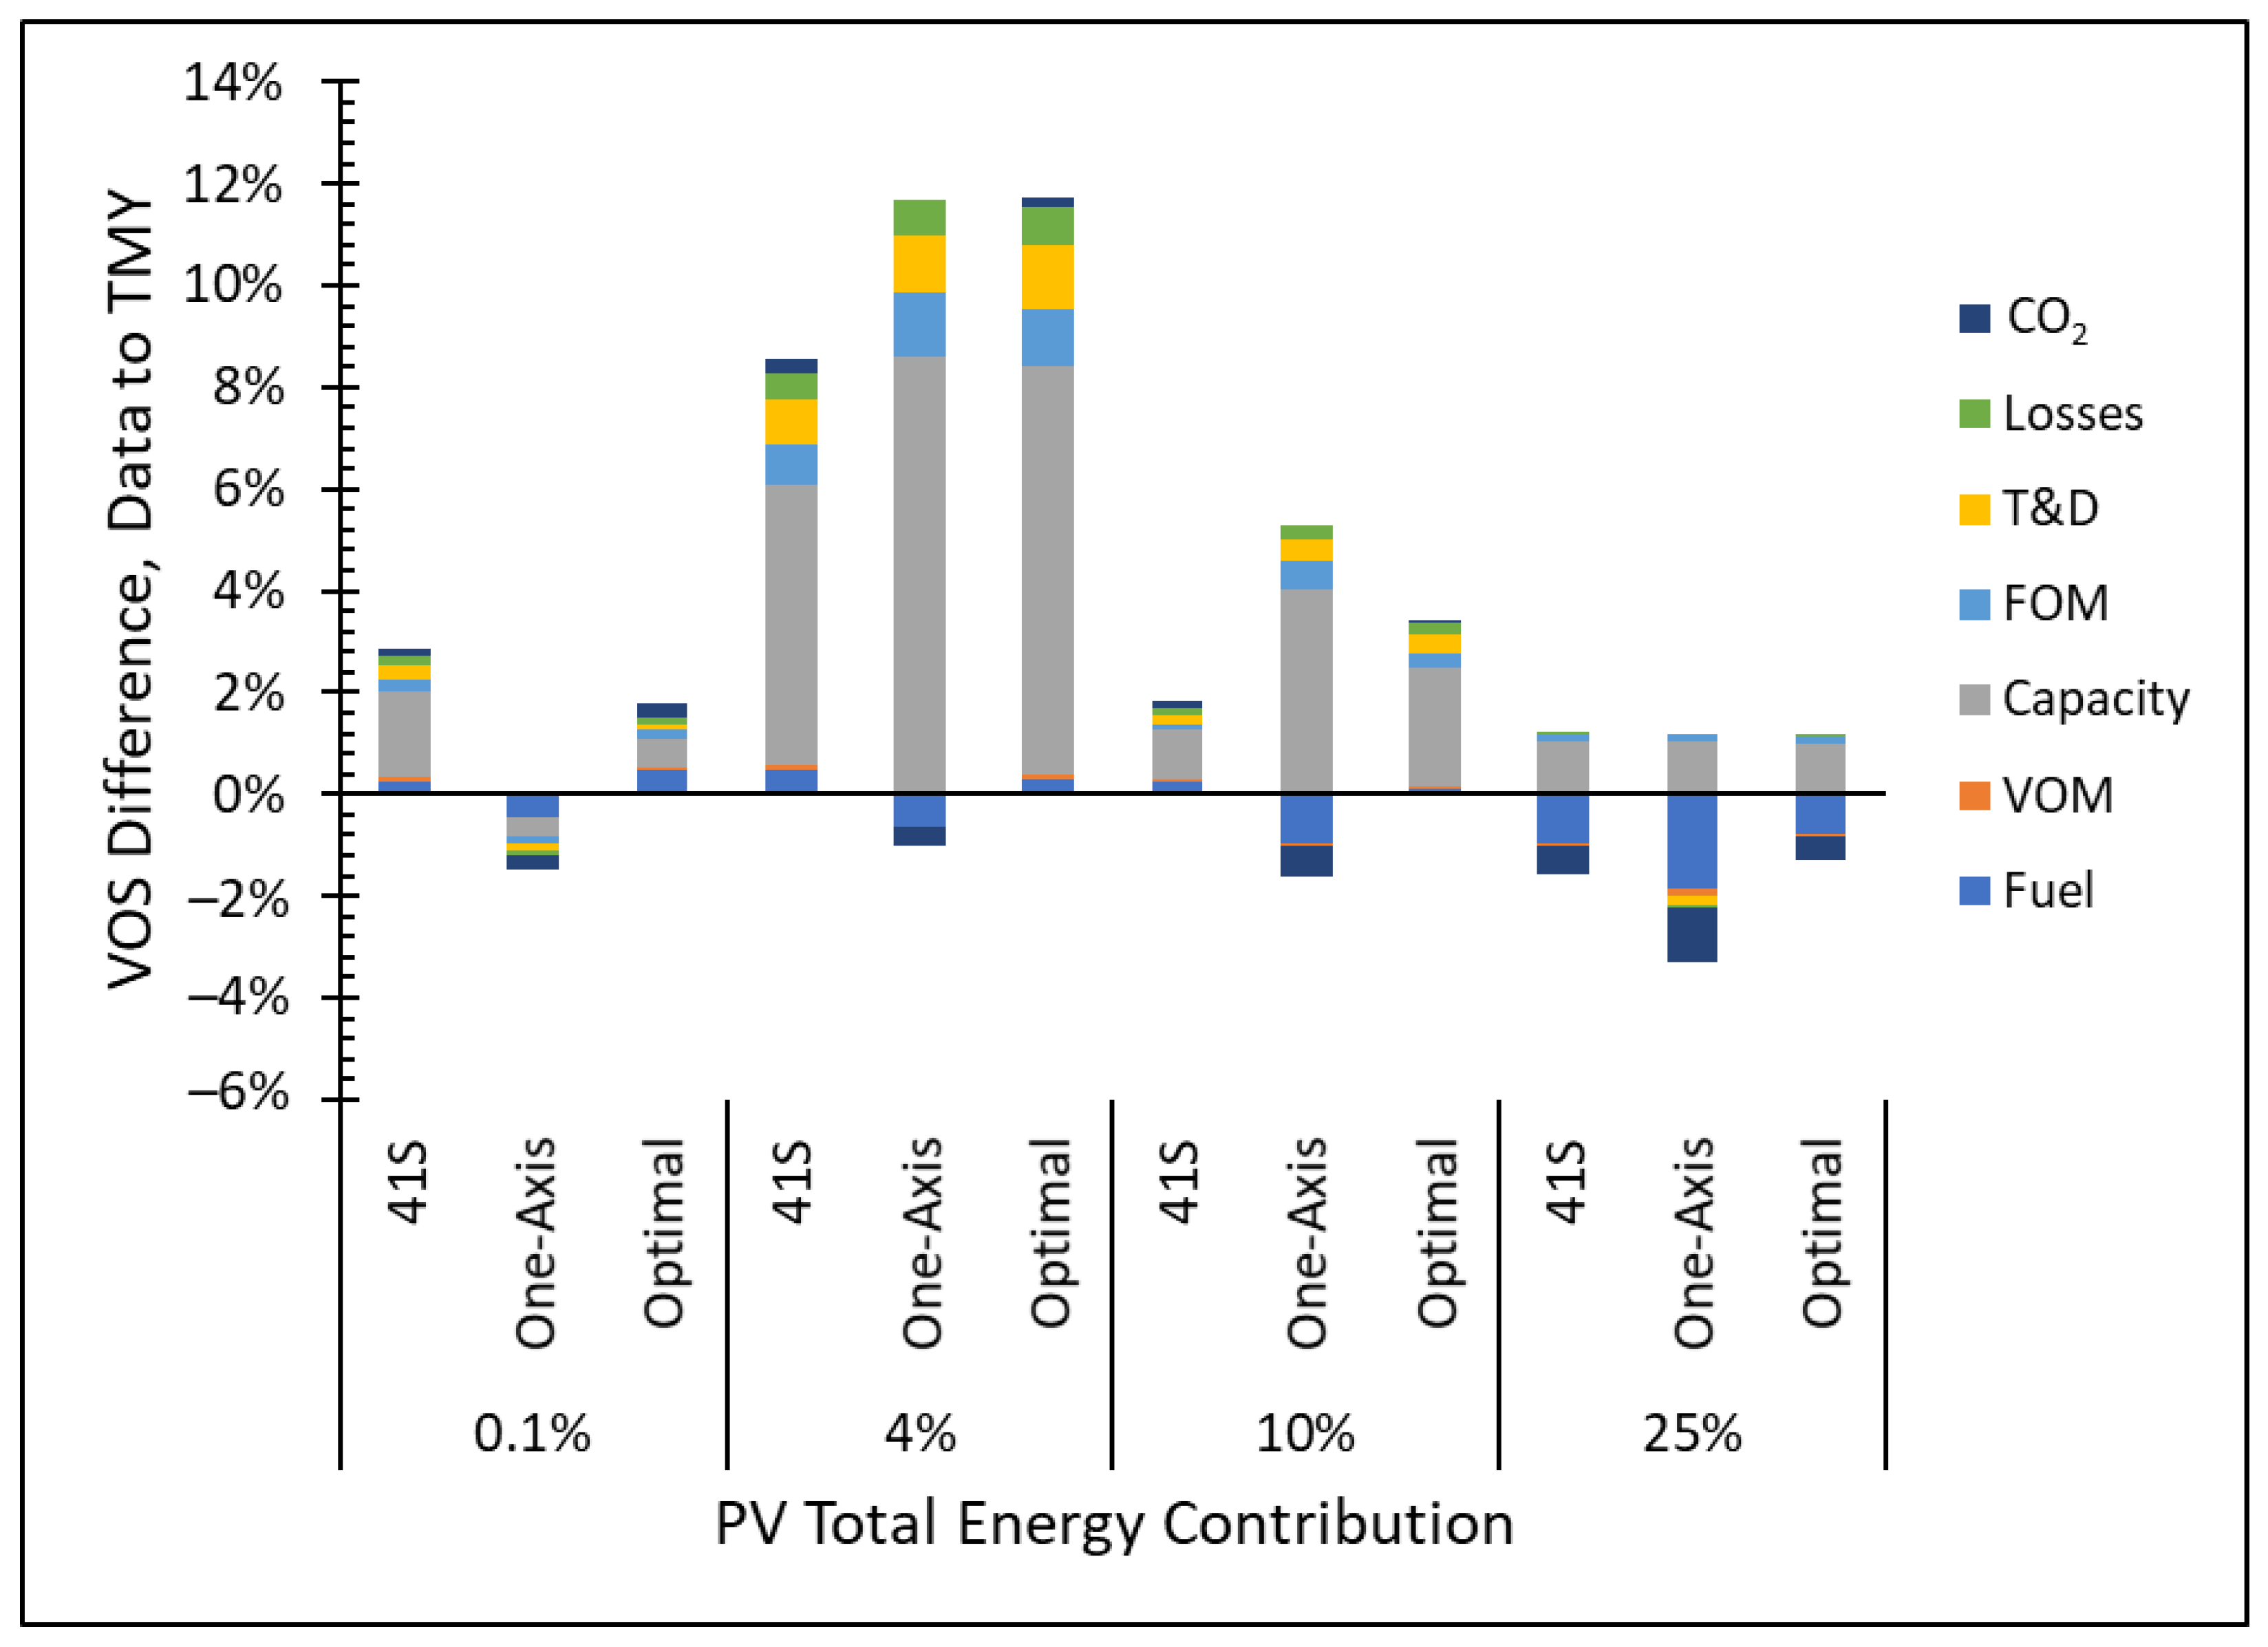
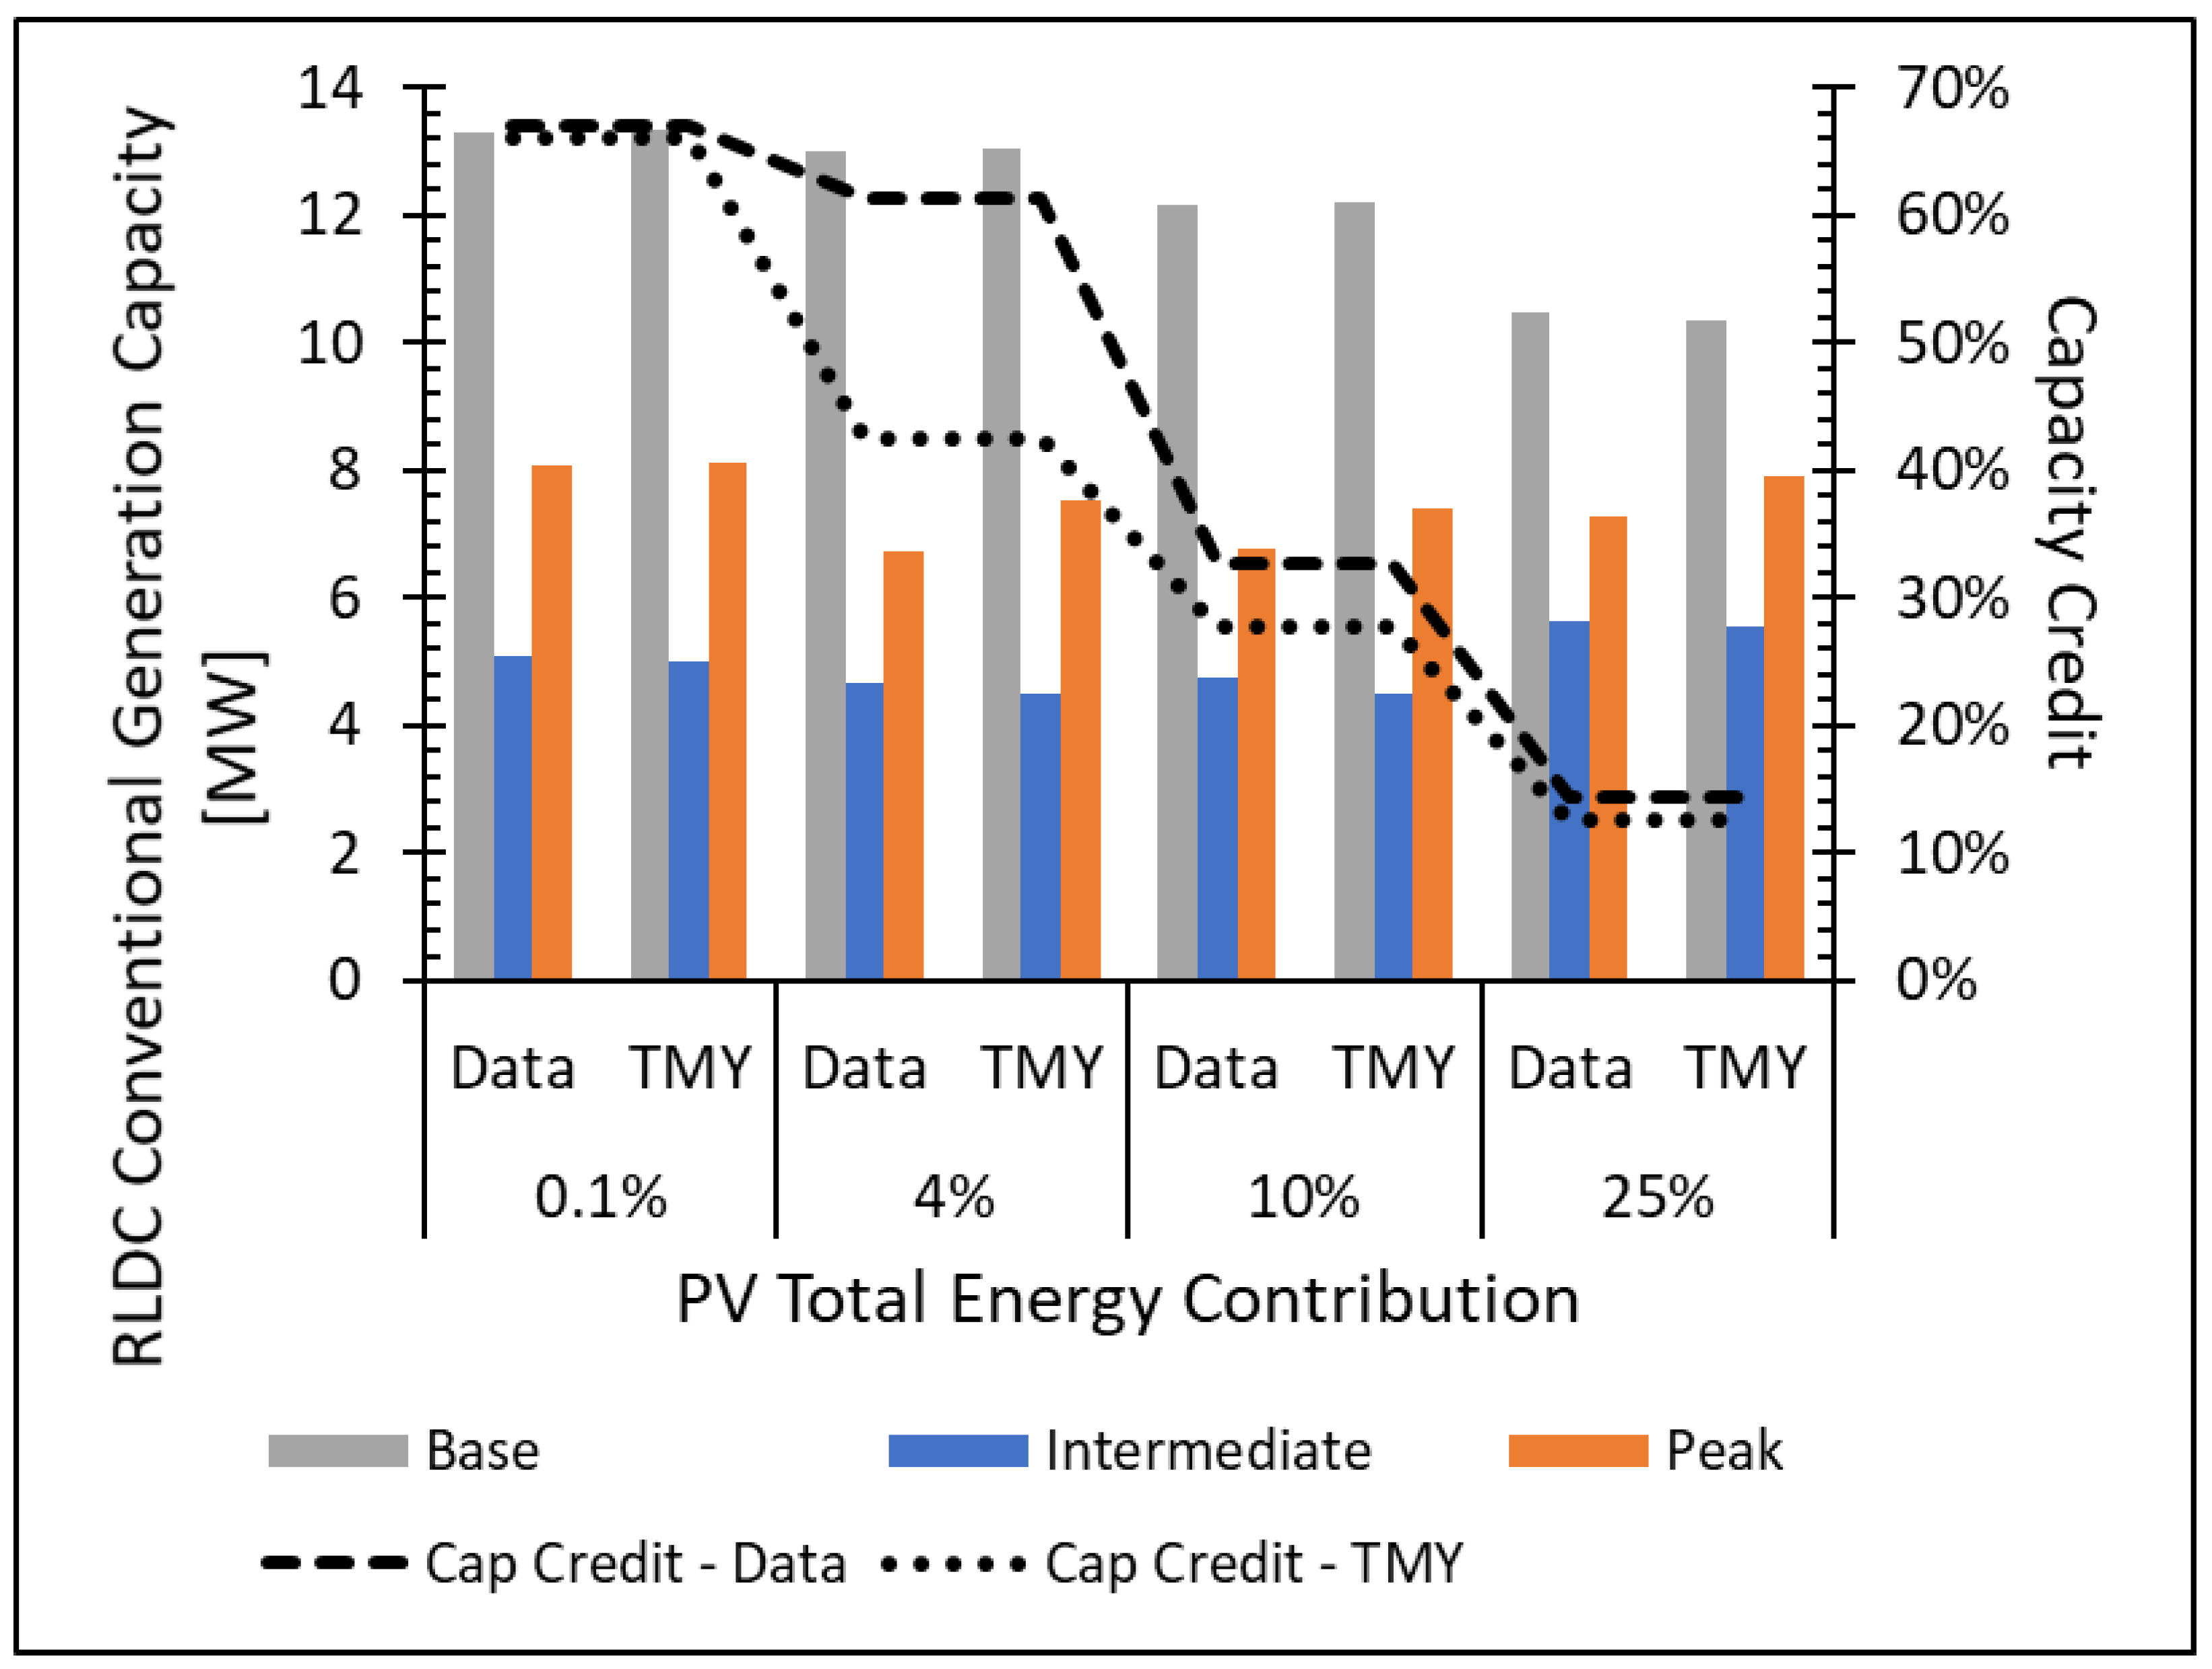

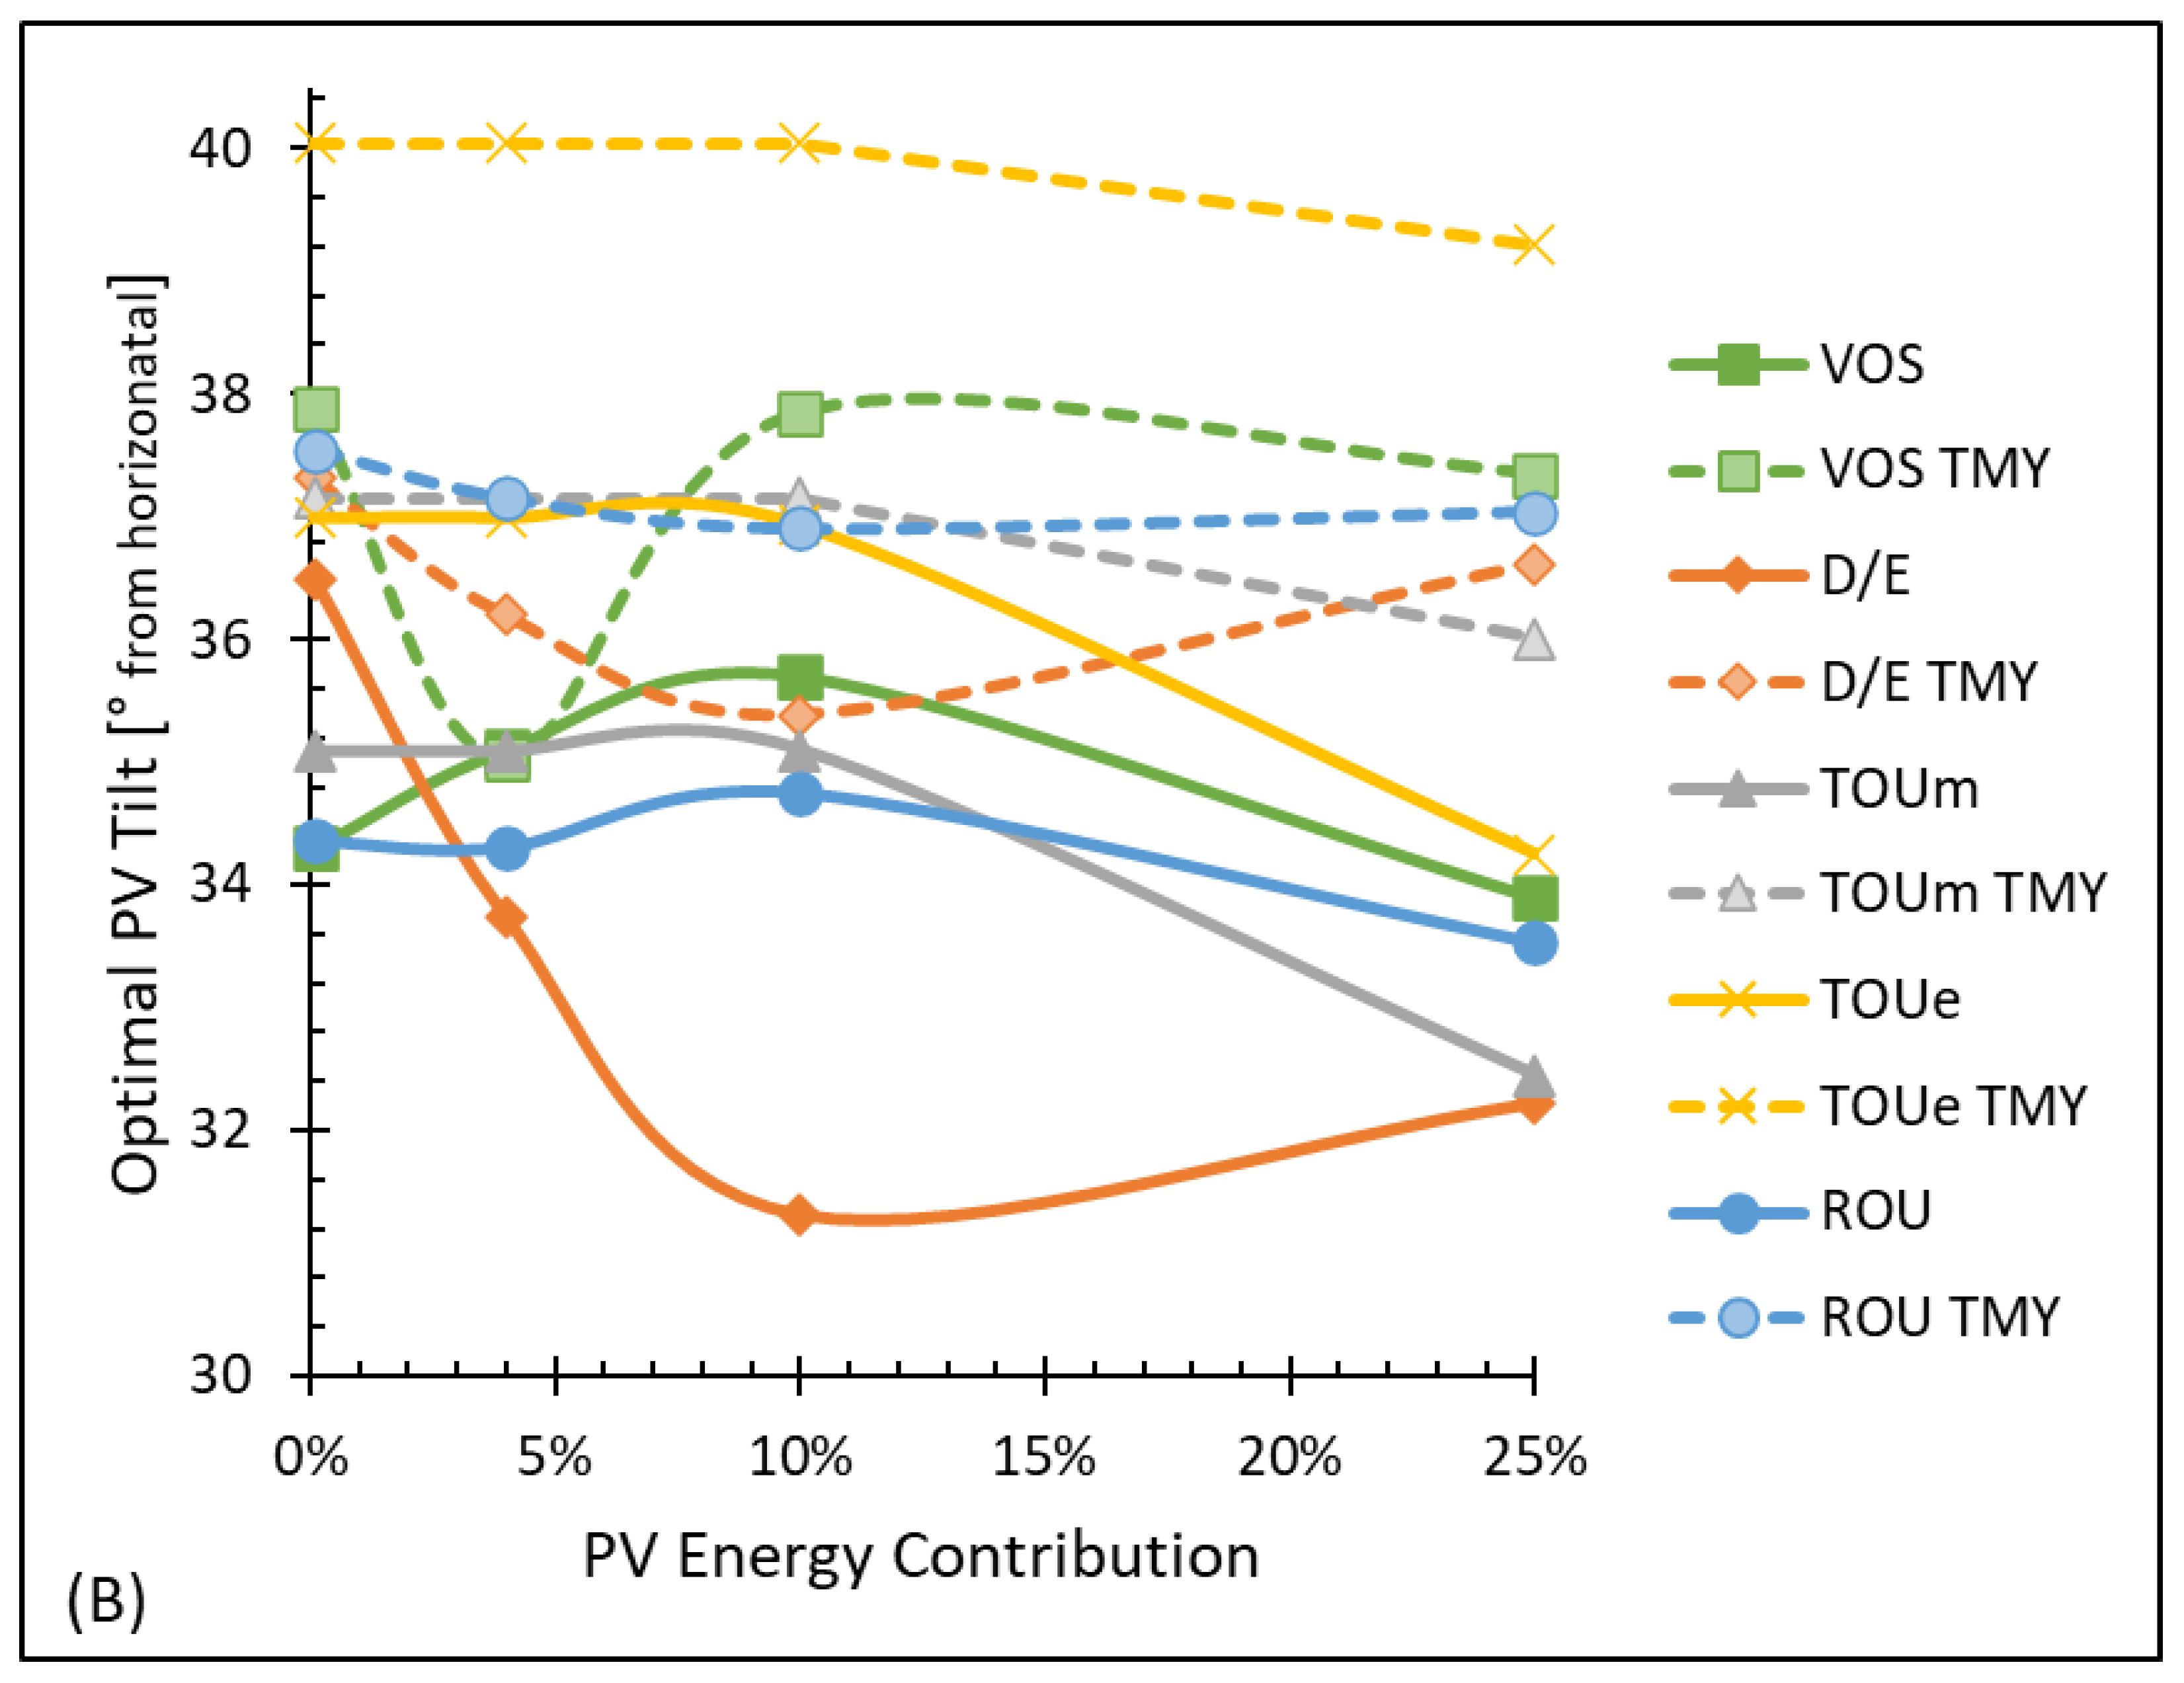
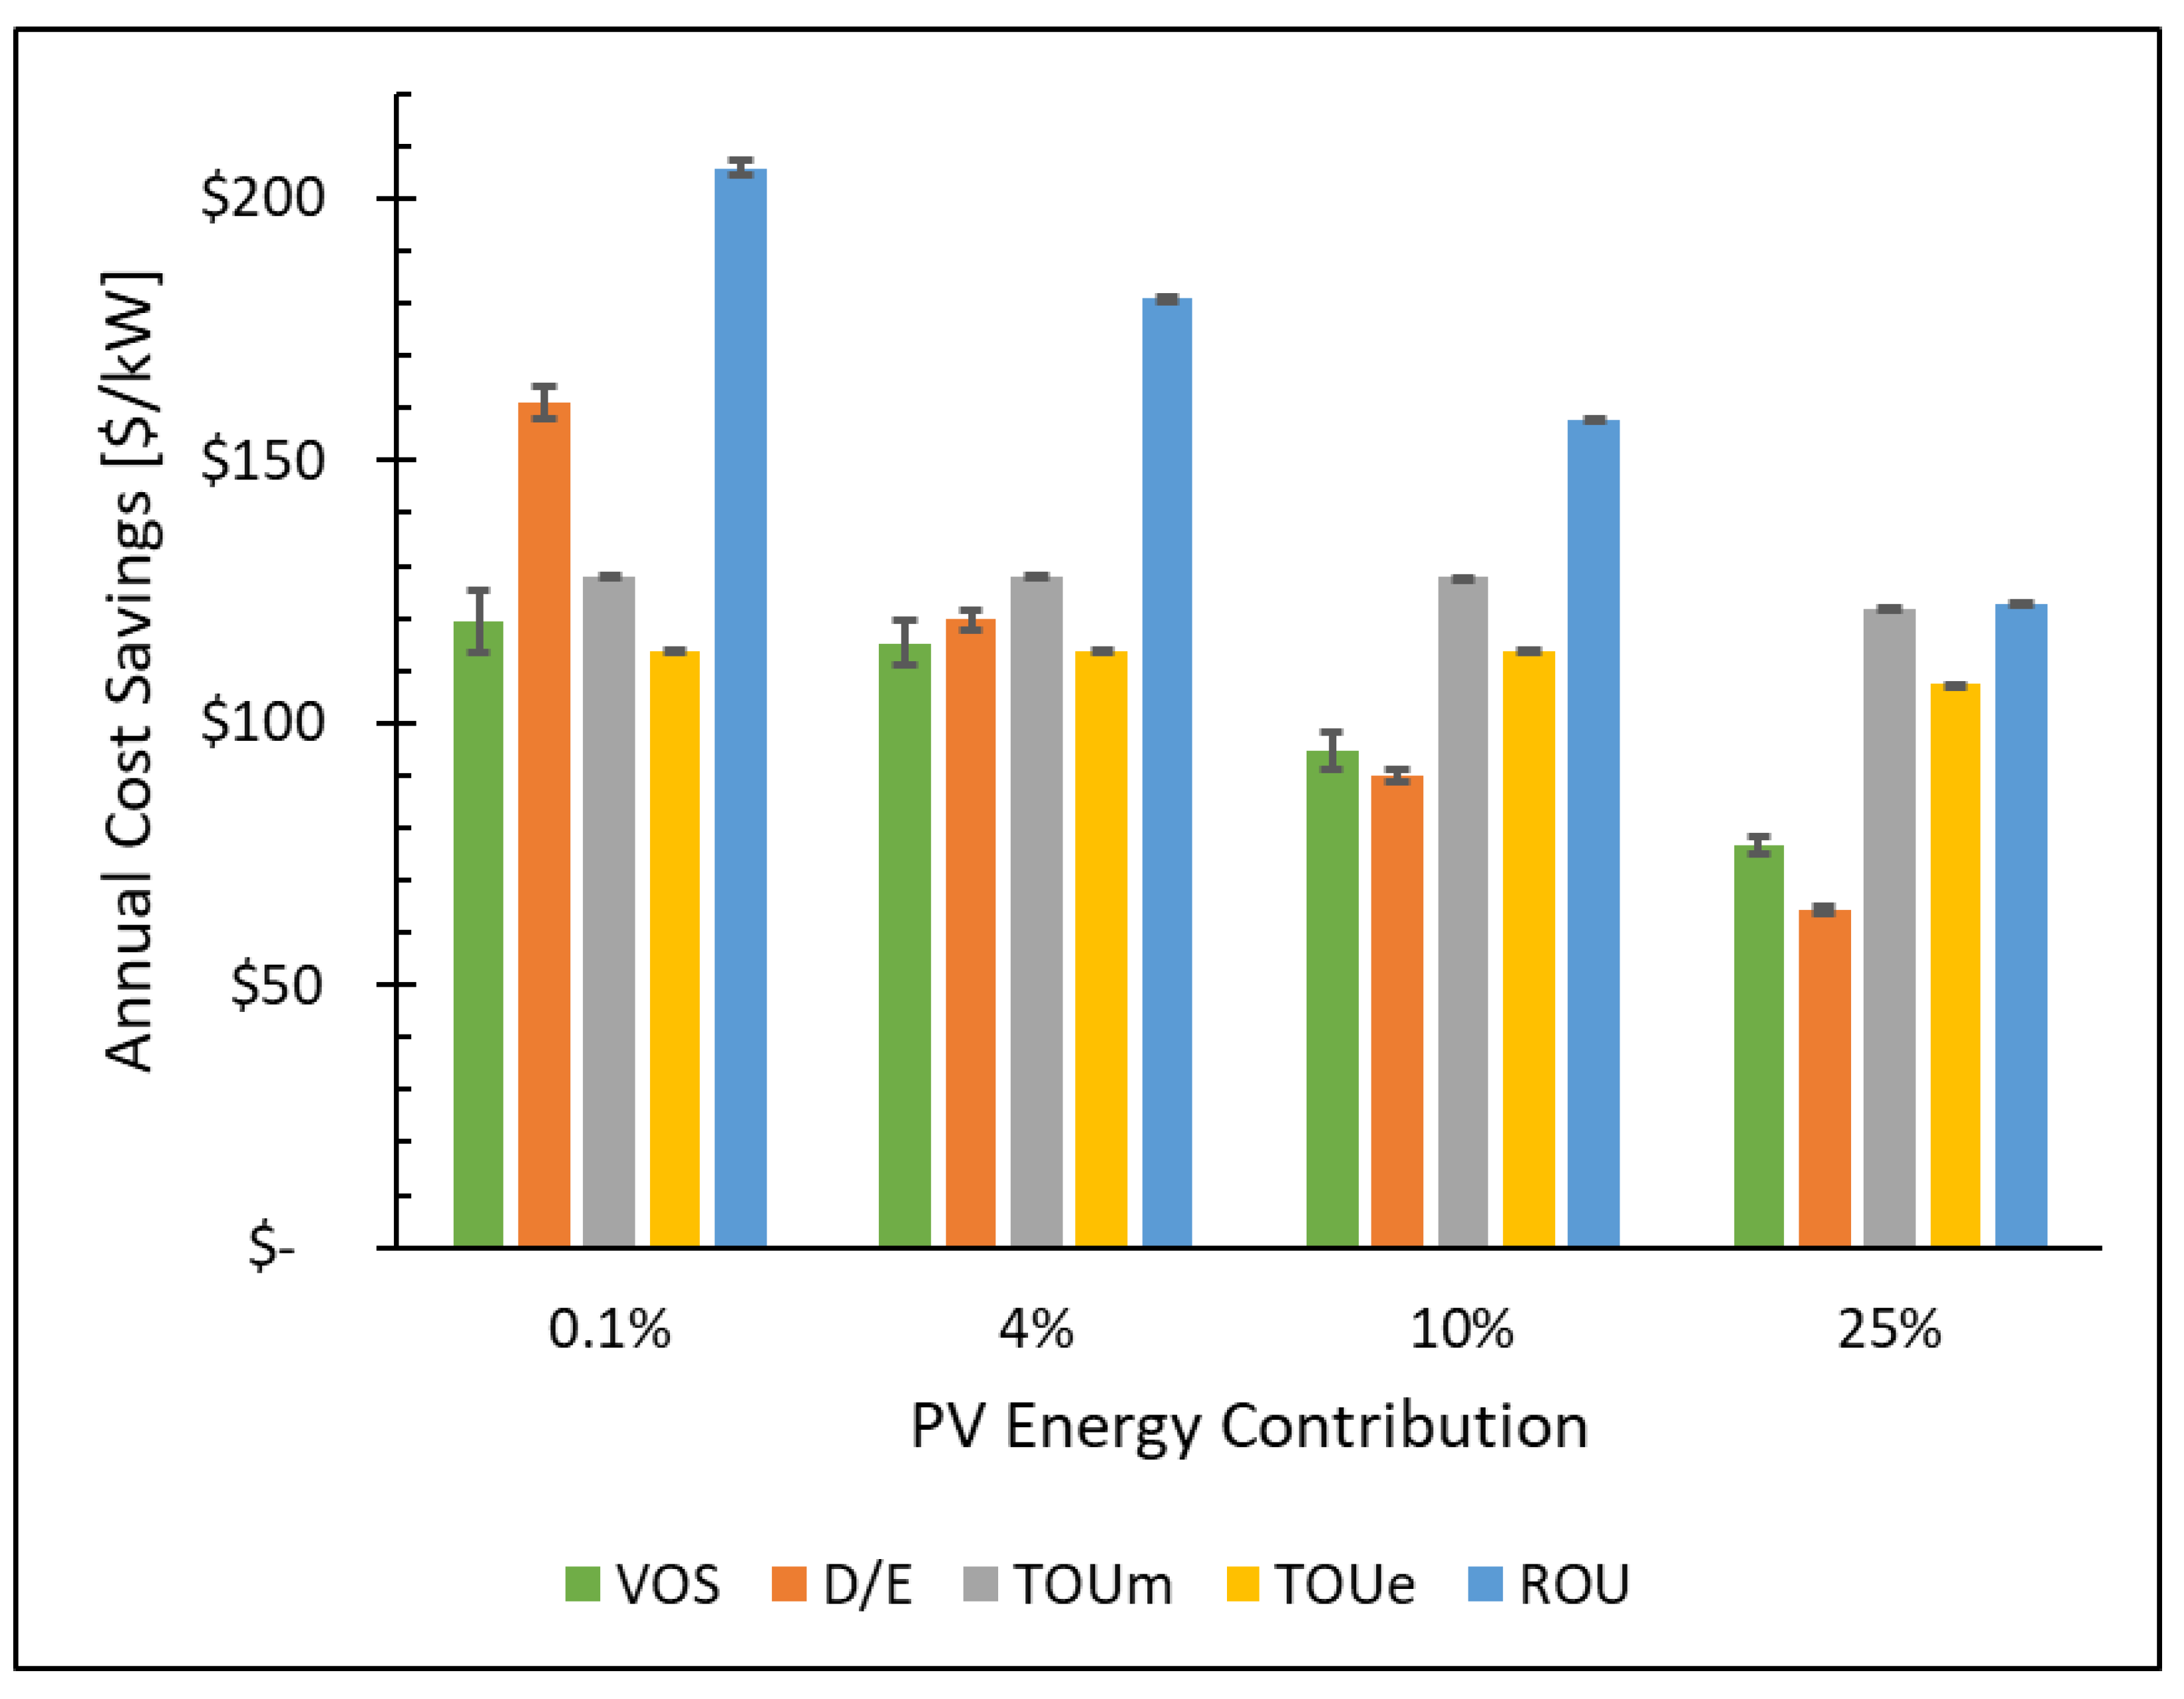
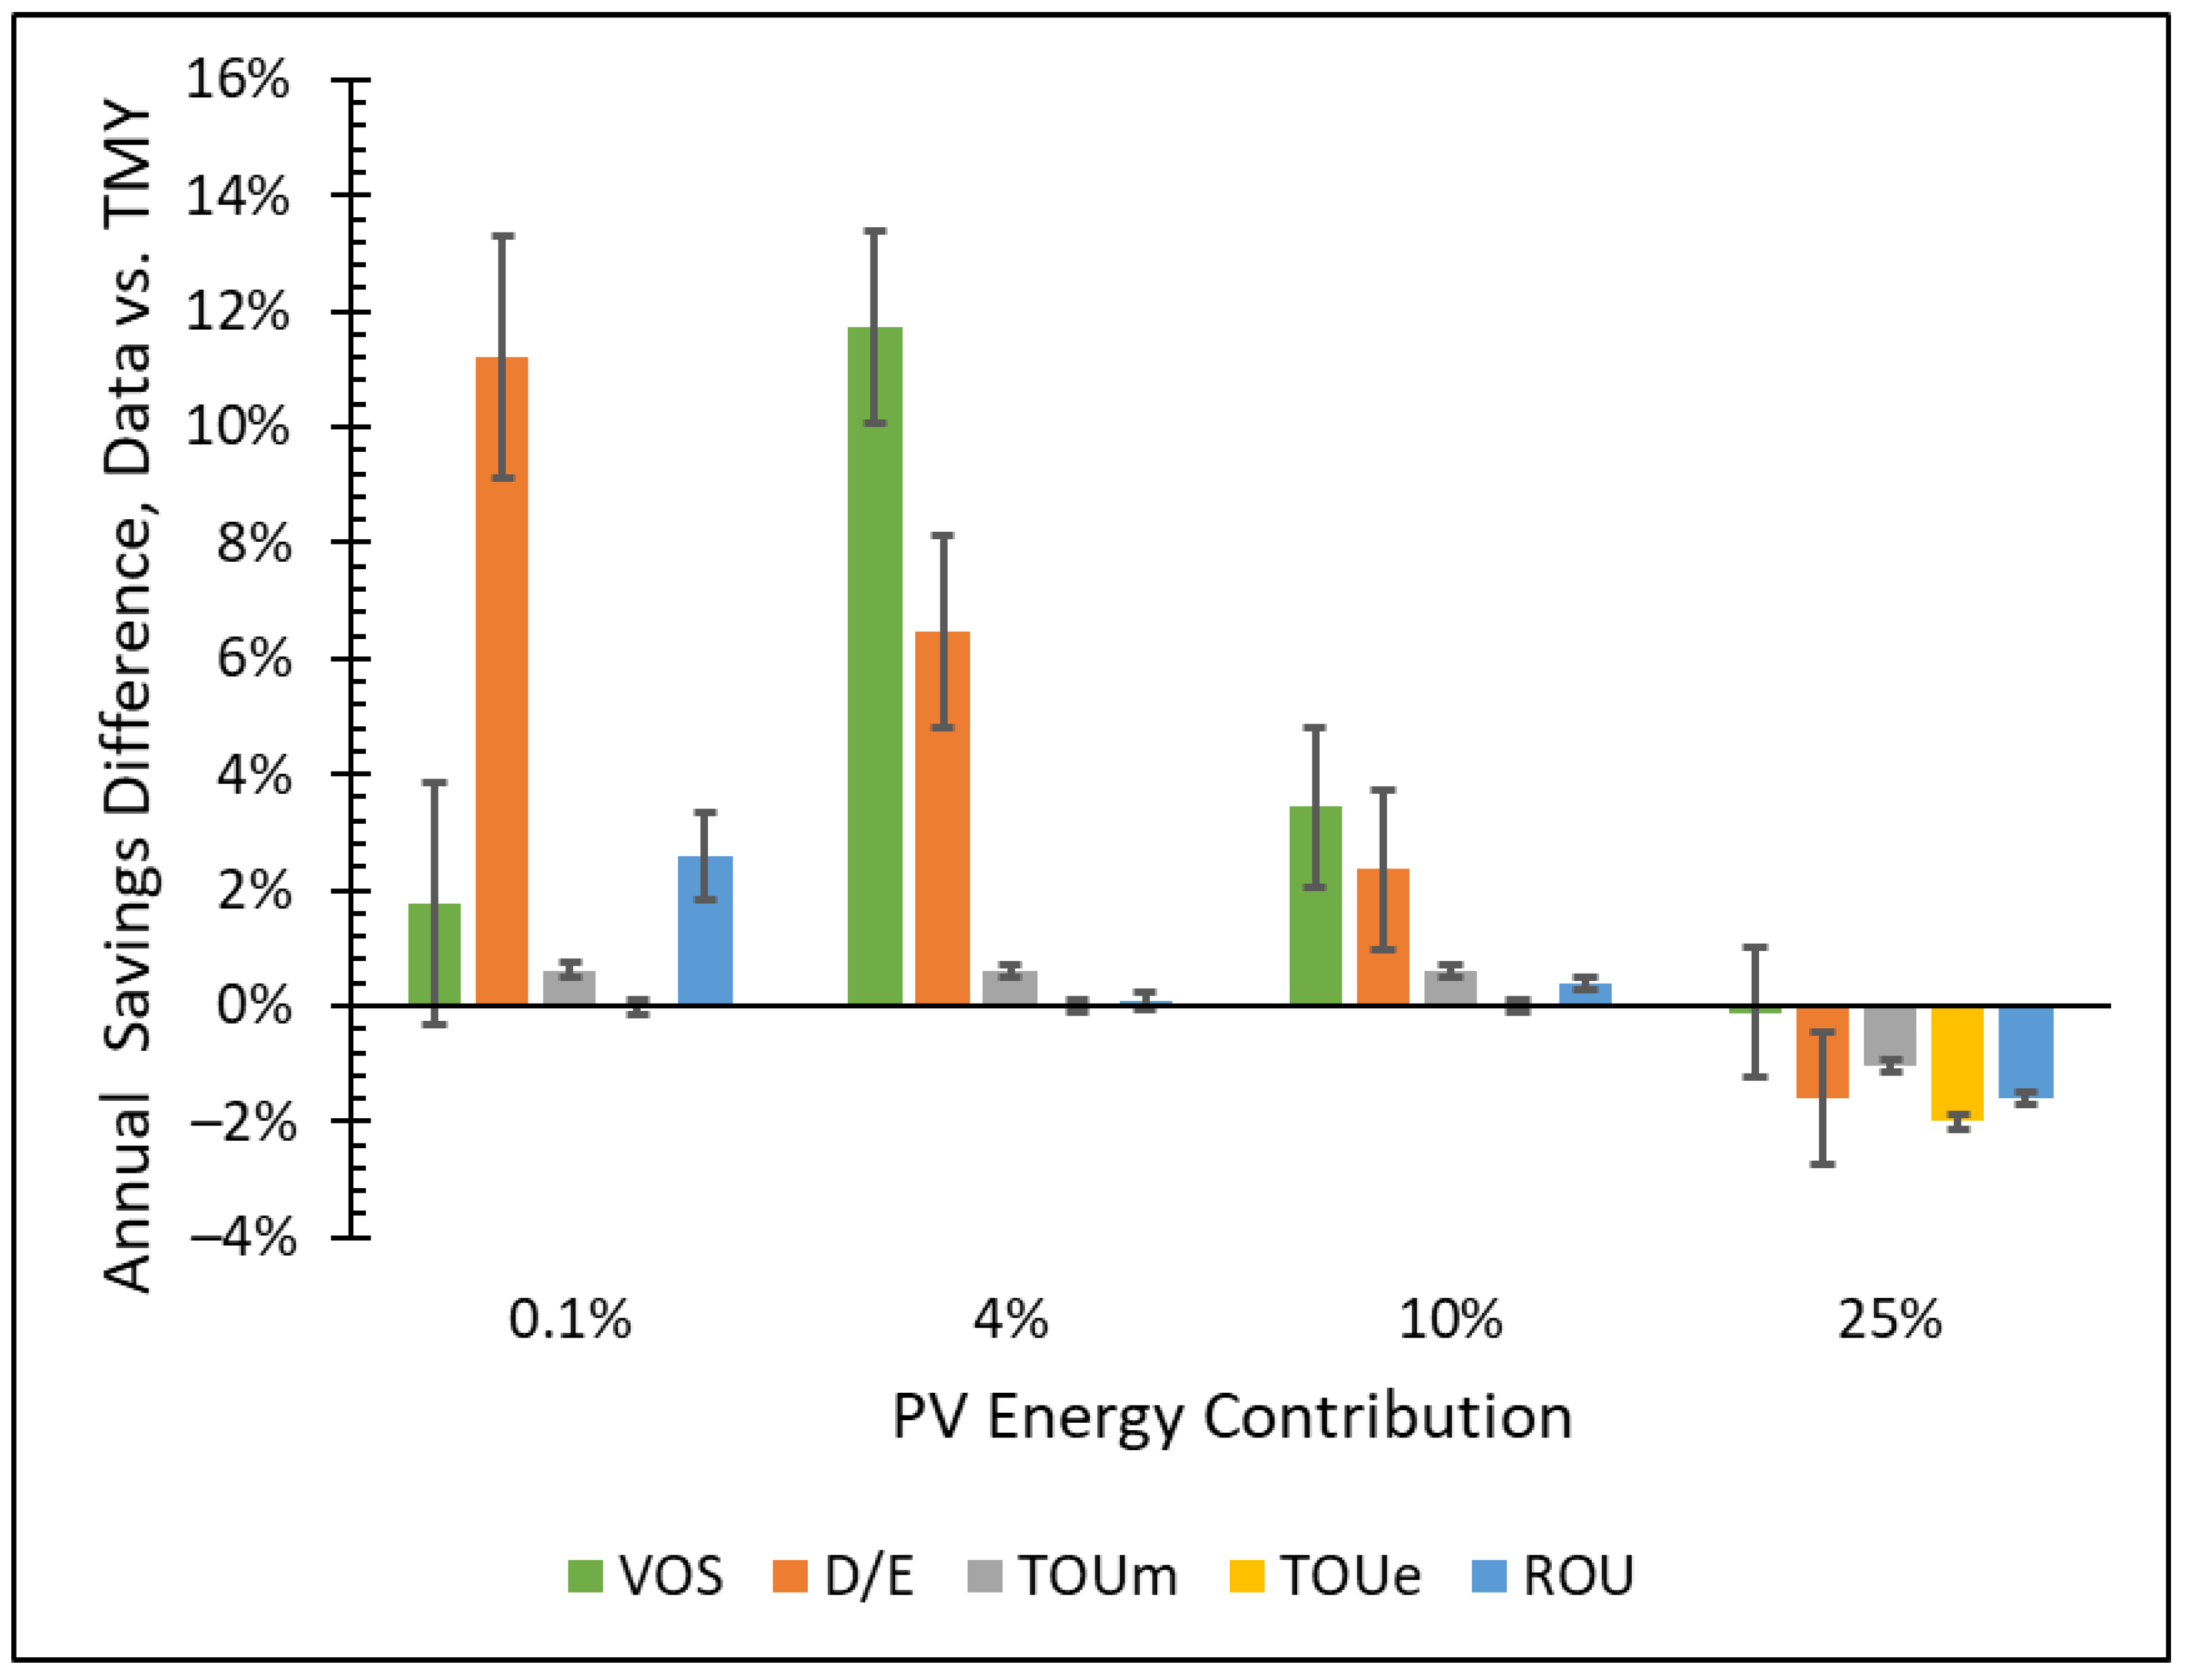
| Category | Net Benefit | Calculation Method |
|---|---|---|
| Energy | Avoided fuel and variable costs | LDC-RLDC (1) Fuel Costs, (2) VOM |
| Generation Capacity | Avoided fixed costs of new generation | LDC-RLDC (3) Capacity Credit, (4) FOM |
| T&D Capacity | Avoided cost of building and maintaining T&D infrastructure | (5) T&D Levelized cost on Capacity plus T&D Variable cost on Energy |
| T&D Losses | Avoided losses from remote generators | (6) Transmission Loss Multiplier on PV generation |
| Environmental | Reduced air emissions | (7) CO2 social cost 39 $/ton |
| Months | Demand Plus Transmission [$/kW] | Energy [$/kWh] |
|---|---|---|
| DEC, JAN, FEB | 22.00 | 0.0315 |
| MAR, APR, MAY | 16.50 | |
| JUN, JUL, AUG | 27.00 | |
| SEP, OCT, NOV | 16.50 |
| Parameter | Value | |
|---|---|---|
| Assumptions/ Inputs | Inflation (i) | 2.5% |
| Debt Interest Rate (IR) | 5% | |
| Rate of Return on Equity (RROE) | 10% | |
| Debt Fraction (DF) | 60% | |
| Tax Rate, federal + state (TR) | 27% | |
| Loan Term, years | 10 | |
| Period of Analysis, years (t) | 25 | |
| Depreciation | MACRS-5 | |
| Annual PV degradation | 0.60% | |
| Calculated | WACC, Nominal | 6.2% |
| WACC, Real | 3.6% | |
| Fixed Charge Rate (FCR) | 6.5% | |
| Rate Structure | Equivalent Revenue Rate [$/kWh] | ||
|---|---|---|---|
| Base | Intermediate | Peak | |
| TOU midday (TOUm) | 0.063 | 0.089 | 0.133 |
| TOU evening (TOUe) | 0.066 | 0.066 | 0.139 |
| ROU | 0.067 | 0.094 | 0.141 |
| PV Energy Contribution | Simple Payback [yr] | RROE | WACC Nominal | WACC Real |
|---|---|---|---|---|
| 0.1% | 16 | 8% | 5.3% | 2.7% |
| 4% | 13 | 13% | 7.5% | 4.9% |
| 10% | 16 | 7% | 4.9% | 2.5% |
| 25% | 22 | −2% | 1.3% | −1.0% |
Publisher’s Note: MDPI stays neutral with regard to jurisdictional claims in published maps and institutional affiliations. |
© 2022 by the authors. Licensee MDPI, Basel, Switzerland. This article is an open access article distributed under the terms and conditions of the Creative Commons Attribution (CC BY) license (https://creativecommons.org/licenses/by/4.0/).
Share and Cite
Saarloos, B.A.; Quinn, J.C. Achieving Optimal Value of Solar: A Municipal Utility Rate Analysis. Solar 2022, 2, 99-119. https://doi.org/10.3390/solar2020007
Saarloos BA, Quinn JC. Achieving Optimal Value of Solar: A Municipal Utility Rate Analysis. Solar. 2022; 2(2):99-119. https://doi.org/10.3390/solar2020007
Chicago/Turabian StyleSaarloos, Benjamin A., and Jason C. Quinn. 2022. "Achieving Optimal Value of Solar: A Municipal Utility Rate Analysis" Solar 2, no. 2: 99-119. https://doi.org/10.3390/solar2020007
APA StyleSaarloos, B. A., & Quinn, J. C. (2022). Achieving Optimal Value of Solar: A Municipal Utility Rate Analysis. Solar, 2(2), 99-119. https://doi.org/10.3390/solar2020007


