1. Introduction
The primary objective of this research is the design and development of a complete, functional and usable software tool for calculating object-oriented quality metrics for projects written in Java. The overarching goal of the proposed SQMetrics tool is to provide support within the realm of educational endeavors in software engineering (SE) academic courses. It serves as a dual-purpose instrument, enabling students to quantify and juxtapose metrics within their projects, thereby incrementally enhancing their code quality. Furthermore, it empowers instructors to assess the Java projects of their students, assigning grades that commensurate with the quality of work produced.
The contribution of the proposed tool is three-fold, as it has been: (a) tested for its completeness and functionality by comparing it with widely known similar tools; (b) evaluated for its usability by the students who used it, using the SUS questionnaire; and (c) tested experimentally for its assistance in the evaluation of student’s projects through statistical analysis.
The motivation to develop SQMetrics arises from the desire and need to enhance the quality of education in software engineering (SE) academic courses. By offering a platform for students to assess and compare various metrics, the tool encourages iterative improvement in code quality over time. Also, students can compare their project metrics with established benchmarks or exemplary projects, fostering a deeper understanding of relative strengths and areas for improvement. The development of SQMetrics is driven by the aspiration to align academic projects with industry practices. By introducing students to industry-standard quality metrics and measurement tools, educators prepare them for real-world software development scenarios. Finally, instructors seek tools like SQMetrics to enable more comprehensive and objective assessments of student projects. By automating the measurement of diverse quality metrics, instructors can move beyond solely evaluating functional aspects and gain insights into the overall software quality.
Various quality metrics were invented over time, each one resulting in a number that indicatively quantifies the quality of an attribute of a software entity (e.g., a class). There is a plethora of such metrics, while new ones are constantly being added, depending on software requirements and user needs. Several metrics are used to evaluate specifically object-oriented software quality, including cohesion, coupling, complexity, inheritance, and polymorphism [
1]. Apart from software quality metrics, current software development companies use agile processes and would also be interested in practical metrics related to processes and team effectiveness [
2].
In 1991, the International Organization for Standardization (ISO) issued the 9126 standard [
3] that refers to the quality of software products, which was revised in 2001 and consists of four parts. The first part refers to the quality model proposed and classifies the quality of software into a structured set of six characteristics: Functionality, Usability, Reliability, Efficiency, Maintainability, and Portability. Those characteristics are further configured in several sub-characteristics [
3]. In 2011, the ISO 9126 standard was replaced by the 25010 standard [
4] and the characteristics were increased from six to eight. These characteristics, concerning the quality of a software product, are: Functional Suitability, Performance Efficiency, Compatibility, Usability, Reliability, Security, Maintainability, and Portability. It should be noted here that although the term “measure” is used instead of the term “metric” in the ISO 25000 family of standards [
4], we will consistently use the term “metric” throughout the article. These two standards do not state which metrics should be used to accurately measure the characteristics or sub-characteristics they define. Moreover, the degree of importance of each sub-characteristic in relation to its corresponding characteristic is not explicitly stated. In order to assign values to these “external” characteristics, the internal characteristics of the software need to be computed and then matched to external characteristics. Internal are the characteristics of the code and its structure, such as lines of code, comments, number of branches, methods-functions, etc. [
5]. Internal metrics are used to evaluate the quality of the code itself, rather than its behavior or performance.
Several contemporary software tools are available for measuring object-oriented software quality metrics. These tools provide developers with a range of metrics that can be used to evaluate software quality. Examples of such tools include Understand, Eclipse Metrics Plugin, SonarQube, etc. [
6]. These tools can help developers identify potential problems in their software and improve its overall quality, but were not developed for educational purposes.
One gap in contemporary software object-oriented metrics tools used for assisting software engineering courses is the lack of emphasis on teaching students how to interpret and apply the metrics effectively. While these tools can provide valuable insights into the quality of software design and implementation, students may not always understand how to use this information to improve their software development practices, as they cannot interpret and apply the metrics correctly [
7].
Although professional static code analyzers and refactoring tools are being used in education, there are also some academic tools designed specifically for education that provide feedback on Java code quality, e.g., ELP [
8], Java Critiquer [
9], FrenchPress [
10], and AutoStyle [
11].
ELP is an online interactive and constructive environment for learning how to program that checks for unused variables and parameters, redundant logical expressions, numeric literals that should be named constants, and other stylistic blunders. The framework uses both software engineering metrics and relative comparison to a teacher’s model to judge the quality of students’ programs. Except for cyclomatic complexity (CC), there are no other metrics in common with SQMetrics. The Java Critiquer addresses localized stylistic issues, including Boolean expressions, increment operators, unnecessary parentheses, and floating-point data types. FrenchPress diagnoses flaws are characteristic of programmers who have not yet assimilated the object-oriented idiom. Such shortcomings include the misuse of the public modifier, fields that should have been local variables, and instance variables that should have been class constants. AutoStyle provides stepwise feedback on how to improve the style of correct programs, based on historical student data.
Scientific studies on educational tools in software engineering reveal crucial insights into fostering effective learning environments. A systematic mapping study emphasizes software engineering competencies (SEC) literature, presenting a comprehensive review of available SEC frameworks and models [
12]. This sheds light on the significance of cultivating specific skillsets in software engineering education, aligning with the industry’s demands and enhancing the relevance of educational programs. The evaluation and enhancement of software quality in educational settings pose multifaceted challenges. Several studies delve into the complexities of software engineering education, unveiling challenges in teaching, assessment methods, and alignment with industry needs [
13,
14,
15], while most of them emphasize the need for a balance between theoretical concepts and practical skills [
16,
17].
A growing body of research has shifted its focus toward evaluating the quality of programs authored by beginners (mostly SE students), instead of their correctness [
18,
19]. Such studies highlight diverse quality issues in student programs that often persist [
20,
21]. Though reasons for these issues are unclear, students may prioritize passing tests over key quality aspects, e.g., maintainability or reusability. Tools for code analysis often overlook novices, so students are not motivated to improve their code quality. However, with the correct guidance by the instructors, the impact of software quality measurement tools can be transformative. The deployment of such tools empowers students to identify and rectify flaws in their code, thereby honing their skills in writing clean, maintainable code. This improvement extends beyond individual projects, contributing to an elevated standard of code quality across various assignments and tasks [
8,
22]. SQMetrics is mainly targeted to beginners in Java programming and, thus, it is suitable for use in SE courses.
A special kind of software tools facilitating the educational process is the Automated Assessment Tools (AATs), which have gained prominence in automating the assessment process for computer programs created by students [
23]. These systems empower students to independently verify whether their code solutions meet assignment requirements, without requiring teacher assistance. Typically, this is achieved through automated compilation and the execution of students’ code within a controlled environment, followed by a verification of correctness using techniques like output comparison, unit testing, or other established techniques [
24]. Depending on the tool, students might or might not receive detailed feedback on what is wrong with their work. By providing quick feedback and pinpointing the mistakes, these tools can make computer science students more interested in their programming classes and boost their motivation [
25]. Lastly, most of these tools can even automatically grade student work.
Several empirical studies have evaluated the effectiveness of software tools in SE education. In [
26], code quality tools and metrics to automatically assess student projects were exploited. The results indicated that, to reduce the effort required to grade projects, two traditional code metrics, namely method lines of code and number of statements, perform best.
The software presented in this study (SQMetrics) implements some of the classic code size metrics and cyclomatic complexity proposed by McCabe [
27], but mainly focuses on object-oriented metrics and, in particular, those proposed by Shyam Chidamber and Chris Kemerer (C&K) [
28] and Jagdish Bansiya and Carl Davis (B&D) [
29]. The latter introduced the Quality Model for Object-Oriented Design (QMOOD). The software quality metrics supported by the SQMetrics tool are thoroughly presented in
Section 3.3. Τhis part of the literature review is devoted to a separate section, as it contains all useful concepts and information for understanding the operation of the proposed tool. Together with the computation logic of each metric, the computation methods adopted by the SQMetrics tool are explained in this section. As some metrics have ambiguous definitions and each tool interprets them at will, SQMetrics has been configured to support all prevailing methods through a set of preferences which the user can configure.
The purpose of the SQMetrics application is not to compete with existing commercial applications, but to provide the convenience of measuring small code, mainly covering academic or research needs. In this context, the application can be easily used both by software engineering students to make measurements and comparisons in their projects, with a view to improving the indicators calculated, and by teachers to evaluate students’ Java projects, which are graded in proportion to their quality. The use of feedback in software engineering education is very important for students to improve their work; and therefore, SQMetrics can be used to provide objective feedback on the quality of software projects [
30]. Moreover, the efficiency of using SQMetrics as an AAT in assessing JAVA code quality was tested and examined in the exploratory study in [
31]. The results showed a positive correlation between instructor rating and the overall quality index extracted from the software, indicating that the software tool can be a reliable and accurate assistant to instructor grading.
Section 2 outlines the methodology followed for the development of the SQMetrics tool. The software quality metrics it supports, together with its functionalities and challenges, are presented in
Section 3.
Section 4 presents the design of the tool, while a comparison of the tool measurements for an indicative Java project, with the corresponding measurements calculated by alternative software quality tools, are presented in
Section 5. The evaluation of the tool in terms of effectiveness, usability, validity of results, functionality, and learnability from students is presented in
Section 6. A discussion of the main findings and suggestions for future work follow in
Section 7, while the conclusions of this study are summarized in
Section 8.
For readability purposes, all acronyms used in this article are listed in the list of abbreviations in
Appendix A.
2. Methodology
The structured methodology that was followed in this study comprises four distinct phases, each meticulously detailed in separate sections of this article: Analysis (
Section 3), Design (
Section 4), Implementation and Testing (
Section 5), and Evaluation (
Section 6). The result of this study is a software tool, which has been developed as a specific solution for overcoming the challenges discussed in this article. As it is explained in the next paragraphs, well-known methods, such as surveys and case studies, have been used to evaluate the proposed tool. This systematic approach is fundamental to the successful development of a new software system and ensures that the objectives are effectively achieved.
The
Analysis phase involves a comprehensive examination of the problem domain. Here, we define the requirements, identify stakeholders, and gain a deep understanding of the challenges and constraints. In this step, the challenges, the goals, and the basic functionality of the system are presented. Also, the metrics that the system supports are selected. As detailed in
Section 3, metrics put forth by C&K and B&D are implemented in this study, encompassing code size metrics and the McCabe cyclomatic complexity. The core ideas behind these metrics as originally presented by their respective authors are examined and potential ambiguities associated with these concepts that could lead to misinterpretation are addressed. Where multiple computation approaches exist for a given metric, we provide clarity on the computation methods adopted by the SQMetrics tool. This initial phase lays the foundation for the subsequent stages.
Building upon the insights from the analysis, the
Design phase focuses on creating a blueprint for the software system. Architectural diagrams, data models, and user interfaces to conceptualize the system’s structure and behavior are developed. The architecture of the tool is presented in
Section 4, where the class hierarchy and the design of the graphical environment of the SQMetrics tool are explained. This phase guides the implementation process.
The
Implementation and Testing phase is thoroughly presented in
Section 5. In this step, the system is implemented and its functional adequacy is tested. The implementation phase involves translating the design specifications into a working system, including coding, integration, and configuration. Also, rigorous testing is critical to ensure the software functions as intended and meets quality standards. Test cases were developed and tests on the SQMetrics tool were executed to see if it meets the functional requirements [
32]. Demonstration measurements, functional tasks, and a comparison of results to other software metrics tools are presented. To demonstrate the results derived from SQMetrics computations, an analysis has been conducted using a Java project consisting of seven classes, developed primarily for educational objectives. Next, the results of the SQMetrics tool measurements are compared to the results of the four widely used software metrics tools ckjm, cccc, Understand, and CodeMR. This comparison consists of a test for SQMetrics’ completeness and functionality. Finally, the functional comparison tasks that SQMetrics can perform (comparison of different versions of a Java project; comparison of different Java projects) are explained and discussed through two real-world test cases: comparison between 9 different versions of the SQMetrics tool (from v0.2 to v0.9), and comparison between 8 different Java projects.
The final
Evaluation phase involves assessing the software’s performance and functionality against the initially defined requirements. This evaluation includes user testing and comparison to well-known software quality metrics tools. The evaluation phase provides valuable insights for fine-tuning and further enhancements. As detailed in
Section 6, in this step, the system is evaluated based on three axes:
Effectiveness: A Rubric-based evaluation of software quality metrics tools, based on functional and usability criteria, is useful in assessing and comparing different software tools [
33]. A Rubric is a framework that sets out criteria and standards for different levels of performance and describes what performance would look like at each level. Our proposed framework incorporates a set of 17 meticulously defined functional and usability criteria, which collectively provide a well-rounded perspective on the capabilities and limitations of various software quality metric tools. Some criteria also belong to certain sub-categories (e.g., security, compatibility, portability, etc.). The outcomes of this assessment, presented in
Section 6.1 of this article, offer a detailed account of the SQMetrics tool’s performance, usability, and its comparative placement among its peers in the field.
Usability: The perceived usability of the SQMetrics tool has been measured using the System Usability Scale (SUS) questionnaire. The SUS questionnaire is a widely recognized and validated instrument for gauging the usability of software applications, and is considered one of the most effective questionnaires in terms of the validity and reliability of the results produced. It comprises a set of ten questions designed to elicit user feedback on various aspects of the SQMetrics tool’s usability. The overall SUS score for the SQMetrics tool was 70.67 (SD = 15.05), indicating good usability. The study is presented in
Section 6.2.1.
Other aspects: In our comprehensive evaluation of the SQMetrics tool, the multifaceted nature of software quality assessment is acknowledged. In addition to measuring perceived usability through the SUS questionnaire, our study focused on other critical dimensions, including the validity and understandability of results, potential limitations, and the tool’s learnability. To gather insights into these aspects, a customized questionnaire tailored to the unique characteristics and goals of the SQMetrics tool was designed. A Cronbach’s alpha result of 0.782 for the items in this custom-made questionnaire suggests a relatively good level of internal consistency reliability. The findings from this questionnaire are presented in detail in
Section 6.2.2, where a comprehensive study showcasing the SQMetrics tool’s performance across these critical dimensions is provided. This holistic approach to evaluation ensures that this research not only quantifies usability, but also offers a well-rounded assessment of the tool’s overall quality and practicality.
User testing was performed with the volunteering participation of 78 postgraduate students studying the course “Software Design and Management”, which is part of the Postgraduate Program on Information Systems at Hellenic Open University. The study was carried out from 20 April 2023 to 17 May 2023.
By following this structured methodology, a systematic and organized approach to software development is ensured, enhancing the quality and reliability of the proposed SQMetrics system. The conclusions of the article verify SQMetrics’ effectiveness in helping SE students learn critical concepts and improve their code quality.
3. Analysis of the SQMetrics Tool
3.1. Goals and Functionalities
The main goal of this study is the development of an easy-to-use open-source tool capable of calculating a complete set of quality metrics for code written in Java, with an emphasis on object-oriented metrics, to support both students and teachers involved in SE academic courses.
The developed SQMetrics (Software Quality Metrics) tool calculates the most common code size metrics (lines of code, logical lines of code, and lines of comments); all metrics proposed by C&K; all metrics included in the third level of the hierarchical QMOOD model, as proposed by B&D; as well as the quality characteristics of the first level of this model. QMOOD metrics were included in the tool as they allow for overall high-level quality indices to be calculated.
Namely, our tool calculates the third-level metrics of QMOOD (DSC, NOH, ANA, DAM, DCC, CAM, MOA, MFA, NOP, CIS, NOM); the first-level quality characteristics of QMOOD (REUSABILITY, FLEXIBILITY, UNDERSTANDABILITY, FUNCTIONALITY, EXTENDIBILITY, EFFECTIVENESS); the common ‘Lines of Code’ metrics (PLOC, LLOC, LC); and the object-oriented metrics that are commonly used in research studies (DIT, NOC, CBO, WMC, LCOM1, LCOM2, LCOM3, RFC).
The adopted metrics play a crucial role in software quality assessment and improvement. The third-level metrics of QMOOD offer insights into design complexity, maintainability, and encapsulation [
34,
35]. The first-level quality characteristics are critical attributes assessed using these metrics [
36]. Common ‘Lines of Code’ metrics provide size-based estimates, aiding in project planning and effort estimation. Finally, the most popular object-oriented metrics offer insights into design complexity, coupling, cohesion, and maintainability [
35]. These metrics collectively guide software developers and architects in making informed decisions about code design, refactoring, and optimization to enhance software quality, maintainability, and overall performance. There are several research publications that identify these metrics as “popular”, e.g., [
37,
38]. The popularity of these metrics can also be seen in the fact that they are included in widely used software tools for measuring software quality, such as Eclipse Metrics Plugin, Understand, and SonarQube, as well as in industry standards such as ISO/IEC/IEEE 12207 and 25010 [
4].
Finally, from the above metrics, SQMetrics can produce overall Total Quality Indices (TQIs), thus providing the ability to compare (a) different versions of the same application code or (b) different software applications (by adapting the approach proposed by B&D).
3.2. Challenges
Software quality and metrics tools are essential for software developers to assess the quality of their code and ensure it meets the required standards. There are various tools available in the market that offer different features, capabilities, and metrics. SonarQube, CAST Application Intelligence Platform, and JIRA Software are some of them. Each tool has its strengths and weaknesses, and a more thorough contemporary tools overview together with their Rubric-based evaluation is presented in
Section 6.1.
In order to compute the set of metrics described in the previous section, relevant tools capable of providing such measurements were studied. It was found that there are tools that calculate some of the metrics of the above models, but not all of them. Apart from the metrics, none of the tools examined in this study could fully support the high-level quality features of the QMOOD model [
29]. More particularly, none of them can: (a) compute the quality characteristics of the QMOOD model, (b) compare different versions of the same project, or (c) compare different projects according to the QMOOD model.
Moreover, the various tools adopt different methods of computation for some metrics but do not provide the user with configuration options, so that they can choose the desired method with which each metric will be computed. In other words, different tools make their own assumptions on how to compute some conceptually ambiguous metrics.
In addition to the above, the various tools are often not suitable for inexperienced users, as they either run in the shell, or constitute add-ons to other applications (with all that implies in terms of compatibility with new versions of the main application), or require extensive configuration in order to work properly.
Finally, the existing metrics tools were not made for educational purposes and as such may not be suitable for students and teachers of a SE course. The tool could be useful to teachers and students by providing a quantitative measure of the quality of their code. Students can benefit from such measures since they can identify areas for improvement and track their progress over time. It can also help teachers assess student performance and provide targeted feedback to help students improve their code. Additionally, the use of the tool can help students develop critical thinking skills and a deeper understanding of object-oriented principles by analyzing and improving the quality of their Java code.
The proposed SQMetrics tool fully supports the above models and tries to overcome these challenges. The tool provides a simple GUI, which is suitable for inexperienced users (such as SE students) as well, together with a fully parametrized environment in order to support different methods of computation for certain metrics. It also supports the high-level quality features of the QMOOD model in order to assess the overall quality of a Java project. SQMetrics has been developed for educational purposes considering various pedagogical issues (tool design, educational objectives, pedagogical strategies, etc.). The metrics supported by the tool are presented in the next section.
3.3. Software Quality Metrics Supported by the Tool
As mentioned before, the metrics considered in this study are those proposed by C&K and B&D, code size metrics, as well as the McCabe cyclomatic complexity. The following sub-sections present the main concepts related to those metrics (as proposed by their authors), as well as certain ambiguities that accompany these concepts and may be misinterpreted. In cases where there are several alternatives for the computation logic of a metric, the computation methods adopted by the SQMetrics tool are clarified.
3.3.1. Structured (Procedural) Programming Metrics
The most common metric used to measure the typical size of code is LOC (Lines Of Code). This metric can be analyzed into three sub-metrics, which are:
Physical Lines Of Code (PLOC), where all the lines of code are counted along with the blank lines and comments. It is essentially the number of “ENTER” or “CR” characters.
Logical Lines Of Code (LLOC), that is, the command lines. A logical line is any line that contains actual code. Comment lines do not count. Instead, lines containing code, along with comments, are normally calculated. Blank lines and lines containing only a curly brace { are not counted.
Lines of Comments (LC), i.e., the lines containing comments. They may contain only a single comment or a comment together with actual code (in the same line). Comments that extend to more lines are calculated for each line separately.
Lines of code metrics can provide an indication of the effort required to develop the code [
39]. To calculate the above metrics, the tool “reads” the class code line-by-line (parsing) from the corresponding java file.
Another fundamental metric is the complexity of the code. The metric of cyclomatic complexity (
CC) was proposed by McCabe [
27]. For the calculation of CC, decision or branching nodes are counted and a graph of the code execution flow with nodes and edges is created. Then, cyclomatic complexity for a flow graph G is given by Equation (1):
where V(G) is the cyclomatic complexity, e is the number of edges, and n is the number of nodes [
27].
The cyclomatic complexity V(G) for a flow graph G can also be defined as
where p is the total number of predicate nodes contained in the flow G [
40]. Finally, V(G) is equal to the total number of regions in the flow graph (the closed regions bounded by nodes and edges plus the outer open region not bounded by nodes and edges). V(G) assumes discrete integer values.
As an example, the calculation of the cyclomatic complexity of the method that computes the NOC metric of the C&K model is presented in
Figure 1 and
Figure 2 (the metric and the tool are presented thoroughly in the next sections). The code in
Figure 1 consists of a part of the
metrics.Metrics class.
Watson and McCabe proposed to measure keywords (decisions–branches) and operators. Therefore, starting from 1, one unit is added for each keyword [
20]. In the previous example, we have three keywords (one FOR and two IFs). The last appearance of the “Return” statement does not count. Thus, starting from 1 and adding 3, we have a cyclomatic complexity of 4 (the same result as above).
The upper bound established by McCabe for its complexity measure equals 10, as higher values make the code more prone to errors and debugging more difficult [
9]. However, in practice, especially when experienced programmers are involved, values of up to 15 or even higher can be present and acceptable [
41] (p. 15), as it depends on the code’s nature. Moreover, the object-oriented paradigm can be a factor that influences the threshold. In [
42], a sample of 694 Java products has been measured, and it was found that more than 90% of the measured methods have a cyclomatic complexity of less than 5 and only 2% of the methods have a complexity greater than 10. This illustrates the fact that measure thresholds are context-dependent.
This latter approach of Watson and McCabe is the one adopted also by the present study, as it greatly simplifies the code required to calculate this metric. The code of each method is parsed and the presence of particular reserved words is counted: “if”, “case”, “default”, “for”, “while”, “break”, “continue”, “catch”, “finally”, “throw”, “throws”, “return”, and the operators “&&”, “||”, “:”, “?” [
41], (p. 25). Regarding “return”, its last instance is not counted. Of course, any presence of the above words in comments does not affect the metric calculation.
It should be noted here that in object-oriented programming languages, it does not make sense to calculate the cyclomatic complexity for the whole code, but for specific elements of it, such as individual methods (functions) or even classes.
3.3.2. Object-Oriented Metrics
Chidamber and Kemerer (C&K) Metrics
C&K’s proposed metrics are [
28,
43,
44]:
Number of Children (NOC): It is the number of direct descendants of a class, that is, the classes that directly inherit from it; its subclasses. A modification of the parent class has a potential impact on the offspring (child class). The higher the NOC, the greater the control required to make changes to the offspring if changes are made to the parent. Because there is no specific method of the java.lang.Class to return the direct descendants of a class, the tool detects the classes that have the class under consideration as a superclass. For each one of them, the NOC of the class is increased by 1.
Depth of Inheritance Tree (DIT): It is the “depth” (or the “height”) of the inheritance tree of a class, within a software project. The more ancestors the class has, the greater the DIT. A high value of DIT means that there is an increased chance of influencing the class, in case changes are applied to its ancestors. Classes that inherit directly from the Object class, or from other external classes (such as javax.swing.Jframe, for example), are considered to be at the top (or, in another sense, at the root) and have DIT = 1. The tool checks whether the class under consideration has a superclass within the project, and if so, retroactively calls itself to check if the superclass also has a parent, increasing the DIT by 1 each time, until it reaches the root.
Coupling Between Objects (
CBO): Two objects are coupled, when and only when at least one of them interacts with the other. This coupling can occur through method calls, field accesses, inheritance, arguments, return types, and exceptions. Although there are studies that do not consider the inheritance relationship as coupling [
45], the definition of CBO explicitly includes coupling via inheritance [
44] (a change from the earlier definition [
28]). Our tool increases a class’s CBO by 1 for each other class with which it communicates, that is, it calls its methods, uses its fields, or objects of its type, or when the other class performs at least one of the above forms of communications. First, the code of the class is checked, and all the classes to which it refers are stored in a list. Then, the code of all the other classes is checked and the ones referring to that class are registered in the list. In the end, duplicates are deleted and the tool returns the size of the list. SQMetrics provides the option to accept inheritance as coupling or not. The default choice is that inheritance relations are normally calculated.
Weighted Methods per Class (WMC): It is the complexity of the class. That is, the sum of the complexities of the class methods. It is given by Equation (3).
where
ci is the complexity of method
i and
n is the number of methods.
WMC assumes discrete integer values.
C&K do not explicitly define the concept of complexity. Therefore, the complexity of each method can either be considered equal to 1, or the McCabe cyclomatic complexity can be calculated for each method. C&K suggested the McCabe cyclomatic complexity to be used [
43], but later in their final publication, they simply state that any “traditional” metric can be applied [
44]. In general, the number of methods and the complexity constitutes an indicator of the effort required to develop and maintain the class. The greater the number of methods in a class, the greater the potential impact on the offspring, as they inherit all the methods defined in the superclass. The SQMetrics tool calculates the sum of the cyclomatic complexity of all the methods in the class. Obviously, McCabe’s cyclomatic complexity is calculated for each method separately. When a method calls another one, the cyclomatic complexity of the method being called is not added to that of the caller method. Note that constructors are not counted. For each class method, the tool calculates its cyclomatic complexity by calling the relevant method
Lack of Cohesion of Methods (
LCOM): Cohesion refers to the degree to which the elements inside a module belong together. Two methods in a class are cohesive when using at least one instance variable together. The higher the number of such pairs of methods, the greater the cohesion of the class. For the calculation of LCOM1 (the first version of the metric), one unit is added for each non-coherent pair and one unit is subtracted for each coherent pair. If the result is negative, then LCOM1 is 0 and the class is considered completely coherent. Note that according to C&K, only the instance variables are considered and not the static ones [
44] (p. 488). A high cohesion of a class is desirable, as it promotes encapsulation. A lack of cohesion implies that the class should probably be divided into two or more classes. Low cohesion increases complexity, thus increasing the likelihood of errors in the development process. Two alternative forms of
LCOM1 are
LCOM2 and
LCOM3, which are calculated according to Equations (4) and (5), respectively (
LCOM2 and
LCOM3 assume real values):
m: The number of class methods;
a: The number of variables in the class;
μAj: The number of methods that access the variable Aj;
sum (μAj): The sum of μAj for all variables in the class.
Apart from LCOM1, LCOM2, and LCOM3, there are a few other variations and extensions of the LCOM metric (e.g., LCOM4, LCOM5, LCOMHS, etc.), which provide more specialized perspectives on measuring cohesion within classes and systems. Among the various Lack of Cohesion in Methods (LCOM) metrics, LCOM1, LCOM2, and LCOM3 are the most commonly known and used in the software engineering community. The tool calculates the lack of cohesion between the methods of a class by using those three popular versions, since they are the foundational variations of LCOM. Getters and setters, as well as constructors, are not considered. Of course, if the class has no fields (properties), then LCOM is 0. In all three cases, the code of each method is parsed in order to detect the non-static object fields they use. To speed up the tool process, LCOM2 and LCOM3 are calculated by the same method.
Response For a Class (
RFC): The RFC metric is defined by C&K as the set of class methods that can be executed in response to a message received from an object in that class. It is the union of all the methods of this class with the set of methods of other classes called by the methods of this class [
44] (p. 487). As a set, each method must be counted only once. If the RFC for a class is large, it means that there is a high complexity. In this case, the debugging of the class becomes more difficult, as it requires a higher level of understanding, on the part of the tester. The greater the number of methods that can be used by a class, the greater its complexity. In SQMetrics, the proposal of C&K is implemented; and therefore, the methods of other classes that call methods of the class under consideration are not calculated. However, the tool provides the user with the option for those methods to be considered, as well. The class constructors are included. The tool code that computes this metric is quite complex, as it parses the code of all the methods of the class word-by-word, while its complexity increases sharply, in case the user chooses to include the methods of other classes that call methods of this class. In this case, the code of all the methods of all the classes should be analyzed in order to determine if there is communication between classes.
Kaur and Maini’s view is worth noting, as they use C&K metrics (but not only them), to detect code problems (bad smells) [
46].
The model proposed by C&K is one of the first models for metrics concerning object-oriented programming and therefore enjoys wide acceptance. However, its metrics do not cover aspects of object-oriented programming, such as encapsulation (except for LCOM) and polymorphism. For this reason, proposals have been made to extend this model to better support such properties. Abreu and Melo suggest additional metrics, such as
MHF (Method Hiding Factor) and
AHF (Attribute Hiding Factor) for information hiding and
PF (Polymorphism Factor) for polymorphism [
47,
48]. Moreover, Li and Henry presented more detailed metrics for calculating cohesion, such as
MPC (Message Passing Coupling) and
DAC (Data Abstraction Coupling) [
49].
One model that extends the capabilities of the C&K model and is also widely accepted is the Hierarchical Model presented in the next section.
Hierarchical Model (QMOOD)
In 2002, Bansiya and Davis (B&D) presented the Quality Model for Object-Oriented Design (
QMOOD) [
29]. Referring to previous models, but mainly to ISO 9126, they pointed out that “they are vague in their definition of the lower-level details and metrics needed to attain a quantitative assessment of product quality” [
29] (p. 5).
The model refers to four levels and three links between the levels (
Figure 3).
To determine the quality characteristics of the first level, B&D modified the characteristics of ISO 9126, from Functionality, Usability, Reliability, Efficiency, Maintenance, and Portability to Reusability, Flexibility, Understandability, Functionality, Extendibility, and Effectiveness. Then, the properties needed for the calculation of the first-level characteristics were determined, and they came up with the following: Abstraction, Encapsulation, Coupling, Cohesion, Complexity, Design Size, Composition, Messaging, Inheritance, Polymorphism, and Hierarchies.
These properties can be assessed directly by examining the internal and external structure, the relationship, and functionality of the design elements, features, methods, and classes [
50]. They are easy to calculate and, therefore, combinations between them can be used to calculate the characteristics of the first level (L
1 in
Figure 3).
Table 1 shows the relationships between the quality characteristics of the first level with the design properties of the second level (L
12), as well as the corresponding weights. Each attribute is calculated as the sum of the values of the corresponding properties on the corresponding factor and assumes real values, e.g.,
In order to numerically estimate each of the second-level design properties, B&D proposed level-three metrics and correlated them with the properties through one-to-one matching (L23). The proposed metrics by B&D are presented next (before each third-level metric’s acronym is its correlated second-level design property in brackets):
(DESIGN SIZE) Design Size in Classes (DSC): It is the total number of classes of the project. The tool obtains the size of the list of classes, which has already been created, in the initial stages of the tool execution.
(HIERARCHIES) Number Of Hierarchies (NOH): It is essentially the number of classes that have DIT = 1 (i.e., they are at the top/root of the tree) and NOC> 0 (i.e., they have at least one subclass).
(ABSTRACTION) Average Number of Ancestors (ANA): This metric can be computed in a straightforward way since it is a simple function of DIT and DSC.
The above three metrics (DSH, NOH, and ANA) are not class metrics, but they concern the whole project and should only be calculated once for the entire project. However, because their computation complexity is very low, they do not burden the system at all and in consequence, they can be computed along with each class’s analysis. Otherwise, the output table would be more complex, which would cause unnecessary overload to the system and some degree of difficulty in exporting the results to a file.
(ENCAPSULATION) Data Access Metric (
DAM): It indicates the percentage of the “protection” of the properties (fields or variables) of a class. Essentially, it is the ratio of the number of private and protected properties to the total number of properties of a class. It should be mentioned here that B&D vaguely discuss which properties should be considered. They state “the number of the private (protected) attributes” [
29], (p. 8). In object-oriented programming, there are two different concepts: private properties are only accessible within the class, while protected properties can be accessed throughout the package (but not within the entire project if there are more packages). It is not explicitly explained whether the term “protected” refers to the term “private”; and therefore, only the private ones should be considered, or it refers to both private and protected ones, so both should be considered. Of course, different programming languages have slightly different semantics (e.g., C++ vs. Java) for the keyword, and when B&D wrote their metric, they probably merely wanted to make their basic idea clear and did not have a particular language in mind. Nevertheless, regarding the metric’s calculation, the dominant view seems to be that only the private properties are considered, as, for example, in [
50], where the term “protected” is not even mentioned. Another view supports the idea that excluding protected attributes from the calculation of the DAM may result in an incomplete picture of data access complexity [
51]. Specifically, protected attributes can be accessed by subclasses, which may result in more complex data access functions and therefore impact the maintainability and quality of the software design. SQMetrics provides the option for only the private properties (fields) to be calculated (default) or both private and protected properties (fields) to be calculated. The fact is that the decision of whether or not to exclude protected properties depends on the specific needs and goals of the project. In case there are no class or instance variables, the tool returns the value “1”, which is the highest (and the best) for DAM, as it is a ratio, and not the value “0”, which is the lowest.
(COUPLING) Direct Class Coupling (DCC): This is the number of classes to which a class is related. A class is directly related to another class when they have a parent–child relationship or has a field with its type, or its methods return a value or have a parameter with a type of the other class. Initially, SQMetrics checks whether the class under consideration is connected through inheritance relationships with any of the other classes. The tool subsequently validates whether the fields, method parameters, or return values belong to another project class as their data type. Any classes found to fall in the cases above are stored in a set. The same check is performed to each of the other classes, and if coupling is detected, the class is added to the set. Finally, the value of DCC coincides with the size of the set (in which, of course, there are no duplicates).
(COHESION) Cohesion Among Methods (CAM) of class: For its calculation, the distinct parameter types of each method are considered, as well as the distinct parameter types of all methods. It is calculated from Equation (7):
where,
Mi is the number of discrete types of the parameters of the method
i,
n is the number of methods of the class, and
T is the number of discrete types of the parameters of all the methods of the class. It takes real values between 0 and 1. Values close to 1 mean a greater cohesion. It differs from the LCOM metric of C&K. To compute CAM, three variables are required: the number of methods of the class; the number of distinct types of parameters of all methods; and the sum of the distinct types of parameters of each method, for all methods. The tool stores the parameter types of all the methods in the class in a list and performs the calculations according to Equation (7).
(COMPOSITION) Measure Of Aggregation (
MOA): It is the number of variables whose type is user-defined. In other words, these are variables that have another class of the project as their type. B&D do not specify exactly which variables are considered for this metric [
29] (p. 8). Thus, for the calculation of this metric, each tool can consider any variables, depending on its views and needs. In our tool, by default, only the properties of the class (and object) that are defined by the user are calculated, that is, those that have a class from the project as their type. To cover the remaining cases, three user options have been added to the tool:
To include the constructors’ and methods’ parameters;
To include the returned method types;
To include the variables defined within the body of the constructors and methods.
Checking the class fields and the parameters of the constructors and methods as well as the returned types of methods can be implemented with the use of the relevant methods provided by Java. But checking the variables, defined in the “body” of constructors and methods, requires the detection of their code, line by line. Thus, once the third option has been selected by the user, the computation complexity increases.
(INHERITANCE) Measure of Functional Abstraction (MFA): It is the ratio of the number of inherited methods to the total number of methods to which a class variable has access (i.e., all inherited methods plus class methods). For the computation of MFA, the methods inherited from the class and the methods defined in the class are considered. Inherited methods include private and protected ones, but not overridden or hidden ones.
(POLYMORPHISM) Number Of Polymorphic (NOP) methods: It is the number of methods of a class, which have the ability to exhibit polymorphic behavior. Such methods can be the abstract methods. Moreover, the methods of the class, which are overlaid or hidden by some method of its descendants, are polymorphic. For the computation of this metric, the tool checks for the existence of abstract methods within the class. Such methods may exhibit polymorphic behavior. It also checks the methods of the descendants of the class. If any of these override or hide a class method, this method exhibits polymorphic behavior. NOP is the number of methods that may have polymorphic behavior.
(MESSAGING) Class Interface Size (CIS): It is the number of the public methods of the class.
(COMPLEXITY) Number Of Methods (NOM): It is the total number of methods declared in a class. The number of methods in the class is calculated by using the Java method getDeclaredMethods, while the necessary “cleaning” is also performed, as already discussed in a previous section.
We observe that each metric corresponds to one and only one property, and vice versa. In their publication, B&D do not provide any additional clarifications about it [
29].
Level 4 refers to the parts of object-oriented design, that is: objects, classes, and the relationships between them. Properties are the fundamental components in defining an object and their representation is directly supported in object-oriented programming. Fourth-level parts can be computed directly from code and form the basis for the third-level metrics computation (L
34). Considering
Table 1 and the mapping with the corresponding metrics, we end up with the calculation of the quality attributes of the model, as shown in
Table 2.
The computation of each of the six quality attributes of the model is a function of the various metrics of the third level of the model, given by an equation with weighted indices for each one. If a required metric has not been computed by the tool (e.g., because the user did not select it), then the associated quality attributes will not be calculated and the result will be 0.
SQMetrics can extract and compute all useful metrics of the QMOOD model: the 11 metrics of Level 3 (which correspond to the 11 design properties of Level 2), as well as the six high-quality attributes of Level 1. The summation of the quality factors is computed to reach the overall QMOOD total quality index [
52]:
TQIs have been used in various studies and assume real values.
4. Design of the SQMetrics Tool
The application consists of 15 classes, 6 of which mostly concern the graphical environment of the application.
Figure 4 shows the class hierarchy diagram of the latest version of the tool. The classes related to the graphical environment are highlighted in orange, while the external classes (that do not belong to the application but are inherited) are highlighted in green. The rest of the classes in the hierarchy (which are not highlighted) are the core classes of the tool that perform the computation of the metrics. All classes of the SQMetrics tool belong to the “metrics” package.
After the user defines the path containing the files of the code to be analyzed, the tool detects the folder in question, as well as its subfolders, and two lists are created. One contains all the * .java files to be detected, which are of JavaFile type, and the other one, the corresponding * .class files, which are of ClassFile type. These two classes are subclasses of the metrics.GenericFile class, which inherit from java.io.File.
It should be noted here that in some cases, during compilation, more than one * .class file is created for the same class (this is mainly observed in classes concerning GUI). In such cases, these files are “cleared” (i.e., ignored) and only the main class file is saved automatically in the list.
Next, the * .class files are initialized, and another list of classes is created. This way, the application is capable of retrieving all the information of the classes available in Java (in java.lang.Class), such as name, ancestor, methods, fields (properties-parameters), etc.
It should be also noted here that more than one method entity may be created by the compiler for a specific method. Again, in such cases, the application “cleans” these “entities” and calculates only the actual method. Otherwise, the number of methods would increase greatly and, as might be expected, lead to erroneous measurements.
The tool mainly uses these three lists and the methods provided by Java in java.lang.Class, but also “reads” the code of the * .java files (parsing), in order to perform the calculation of all metrics.
5. Implementation and Testing of the SQMetrics Tool
The tool has been developed in Java in order to be independent of the execution environment and yet portable. SQMetrics runs on Windows, Mac OS, and Linux without installation required. The tool, its documentation, and the source code are freely available as it is an open-source project. The implemented approaches for calculating the supported metrics have been described in
Section 3.3.
Test cases were developed and sample measurements were executed on the SQMetrics tool to test its functional adequacy. Demonstration measurements, functional tasks, and a comparison of results to other software metrics tools are presented in the next two sections.
5.1. Software Comparison
The SQMetrics tool can compare either different versions of the same software application, or different software applications, as suggested by B&D. In both cases, the values must first be normalized, as follows.
5.1.1. Comparing Different Versions of the Same Software Product
The results computed for the first version are used as a basis. In other words, the values derived from all versions are divided by those of the first one. Thus, the range will be similar, regardless of the respective design property. Next, the quality attributes for each version are computed, based on the normalized values. This shows the progress in each feature, among the different versions of the software product. Accepting that each feature has the same weight, summing the results of all six features, we have a value for each version, which reflects its overall quality (TQI), as shown in the previous section.
5.1.2. Comparing Different Software Products
Let n be different software applications. For each design property, n corresponds to the application with the highest value, followed by the rest in descending order. In case two or more applications obtain the same value, then they will have the same ranking, but the next one will be ranked in its normal position (where it would be if there were no applications with the same ranking). For example, if three applications are ranked in the same position 4 (because of the same value), then the next one (the one with the following lower value) will be ranked in position 1, which is actually the lowest value.
In order to compare different software products, it has to be assured that the * .csv files that will be selected have been created by the same version of the SQMetrics application with the same options selected. Metrics values derived from different computation methods may lead to invalid comparison results. Moreover, if the comparison concerns different versions of the same software project, the *.csv file that corresponds to the older version must be selected first. This is because the application normalizes the values, based on the first selected file.
Each selected file is displayed on the screen. Related error messages are displayed if (a) a file is selected twice, or (b) the “Compare” button is pressed without at least two .csv files having been chosen and the comparison cannot be performed.
Depending on the type of comparison, the results are displayed on the screen, either after comparing different applications (
Figure 5), or after comparing different versions of the same application (
Figure 6).
5.2. Demonstration Measurements
To demonstrate the results derived from SQMetrics computations, an analysis has been performed with the code of a small Java project with seven classes, programmed for educational purposes. It is a lightweight application with a limited amount of code, which is fully functional and therefore ideal for cross-checking calculations manually. The UML class diagram for this project is given in
Appendix B.
5.2.1. Code Measurements
The SQMetrics measurements of the indicative Java project code had all the additional options provided by the application disabled and are presented next.
Metrics concerning the whole project (DSC, NOH, and ANA from the QMOOD model) are shown in
Table 3. Size metrics for all classes (PLOC, LLOC, and LC) are presented in
Table 4.
Table 5 shows the metrics derived from the C&K model, while the rest QMOOD metrics are presented in
Table 6.
Moreover,
Table 7 shows the quality features of the QMOOD model, for each class separately, but also the average values.
5.2.2. Comparing Software Metrics Tools
Next, the results of the SQMetrics tool measurements are presented along with the results of the following four widely used software metrics tools: ckjm, cccc, Understand, and CodeMR (a plugin for Eclipse and IntelliJ IDEA) [
53,
54,
55,
56,
57]. These tools that were used for the comparison do not support the computation of all the metrics that SQMetrics measures, and also, they calculate others which are not examined by the present study. Especially for ckjm, we present the measurements from two versions of the tool; version ckjm-ext returns some class detection errors but supports more metrics than version ckjm-1.9. These four particular tools were selected for the comparison as they meet the following criteria: they support the Java language, they are free software or at least provide free trial use, and they support (among others) object-oriented software metrics. Therefore, the comparison to these widely known similar (in terms of supported metrics) tools was found to be a satisfactory preliminary test for SQMetrics’ completeness and functionality. A more thorough description and comparison of software quality metrics tools can be found in
Section 6.1.
Table 8 presents the aggregate results for the whole Java project, given by the various tools. For the PLOC, LLOC, LC NOP, CIS, and NOM metrics, the sum of the individual values for each class was considered, while for the other metrics, the average was considered. Measurements show that, for the same software project and metrics, the metrics values are tool-dependent.
The results of the SQMetrics tool measurements for each metric are presented along with the results of the other four tools in the next tables in detail.
Table 9,
Table 10,
Table 11,
Table 12,
Table 13 and
Table 14 use the following notation for the tools in this study: SQM (SQMetrics), ckjm-ext, ckjm 1.9, cccc, UND (Understand), and CodeMR. Results for a tool are only presented in case the specific measure is supported by the tool.
As it can be concluded from the previous comparison, small to very large deviations were observed, mainly for the ckjm and cccc tools. The rest of the tools presented small deviations. However, discrepancies were also found in certain metrics’ computing approach between the tools. This is also confirmed by the tools’ documentation. The approach method for computing certain metrics for each tool could not be criticized, since in many cases, even the ‘inventors’ of metrics, like the World Organization for Standardization, allow and support relative freedom to the user to adapt metrics, according to their own needs.
Concerning the original sources for the various concepts analyzed, as published by their creators, some confusion may arise as to the definition of the various metrics (for what should be measured and what should not). Noteworthy is the B&D ambiguity as to whether protected properties should be considered when calculating the DAM metric. This has not been clarified yet and, for this reason, the SQMetrics tool provides an option to calculate them or not, transferring the “responsibility” to the user. Also, concerning the same metric, there is no clarification of what is measured in case no variables are present (in this case there is division by zero). The SQMetrics tool presents a result equal to 1. Another detail that has not been clarified is which variables are considered for the calculation of the MOA metric. Again, SQMetrics provides several options.
By studying the various metrics, other ambiguities can be identified. For example, whether the constructors, the inherited, overloaded, overridden, private methods, etc., should be calculated in the NOM metric, or how internal classes should affect the cyclomatic complexity of the methods to which they belong [
58]. In the SQMetrics tool, internal classes, if defined within a method, are considered in calculating the cyclomatic complexity of the method to which they belong, as they form part of its code.
5.2.3. Comparing Different Versions of a Java Project
As also shown in the tool’s results in
Figure 6,
Table 15 shows the results of the comparison between nine different versions of the SQMetrics tool (from v0.2 to v0.9). Version 0.1 supported running the application and displaying the results in the shell and, therefore, comparing it to later versions would yield large deviations in results. Because of v0.1’s different functionality, it was deemed appropriate not to include it in the evaluation.
A noticeable index decreasing in the Understandability of the latest versions can be observed. This is common for newer versions of a software tool, as there are more functionality features, so it is usually more difficult and complicated for the system to be comprehensible. Actually, it is expected for Understandability to decrease in value from version to version [
59].
Also, we can observe that the index of Extendibility is constantly decreasing, instead of increasing. This is because in each updated version of the application, more classes were added. Related to the Extendibility feature is the “Coupling” property, which corresponds to the Direct Class Coupling (DCC) metric and has a negative value. Given the increase in classes, but also the creation of objects with some of those classes as a type, the DCC metric increases, so Extensibility decreases. The three latest versions even have a negative value. This can be explained because it was decided to split several large classes that existed until v0.6b into two or more classes. This resulted in greater coupling (DCC) values. However, this also resulted in about a 35% better performance of the tool in terms of total code analysis time.
These features, together with the obvious improvements in Flexibility, Functionality, and Effectiveness indices of the latest SQMetrics version, result in very little increase in the overall quality of the tool, which is more usable, stable, and effective than the previous versions. Also, the latest version has the highest value of Reusability, which indicates that the tool is more modular and easier to integrate into other systems.
5.2.4. Comparing Different Java Projects
Table 16 shows the results of the comparison between eight different Java projects. There is a separate ranking for each design property and the project with the best performance in a property is given the highest rank (in this case 8). The rest follow in the ranking, based on the method mentioned above.
Although in most cases it is not meaningful to compare two completely different projects, the tool can also provide the overall quality metrics for all projects. This could be useful, for instance, in cases of projects with similar functionality, or projects of the same development teams, in order to compare their quality features and lead to better software design and implementation practices.
Such a methodology (by comparing
TQIs to the manual grading of JAVA projects by teachers through statistical analysis) was used in [
31] to experimentally test SQMetrics for its assistance in the evaluation of students’ Java programming assignments. The results showed a positive correlation between the instructor’s rating and the overall quality index extracted from the software, indicating that the SQMetrics tool could be a reliable assistant to the instructor’s grading under certain circumstances.
6. Evaluation of the SQMetrics Tool
6.1. A Rubric-Based Evaluation of Software Quality Metrics Tools
An approach for evaluating software is based on the use of Rubrics, that is, tables that contain characteristic criteria that are graded on a level scale (e.g., [
60,
61]). A Rubric-based evaluation of software quality metrics tools, based on functional and usability criteria, is useful in assessing and comparing the effectiveness of different software tools. The placement of the SQMetrics tool using such an evaluation is presented next.
The proposed Rubric in this study is based on 17 criteria in order to evaluate a software quality metrics tool at a holistic high level. The criteria are divided into two categories with functional and usability features (as shown in detail in
Table 17). Some criteria also belong to certain sub-categories (e.g., security, compatibility, portability, etc.).
Features 1, 2, 3, 4, 6, 7, 15, and 17 can be largely graded quite objectively, so the score is put by the writers, after reviewing the relative documentation of each tool. The score of the rest features (most of which concern the usability of the tools) resulted after their evaluation by the first author of the article.
Next, we present a short overview of the tools being evaluated in the present article: Understand, CodeMR, ckjm_ext, cccc, YASCA, AppPerfect, SpotBugs, CodeClimate, and SonarQube [
53,
54,
55,
56,
57,
62,
63,
64,
65,
66]:
Understand is a commercial tool. It supports many languages (including Java) and can run on Microsoft Windows, MacOS X, and Linux. It is designed to help developers understand and maintain large amounts of code. It covers a wide range of metrics, but also provides the ability for metrics designed by the users, while the results can be rendered in various ways such as html format, graphs, UML diagrams, etc. Understand uses special names rather than the usual ones for the metrics, but provides a detailed explanation for each one in order to facilitate the selection of metrics to be calculated.
CodeMR is one well-known Eclipse IDE plugin (but also for IntelliJ IDEA), which provides calculations for the most common metrics, including C&K metrics, as well as charts in html format. It supports Java and C++ languages and is available through the Eclipse IDE marketplace. However, the free version has limited features.
CKJM (Chidamber and Kemerer Java Metrics) does not parse the source code (e.g., .java files) but analyzes the binary code of the .class files. The latest version of the tool is ckjm_ext, which calculates C&K and QMOOD model metrics, McCabe’s circuit complexity, and several more. The application runs on the command line.
CCCC (C and C++ Code Counter) runs on the Windows command line and analyzes C, C++ files, and—despite its name—also analyzes Java code and generates a report on the various metrics. The metrics supported are Lines of Code (LOC), Comment Lines, McCabe cyclomatic complexity, four C&K metrics (WMC, DIT, NOC, CBO), Fan–in and Fan–out metrics [
67], and the NOM (Number of Modules) metric that measures the number of classes. The latter metric coincides with the DSC metric of the QMOOD model. CCCC parses source code files (i.e., .java) and not class files.
YASCA (Yet Another Source Code Analyzer) is a free and open-source tool that analyzes code in many languages. It runs at the Windows command line. It uses external plugins to detect errors in the code, bad programming, security gaps, etc. The measurements are plugin-dependent. The results are exported to a .html file by default, but they can also be exported to .csv or .db files. A quite useful YASCA plugin is PDM, which, among other things, calculates the cyclomatic complexity of methods and classes.
AppPerfect offers a suite of software quality analysis tools that aid in evaluating the codebase’s quality and maintainability. Their tools encompass static code analysis, security vulnerability scanning, and adherence to coding standards. With features like cyclomatic complexity calculation, code duplication detection, and the identification of potential coding issues, AppPerfect helps ensure robust and maintainable software. These tools assist in measuring and improving various software quality metrics, contributing to the overall reliability and efficiency of the code. Such an AppPerfect tool for Java code analysis is Java Code Test.
SpotBugs is another Eclipse IDE plugin, which checks for bugs in the code. It does not calculate some specific metrics.
CodeClimate is an online code analyzing service for code in a repository on GitHub. The user must link their GitHub account to check their code. CodeClimate is free for open-source projects.
SonarQube is an open-source tool that provides continuous code inspection for bugs, code smells, and vulnerabilities. It uses various static code analysis tools to detect code issues and provides detailed reports with actionable feedback. The results are displayed in the browser in a stylish interface. SonarQube supports multiple programming languages, including Java, Python, and C++, among others. It also offers integration with various development environments, including Jenkins and GitLab. However, SonarQube is limited in its ability to detect all possible code issues, and it requires some configuration to work effectively. It also does not provide automated fixes for detected issues.
As it has been previously mentioned, the SQMetrics tool is not intended to compete with existing commercial applications. It covers mainly academic needs and is aimed at students (but also teachers) studying the various metrics, and drawing conclusions regarding code quality. Its simple interface, its compatibility with many operating systems, but also its autonomy (since it does not require the creation of an account, not even installation, and does not even depend on an internet connection), make it an ideal free aid for academic use.
Compared to the rest of the tools presented, SQMetrics seems to fall short in speed and completeness mainly compared to the commercial ones, while it excels in ease of use and simplicity compared to the free ones, thus making it efficient and ideal for study. Regarding the validity of the results, it is found that there are no large deviations compared to the expected values (as they are manually calculated). The discrepancies observed compared to the results of other tools are mainly due to the different ways of calculating the various metrics adopted by each of them.
In general, SQMetrics can be a valuable tool in the teaching and learning of software quality metrics by teachers and students, respectively.
6.2. Users’ Evaluation
The study was performed with the volunteering participation of the postgraduate students studying the course “Software Design and Management”, which is part of the Postgraduate Program on Information Systems at Hellenic Open University. All participants are over 25 years of age, already hold a university degree, and at the time of the study, are in the last year of their postgraduate studies. Moreover, all participants have at least basic Java programming skills and have been introduced to human–computer interaction concepts, as part of their curriculum. From the 82 total students who attended the course during the academic year 2022–23, 78 accepted to participate in the study (31 female, 47 male) and completed the online questionnaire. The study was carried out from 20 April 2023 to 17 May 2023. Most of the participants (72 of them) used the tool on Windows, while five of them ran the tool on Mac OS and only one participant used Linux for the evaluation.
Students had to use the SQMetrics tool to assess the quality of a given Java project and interpret the calculated metrics in terms of quality. After using the tool, students were encouraged to optionally participate in the study and evaluate the experience of using SQMetrics by filling in an online questionnaire consisting of two parts: (i) the System Usability Scale (SUS) which measures the perceived usability, and (ii) a custom-made questionnaire focusing on specific features of SQMetrics (e.g., validity of results, functionality, and ease of learning). Students who took part in the study were encouraged to also use the tool for additional tasks that were suggested to obtain a more accurate picture of the SQMetrics tool before answering the questionnaire.
6.2.1. PART A (SUS Questionnaire)
The first part of the questionnaire contains the ten questions of the System Usability Scale (SUS) questionnaire. SUS is considered one of the most effective questionnaires in terms of the
validity and of
reliability the results produced [
68,
69].
The overall SUS score for the SQMetrics tool was 70.67 (SD = 15.05), indicating good usability. The SUS scores and their graphical representation are shown in
Table 20 and
Figure 7, respectively. The histogram of the overall SUS scores showed a roughly normal distribution.
The mean scores for each individual item ranged from 3.4 to 4.3 on the 5-point Likert scale. Since the SUS questionnaire uses reversed scores for its even-numbered questions, high scores for items 2, 4, 6, 8, and 10 suggest a user’s positive attitude toward the usability aspect. The scores of this questionnaire reflect participants’ perceptions of various aspects of the software’s usability:
Participants expressed a moderate level of agreement (mean score 3.41) with the statement that they would like to use the system frequently. This suggests a generally positive attitude toward the software’s usability.
The complexity of the system received a high mean score (4.18), indicating that participants did not find the system complex.
Participants had a mixed response to the system’s ease of use (mean score 3.95), indicating that while many found it user-friendly, improvements were still needed to enhance usability.
The need for technical support received a high mean score (4.04), suggesting that participants would not require any assistance from technical personnel to use the system effectively.
The integration of various functions within the system received a moderate mean score (3.59), indicating that participants saw room for improvement in this aspect of usability.
Inconsistencies within the system were noted with a mean score of 3.73, signifying that only a few inconsistencies were perceived that could potentially hinder user experience.
Participants generally agreed (mean score 3.94) that most people would learn to use the system quickly, reflecting a positive outlook on the software’s learnability.
The mean score of 4.3 for item 8 (the highest score of all questions) means that the users did not find the system cumbersome to use at all.
The lowest score was obtained for item 9 (“I felt very confident using the system.”), although it still received a score above the midpoint of the scale. The score of confidence in using the system indicates that participants had varying levels of confidence while interacting with the software.
Learning requirements scored with a mean score of 3.78, highlighting that participants felt that they did not need to acquire knowledge before fully utilizing the system.
Overall, the results suggest positive perceptions about the software’s usability, while the highest rated areas of SQMetrics include a lack of complexity, the absence of the need for technical support, a non-cumbersome usage, ease of use, and perceived learnability.
While there is no universally agreed-upon benchmark, some studies have suggested general guidelines for interpreting SUS scores. According to [
70], a SUS score of 70.67 describes a “good” user experience. It suggests that the software has a decent level of usability but could benefit from improvements to enhance user experience.
6.2.2. Part B
The second part of the questionnaire consists of 15 questions (#11–25), which are scored on a scale of 1 to 5, with 1 being the least favorable and 5 being the most favorable answer. Questions #11–20 were obligatory, while questions #21–25 were optional. In case a question cannot be answered (e.g., because the relevant action was not taken), zero (0) is selected; 0 is only applicable to questions 21–25.
The mean scores for each question are presented in
Table 21 and
Table 22. Since reversed scores were intentionally used in some questions, the scores were normalized on the 5-point Likert scale.
Concerning questions #11–20, the questionnaire results provide insights into participants’ perceptions of the software’s usability and effectiveness. The mean scores range from 3.14 to 3.82, with standard deviations between 0.85 and 1.28, indicating moderate agreement among participants.
The highest mean score was obtained for questions 11 and 13 (“How easy was it for you to successfully calculate code quality metrics for the first time?“ and “How informative is the help provided by the SQMetrics tool, i.e., help text and popup notes?”), with a mean score of 3.82. This suggests that the process of calculating code quality for the first time was overall manageable and that the tool’s resources were helpful for the participants. The lowest mean score was obtained for Question 17 (“How easy do you find it to configure the way specific metrics are calculated in SQMetrics?“), with a mean score of 3.14, suggesting that participants encountered some challenges in this process. The participants’ responses for the remaining questions are summarized next:
The difficulty of understanding requirements and limitations of the SQMetrics tool received a moderate-to-good mean score (3.51), indicating that participants faced some level of challenge in grasping these aspects.
The comprehensibility of the results display that the screen received a moderate mean score (3.26), indicating a mixed perception of its clarity and effectiveness.
Participants perceived the validity of measurement results as moderately valid (mean score 3.51), implying a balanced assessment of how well their measurements aligned with expectations.
SQMetrics’ configurability for specific metrics was perceived as quite useful (mean score 3.76), highlighting its potential value in tailoring analyses to specific needs.
SQMetrics’ contribution to participants’ study and understanding of software quality metrics received a moderate score (mean score 3.46), suggesting that the tool played a beneficial yet not entirely definitive role.
The faithfulness of the tool to the taught metrics scored moderate to good (mean score 3.58), indicating a generally balanced perception of how well the tool implemented these metrics.
Participants viewed SQMetrics as quite useful for developers to enhance code quality (mean score 3.72), underscoring its potential value in aiding developers’ quality improvement efforts.
Participants’ responses indicate moderate to good satisfaction with the software’s usability, help resources, configurability, and overall usefulness in understanding and improving software quality. The results suggest areas for refinement, particularly in terms of clarity in the display of results and ease of configuration.
Concerning the optional questions #21–25, the percentage of the 78 participants who answered ranged from 27% to 79%, with standard deviations spanning 0.59 to 1.15, indicating varying degrees of consensus. The lowest mean score was obtained for Question 21 (“Given that SQMetrics is geared toward measuring relatively a small amount of code and not competing with commercial tools, how likely are you to use it in the future to evaluate your own code?”), with a mean score of 3.21. For the ease of comparing different code versions using SQMetrics, the process received a moderately positive rating (mean score 3.40) upon initial trial. In assessing SQMetrics in comparison to similar tools, participants rated its usability, validity of results, and ease of interpretation moderately favorably, with mean scores of 3.39, 3.43, and 3.38, respectively. The highest mean score was obtained for item 24 (“Assuming you have used other similar tools, how would you rank SQMetrics compared to the average of other applications in terms of validity of results?”).
The questionnaire offers insights into participants’ intentions to use SQMetrics, as well as their comparative perceptions of its usability, result validity, and the ease of interpretation within the context of similar tools. These findings, derived from a diverse participant pool, provide valuable insights into the software’s potential for future adoption and its standing relative to similar tools in usability and result interpretation.
In this study, Cronbach’s alpha was used to assess the internal consistency of the Likert scale questionnaire. A Cronbach’s alpha result of 0.782 for the items in Part 2 of our questionnaire suggests a relatively good level of internal consistency reliability. While there is no universal threshold for an acceptable Cronbach’s alpha, a value above 0.7 is often considered acceptable for research purposes. Overall, the results of this study suggest that the questionnaire was reliable and valid for measuring the participants’ attitudes toward the questions asked. However, further research with larger sample sizes and different populations is needed to confirm these findings.
6.2.3. Results
System Usability Scale (SUS) (questions 1–10 in our survey) is a well-known and established questionnaire to measure usability. As stated above, our SUS score of 70.67 describes a “good” user experience.
The remaining questions (11–25) pertain specifically to the SQMetrics tool and assess various aspects related to difficulty, the help provided, comprehensibility, the validity of results, usefulness, implementation of taught metrics, and the impact on software quality improvement. These questions are domain-specific and are tailored to evaluate users’ experiences with the SQMetrics tool in the context of calculating code quality metrics and software quality improvement. As the mean scores in this set of questions ranged from 3.21 to 3.82, we can conclude that users rated all aspects moderate to good.
Moreover, we conducted a correlation analysis to examine the relationship between the SUS scores (as indicated by the SUS guidelines in the range 0–100) and the total scores in the obligatory questions 11–20 of our questionnaire (normalized in the same manner as SUS in the range 0–100). The purpose of this analysis is to determine the strength and significance of the association between variables SUS and Q11_20.
The correlation analysis was performed using Pearson’s correlation coefficient, which measures the linear relationship between two variables. The analysis was conducted in SPSS. The results can be seen in
Table 23.
The correlation coefficient (r) between SUS and Q11_20 was found to be 0.600. This indicates a moderate positive relationship between the two variables. The significance value (p-value) associated with the correlation coefficient was found to be 0 (p < 0.001). This suggests that the observed correlation is statistically significant, meaning that it is unlikely to have occurred by chance. This implies that there is a tendency for participants who rated higher on SUS to also rate higher on our set of questions, and vice versa. This is a strong indicator that SQMetrics not only provides a good user experience in terms of usability (as shown by the SUS questionnaire) but also in terms of all the other aspects examined (comprehensibility, validity of results, usefulness, educational aspects, etc.).
7. Discussion
The proposed SQMetrics has been tested for its usability and functionality by comparing it with widely known similar tools. Our novel software quality metrics tool designed for educational purposes, demonstrates both commendable strengths and some areas for potential improvement in comparison to the other software quality assessment tools. As an open-source project, it does not share the characteristic of necessitating an account creation or a User Login requirement like other tools, resulting in unrestricted free access to all features. It also outperforms numerous tools in various Usability aspects such as “Completeness of documentation”, “Ease of Learning”, “Ease of Setup”, etc. This suggests a deliberate emphasis on enhancing the tool’s usability during its design, a perspective that is also evident from user evaluations in this study. Although the tool is not quite fault-tolerant at the moment and falls short in terms of “Supported Size of Code for analysis”, indicating its limited capacity to handle varying code sizes effectively, SQMetrics manages to be a good choice for educators seeking a versatile and accessible software quality metrics tool.
The SQMetrics tool proved to be useful to both students and teachers involved in a software engineering course. As shown by the feedback given by the participants in our study, the tool allows students to measure and compare metrics in their projects, leading to gradual improvements in their code quality.
Additionally, it provides instructors with the capability to evaluate their students’ Java projects and assign grades that align with the level of quality demonstrated in their work. In the results of the statistical analysis in [
31], a positive correlation between the instructor rating and the overall quality index extracted from the SQMetrics software is shown. Furthermore, no statistically significant difference is presented between these two measurements. These two observations present a first indication that the overall quality indices derived from the QMOOD model (and calculated using the SQMetrics tool) can be a useful aid for the evaluation of Java codes submitted as an academic project in a related course, which can save time and resources while maintaining grading consistency. Of course, further research is necessary to determine the extent of the software’s applicability and whether it can replace instructor grading in all contexts [
71]. It should also be pointed out that there is ongoing research in the field of the automatic grading of student projects, such as using machine learning algorithms to grade Java projects and creating intelligent tutoring systems for Java programming [
72]. This research can provide educators with new opportunities to assess students’ Java codes in a more efficient and objective manner.
As the comparison between software quality metrics tools revealed, there are deviations between SQMetrics and other tools’ computation in certain metrics. In a recent study [
73], participants indicated that they often find inaccurate metric values due to wrong implementation. This may be due to a different computing approach by each tool, but this hints at a real problem that needs a solution. It simply means that a generally accepted and clear definition for some measures’ computation methods is missing. Insufficiencies in prescriptions of how metrics should be computed have also been recognized by other authors [
74]. A proper interpretation of metric values as well as the establishment of metric thresholds are essential to characterize, evaluate, and improve the design of software systems [
75].
The results of the SUS questionnaire suggest that SQMetrics has good usability, with most participants finding it easy to use, considering it to be well-integrated. However, some areas for improvement were identified based on the lower scores obtained on certain items, e.g., Q1 (“I think that I would like to use this system frequently.”) or Q9 (“I felt very confident using the system.”), although these scores (3.40–3.41) are considered moderate to good.
Concerning Q1, the score suggests that while participants generally expressed some level of positive inclination toward using SQMetrics frequently, there may be factors or aspects of the system that could be enhanced to further increase their willingness to use it regularly. This could involve identifying the specific features or functionalities that participants would like to see improved to enhance their interest in using SQMetrics more frequently. Some users stated in our survey that they would find really useful “additional personalized tips and suggestions to the developer, depending on the result of the metrics, for better quality and cleaner code”.
Concerning Q9, the score indicates that participants reported a moderate level of confidence while using SQMetrics. However, there might be areas where the system can be improved to increase participants’ confidence levels further. This could involve addressing any usability issues, providing clearer instructions or feedback, or enhancing the tool with a more intuitive design or clearer instructions for new users. For example, a user states in our survey that “the detailed report of the metrics could be more user friendly”.
The results of our custom-made questionnaire (questions 11–25) suggest that the participants generally had positive attitudes toward the questions asked. However, it is important to note that questions 17 and 21 both had a lower mean score than the other questions. Additionally, the standard deviations of some questions were relatively high (e.g., Q14), indicating that the responses were more varied for those questions.
Concerning Q17, participants perceived a moderate level of complexity when it comes to configuring the way specific metrics are calculated in SQMetrics. They might have encountered some challenges or required some effort to understand and navigate through the configuration process. Some users stated that they “encountered difficulties while they tried to change the default options to new assumptions”. While a moderate score indicates that participants did not find the configuration process overly difficult, it also suggests that there is room for improvement in terms of enhancing the ease and user-friendliness of the configuration features in SQMetrics.
Concerning Q21, while participants are somewhat inclined to use SQMetrics for code evaluation, there may be factors or considerations that could influence their decision. A moderate-to-good score indicates that participants are likely to use SQMetrics for evaluating their own code in the future, but they are not sure as of yet. There may be certain factors that could affect their decision, such as the specific requirements of their projects, the availability of alternative tools, or their perceived effectiveness of SQMetrics compared to other options. Some of them stated that “the tool should not only be limited to Java but also to other languages”. They also pointed out “the fact that it cannot measure large code limits it to academic use only and not at a professional level”.
Finally, one limitation of this study is the small sample size of 78 participants, which may limit the generalizability of the findings. In particular, questions 21–25 were only answered by a small percentage of the participants (less than 40% of the sample) since most of the participants have not used other relevant tools in order to compare their functionalities and results. Additionally, the questionnaire was administered online, which may have introduced response bias or other sources of error.
It should be noted here that the responses from participants who have familiarity with similar tools (Q23, Q24, and Q25) reveal a positive outlook on SQMetrics’ usability, validity, and interpretability, positioning it as a favorable option for assessing code quality in comparison to other tools within the same domain.
Concerning future work and SQMetrics’ improvements, the tool’s structure can be further extended to support other models and metrics, e.g., the Halstead model, as the logic of calculating the cyclomatic complexity of the methods can be used. Another area where the tool can be improved is the ability to inspect code that uses libraries that are not native to Java. The independence of SQMetrics from system libraries will theoretically provide the ability to measure any kind of Java code.
It is also important to speed up the algorithms for calculating certain metrics, especially in case the tool computation capabilities are extended to other models. Such an improvement of approximately 35% was already made in the transition of the tool from version 0.6b to 0.7. However, further improvement in this area is desirable.
According to the responses of students who used SQMetrics in our study, a more detailed report, identifying bad smells and indicating corrections to the code, would be desirable. Moreover, improvements on the presentation of the results can also be made using more simple and sophisticated screens.
Finally, as an educational tool, in addition to the quantitative assessments with their explanation and guidance, other possibilities can be added, e.g., visualizations (presentation of graphs), qualitative feedback on design patterns, integration with teaching material, case studies, and examples. SQMetrics could be improved to emphasize the importance of interpreting and applying these metrics effectively, as well as encouraging students’ critical thinking and qualitative assessment of software design.
8. Conclusions
Currently, the scientific community has not yet established a universally accepted and comprehensive methodology for assessing software quality. Instead, numerous widely adopted quality models, including C&K and B&D, have been suggested. Among these models, the C&K approach stands out as the preferred choice among scholars and researchers, particularly for object-oriented programming. Of course, the calculations for several metrics are eligible to several adaptations, according to the users’ needs. Measurements show that, for the same software system and metrics, the metrics values are tool-dependent.
The proposed SQMetrics tool is open-source, portable, accessible to inexperienced users, and provides a simple and fully functional GUI. It provides the user with options that support different approaches for calculating certain metrics. It focuses on C&K and B&D (QMOOD) models and is the only one that fully supports them. Especially for the QMOOD model, in addition to the computation of the third-level metrics, all six quality characteristics of the first level are also calculated. SQMetrics’ full support of the high-level quality features of the QMOOD model allows for the comparison between different versions of the same project or even the comparison between different software applications. These features are not present in the other tools in this study.
In our study, the comparison of the measurements for a specific Java project between SQMetrics and four similar tools has revealed deviations, ranging from small to very large, as a result of the differences in the computation logic adopted by each tool for the respective metrics.
Moreover, the tool proved to be useful for comparing different versions of the same project in terms of high-level features and overall quality metrics. In this case, the developer can check if there is the desired increase in overall quality in the latest versions, as well as the intended increase in individual features, and take the appropriate actions in order to improve the indices and, by extension, software quality. Finally, SQMetrics provides the means to compare different projects in terms of design properties or even overall quality. This could be useful in cases of projects with similar functionality, or projects of the same development team, in order to compare the quality features and lead to better software design and implementation practices.
The results of the SUS questionnaire suggest that the SQMetric tool has good usability, although some areas for improvement were identified. The findings of this study can inform the design and development of the tool to improve its usability and enhance user satisfaction. Further research could explore the factors influencing the usability of the tool and investigate the effectiveness of different design approaches, especially for educational purposes.
The results of our custom-made questionnaire suggest that the participants generally had positive attitudes toward the questions asked. However, some questions had lower mean scores than others, indicating areas for potential improvement. The findings of this study can inform future research and help improve specific areas of the project (e.g., metrics configuration, users’ loyalty, and tool limitations).
In conclusion, the tool proves to be useful and functional for the academic community, as it can be used by students and professors in software technology courses. Unlike other sophisticated commercial tools, it proves to be simple to use, free, and able to provide a quantitative measure of the overall code quality. The utilization of software quality metrics can aid students in recognizing their weak points, monitoring their progress, and receiving constructive feedback from their instructors. It can also develop students’ critical thinking and comprehension of object-oriented concepts by enhancing their Java code quality.

 ,
, 


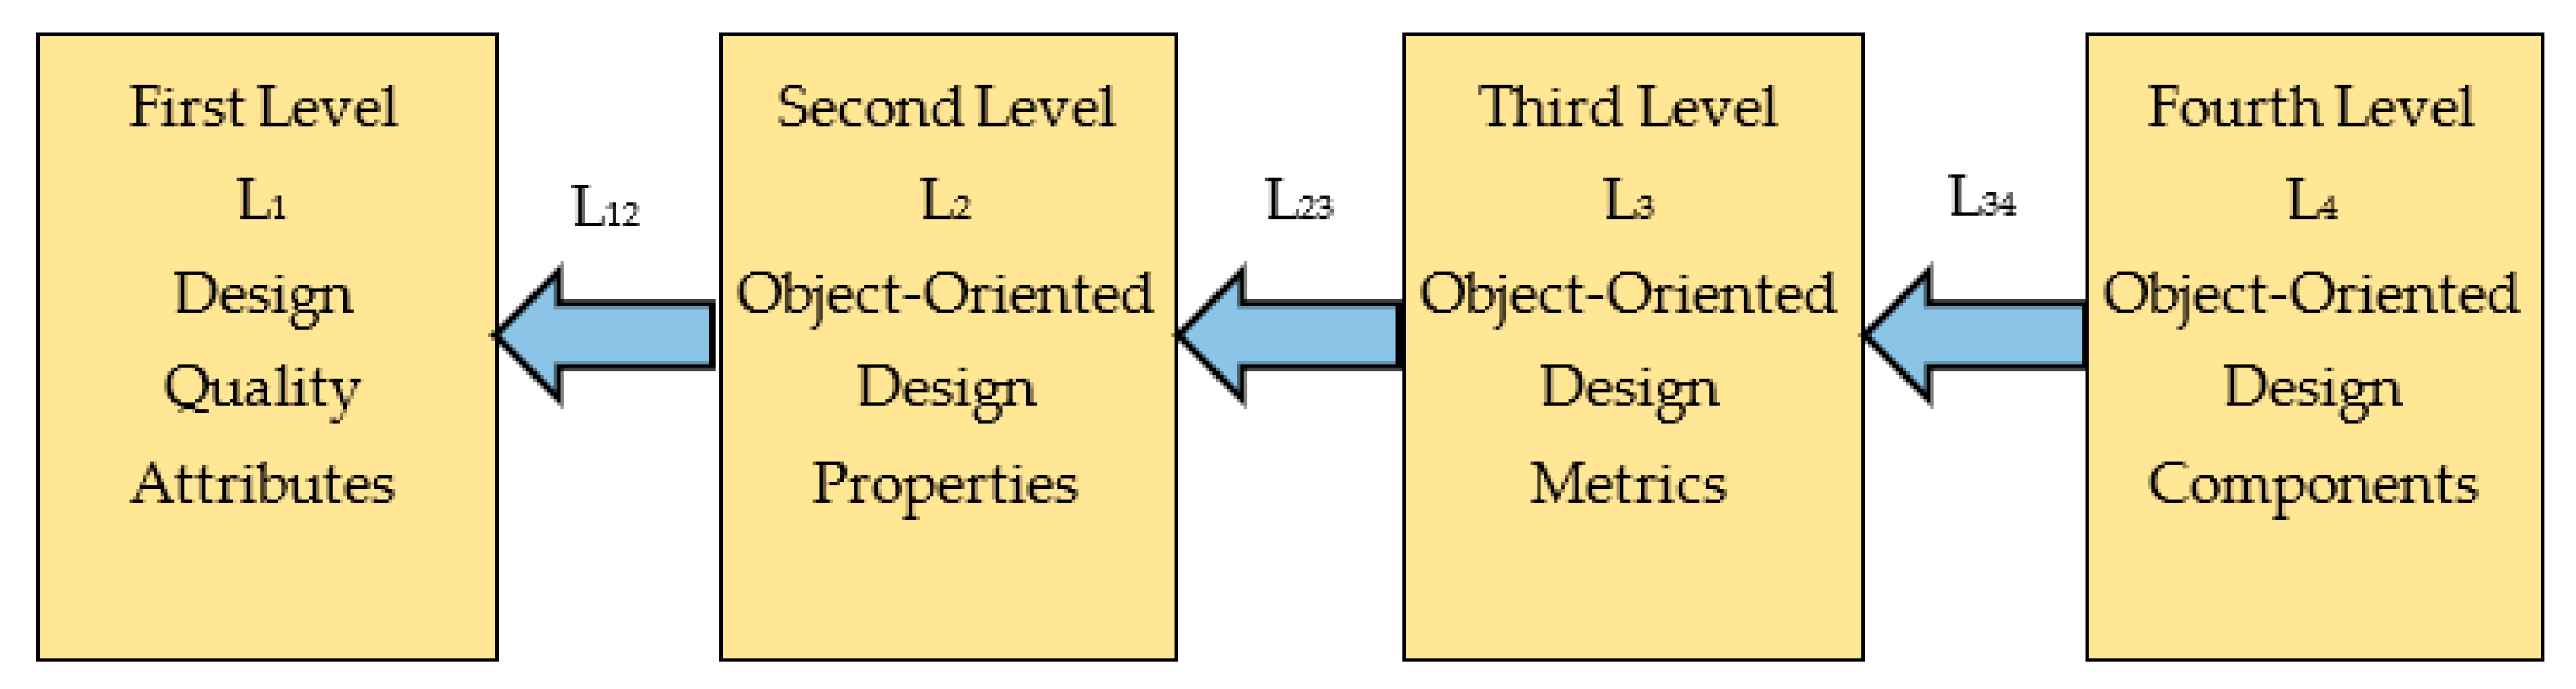
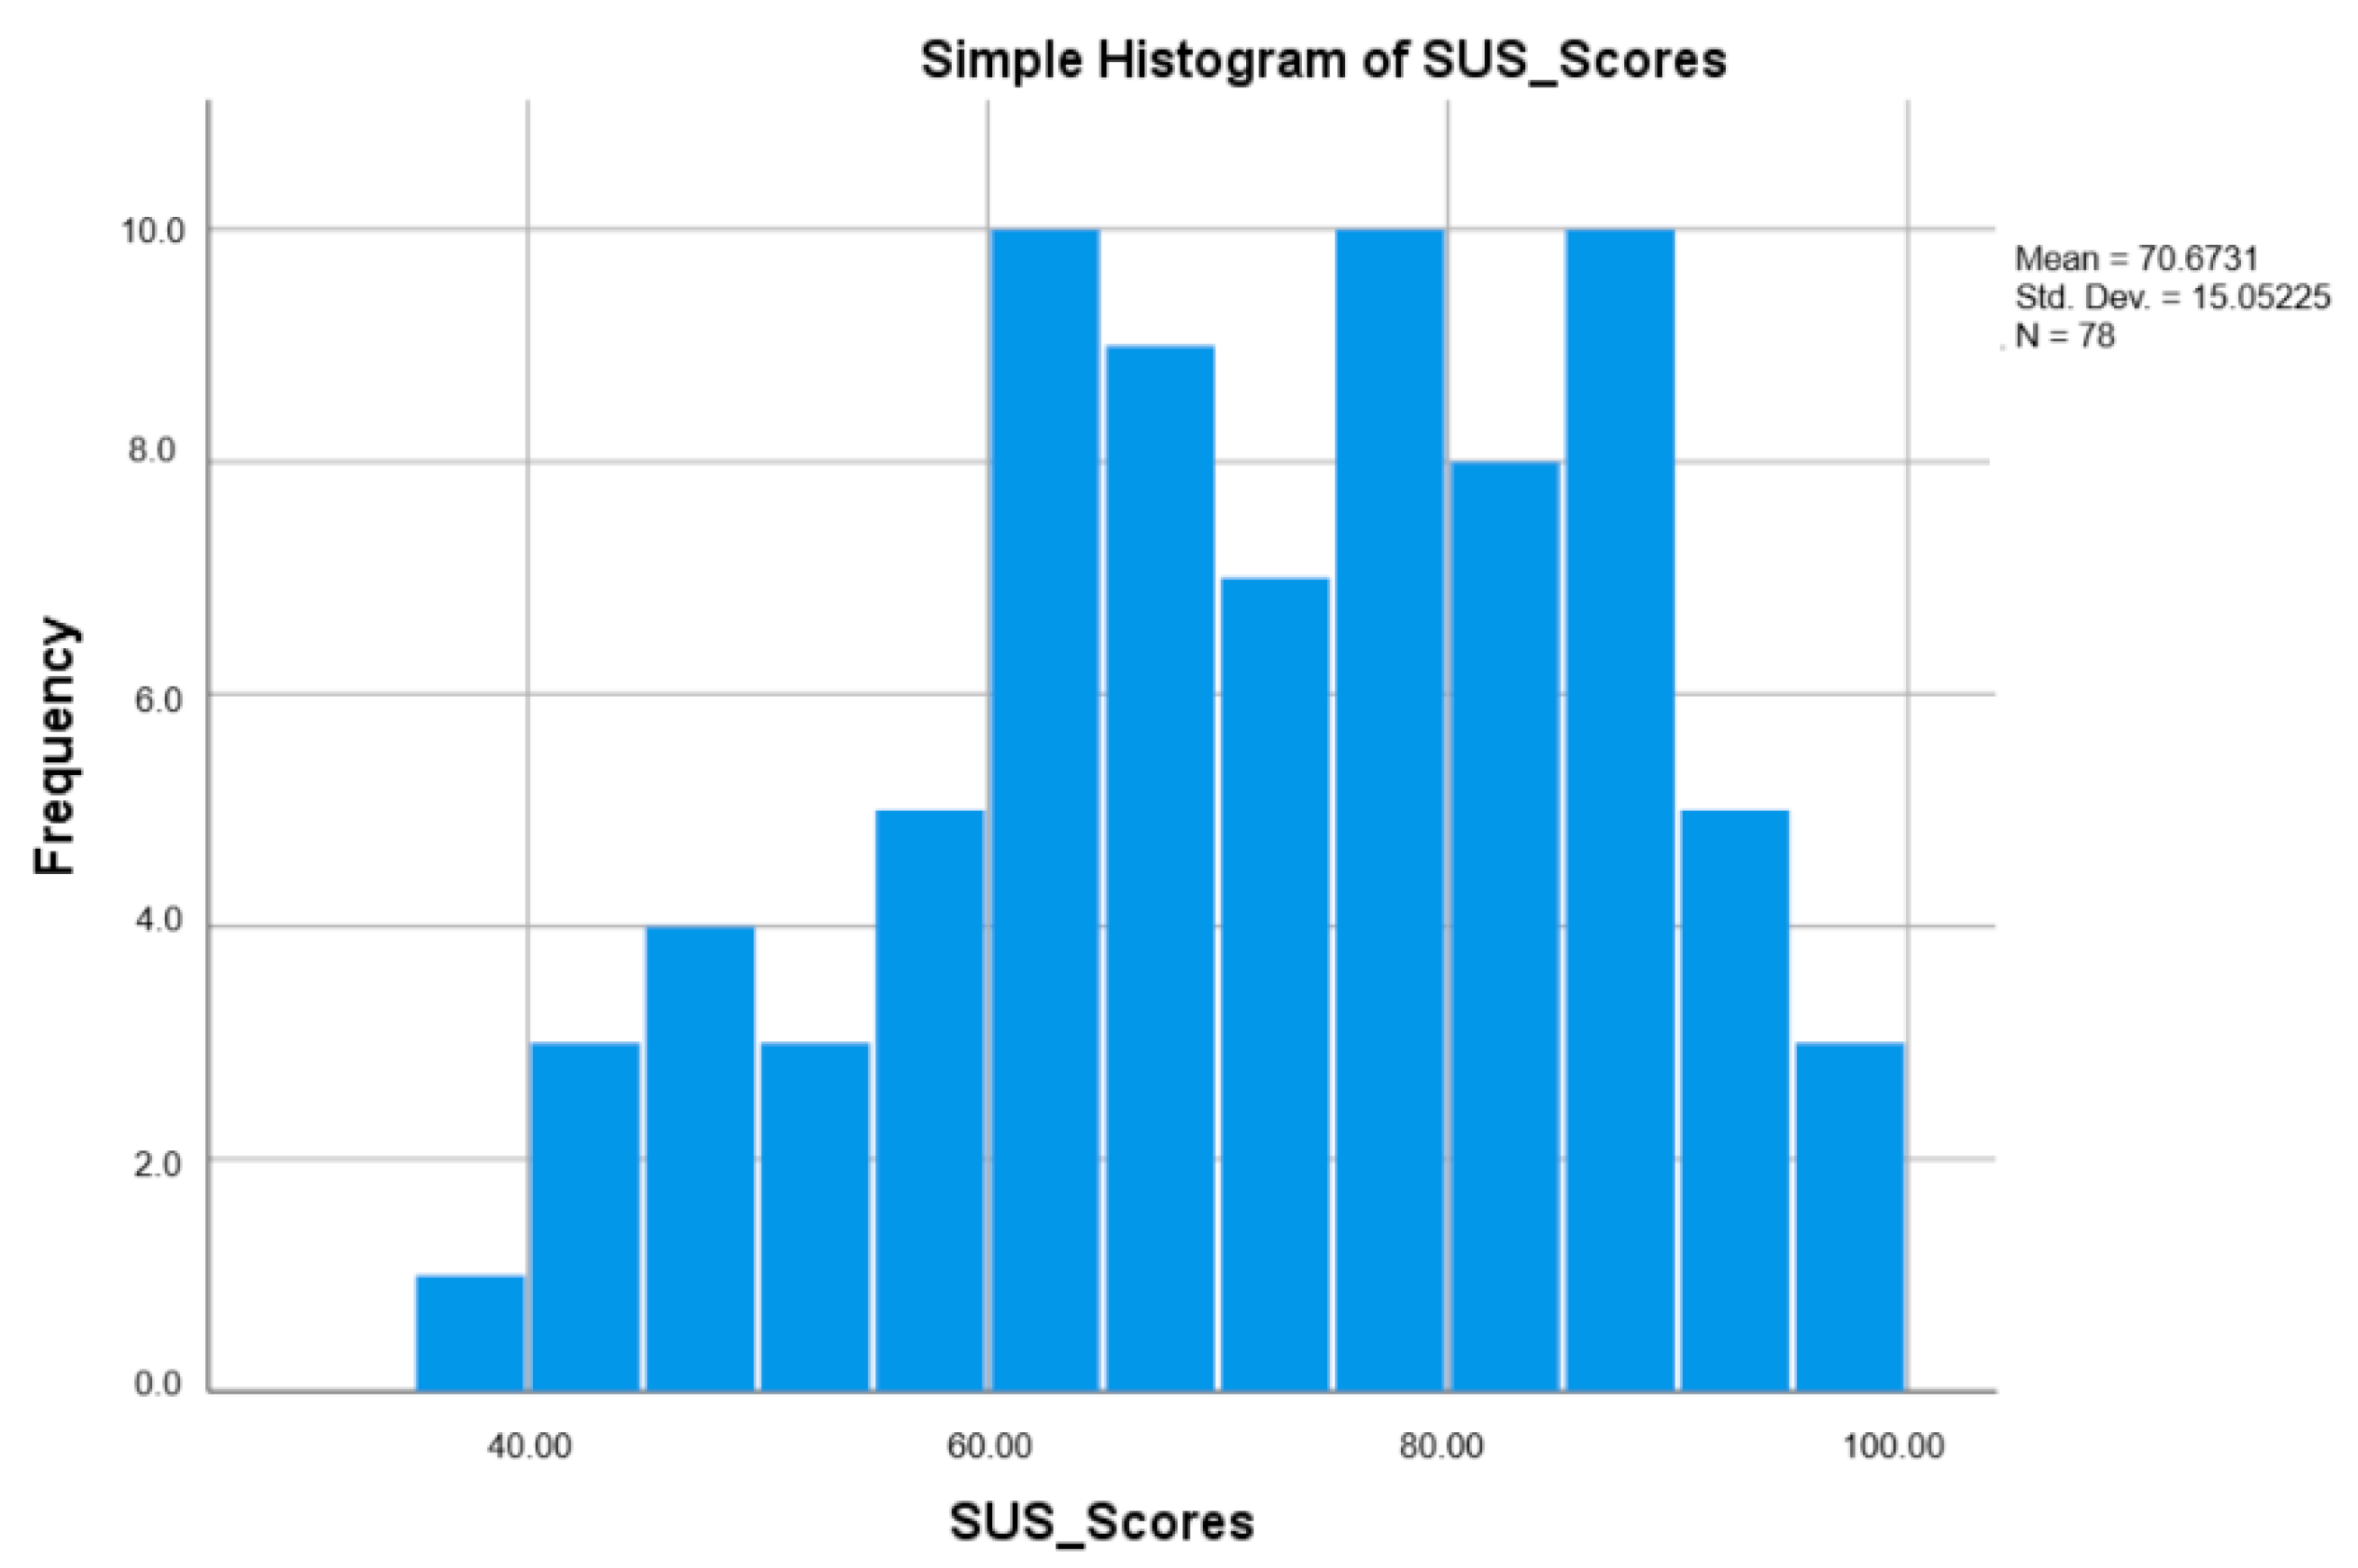


