
Social Media Analytics and Metrics for Improving Users Engagement


Abstract
1. Introduction
2. Related Background
2.1. Conceptualizing Social Media Analytics and Metrics—An Overall Point of View
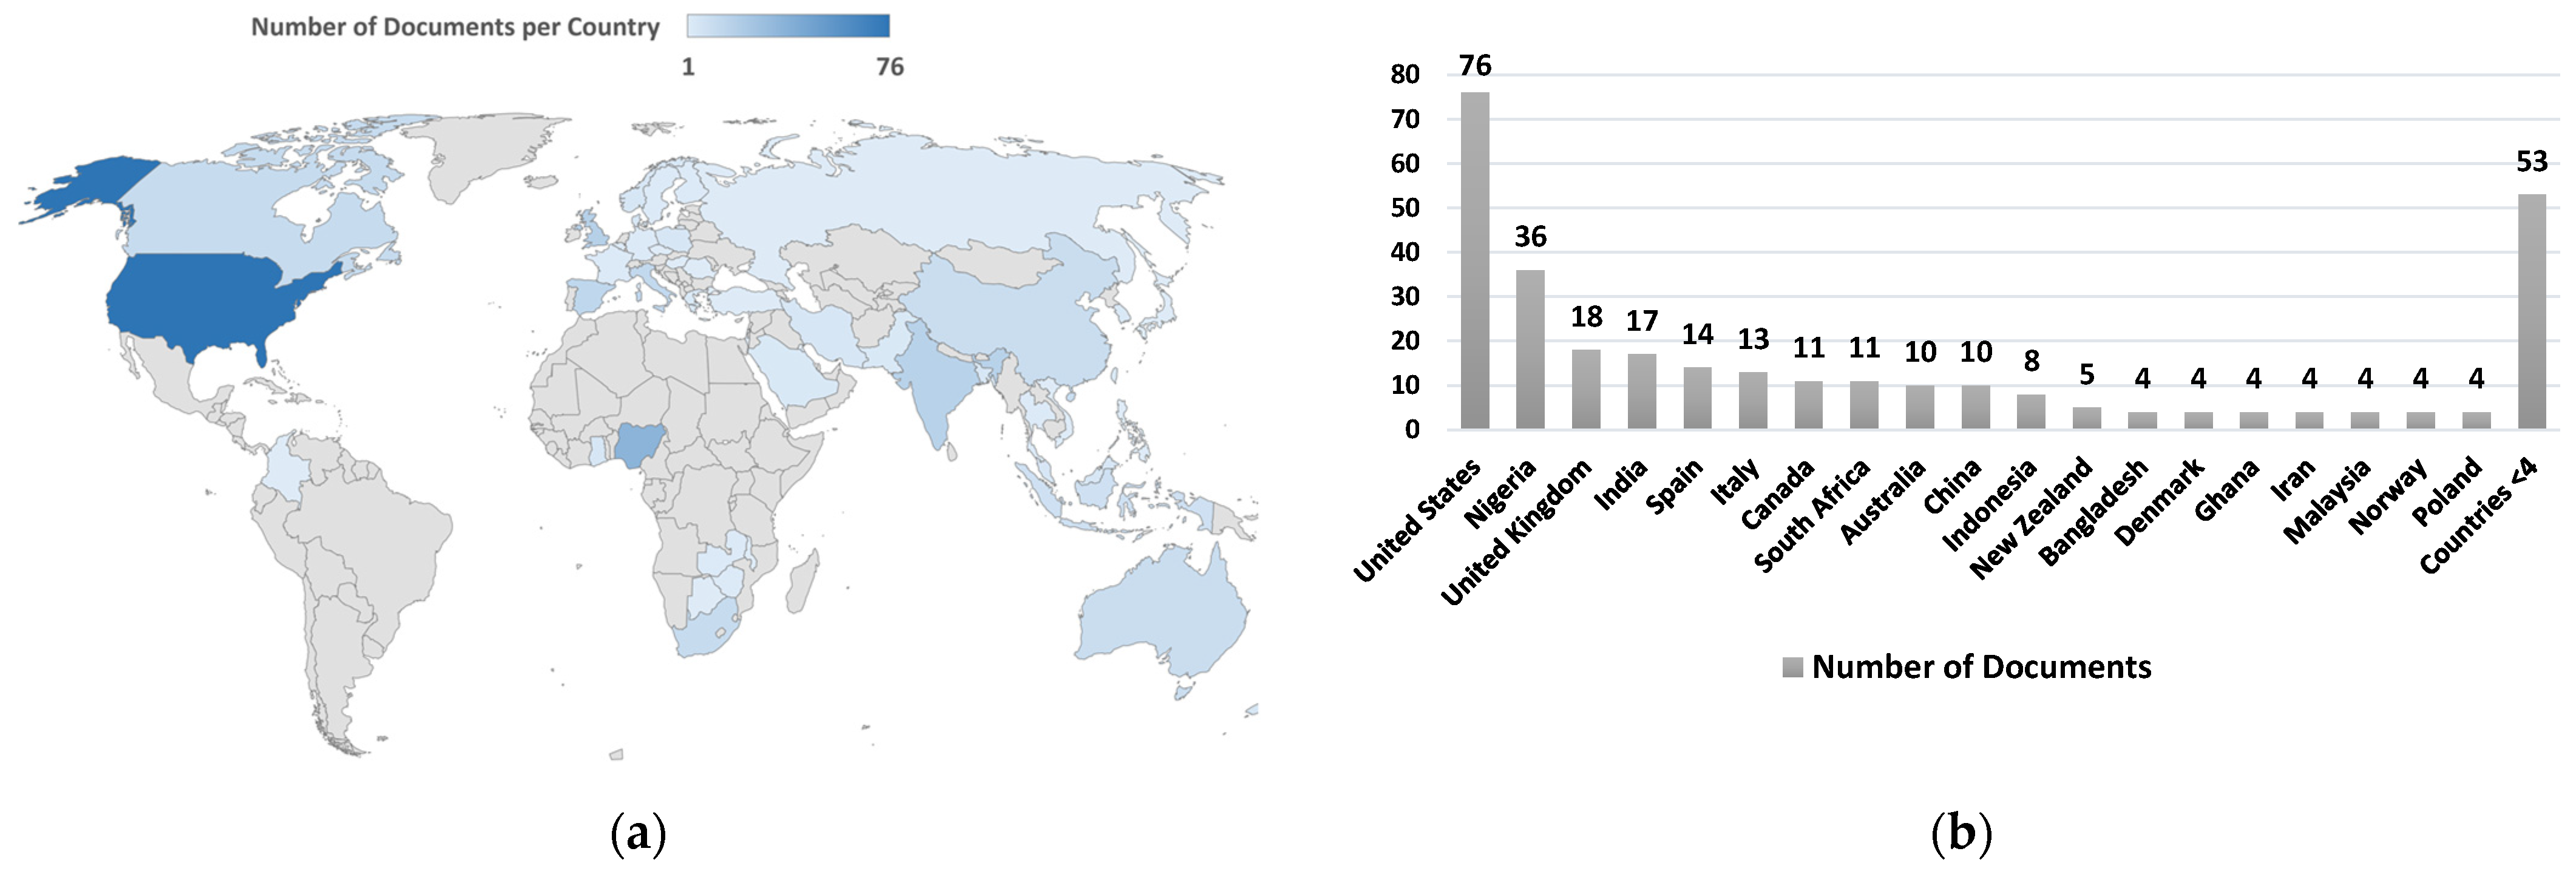
2.2. Importance of Social Media Platforms and Analytics for LAMs—A Scientometrics Analysis
2.3. Prior Efforts and Research Gaps
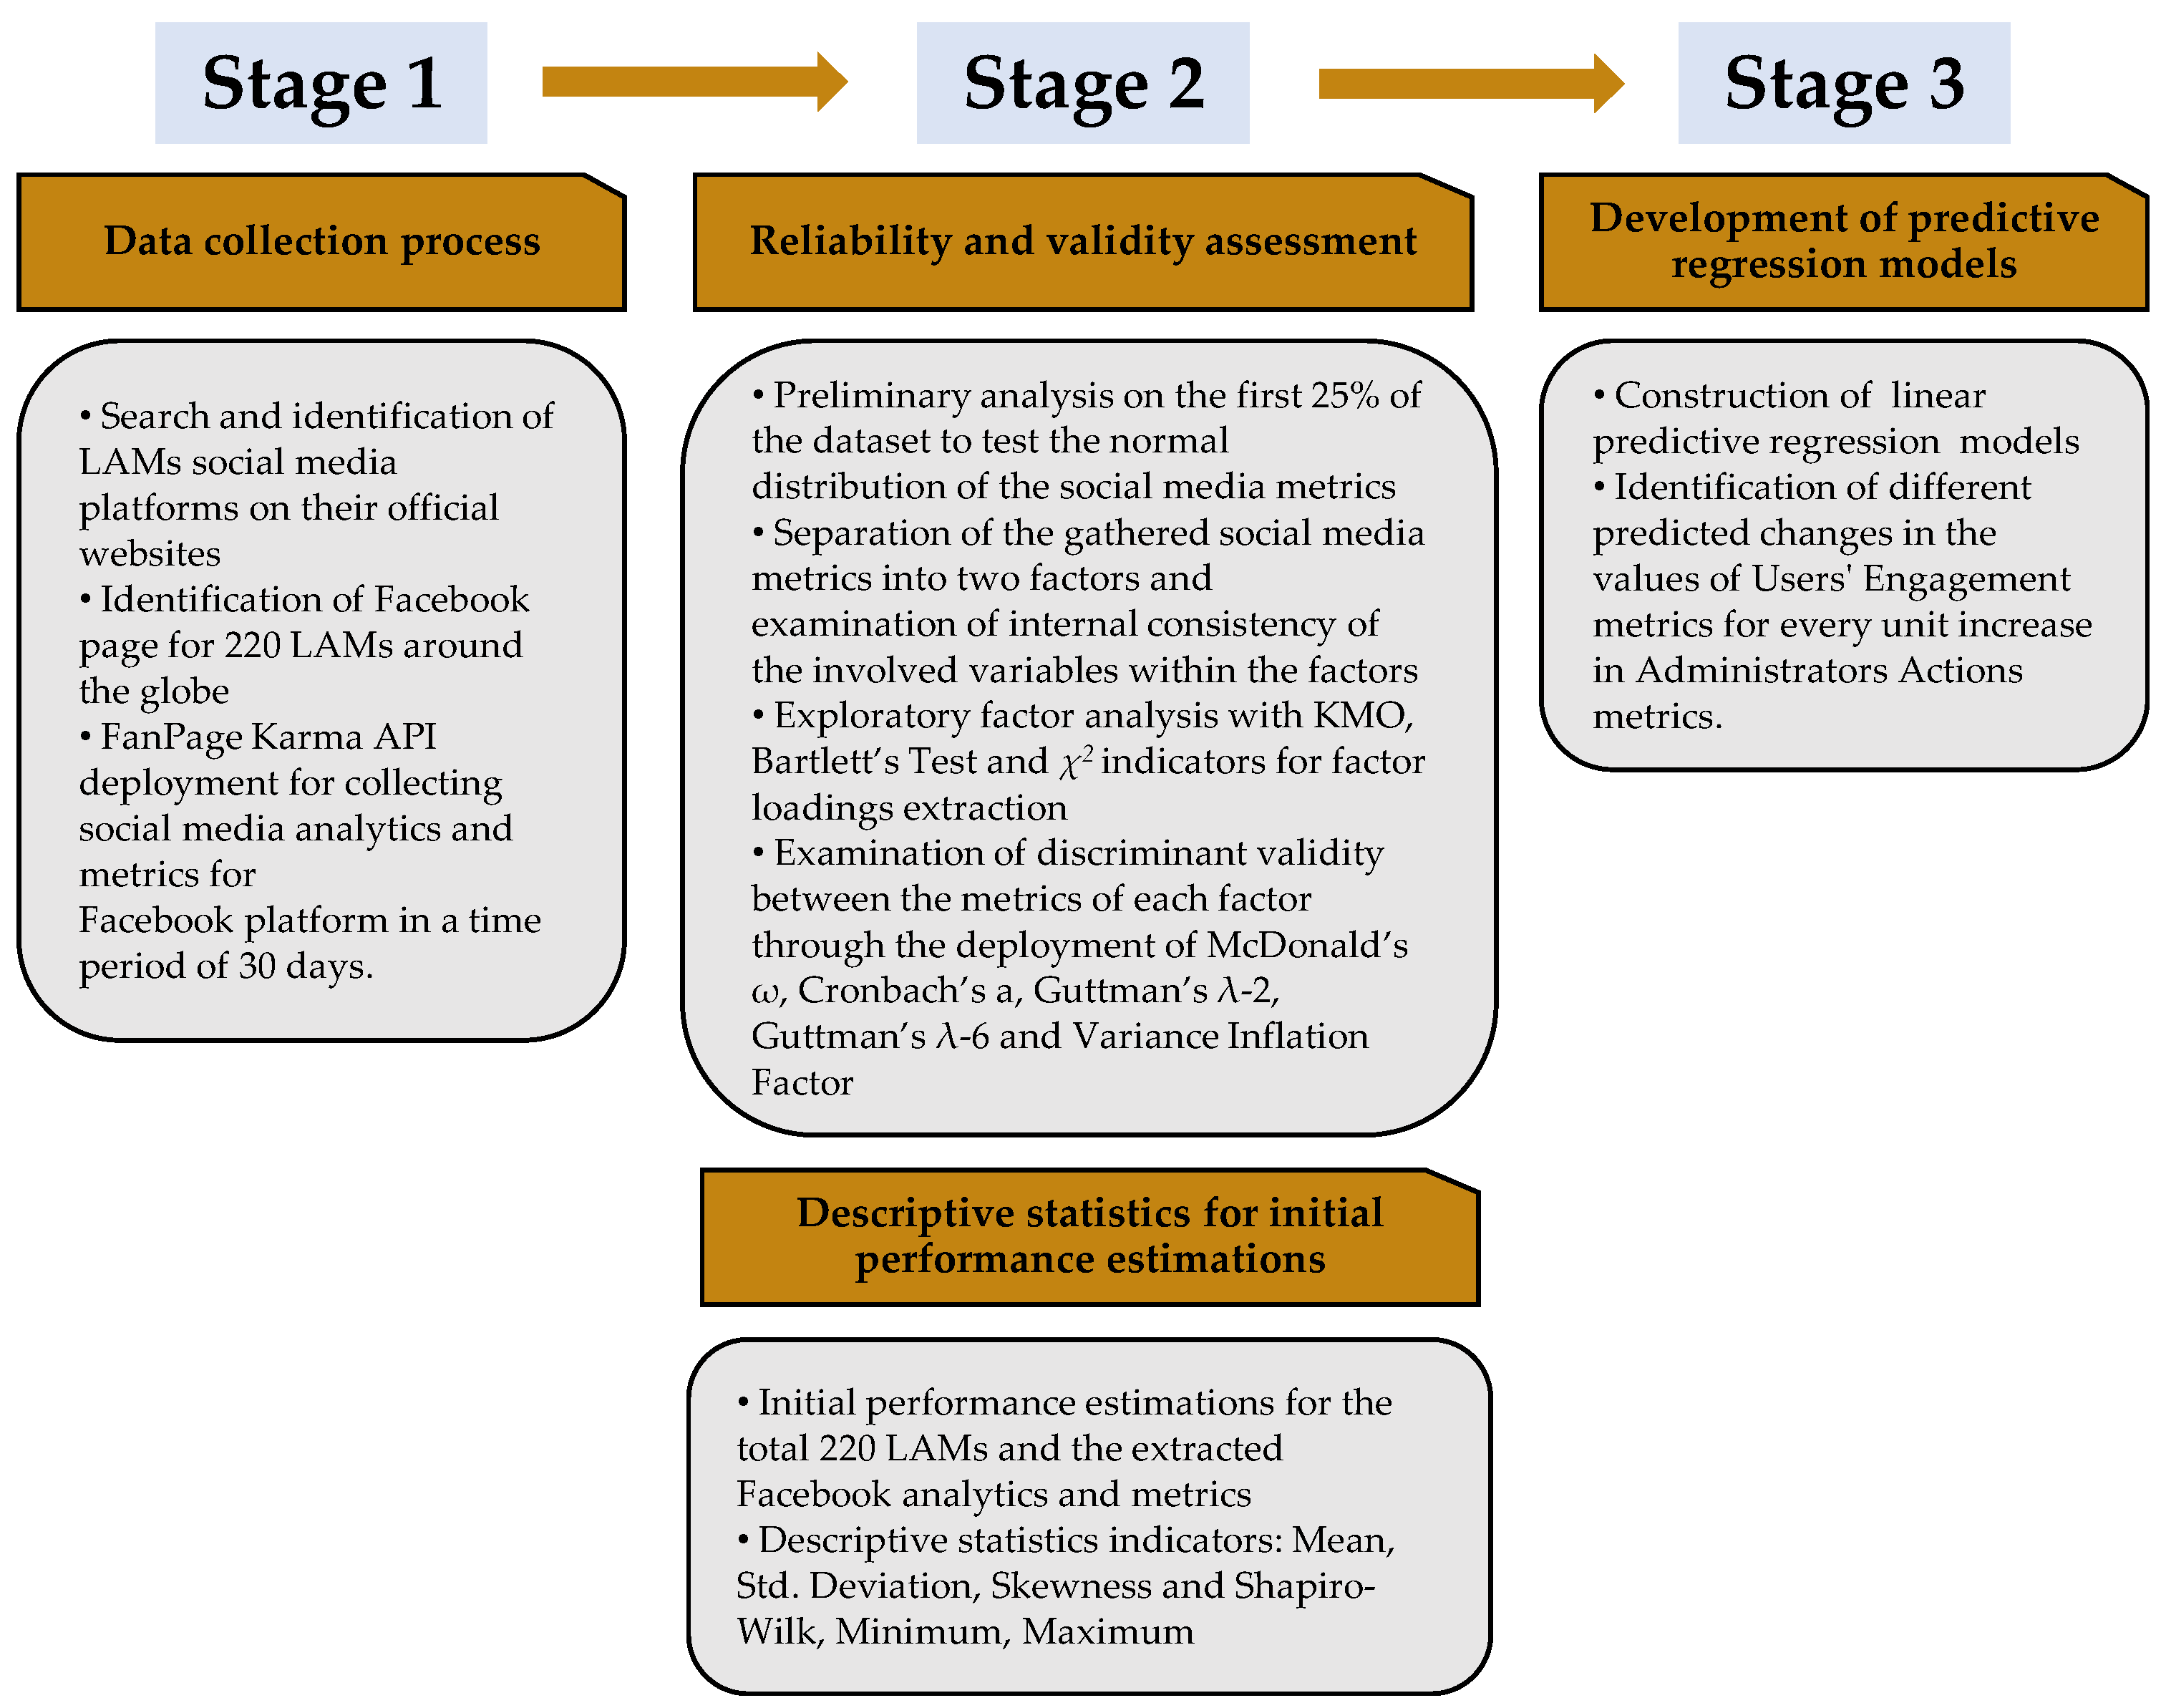
3. Methodology
3.1. Data Collection and Sample
3.2. Validity and Reliability Assessment
3.3. Predictive Regression Models
4. Results
4.1. Validation of the Proposed Factors
4.2. Descriptive Data Summarization for Initial Performance Estimations
4.3. Predictive Regressions Results
5. Discussion
5.1. Practical-Managerial Implications
5.2. Theoretical Implications
5.3. Limitations and Future Work
Author Contributions
Funding
Institutional Review Board Statement
Informed Consent Statement
Data Availability Statement
Conflicts of Interest
References
- W3C. A Standards-Based, Open and Privacy-Aware Social Web. W3C, 2010. Available online: https://www.w3.org/2005/Incubator/socialweb/XGR-socialweb-20101206/ (accessed on 11 March 2022).
- Department, Statista Research. Number of Social Network Users Worldwide from 2017 to 2025. Statista. Available online: https://www.statista.com/statistics/278414/number-of-worldwide-social-network-users/ (accessed on 11 March 2022).
- Cheng, W.W.H.; Lam, E.T.H.; Chiu, D.K.W. Social Media as a Platform in Academic Library Marketing: A Comparative Study. J. Acad. Libr. 2020, 46, 102188. [Google Scholar] [CrossRef]
- Fong, K.C.H.; Au, C.H.; Lam, E.T.H.; Chiu, D.K.W. Social Network Services for Academic Libraries: A Study Based on Social Capital and Social Proof. J. Acad. Librariansh. 2020, 46, 102091. [Google Scholar] [CrossRef]
- Choi, N.; Joo, S. Understanding Public Libraries’ Challenges, Motivators, and Perceptions toward the Use of Social Media for Marketing. Libr. Hi Tech. 2018, 39, 352–367. [Google Scholar] [CrossRef]
- Al-Daihani, M.S.; Abrahams, A. Analysis of Academic Libraries’ Facebook Posts: Text and Data Analytics. J. Acad. Librariansh. 2018, 44, 216–225. [Google Scholar] [CrossRef]
- Bountouri, L.; Giannakopoulos, G. The Use of Social Media in Archives. Procedia-Soc. Behav. Sci. 2014, 147, 510–517. [Google Scholar] [CrossRef][Green Version]
- Garoufallou, E.; Siatri, R.; Zafeiriou, G.; Balampanidou, E. The Use of Marketing Concepts in Library Services: A Literature Review. Libr. Rev. 2013, 62, 312–334. [Google Scholar] [CrossRef]
- Langa, L.A. Does Twitter Help Museums Engage with Visitors? In Proceedings of the iConference 2014, Berlin, Germany, 4–7 March 2014. [Google Scholar] [CrossRef]
- Mensah, M.; Onyancha, O.B. Building and Enhancing Library Services: Patrons’ Awareness of, and Engagement with Social Media in Academic Libraries in Ghana. J. Librariansh. Inf. Sci. 2021, 1–18. [Google Scholar] [CrossRef]
- Han, L.; Shen, Y. Design of Social Media User Satisfaction Evaluation System from the Perspective of Big Data Services. In Proceedings of the 2021 International Conference on Big Data Analysis and Computer Science (BDACS), Kunming, China, 25–27 June 2021. [Google Scholar] [CrossRef]
- Prado, C.; Javier, F.; García-Reyes, M.C.J. Social Media and Library Metrics and Indicators: How Can We Measure Impact on Performance? In Proceedings of the 17th Conference of the International Society for Scientometrics and Informetrics ISSI2019, Rome, Italy, 2–5 September 2019; Available online: https://e-archivo.uc3m.es/handle/10016/31448 (accessed on 11 March 2022).
- Drivas, I.C.; Sakas, D.P.; Giannakopoulos, G.A.; Kyriaki-Manessi, D. Big Data Analytics for Search Engine Optimization. Big Data Cogn. Comput. 2020, 4, 5. [Google Scholar] [CrossRef]
- Kaplan, A.M.; Haenlein, M. Users of the World, Unite! The Challenges and Opportunities of Social Media. Bus. Horiz. 2010, 53, 59–68. [Google Scholar] [CrossRef]
- Yang, M.; Kiang, M.; Ku, Y.; Chiu, C.; Li, Y. Social Media Analytics for Radical Opinion Mining in Hate Group Web Forums. J. Homel. Secur. Emerg. Manag. 2011, 8. [Google Scholar] [CrossRef]
- Zeng, D.; Chen, H.; Lusch, R.; Li, S. Social Media Analytics and Intelligence. IEEE Intell. Syst. 2010, 25, 13–16. [Google Scholar] [CrossRef]
- Awareness Inc. Actionable Social Analytics: From Social Media Metrics to Business Insights. 2012. Available online: https://www.cbpp.uaa.alaska.edu/afef/Actionable-Social-Analytics.pdf (accessed on 29 April 2022).
- Misirlis, N.; Vlachopoulou, M. Social Media Metrics and Analytics in Marketing–S3m: A Mapping Literature Review. Int. J. Inf. Manag. 2018, 38, 270–276. [Google Scholar] [CrossRef]
- Bowden, J.L. The Process of Customer Engagement: A Conceptual Framework. J. Mark. Theory Pract. 2009, 17, 63–74. [Google Scholar] [CrossRef]
- Barger, V.; Peltier, J.W.; Schultz, D.E. Social Media and Consumer Engagement: A Review and Research Agenda. J. Interact. Mark. 2016, 10, 268–287. [Google Scholar] [CrossRef]
- van Doorn, J.; Lemon, K.N.; Mittal, V.; Nass, S.; Pick, D.; Pirner, P.; Verhoef, P.C. Customer Engagement Behavior: Theoretical Foundations and Research Directions. J. Serv. Res. 2010, 13, 253–266. [Google Scholar] [CrossRef]
- Trunfio, M.; Rossi, S. Conceptualizing and Measuring Social Media Engagement: A Systematic Literature Review. J. Mark. 2021, 2021, 267–292. [Google Scholar] [CrossRef]
- Hallock, W.; Roggeveen, A.L.; Crittenden, V. Firm-Level Perspectives on Social Media Engagement: An Exploratory Study. Qual. Mark. Res. 2019, 22, 217–226. [Google Scholar] [CrossRef]
- Le, T.D. Influence of Wom and Content Type on Online Engagement in Consumption Communities. Online Inf. Rev. 2018, 42, 161–175. [Google Scholar] [CrossRef]
- Schee, V.A.B.; Peltier, J.; Dahl, A.J. Antecedent Consumer Factors, Consequential Branding Outcomes and Measures of Online Consumer Engagement: Current Research and Future Directions. J. Serv. Res. 2020, 14, 239–268. [Google Scholar] [CrossRef]
- Cervone, H.F. Evaluating Social Media Presence. Digit. Libr. Perspect. 2017, 33, 2–7. [Google Scholar] [CrossRef]
- Jones, M.J.; Harvey, M. Library 2.0: The Effectiveness of Social Media as a Marketing Tool for Libraries in Educational Institutions. J. Librariansh. Inf. Sci. 2019, 51, 3–19. [Google Scholar] [CrossRef]
- Pozas, A.C. Evaluando Los Medios Sociales De La Biblioteca Nacional De España: Métricas E Indicator’s. Available online: https://perma.cc/96KZ-SPW6 (accessed on 11 March 2022).
- González Fernández-Villavicencio, N. Bibliotecas, Medios Y Métricas De La Web Social. An. Doc. 2016, 19. [Google Scholar] [CrossRef]
- Gerrard, D.; Sykora, M.; Jackson, T. Social Media Analytics in Museums: Extracting Expressions of Inspiration. Mus. Manag. Curatorship 2017, 32, 232–250. [Google Scholar] [CrossRef]
- Villaespesa, E. Diving into the Museum’s Social Media Stream. Analysis of the Visitor Experience in 140 Characters. In Proceedings of the Museums and the Web 2013 Conference, Portland, OR, USA, 17–20 April 2013; Available online: https://www.researchgate.net/publication/334285940_Diving_into_the_museum’s_social_media_stream_Analysis_of_the_visitor_experience_In_140_characters (accessed on 11 March 2022).
- Lê, J.T. #Fashionlibrarianship: A Case Study on the Use of Instagram in a Specialized Museum Library Collection. Art Doc. 2019, 38, 279–304. [Google Scholar] [CrossRef]
- Boulton, S. Social Engagement and Institutional Repositories: A Case Study. Insights UKSG J. 2020, 33. [Google Scholar] [CrossRef]
- Magier, D. Archives at the Time of Lockdown. Activity in Social Media Based on the Example of the State Archives in Siedlce between March 2020 and March 2021 (a Research Report). Hist. Świat 2021, 10, 454–459. [Google Scholar] [CrossRef]
- Melchers, R.E.; Beck, A.T. Structural Reliability Analysis and Prediction; John Wiley & Sons: Hoboken, NJ, USA, 2018. [Google Scholar]
- Aven, T. Improving the Foundation and Practice of Reliability Engineering. Proc. Inst. Mech. Eng. Part O J. Risk Reliab. 2017, 231, 295–305. [Google Scholar] [CrossRef]
- Drivas, I.; Kouis, D.; Kyriaki-Manessi, D.; Giannakopoulos, G. Content Management Systems Performance and Compliance Assessment Based on a Data-Driven Search Engine Optimization Methodology. Information 2021, 12, 259. [Google Scholar] [CrossRef]
- Huertas, A.; Marine-Roig, E. User Reactions to Destination Brand Contents in Social Media. Inf. Technol. Tour. 2016, 15, 291–315. [Google Scholar] [CrossRef]
- Manca, S. Digital Memory in the Post-Witness Era: How Holocaust Museums Use Social Media as New Memory Ecologies. Information 2021, 12, 31. [Google Scholar] [CrossRef]
- Cassidy, E.D.; Colmenares, A.; Jones, G.; Manolovitz, T.; Shen, L.; Vieira, S. Higher Education and Emerging Technologies: Shifting Trends in Student Usage. J. Acad. Librariansh. 2014, 40, 124–133. [Google Scholar] [CrossRef]
- Okoroma, F.N. Use of Social Media for Modern Reference Service Delivery in Academic Libraries in Nigeria. Int. J. Asian Soc. Sci. 2018, 8, 518–527. [Google Scholar] [CrossRef]
- Fissi, S.; Gori, E.; Romolini, A.; Contri, M. Stakeholder Engagement: Verso Un Utilizzo Dei Social Media Nei Musei Italiani? Manag. Control 2019, 145–160. [Google Scholar] [CrossRef]
- Camarero, C.; Garrido, M.; Jose, R.S. What Works in Facebook Content Versus Relational Communication: A Study of Their Effectiveness in the Context of Museums. Int. J. Hum.-Comput. Interact. 2018, 34, 1119–1134. [Google Scholar] [CrossRef]
- Mukwevho, J.; Ngoepe, M. Taking Archives to the People. Libr. Hi Tech. 2019, 37, 374–388. [Google Scholar] [CrossRef]
- Tkacová, H.; Králik, R.; Tvrdoň, M.; Jenisová, Z.; Martin, J.G. Credibility and Involvement of Social Media in Education—Recommendations for Mitigating the Negative Effects of the Pandemic among High School Students. Int. J. Environ. Res. Public Health 2022, 19, 2767. [Google Scholar] [CrossRef] [PubMed]
- Dziuban, C.D.; Shirkey, E.C. When Is a Correlation Matrix Appropriate for Factor Analysis? Some Decision Rules. Psychol. Bull. 1974, 81, 358–361. [Google Scholar] [CrossRef]
- Schmidt, A.F.; Finan, C. Linear Regression and the Normality Assumption. J. Clin. Epidemiol. 2018, 98, 146–151. [Google Scholar] [CrossRef]
- Razali, N.M.; Wah, Y.B. Power Comparisons of Shapiro-Wilk, Kolmogorov-Smirnov, Lilliefors and Anderson-Darling Tests. J. Stat. Mod. Anal. 2011, 2, 21–33. Available online: https://www.nrc.gov/docs/ML1714/ML17143A100.pdf (accessed on 17 March 2022).
- Von, H.; Paul, T. Mean, Median, and Skew: Correcting a Textbook Rule. J. Educ. Stat. 2005, 13. [Google Scholar] [CrossRef]
- Crede, M.; Harms, P. Questionable Research Practices When Using Confirmatory Factor Analysis. J. Manag. Psychol. 2019, 34, 18–30. [Google Scholar] [CrossRef]
- Hayes, A.F.; Coutts, J.J. Use Omega Rather Than Cronbach’s Alpha for Estimating Reliability. But…. Commun. Methods Meas. 2020, 14, 1–24. [Google Scholar] [CrossRef]
- Ursachi, G.; Horodnic, I.A.; Zait, A. How Reliable Are Measurement Scales? External Factors with Indirect Influence on Reliability Estimators. Procedia Econ. Fin. 2015, 20, 679–686. [Google Scholar] [CrossRef]
- Callender, J.C.; Osburn, H.G. An Empirical Comparison of Coefficient Alpha, Guttman’s Lambda-2, and Msplit Maximized Split-Half Reliability Estimates. J. Educ. Meas. 1979, 16, 89–99. [Google Scholar] [CrossRef]
- Revelle, W. Hierarchical Cluster Analysis and the Internal Structure of Tests. Multivar. Behav. Res. 1979, 14, 57–74. [Google Scholar] [CrossRef]
- Petter, S.; Straub, D.; Rai, A. Specifying Formative Constructs in Information Systems Research. MIS Q. 2007, 31, 623–656. [Google Scholar] [CrossRef]
- Diamantopoulos, A.; Siguaw, J.A. Formative Versus Reflective Indicators in Organizational Measure Development: A Comparison and Empirical Illustration. Br. J. Manag. 2006, 17, 263–282. [Google Scholar] [CrossRef]
- Bedeian, A.G.; Mossholder, K.W. Simple Question, Not So Simple Answer: Interpreting Interaction Terms in Moderated Multiple Regression. J. Manag. 1994, 20, 159–165. [Google Scholar] [CrossRef]
- Dankowski, T. How Libraries Are Using Social Media. Am. Libr. 2013, 44, 38–41. Available online: https://www.jstor.org/stable/24602212 (accessed on 11 March 2022).
- Stieglitz, S.; Mirbabaie, M.; Ross, B.; Neuberger, C. Social Media Analytics–Challenges in Topic Discovery, Data Collection, and Data Preparation. Int. J. Inf. Manag. 2018, 39, 156–168. [Google Scholar] [CrossRef]
- Eurostat; European Union. Culture Statistics-2019 Edition; European Union: Luxembourg, 2019. [CrossRef]
- Eurostat Statistics Explained. Government Expenditure on Cultural, Broadcasting and Publishing Services. Available online: https://ec.europa.eu/eurostat/statistics-explained/index.php?title=Culture_statistics_-_government_expenditure_on_cultural,_broadcasting_and_publishing_services&oldid=554580 (accessed on 11 March 2022).
- Krstić, N.; Masliković, D. Pain Points of Cultural Institutions in Search Visibility: The Case of Serbia. Libr. Hi Tech 2019, 37, 496–512. [Google Scholar] [CrossRef]
- Järvinen, J.; Karjaluoto, H. The Use of Web Analytics for Digital Marketing Performance Measurement. Ind. Mark. Manag. 2015, 50, 117–127. [Google Scholar] [CrossRef]
- Voorbij, H. The Use of Web Statistics in Cultural Heritage Institutions. Perform. Meas. Metr. 2010, 11, 266–279. [Google Scholar] [CrossRef]
- Grover, V.; Chiang, R.H.L.; Liang, T.; Zhang, D. Creating Strategic Business Value from Big Data Analytics: A Research Framework. Manag. Inf. Syst. 2018, 35, 388–423. [Google Scholar] [CrossRef]
- Sheldon, P.; Herzfeldt, E.; Rauschnabel, P.A. Culture and Social Media: The Relationship between Cultural Values and Hashtagging Styles. Behav. Inf. Technol. 2020, 39, 758–770. [Google Scholar] [CrossRef]
- Lykourentzou, I.; Antoniou, A. Digital Innovation for Cultural Heritage: Lessons from the European Year of Cultural Heritage. SCIRES-IT 2019, 9, 91–98. [Google Scholar] [CrossRef]
- Anyim, W.O. Identifying Gaps and Opportunities to Improve Performance in University Libraries Using Benchmarking and Performance Appraisal System. Libr. Philos. Pract. 2021, 5066. Available online: https://digitalcommons.unl.edu/libphilprac/5066 (accessed on 11 April 2022).
- Rzheuskiy, A.; Kunanets, N.; Kut, V. The Analysis of the United States of America Universities Library Information Services with Benchmarking and Pairwise Comparisons Methods. In Proceedings of the 12th International Scientific and Technical Conference on Computer Sciences and Information Technologies (CSIT), Lviv, Ukraine, 5–8 September 2017. [Google Scholar] [CrossRef]
- Bhama, V.S.; Srividhya, S. Benchmarking for Quality Improvement in Academic Libraries: A Study with Special Reference to Bangalore City College Libraries. Int. J. Econ. Res. 2015, 12, 775–785. [Google Scholar]
- Leppink, J.; Perez-Fuster, P. We Need More Replication Research-a Case for Test-Retest Reliability. Perspect. Med. Educ. 2017, 6, 158–164. [Google Scholar] [CrossRef]
- Persson, S.; Svenningsson, M. Librarians as Advocates of Social Media for Researchers: A Social Media Project Initiated by Linköping University Library, Sweden. New Rev. Acad. Libr. 2016, 22, 304–314. [Google Scholar] [CrossRef][Green Version]


| Research Context Issues | Contributions |
|---|---|
| There is a need to improve the social media skills of staff for understanding users’ engagement with the uploaded content [3,4,5,6,7,8,9,10]. | Understanding social media analytics and metrics and the possible intercorrelations between them will improve staff skills in providing content that results in higher levels of users’ engagement. |
| The majority of the current studies proceed into individual examinations of how a LAM utilizes SMPs to understand and measure users’ engagement with the published content [28,30,31,32,33,34]. | Further research is needed to provide a holistic approach and consequently a generalization framework on how SMAs could be utilized to increase users’ engagement and expand the awareness of LAMs organizations. This could also work as a benchmarking process for the administrators of the LAMs. |
| Lack of a SMAs methodological framework that exhibits validity, reliability and internal consistency in terms of the included variables that measure LAMs users’ engagement with the published content [35,36]. | Suggest an assessment schema that expresses statistical reliability in its nature. This schema will quantitatively measure users’ engagement within an SMP of a LAM. |
| Metric Name | Metric Description |
|---|---|
| Number of Posts | Number of posts that have been published in a specific period. |
| Link posts | It is the number of posts in URL format that have been published in a specific period. |
| Picture posts | It is the number of posts in picture format that have been published in a specific period. |
| Video Posts | Number of posts in video format that have been published in a specific period. |
| Comments per post | The average number of comments on posts in a specific period. |
| Number of reactions | The total number of (like, love, haha, thankful, wow, sad, angry) on posts that have been published in a specific period. |
| Reactions per Post | The average number of reactions on posts that have been published in a specific period. |
| Number of Comments (total) | It refers to the total number of comments on posts. This includes answers to these comments that have been published in a specific period. |
| Total Reactions, Comments, Shares | It expresses the number of reactions of any type (like, love, haha, thankful, wow, sad and angry), comments and shares on posts that the LAM organization has published in a specific period. |
| Name of LAM | Number of Posts | Link Posts | Picture Posts | Video Posts | Comments per Post | Number of Reactions | Reactions per Post | Number of Comments (Total) | Total Reactions, Comments, Shares |
|---|---|---|---|---|---|---|---|---|---|
| Denver Art Museum | 29 | 3 | 17 | 3 | 2.52 | 1799 | 78.21 | 58 | 2105 |
| National Library of Spain | 19 | 1 | 9 | 5 | 7.25 | 3940 | 246.25 | 116 | 5512 |
| National Archives of Georgia | 34 | 3 | 22 | 6 | 1.22 | 1847 | 59.58 | 38 | 2242 |
| Administrators Actions | Users Engagement | ||
|---|---|---|---|
| Variables | Variable Loading | Variable | Variable Loading |
| Number of posts | 0.767 | Comments per post | 0.706 |
| Link posts | 0.519 | Number of reactions | 0.727 |
| Picture posts | 0.667 | Reactions per post | 0.690 |
| Video posts | 0.624 | Number of comments (total) | 0.655 |
| Total reactions, comments, shares | 0.751 | ||
| 0.634 * | < 0.001 ** | < 0.001 *** | 0.708 * | < 0.001 ** | < 0.001 *** | ||
| Factors | McDonald’s ω | Cronbach’s α | Guttman’s λ-2 | Guttman’s λ-6 |
|---|---|---|---|---|
| Administrators Actions | 0.967 | 0.748 | 0.847 | 0.917 |
| Followers Engagement | 0.915 | 0.648 | 0.889 | 0.934 |
| Number of Posts | Link-Posts | Picture Posts | Video-Posts | |
|---|---|---|---|---|
| Mean | 27.591 | 3.695 | 19.447 | 4.448 |
| Std. Deviation | 23.498 | 6.069 | 17.448 | 8.498 |
| Skewness | 2.304 | 4.882 | 2.206 | 4.814 |
| Shapiro-Wilk | 0.811 | 0.563 | 0.816 | 0.539 |
| Minimum | 1.000 | 1.000 | 1.000 | 1.000 |
| Maximum | 158.000 | 56.000 | 114.000 | 75.000 |
| N = 220 | p-value of Shapiro–Wilk ≤ 0.001 | ||||
| Comments per Post | Number of Reactions | Reactions per Post | Number of Comments (Total) | Total Reactions, Comments, Shares | |
|---|---|---|---|---|---|
| Mean | 3.562 | 3148.467 | 101.424 | 121.029 | 3890.619 |
| Std. Deviation | 6.278 | 5706.804 | 159.020 | 262.374 | 7155.607 |
| Skewness | 3.506 | 3.127 | 2.964 | 4.143 | 3.147 |
| Shapiro-Wilk | 0.574 | 0.576 | 0.613 | 0.487 | 0.565 |
| Minimum | 1.000 | 1.000 | 1.000 | 1.000 | 1.000 |
| Maximum | 44.429 | 35,424.000 | 871.000 | 2109.000 | 40,991.000 |
| N = 220 | p-value of Shapiro–Wilk ≤ 0.001 | |||||
| Variable | Coefficient | R2 | F | p-Value |
|---|---|---|---|---|
| Constant (Number of Total Reactions, Comments, Shares) Number of Posts | 785.88 122.02 | 0.154 | 38.44 | <0.001 |
| Constant Link Posts | ||||
| Constant Picture posts | 806.75 168.01 | 0.155 | 38.25 | <0.001 |
| Constant Video Posts | 2802.88 454.38 | 0.122 | 19.16 | <0.001 |
| Variable | Coefficient | R2 | F | p-value |
|---|---|---|---|---|
| Constant (Number of Comments Total) Number of Posts | 9.723 4.46 | 0.171 | 35.47 | <0.001 |
| Constant Link Posts | ||||
| Constant Picture posts | 19.548 6.55 | 0.108 | 21.61 | <0.001 |
| Constant Video Posts | 70.64 16.68 | 0.102 | 22.18 | <0.001 |
| Variable | Coefficient | R2 | F | p-Value |
|---|---|---|---|---|
| Constant (Number of Reactions) Number of Posts | 78.87 127.26 | 0.163 | 40.66 | <0.001 |
| Constant Link Posts | ||||
| Constant Picture posts | 170.83 164.79 | 0.164 | 38.96 | <0.001 |
| Constant Video Posts | 2490.82 322.38 | 0.107 | 15.78 | <0.001 |
Publisher’s Note: MDPI stays neutral with regard to jurisdictional claims in published maps and institutional affiliations. |
© 2022 by the authors. Licensee MDPI, Basel, Switzerland. This article is an open access article distributed under the terms and conditions of the Creative Commons Attribution (CC BY) license (https://creativecommons.org/licenses/by/4.0/).
Share and Cite
Drivas, I.C.; Kouis, D.; Kyriaki-Manessi, D.; Giannakopoulou, F. Social Media Analytics and Metrics for Improving Users Engagement. Knowledge 2022, 2, 225-242. https://doi.org/10.3390/knowledge2020014
Drivas IC, Kouis D, Kyriaki-Manessi D, Giannakopoulou F. Social Media Analytics and Metrics for Improving Users Engagement. Knowledge. 2022; 2(2):225-242. https://doi.org/10.3390/knowledge2020014
Chicago/Turabian StyleDrivas, Ioannis C., Dimitrios Kouis, Daphne Kyriaki-Manessi, and Fani Giannakopoulou. 2022. "Social Media Analytics and Metrics for Improving Users Engagement" Knowledge 2, no. 2: 225-242. https://doi.org/10.3390/knowledge2020014
APA StyleDrivas, I. C., Kouis, D., Kyriaki-Manessi, D., & Giannakopoulou, F. (2022). Social Media Analytics and Metrics for Improving Users Engagement. Knowledge, 2(2), 225-242. https://doi.org/10.3390/knowledge2020014