Article

Exploration of Psychosocial Factors in Peruvian Workers: A Quantitative Analysis of Qualitative Categorizations

by
Arturo Juárez-García
1,*,
César Merino-Soto
2,3 and
Javier García-Rivas
1
1
Centro de Investigación Transdisciplinar en Psicología, Universidad Autónoma del Estado de Morelos, Cuernavaca 62350, México
2
Instituto de Investigación de Psicología, Universidad de San Martín de Porres, Lima 15036, Perú
3
Tecnologico de Monterrey, Institute for the Future of Education, Monterrey 64849, México
*
Author to whom correspondence should be addressed.
Hygiene 2025, 5(4), 43; https://doi.org/10.3390/hygiene5040043
Submission received: 28 June 2025 / Revised: 12 September 2025 / Accepted: 25 September 2025 / Published: 30 September 2025

Abstract

This study aimed to explore psychosocial factors in a sample of Peruvian workers, examine their convergence with the PROPSIT model, and identify the emergence of new or idiosyncratic psychosocial dimensions. At the same time, the quality and efficiency of the categorization process were evaluated. n = 48 workers were contacted by a non-probabilistic sampling method and asked to fill out a form with open-ended questions that explored negative stressors and positive engaging factors. Some strategies were used to assess the quality and efficiency of the categorization process. The results showed that the quality, speed, and reliability of the categorization procedure were satisfactory, and several categories were aligned with the PROPSIT model and other literature, both in their negative aspects (workload and rhythm, working hours, shifts, etc.) and positive aspects (rewarding tasks, atmosphere of unity, etc.). The emerging new categories were confined to aspects of teamwork and conflict climate, as well as topics such as order, cleanliness, and recreation. These findings underline the need to adapt existing models and instruments to capture idiosyncratic aspects of the Peruvian work environment. In conclusion, this study validated an efficient mixed approach for categorizing psychosocial work factors in Peru, revealing both PROPSIT-aligned and novel context-specific categories, and highlighting the need for culturally adapted tools and broader validation.

1. Introduction

Psychosocial factors at work have been a priority for international organizations because of the overwhelming evidence of their influence on the health, well-being, and quality of life of workers, as well as their impact on the fulfillment of the social mission and productive goals of all types of organizations [1,2].
The conceptual framework used in this study was that of the Psychosocial Processes at Work (PROPSIT in Spanish) model [3,4], which considers psychosocial work factors as social aspects of work that interact with individual conditions and, through stress mechanisms, influence physical and mental health. Although the model considers stress as the mediating mechanism of these factors, it does so by considering a negative mechanism (negative psychosocial risks that cause distress and illness) and a positive mechanism (favorable factors that cause eustress, enthusiasm, and promote health).
The PROPSIT model has characteristics that stand out compared to other models, such as a Latin American ethnopsychology perspective of psychosocial factors, the heuristic vision of psychosocial factors (positive and negative) according to each specific context, the inclusion of extra-labor and individual factors in the psychosocial process, and the vision of short- and long-term outcomes in its positive and negative components. From a methodological perspective, a mixed-methods approach is considered for a more flexible and comprehensive evaluation. This allows the identification of different, varied, and specific psychosocial factors in each context in which they have been evaluated [5,6,7].
The theoretical foundation of the PROPSIT model was developed within an emic–etic research framework. Its content was initially constructed to be culturally appropriate for the Mexican context (emic), based on qualitative studies conducted in diverse occupational settings in Mexico [8,9,10]. At the same time, it was designed to align with internationally recognized psychosocial work dimensions (etic). The constructs comprising the PROPSIT model are grounded in an interactionist perspective and draw from the most influential and empirically supported frameworks in the field, particularly the Job Demands–Resources model [11], the Demand–Control model [12], and the Effort–Reward Imbalance model [13].
Thus, both approaches (emic-etic) are influential for research methodology in the evaluation of psychosocial factors because a research design can be conducted along the lines of three different methods: imposed etic, parallel emic, and derived etic [14]. In the latter, the development of culturally sensitive constructs is key, but it also attempts to capture the commonality of the construct in multiple contexts. Procedurally, this approach can be expressed in sequences of methods that generally combine quantitative and qualitative approaches, connecting and expanding the native identified concepts with pre-existing well-known constructs from other cultural contexts [15,16]. Therefore, because of the sequential application of both approaches (i.e., emic and etic), the derived etic approach is potentially useful for providing intercultural validity to the constructs considered by PROPSIT. When validity is approached this way, it takes into account the cultural differences in the groups for whom the instrument is intended to measure [17] and is therefore better able to capture individual differences in the construct that extend beyond cultural variation.
Despite the numerous advantages this emic-etic approach could offer for studying psychosocial factors at work and understanding their dynamics and differentiation across various contexts, its application remains virtually absent in current research—particularly in developing countries, such as those in Latin America. This study seeks to address this gap in the literature, specifically by applying a Latin American Mexican model (PROPSIT) to a Latin American Peruvian sample.
According to previous research in Mexico on the factors associated with the well-being and discomfort of workers [5,6], as well as mixed design studies that served to verify and explore the emergence of psychosocial factors in various occupations in the Mexican context [8,9,10], the dimensions that were identified and empirically validated to form the PROPSIT scales were six [4]: three negative or stressor factors (Psychological Demands, Harassment Environment, Physical Demands); and three positive (Social Support Climate, Labor Control and Rewards, and Resources). Thus, the PROPSIT model starts from these basic, general, and frequently observed psychosocial dimensions in the work reality (etic) as factors to be quantitatively evaluated in its standardized questionnaire, or as general template categories to identify factors in different contexts qualitatively or with mixed methods. To date, the exploration of PROPSIT psychosocial dimensions has been performed in different occupational sectors, but always within the Mexican context. Therefore, there is a need to explore emerging psychosocial factors in other cultural contexts, mainly Latin America, due to the vulnerability of this region to such factors since the 1980s [18,19]. In line with the derived etic approach, Peru serves as an ideal site to examine how well the PROPSIT constructs apply because it shares several structural and socio-economic features with Mexico, particularly in characteristics like labor market, hierarchical work cultures, and simultaneous efforts to regulate psychosocial risk in occupational health policy. Furthermore, a report on mental health in Peru found that up to 40% of its inhabitants have some mental health problem [20], and more than 50% face at least an intermediate level of risk and up to 35.5% face a high level of exposure to psychosocial risk factors at work, which positions it among the countries with the highest psychosocial risk in the region [21]. Likewise, although Peru has some legislation on the subject, it is still limited compared to other countries [22], so more research is needed to guide and strengthen psychosocial diagnostic and evaluation strategies that are appropriate to the idiosyncratic and cultural context of that country and can improve the effectiveness of its diagnostic and prevention programs.
An emic-etic approach could be performed within template analysis or the hybrid approach [23,24,25]. This means a more qualitative or at least mixed-oriented analysis is required. This deductive approach to identifying themes that may be linked to the theoretical framework of PROPSIT should also allow the emergence of possible psychosocial dimensions from an inductive framework, and the corroborated concepts should be described narratively, graphically, or quantitatively. Particularly, these last two options add clarity and ease to understanding the results [26], for example, by the resulting frequency of the categories and, complementarily, with the presentation of figures, such as word clouds [27,28]. This results in the need for a mixed methodology, where qualitative data can be combined with quantitative data, making statistical estimates from the qualitative data and, at the same time, evaluating the quality of the categorization process, which is a practice absent from traditional qualitative analyses. This strategy was adapted in this study, and the effectiveness and legitimacy of the procedure were evaluated.
Thus, the research questions of the study were as follows: Do the psychosocial work situations of stress (negative) and engaging factors (positive) perceived by a group of Peruvian workers align with the psychosocial categories established by PROPSIT? What emerging psychosocial dimensions are presented, and which are idiosyncratic to the Peruvian context? Is the categorization process used in the study rapid, reliable, and effective?
Therefore, the goals of the present study were to explore psychosocial factors in a sample of Peruvian workers, examine their convergence with the content categories and dimensions of the PROPSIT model, and identify the possible emergence of new idiosyncratic psychosocial dimensions of the evaluated context. At the same time, the quality and effectiveness of the categorization process used in this study were evaluated.

2. Materials and Methods

This was a mixed, non-experimental, cross-sectional descriptive study [29]. The study is part of a broader project on organizational factors and well-being at the Centro de Investigación Transdisciplinar en Psicología and has the approval of the ethics committee of the Universidad Autónoma del Estado de Morelos in Mexico (registration number 100919-20).

2.1. Participants

n = 48 workers were contacted through non-probabilistic sampling, specifically using the snowball method, based on the researchers’ accessibility. All participants were full-time workers residing in different regions of Peru. Those who agreed to participate had diverse occupations and were all over 18 years old. The exclusion criteria were not having worked in the last six months or expressing their lack of availability to participate in the study (marked on the informed consent form). The quantitative description of the participants is presented in Table 1.

2.2. Instruments

2.2.1. Questionnaire with Open-Ended Questions

Context. The study was based on the mixed technique of psychosocial exploration (TEMEP in Spanish) [8,30], which consists of collecting qualitative information on psychosocial factors through open-ended questions (stimuli/inducers/prompts) under a template analysis approach, this procedure generates hierarchies of categories that are subsequently analyzed quantitatively. For the present study, an adaptation of this technique was used: (1) adding more descriptive instructions to clarify the concept/stimulus presented; (2) generating word clouds to characterize exclusively emerging categories; (3) incorporating a method of response legitimacy through the assessment of the reliability of coding and efficiency (speed) in coding responses performed by judges or coders; and finally, (4) estimating the reliability of the responses obtained. The details of these steps are described in the following sections.
Regarding the prompts (i.e., stimuli that produce responses not restricted to response options), two open-ended questions were shown to respondents and were focused on (a) identifying psychosocial stressors at work, and (b) engaging or enthusiastic work situations (situations that workers like very much, are enjoyable, and generate energy and dedication). Both questions had three spaces for the participants to fill in three possible answers. These two prompts come from the validated TEMEP tool [8,30]. According to its use in TEMEP, these open-ended questions facilitate: (a) the understanding of participant’s experience regarding psychosocial work factors; (b) the identification of the different and most important psychosocial factors (negative = stressors, positive = enthusiastic) of the context being evaluated; and (c) the opportunity for their alignment with pre-existing themes or categories (a priori templates) or the emergence of new categories.
The first prompt addressed psychosocial work stressors and was introduced with the following instructions: “When people work, work stressors may occur frequently or infrequently. Work stressors are situations, problems, or events that occur during work, hinder performance, and cause discomfort or distress because they cannot be solved. To know and understand the stressors that occur in your work, please use the following spaces to write the 3 stressors that cause you the most discomfort or distress while you work; next to each one, mark the frequency with which they occur”. In the next space below, within a table, two headers were placed: “Work stressors (write below)” (below this header three spaces were available for answers).
In a subsequent table (below the first one), the following instructions are provided regarding engaging factors: “In the following box, list the three aspects of your work that you like or feel most enthusiastic about, also mark the frequency with which they occur”. This instruction was brief compared to the prompt of negative situations (which contained the word “stress”) because it did not contain any concept that could be confused with other experiences and, therefore, did not require any additional explanation. Below this instruction, within a table identical to the previous one, the following headers appeared side by side: “Aspects you like or feel most enthusiastic about in your work (write below)” (below this header, three spaces were available for answers).

2.2.2. Procedure

Data collection. Two trained collaborators in the used methodologies participated in the collection, coding, and categorization of the data. Through a snowball strategy, the seed was started among the evaluators’ contacts, stored in their private social network lists (i.e., WhatsApp). Each worker received: (a) an electronic link that led them to an ad hoc form, placed on a web platform, or (b) an MS Word text file sent to their email address. Workers who agreed to participate answered the open-ended questions of the questionnaire, including demographic questions. No identifying information was requested in the questionnaire to maintain anonymity.
Analysis. The coding process in the original mixed technique is performed with a template analysis orientation, which can be inductive, deductive, or a combination of both. In this study, it was essentially deductive because of the a priori existence of a thematic framework derived from the dimensions and content areas of PROPSIT. In this sense, 16 subdimensions that represent various facets of the PROPSIT model were considered a framework for the classification of responses (See Supplementary Material S1). Following the coding process summarized by Fereday and colleagues [25], the following four-step coding process was developed:
(I) Development of manual coding. An a priori code dictionary was developed, derived from the empirically validated structure of psychosocial factors of PROPSIT in 1339 Mexican workers [6] (Table 1). This framework contains six psychosocial factors, divided into 16 subdimensions. Also, this dictionary contained several elements at the item level [24,25], and definitions of the codes in terms of a label (name of specific dimensions) (from Table 1 of PROPOSIT categories [6], and a description (the content of the items) was created. A complete description of these definitions is provided in Supplementary Material S1. This dictionary was used as a template guide for the coder, who examined it when it was necessary to verify the assigned code.
(II) Coding. A five-step flow was developed for the coding process using a template [31]. This procedure was also described in the instructions for the coders (see Supplementary Material S2).
First, a scan of the content was made, which consisted of reading each response to become familiar with the extent and variety of the responses. This stage procedurally coincides with traditional qualitative categorization and the TEMEP technique [30].
Second, each response read by the two researchers was placed in one of the existing content categories; this placement could start with a general category or a specific category within the general one, this depended on how quickly the content could be identified in one of these categories. The reading process was guided by the rationality of the content established by two guiding questions that the coder asked themselves: What does it mean? What category could this be an example of? If the content was placed in a specific category, the categorization ended; if the content was placed in a general category, it continued with deciding which specific category it could be placed in.
Third, step 2 was related to the assessment of the efficiency and speed in the judging process to identify the responses in the existing categories; in this way, the judge or evaluator assigned the content (i.e., the participant’s written response) as immediate (score 3; when no doubts were perceived about the classification and no additional examination of the content was required), moderately iterative (score 2; when moderate doubt was perceived about the initial classification), and finally, intensely iterative (score 1, when high doubt was perceived about the appropriate existing classification, and required several reviews of the dictionary definitions, and it was concluded that the examinee’s response should be considered as unclassifiable in the pre-existing PROPSIT categories and candidate for a new emerging category). An efficiency score of 1 would lead the coders to create a new category, independently formulated and then reviewed by both to evaluate the consistency of its content (this is described in the Fourth step). This procedure for evaluating the efficiency of coding was included to strengthen the credibility of the study [25].
Fourth, in situations where no pre-existing specific category of the PROPSIT could be used to identify the response content, a new specific category emerged through open coding. This new category was induced from the specific content by creating a generic label, descriptive in general terms, that could summarize and contain participants’ specific responses. This emerging category was iteratively evaluated after each new response was analyzed, so that it could be consolidated or modified to better represent the content. The new categories were graphically represented using word clouds with the R word cloud program [32].
(III) Quality of the process. To ensure the legitimacy of the coding process, two procedures were developed: (a) a procedural example was created, which briefly described the coding steps. This was given to the coder before starting their task, and it served as a guide. Additionally, (b) the reliability of the use of the code/template was evaluated by repeating steps 1, 2, and 3 by the two judges or coders, and the degree of agreement between them was estimated using the AC1 coefficient [33]. As described in step 2 of the Coding process, (c) the speed and efficiency of the coding were obtained through a rating from 1 to 3, made by the coders when they assigned a code to the evaluated content.
Finally, (d) the consistency of the responses between judges was assessed through the similarity of the frequency with which the work stressors and engaging factors occurred in the coding of the three open-ended questions. Rankings were assigned, starting with 1, to the category with the highest frequency of occurrence within each open-ended question. These rankings were correlated to obtain a measure of similarity using Spearman’s monotonic correlation. The rank and cor functions of the R base program [34] (R Core Team, 2024) and Computing Chance-Corrected Agreement Coefficients (iccCAC) [35] were used for this analysis. The accepted levels of significance were set at levels below 0.05. Figure 1 presents a graphical description of the coding process.
(IV) Reporting of the results. The results included the presentation of quality indicators of the process, as well as the prevalence or frequency of psychosocial stressors and engagement factors in the chosen categories. This quantification of prevalence allowed for the interpretation of the results from an objective perspective, with a greater opportunity to be understood [26]. Word cloud-based graphs were also constructed to visualize the prevalence and strengthen the clarity of the results [27,28]. Each graphed word was directly linked to its tabulated frequency, so the size of the drawn word indicates the strength of its frequency. Different words, even those that were conceptually equal or similar, were not homogenized into a common word to avoid altering the variability of the words.

3. Results

3.1. Coding Efficiency

The coding efficiency of the stressors (Table 2) increased from the first response (stressor 1) to the third response (stressor 3). This was also indicated by the monotonic association, as the size of the association increased in the same sequence. In contrast, regarding the engaging factors at work, the efficiency was predominantly at value 3 (immediate coding), and the ordinal association between the engaging factors was |1.0| (Table 3). The gamma coefficient between engaging factor 1 and engaging factor 2 was negative due to a single discrepant value (engaging factor 1, “dealership,” was assigned value 1, and consequently, a new category was created). Without this value, absolute equality was detected between the two engaging factors (gamma = 1.0).

3.2. Coding Reliability

The judges coded 20 randomly selected responses obtained from the first open-ended question about work stressors and engaging factors (both randomly selected). AC1 coefficients of 0.82 (p < 0.05; 95% CI = 0.63, 1.00, SE = 0.09) and 0.38 (p < 0.05; 95% CI = 0.11, 65, SE = 0.12) were obtained, respectively, indicating that the coding process maintained an adequate level of inter-coder agreement and replicability for the stressors, but a lower magnitude for the engaging factors. In the latter, however, the specific themes (e.g., coworker support, supervisor support, and atmosphere of unity) are interpreted within a single general dimension of the PROPSIT (e.g., social support climate at work), and overall, the effect of this low agreement can be considered not significant for the interpretation of the PROPSIT based on the scores.

3.3. Categories of Psychosocial Risk Stressors

Table 4 presents the frequency and percentage of occurrence of each code, as well as frequency rankings (1 assigned to the category with the highest frequency) for the three responses (i.e., stressor 1, stressor 2, and stressor 3). To summarize the results more clearly, this distribution is reorganized in Table 5 according to three recognizable groups: frequent categories (≥10.0%), somewhat frequent (>0.0%), and infrequent (0.0%). From Table 5, very recurrent themes can be observed (e.g., workload and work pace). In general, more than half of the categories were applied to the participants’ responses for each psychosocial stressor of the PROPSIT, indicating the relevance of these categories for the sampled participants. The infrequent categories, where the percentage was 0.0%, were predominant in the content related to harassment by superiors or colleagues and cognitive or attentional demands.
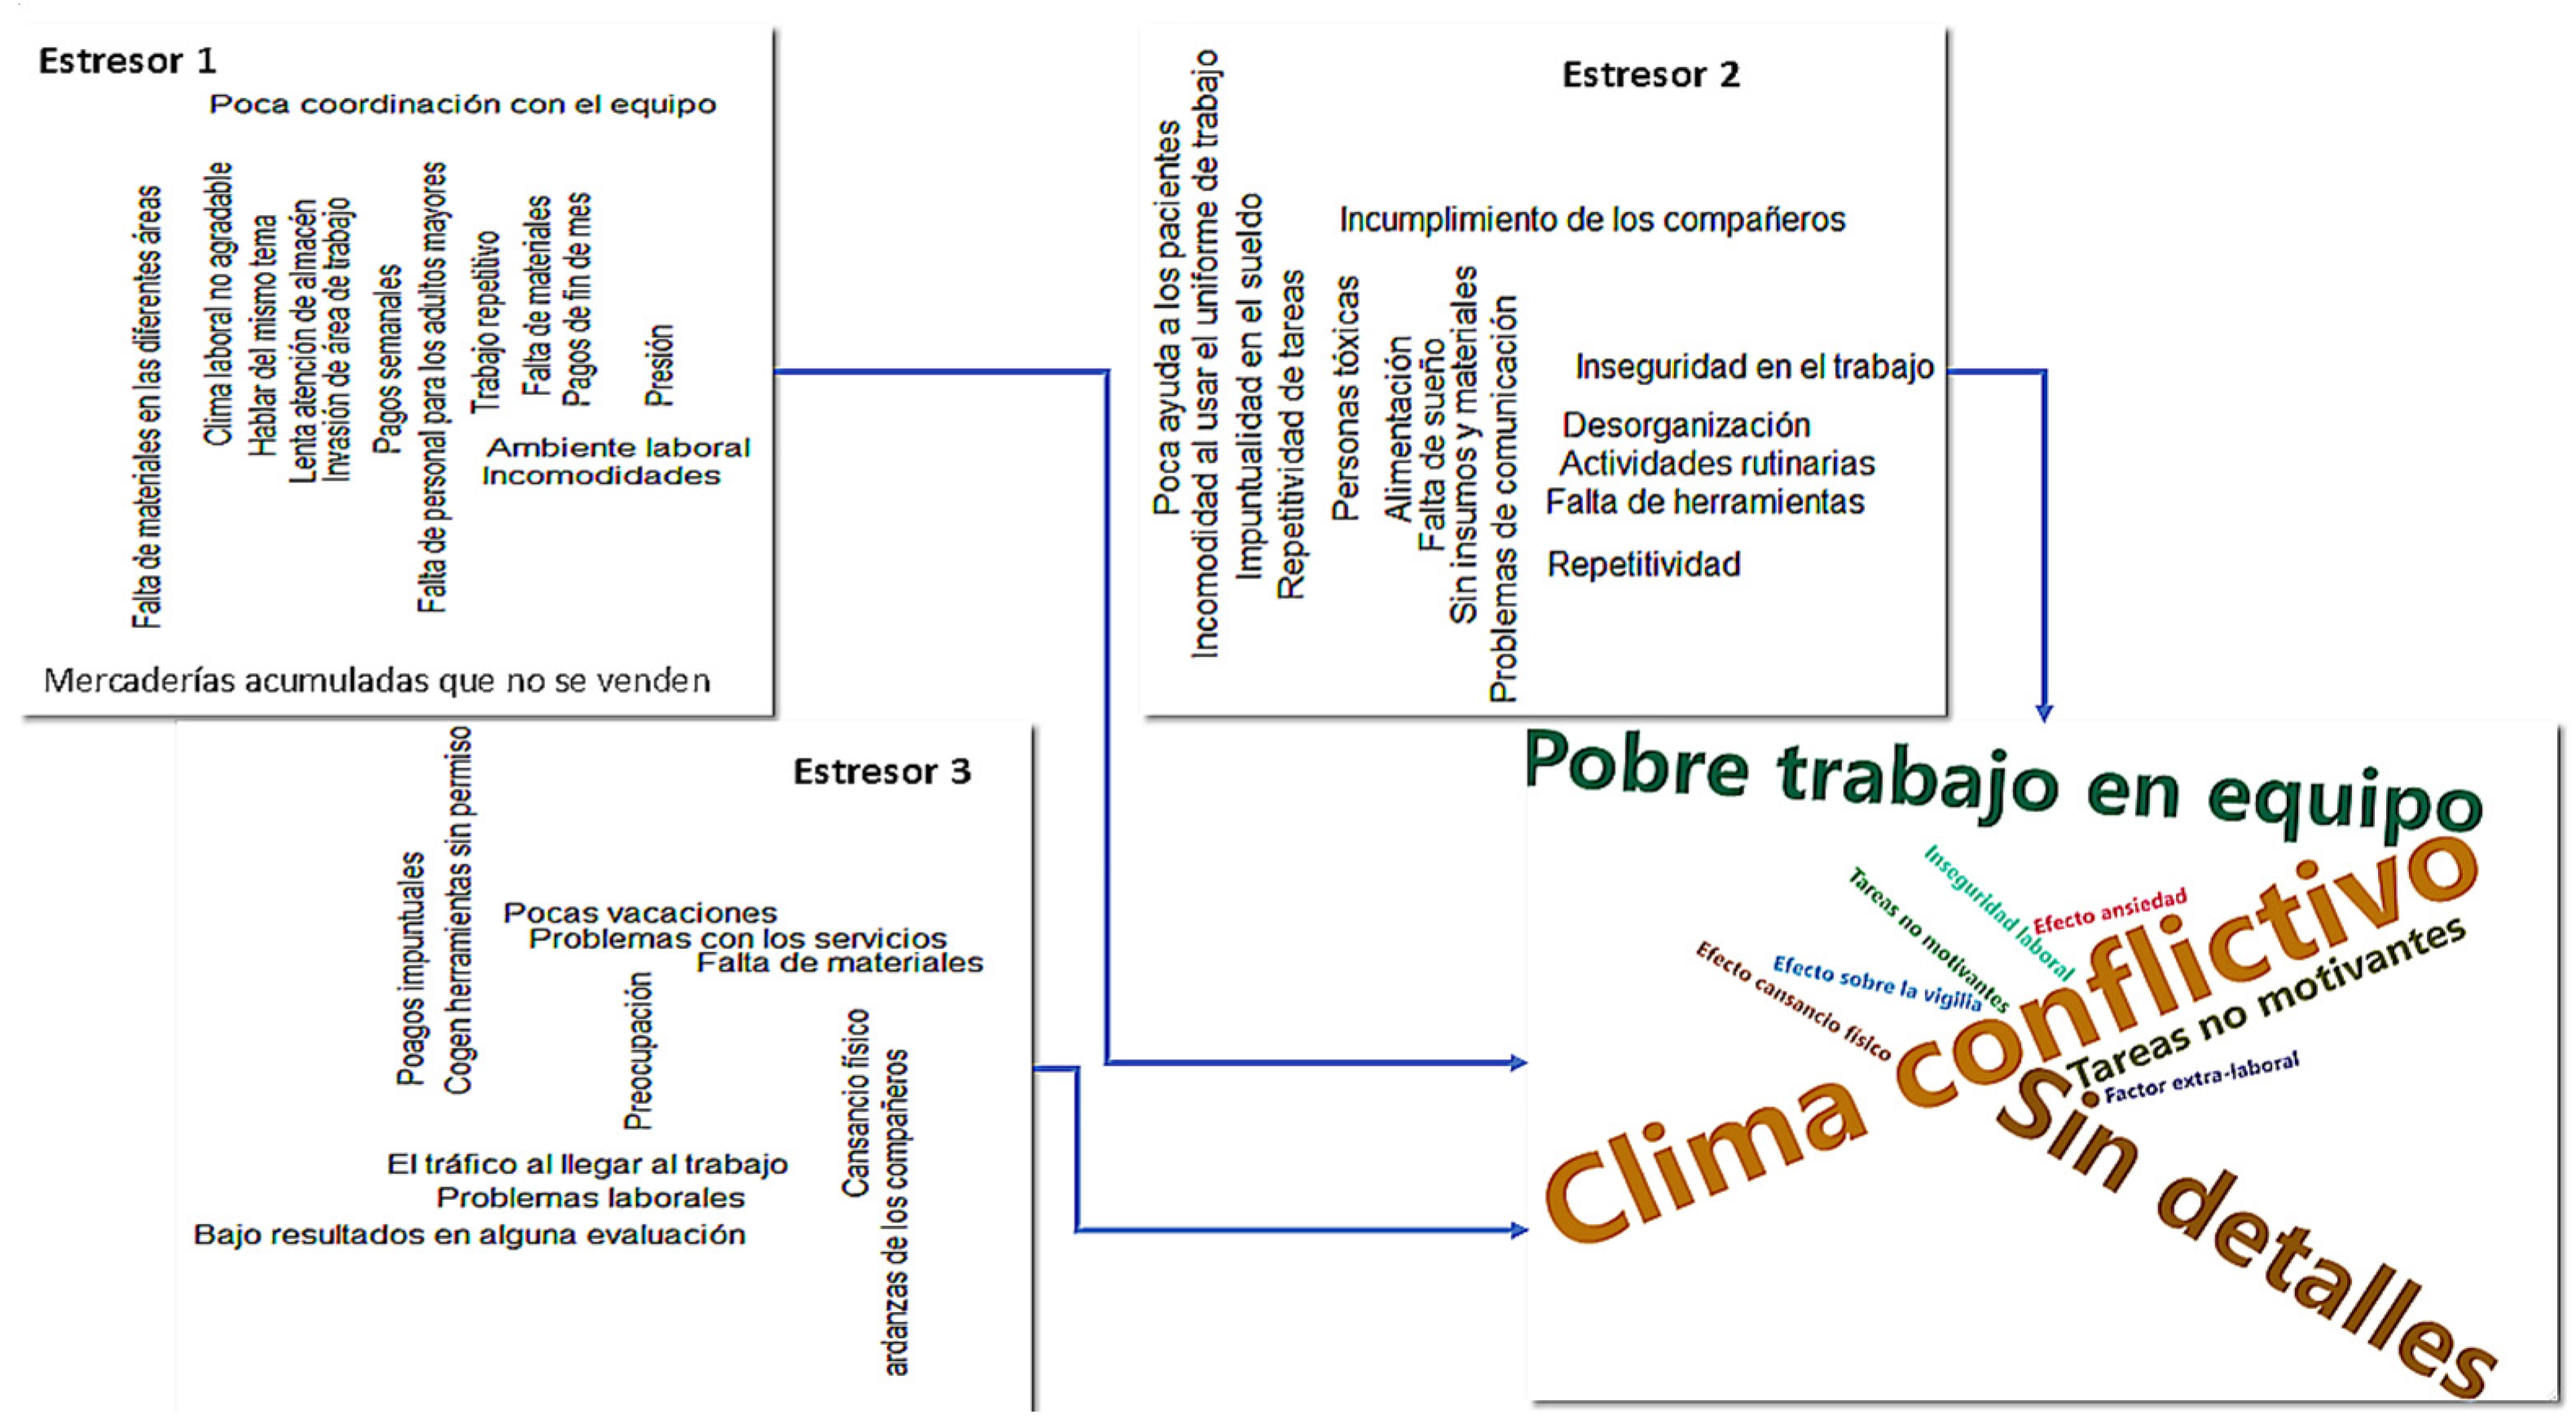
Unclassifiable responses within PROPSIT framework were assigned to new emerging categories inferred by the coders. Figure 2 shows the word cloud of the responses for each stressor, as well as the emerging categories. These emerging categories, based on their frequency, were mainly: the perception of poor teamwork (e.g., “non-compliance by colleagues,” “disorganization,” etc.), conflictive climate (“unpleasant work climate,” “communication problems”), non-motivating tasks, and generic or unclear categories (e.g., “concern,” “work environment,” “work problems”). Other responses can also be considered psychosocial stressors (e.g., “lack of materials,” “late payments,” etc.), while others refer to effects (“concern”). The two most important emerging categories seem to refer to events involved in interpersonal relationships oriented towards the task and maintaining positive sociability.

3.4. Categories of Engaging Factors at Work

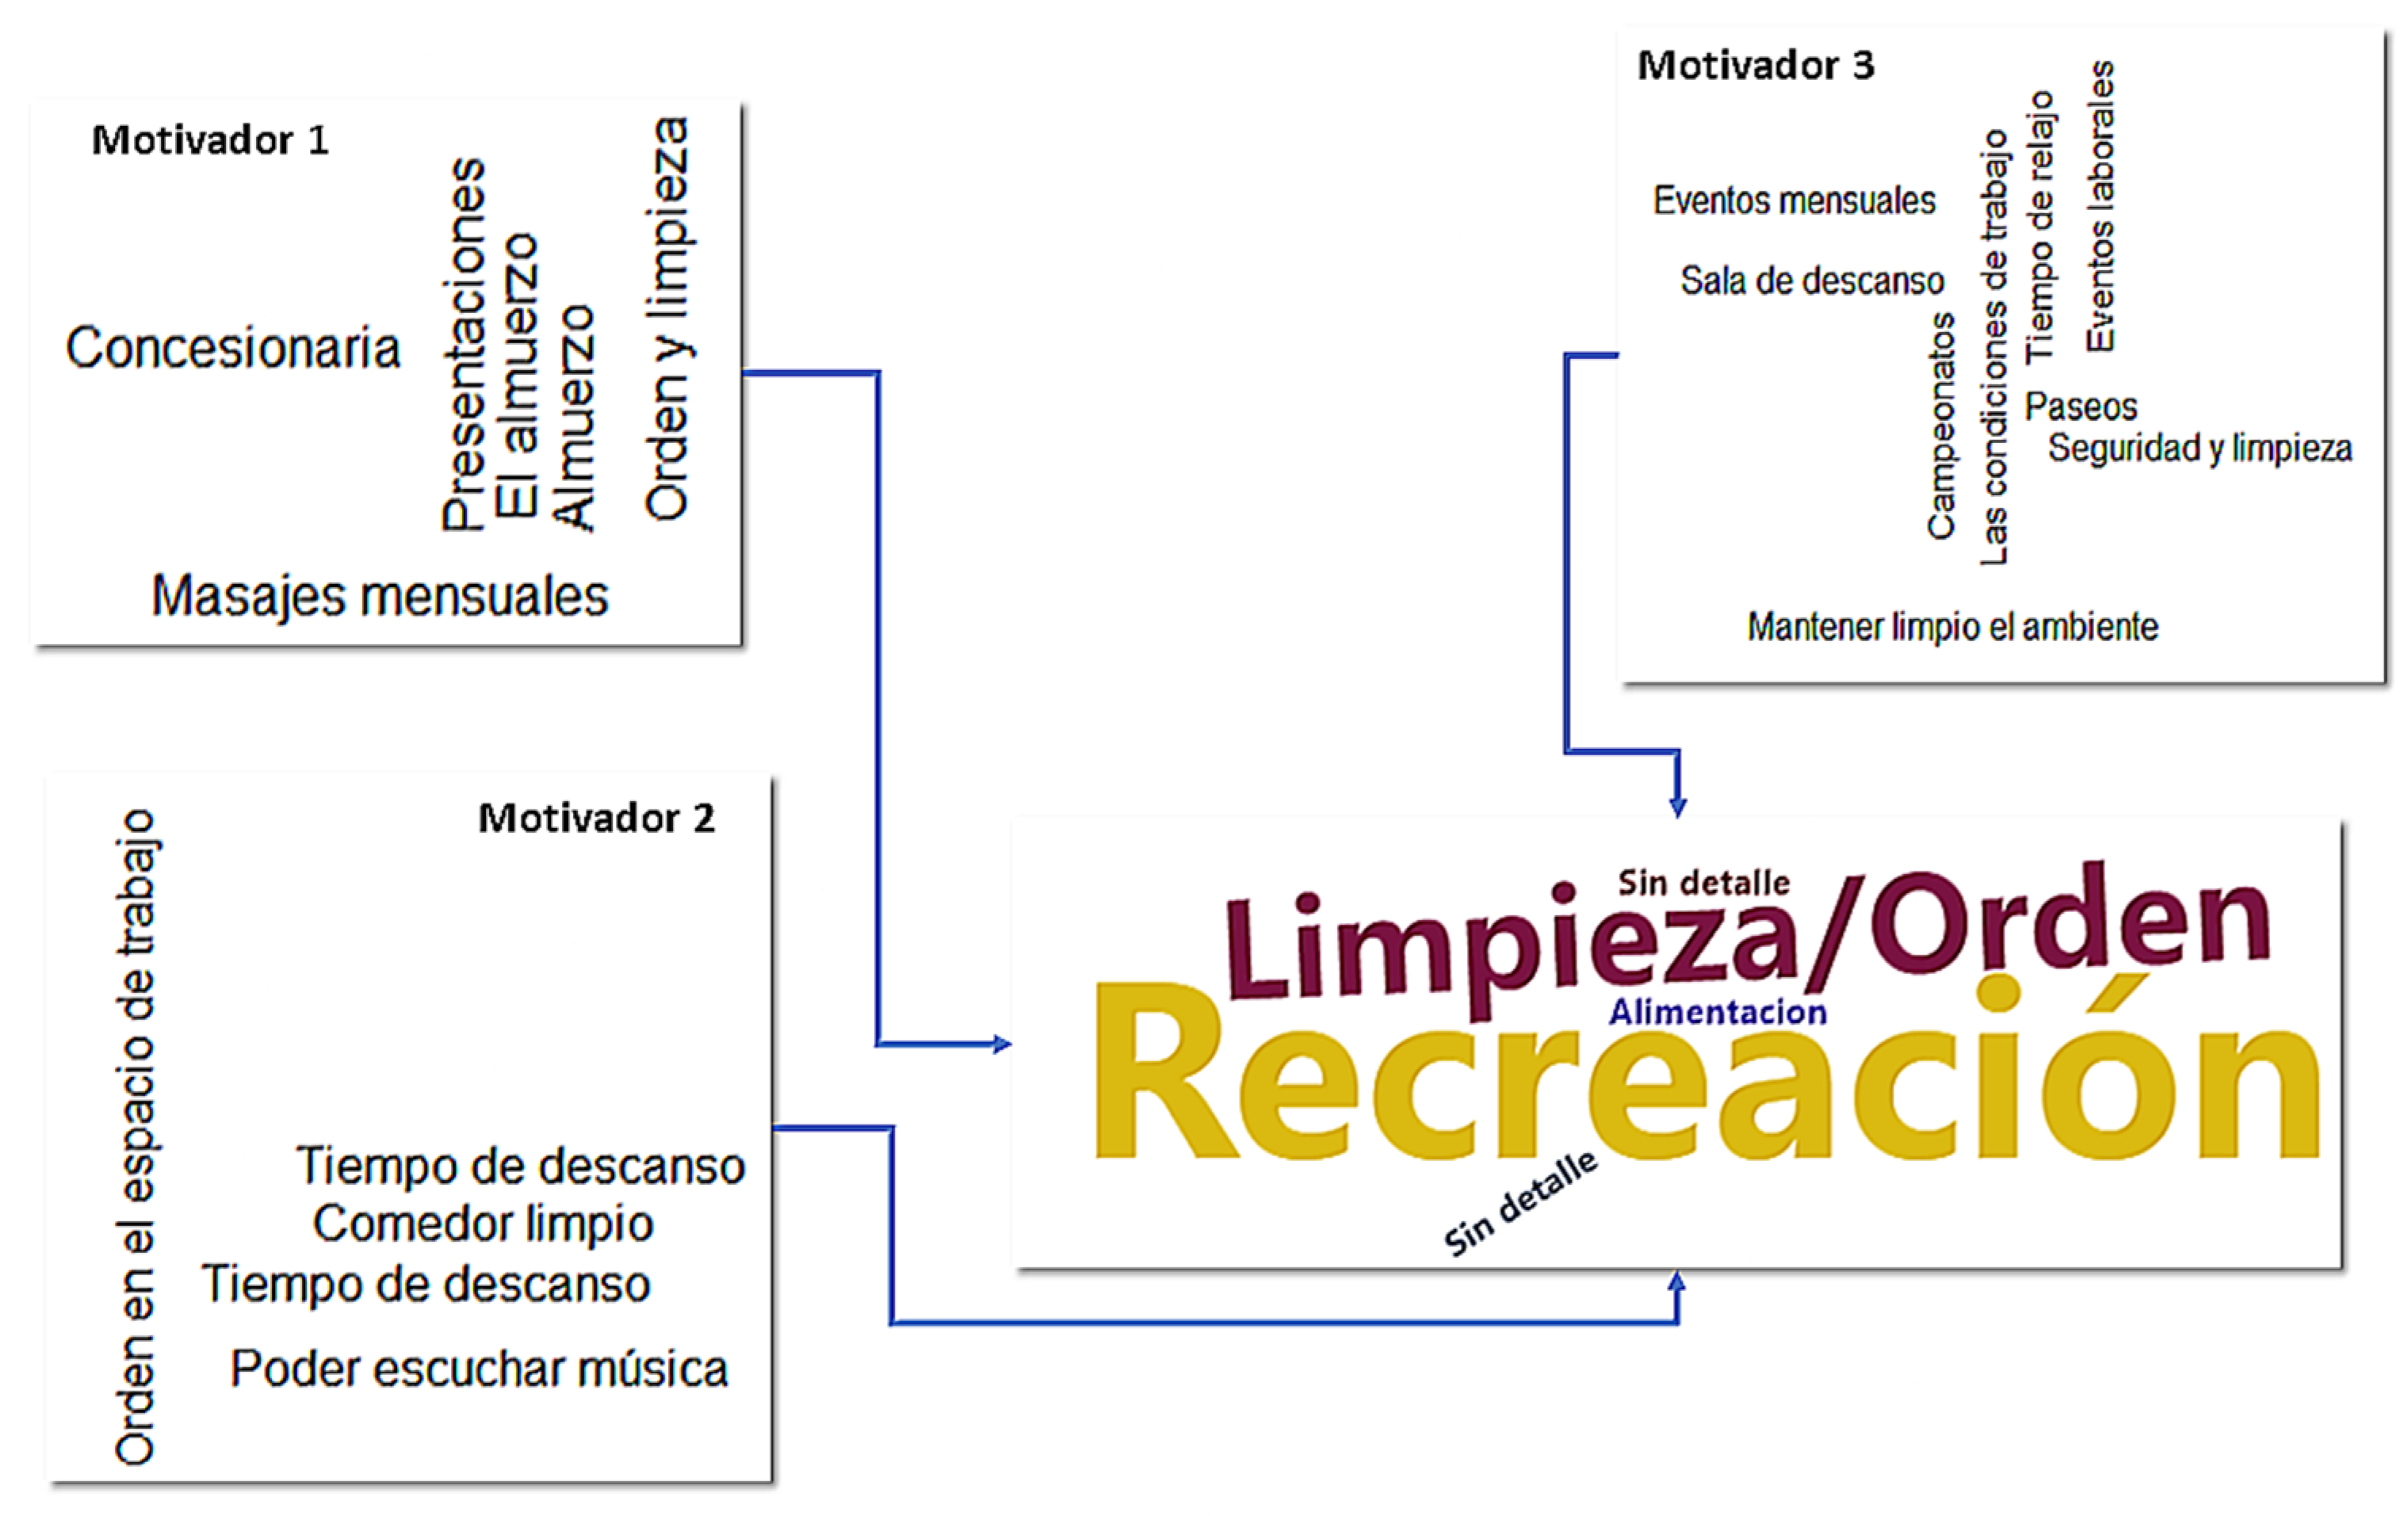
Table 6 presents the frequency and percentage of occurrence of each category regarding engaging factors at work, as well as frequency rankings (1 assigned to the category with the highest frequency) for the three responses (i.e., engaging factor 1, engaging factor 2, and engaging factor 3). To summarize the results more clearly, this distribution is reorganized in Table 7 according to three recognizable groups: frequent categories (≥10.0%), somewhat frequent (>0.0%), and infrequent (0.0%). The predominance of the perception of rewarding tasks and atmosphere of unity is clear, as they are among the most frequent and consistent, along with the initially unclassifiable content. On the other hand, the consistently infrequent categories were mainly the perception of organizational justice, job security, varied work, and clarity of functions and roles. The emerging categories (Figure 3), derived from initially unclassified responses, seemed to define themes such as recreation and cleanliness/order, with predominance of the latter.

3.5. Consistency of Responses

As a final report, the monotonic association (i.e., Spearman’s correlation coefficient) between the frequency rankings of the stressors (stressors with the highest frequency were assigned to 1, as shown in the subheading Rnk, Table 4) was high (≥0.80; Table 8), indicating that the same stressors consistently appeared in the questions asked. On the other hand, the monotonic association between the frequency rankings of the engaging factors (engaging factors with the highest frequency were assigned to 1, as shown in the sub-heading Rnk, Table 6) varied moderately (0.83 ≤ rho ≥ 0.42; Table 8), indicating that the same engaging factors did not consistently appear in the responses provided by the participants.

4. Discussion

The present study focuses on the exploration of work stressors and engaging factors in a sample of Peruvian workers using a mixed methodological framework and content validation of the PROPSIT model. This tool was created for Mexican workers but can be adapted for Peruvian workers. Simultaneously, this study aimed to assess the quality, efficiency, and reliability of a mixed procedure for the quantitative estimation of qualitatively obtained categories.
Regarding the evaluation of the quality of the categorization and coding process, and because the review was generally iterative and sequential, the findings showed that the coding efficiency improved substantially from the first stressor to the third stressor, as immediate coding (score 3) increased from 6.3% in the first stressor to approximately 77% in the third stressor. This indicates that the coding made by the judges for the last two stressors was perceived as more certain classifications and were easily recognized when codes were assigned to the participants’ open responses. This was also expressed in the ordinal association, as the association was moderately strong between the efficiency of the last two stressors. This pattern of improvement in efficiency was observed in the rating of engaging factors at work, because, except for a few evaluations, the coding of all engaging factors was very rapid and efficient. This confirms that the mixed technique and its procedure were of satisfactory quality and highly efficient.
Regarding the quality of the coding process, the responses were generated three times, which also served to evaluate the reproducibility of the responses and to maximize the variability of the responses. In the evaluation of the similarity of frequency with which work stressors and engaging factors were presented, high similarity was found in the occurrence of categories in the three open response options (information derived from Table 8), suggesting that the identified stressors were repeated in these three opportunities in which the workers responded. This implies that the categories were replicable and represented a consistent pattern of psychosocial stress factors in different jobs and occupations. As for engaging factors at work, a high concordance among responses was found. This implies that the content of engaging factors at work is also replicable for the sampled group of Peruvian workers.
The categories of psychosocial stress factors were more consistent and suggest the etic value of these categories to represent relevant content of the latent constructs. However, regarding engaging factors at work, the specific content showed moderate consistency and effectively represented the experiences of the Peruvian sample, i.e., their emic value.
Regarding the main objective of this study, the identification of negative psychosocial factors (stressors) or positive ones (engaging factors) aligned with the PROPSIT model or those that emerged as new categories. The findings showed that the responses aligned with the most frequent PROPSIT stressor categories were aspects related to workload and work rhythm, workdays, shifts or schedules, and physical environment. This coincides with the international literature [36]. The most frequently engaging aspects were around categories such as rewarding and transcendent tasks, atmosphere of unity, and coworker support. This concurs with the results of other studies using the same technique [5,6,30], and with national representative surveys in Perú, where favorable levels of social support and social capital were found in almost 50% of participants [21]. It is important to note that several categories were detected to have zero frequency (nearly 50% of responses), i.e., they did not appear as classifiable responses within the PROPSIT categories, which may give the impression of an overabundance of irrelevant categories in this sample of Peruvian workers. However, this result may be underestimated because each category was represented by a single item from the PROPSIT, and the opportunity for this category to appear conceptually irrelevant was maximized.
A specific situation that should be highlighted is that the content of harassment by superiors or colleagues was nonexistent, as well as some others (e.g., cognitive and physical effort demands); these do not seem relevant to the experience of the sampled Peruvian workers because the frequency of occurrence was zero. Workplace harassment in some regions can be alarmingly high (Hong Kong: between 39.1% and 58.9%) [37]; but also, relatively low (Malaysia: 11.2%) [38]. In Peru, in the work context of resident physicians, a high prevalence was reported 61.1% [39], which seems to contrast with the absence of this stressor in the Peruvian sample. The absence of this content may suggest some particularity of the participating sample that may have influenced the underreporting of this type of psychosocial stressor, but it does not necessarily mean that this factor is nonexistent. For example, it may be a very high exposure that has been normalized in the cultural context of Peruvian work environments. This can also apply to other infrequent contents, and it is likely related to the restriction of sampling experiences in a sample of fewer than 50 workers, or that the sample from which the responses were generated in the Mexican studies was mainly homogeneous. For example, informal traders [6], community instructors [8], and health professionals [5].
Regarding the new emerging psychosocial categories or dimensions in the study, in the case of positive-engaging variables, recreational and cleanliness/order aspects were the most frequent, a category that does not appear in PROPSIT and seems relevant in the Peruvian context. It is important to note that official instruments for the evaluation of psychosocial risks in Peru [21] do not consider positive psychosocial factors, much less the aspects found in this sample. As for negative categories (psychosocial stressors), poor teamwork and conflictive climate were the most frequent, and although they could be related to the PROPSIT construct of “psychosocial support climate,” they seem to be more specific, and undoubtedly, these reflect the primary impact of interpersonal relationships in the Peruvian work context, as is the cases in collectivist cultures [40].
It is fundamental to acknowledge that the emerging categories may well reflect novel, context-specific aspects of the Peruvian work environment. At this stage of the research, and to further examine their broader relevance, these categories were treated as independent from existing model categories (e.g., PROPSIT or demand/control model or ERI model), given their distinct nature and meaning. Likewise, similar expressions were not homogenized to maintain variability and discrimination among categories. This approach prevents the risk of obscuring a context-specific, idiosyncratic category within a broader, more generic one and avoids erroneously suggesting dependence on it. The new categories imply that they represent potentially more specific dimensions of the Peruvian context and can lead to the creation of new constructs or items (in the case of standardized questionnaires) that define appropriate content for it and better coverage of the constructs of psychosocial work factors in instruments proposed in Peruvian regulations. However, the emergence of these new categories may not be definitive for creating new dimensions in a standardized questionnaire, as they require a greater breadth of responses and worker sampling. As noted in the previous lines, in contrast with Mexican studies, where the emergence of work stressors or “engaging factors” was studied [5,6,30], the sampling of the present study was performed in a smaller sample size and with a breadth of job positions and careers. Therefore, the definition of emerging themes in psychosocial stress factors and engaging factors at work can be considered working hypotheses for explorations with greater statistical potential and greater opportunity to obtain consistent responses.
The present study has some limitations. First, the sample size of participants may have restricted the possibility of obtaining a greater variety of responses to reach a point of “saturation.” It is important to note that the categories originally derived in the PROPSIT model were obtained from larger and more heterogeneous samples in terms of occupation. With more participants and greater occupational diversity, there would likely be a broader range of responses, and possibly all PROPSIT categories would appear with some level of frequency, excluding absolute infrequency (see results in Table 5 and Table 7). A larger and more diverse sample in future studies could therefore increase the likelihood of observing the full spectrum of categories and reach a point of saturation, thereby improving both reproducibility and generalizability. It is essential to note that, although the sample’s size, structure, and representativeness may limit the scope of the conclusions, other methodological aspects support the robustness of the results. For example, the theoretical foundation on which TEMEP was implemented, the inter-rater reliability obtained, and the intrinsic qualitative importance of the interpretability of categories that provide valid information for the study’s objectives.
A second limitation is that, due to restrictions on participants’ availability and the lack of proximity between the researcher and participants, no additional or more detailed exploration of the responses was conducted, particularly those initially classified as unclassifiable within the existing categories. This limitation reduces the interpretive depth of the analysis; however, future studies could address this issue by incorporating follow-up cognitive interviews with these initially unclassifiable responses, which could also help mitigate the first limitation described above. Such interviews would allow researchers to refine these categories and further strengthen the validity of the PROPSIT model, as previously suggested [30].

5. Conclusions

The mixed methodological procedure employed for the quantitative estimation of qualitatively derived categories proved to be of high quality, effective, and reliable. Coding efficiency across stressors and engaging factors suggests that the technique is appropriate and rapid in capturing the content of participants’ responses and adequate for the categorization of psychosocial factors in varied occupational contexts.
As for the PROPSIT model, originally developed for Mexican workers, it demonstrated partial applicability to the Peruvian work context. While several stressor and engaging factor categories aligned with the original model and international literature, nearly half of the PROPSIT categories showed zero frequency, highlighting potential contextual differences.
In general, the absence of certain stressors of the PROPSIT model (e.g., workplace harassment), and the emergence of new categories (e.g., cleanliness/order), suggest that some psychosocial dimensions may be culturally specific. These findings underscore the need to adapt existing models and instruments to capture the idiosyncratic aspects of the Peruvian work environment, and emphasize the importance of furthering research with larger, more diverse samples to validate and incorporate these emerging categories into standardized instruments, as well as into official standards and regulations on psychosocial risks in Peru. Theoretically, these findings contribute to the cross-cultural validation of psychosocial risk models, demonstrating the need to integrate both etic and emic perspectives. The emergence of context-specific categories in Peru challenges the universality of existing frameworks and supports the development of culturally adapted constructs.

Supplementary Materials

The following supporting information can be downloaded at https://www.mdpi.com/article/10.3390/hygiene5040043/s1, Supplementary Material S1, Supplementary Material S2, and the database.

Author Contributions

Conceptualization and design of the study, A.J.-G., C.M.-S. and J.G.-R.; investigation and resources A.J.-G.; Writing—original draft preparation, A.J.-G. and C.M.-S.; writing—review and editing, J.G.-R. All authors have read and agreed to the published version of the manuscript.

Funding

This research received no external funding.

Institutional Review Board Statement

All subjects provided their informed consent for inclusion before they participated in this study. This study was conducted under the Declaration of Helsinki, and the protocol was approved on April 2025 by the Ethics Committee of the Center for Transdisciplinary Research in Psychology of the Autonomous University of the State of Morelos (Universidad Autónoma del Estado de Morelos, UAEM)with registration number 100919-20.

Informed Consent Statement

Informed consent was obtained from all subjects involved in the study.

Data Availability Statement

The original data presented in the study are openly available in OSF repository at https://osf.io/ngt3z/?view_only=3c4fcdad17e4478bbf84624f44643089 (accessed on 7 September 2025). Further inquiries can be directed to the corresponding author.

Acknowledgments

We would like to thank the participants and codifiers who volunteered to participate in this study and the students who helped with data collection. Copilot Me (Microsoft-IA) was used to assist in the translation of draft versions of the manuscript, first reviewed by two authors (A.J.-G. and C.M.-S.) and then by a bilingual author (J.G.-R.). AI was not used for any other purpose in this manuscript.

Conflicts of Interest

The authors declare no conflicts of interest.

References

  1. World Health Organization (WHO). Psycho Social Risks and Mental Health (Occupational Hazards in the Health Sector). Available online: https://www.who.int/es/tools/occupational-hazards-in-health-sector/psycho-social-risks-mental-health (accessed on 25 June 2025).
  2. Organización Internacional del Trabajo (OIT). El Futuro Del Trabajo: Los Retos Para Los Sindicatos En El Siglo XXI (Informe No. WCMS_553931). Available online: https://www.ilo.org/sites/default/files/wcmsp5/groups/public/%40ed_dialogue/%40actrav/documents/publication/wcms_553931.pdf (accessed on 25 June 2025).
  3. Juárez-García, A. Factores Psicosociales Del Trabajo En México: Historia, Conceptos y Perspectivas. In Psicología Organizacional en Latinoamérica; Uribe Prado, F., Ed.; Manual Moderno: Ciudad de México, México, 2018; pp. 89–108. [Google Scholar]
  4. Juárez-García, A.; Flores-Jiménez, C.A. Estructura Factorial de Un Instrumento Para La Evaluación de Procesos Psicosociales En El Trabajo En México. Rev. Psicol. Y Cienc. Comport. Unidad Académica Cienc. Jurídicas Y Soc. 2020, 11, 181–202. [Google Scholar] [CrossRef]
  5. Juárez-García, A.; Camacho-Ávila, A.; García-Rivas, J.; Gutiérrez-Ramos, O. Psychosocial Factors and Mental Health in Mexican Healthcare Workers during the COVID-19 Pandemic. Salud Ment. 2021, 44, 229–240. [Google Scholar] [CrossRef]
  6. Juárez-García, A.; Flores-Jiménez, C.-A.; Pelcastre-Villafuerte, B.-E. Factores Psicosociales Del Trabajo y Efectos Psicológicos En Comerciantes Informales En Morelos, México: Una Exploración Mixta Preliminar. Rev. Univ. Ind. Santander. Salud 2020, 52, 402–413. [Google Scholar] [CrossRef]
  7. Merino-Soto, C.; Juárez-García, A.; Salinas-Escudero, G.; Toledano-Toledano, F. Item-Level Psychometric Analysis of the Psychosocial Processes at Work Scale (PROPSIT) in Workers. Int. J. Environ. Res. Public Health 2022, 19, 7972. [Google Scholar] [CrossRef]
  8. Flores-Jiménez, C.A.; Juárez-García, A. Factores Psicosociales y Síndrome de Burnout En Instructores Comunitarios: Una Aproximación Desde Un Análisis Mixto. Rev. Mex. Sal. Trab. 2016, 8, 3–9. [Google Scholar]
  9. Juárez-García, A. Factores Psicosociales, Estrés y Salud En Distintas Ocupaciones: Un Estudio Exploratorio. Investig. En Salud 2007, 9, 57–64. [Google Scholar]
  10. Juárez-García, A.; Andrade, P. Redes Semánticas de Trabajo, Salud y Relaciones Interpersonales En El Ámbito Laboral de Diferentes Ocupaciones. Rev. Psicol. Soc. Y Pers. 2004, 1, 20–28. [Google Scholar]
  11. Demerouti, E.; Bakker, A.B. The Job Demands?Resources Model: Challenges for Future Research. SA J. Ind. Psychol. 2011, 37, 1–9. [Google Scholar] [CrossRef]
  12. Karasek, R.A. Karasek 1979 ASQ—Job Demands Job Redesign. Adm. Sci. Q 1979, 24, 285–308. [Google Scholar] [CrossRef]
  13. Siegrist, J. Contributions of Sociology to the Prediction of Heart Disease and Their Implications for Public Health. Eur. J. Public Health 1991, 1, 10–21. [Google Scholar] [CrossRef]
  14. Berry, J.W. Imposed Etics, Emics, and Derived Etics: Their Conceptual and Operational Status in Cross-Cultural Psychology. In Emics and Etics: The Insider/Outsider Debate; Sage Publications: Newbury Park, CA, USA, 1990. [Google Scholar]
  15. Bala, M.; Chalil, G.R.B.; Gupta, A. Emic and Etic: Different Lenses for Research in Culture: Unique Features of Culture in Indian Context. Manag. Labour Stud. 2012, 37, 45–60. [Google Scholar] [CrossRef]
  16. Niblo, D.M.; Jackson, M.S. Model for Combining the Qualitative Emic Approach with the Quantitative Derived Etic Approach. Aust. Psychol. 2004, 39, 127–133. [Google Scholar] [CrossRef]
  17. Solano-Flores, G.; Milbourn, T. Capacidad Evaluativa, Validez Cultural, y Validez Consecuencial En PISA. RELIEVE—Rev. Electrónica De Investig. Y Evaluación Educ. 2016, 22, 1–17. [Google Scholar] [CrossRef]
  18. ILO/WHO. Psychosocial Factors at Work: Recognition and Control; ILO: Geneva, Switzerland; WHO: Geneva, Switzerland, 1986. [Google Scholar]
  19. Green, J. 196 Health and Wellbeing—Work-Life Imbalance in Developing Countries. Occup. Environ. Med. 2018, 75. [Google Scholar] [CrossRef]
  20. Llamocuro-Mamani, P. Mental health in the Peruvian population during COVID-19. Cirugía y Cirujanos 2021, 89, 416–417. [Google Scholar] [CrossRef]
  21. Instituto Nacional de Salud (Perú). Informe Técnico Anual 2024 de Riesgos Psicosociales Laborales En El Perú (Informe No. 6462496). Available online: https://www.gob.pe/institucion/ins/informes-publicaciones/6462496-informe-tecnico-anual-2024-de-riesgos-psicosociales-laborales-en-el-peru (accessed on 7 September 2025).
  22. Paternina, I.L.P.; Pérez, M.L.M.; Villadiego, L.K.H.; Mendoza, M.A. Perspectives and Assessment of Psychosocial Risk in Latin America: A Systemic Review of the Literature. Gac. Med. Caracas 2022, 130, S674–S683. [Google Scholar] [CrossRef]
  23. Köhler, T.; Smith, A.; Bhakoo, V. Templates in Qualitative Research Methods: Origins, Limitations, and New Directions. Organ. Res. Methods 2022, 25, 183–210. [Google Scholar] [CrossRef]
  24. Boyatzis, R.E. Transforming Qualitative Information: Thematic Analysis and Code Development; Sage Publications: Thousand Oaks, CA, USA, 1998. [Google Scholar]
  25. Fereday, J.; Muir-Cochrane, E. Demonstrating Rigor Using Thematic Analysis: A Hybrid Approach of Inductive and Deductive Coding and Theme Development. Int. J. Qual. Methods 2006, 5, 80–92. [Google Scholar] [CrossRef]
  26. Pope, C. Qualitative Research in Health Care: Analysing Qualitative Data. BMJ 2000, 320, 114–116. [Google Scholar] [CrossRef]
  27. Bletzer, K.V. Visualizing the Qualitative: Making Sense of Written Comments from an Evaluative Satisfaction Survey. J. Educ. Eval. Health Prof. 2015, 12. [Google Scholar] [CrossRef]
  28. McNaught, C.; Lam, P. Using Wordle as a Supplementary Research Tool. Qual. Rep. 2010, 15, 630–643. [Google Scholar] [CrossRef]
  29. Hernández-Sampieri, R.; Mendoza, C. Metodología de la Investigación: Las Rutas Cuantitativa, Cualitativa y Mixta; McGraw Hill: Ciudad de México, México, 2018. [Google Scholar]
  30. Juárez-García, A.; Flores-Jiménez, C.A.; Monroy-Castillo, A. Metodología Para la Investigación con IA. Técnica Mixta Para La Investigación Psicosocial (TEMEP), 1st ed.; Terracota, Publicaciones UAEM: Cuernavaca, México, 2025; Volume 1. [Google Scholar]
  31. Stuckey, H. The Second Step in Data Analysis: Coding Qualitative Research Data. J. Soc. Health Diabetes 2015, 03, 007–010. [Google Scholar] [CrossRef]
  32. Fellows, I.; Fellows, M.I.; Rcpp, L.; Rcpp, L. Package ‘Wordcloud’. R Package Version 2018, 2, 331. [Google Scholar]
  33. Gwet, K.L. Computing Inter-rater Reliability and Its Variance in the Presence of High Agreement. Br. J. Math. Stat. Psychol. 2008, 61, 29–48. [Google Scholar] [CrossRef]
  34. R Core Team. R: A Language and Environment for Statistical Computing. (Version 4.4.1) [Computer Software]; R Foundation for Statistical Computing: Vienna, Austria, 2024; Available online: http://www.R-project.org (accessed on 7 September 2025).
  35. Gwet, K.L. IrrCAC: Computing Chance-Corrected Agreement Coefficients (CAC). R Package Version 2019, 1, 2019. [Google Scholar]
  36. Pujol-Cols, L.; Lazzaro-Salazar, M. Diez Años de Investigación Sobre Riesgos Psicosociales, Salud y Desempeño En América Latina: Una Revisión Sistemática Integradora y Agenda de Investigación. J. Work. Organ. Psychol. 2021, 37, 187–202. [Google Scholar] [CrossRef]
  37. Ng, C.S.M.; Chan, V.C.W. Prevalence of Workplace Bullying and Risk Groups in Chinese Employees in Hong Kong. Int. J. Environ. Res. Public Health 2021, 18, 329. [Google Scholar] [CrossRef]
  38. Awai, N.S.; Ganasegeran, K.; Abdul Manaf, M.R. Prevalence of Workplace Bullying and Its Associated Factors Among Workers in a Malaysian Public University Hospital: A Cross-Sectional Study. Risk Manag. Healthc. Policy 2021, 14, 75–85. [Google Scholar] [CrossRef]
  39. Nieto-Gutierrez, W.; Taype-Rondan, A.; Bastidas, F.; Casiano-Celestino, R.; Inga-Berrospi, F. Percepción de Médicos Recién Egresados Sobre El Internado Médico En Lima, Perú 2014. Acta Médica Peru. 2016, 33, 105–110. [Google Scholar] [CrossRef]
  40. Chaverri Chaves, P.; Fernández, I. Analysis of Economic Inequality from a Psychosocial Perspective: The Influence of Cultural Individualism-Collectivism. Rev. Rupturas 2024, 14, 145–171. [Google Scholar] [CrossRef]
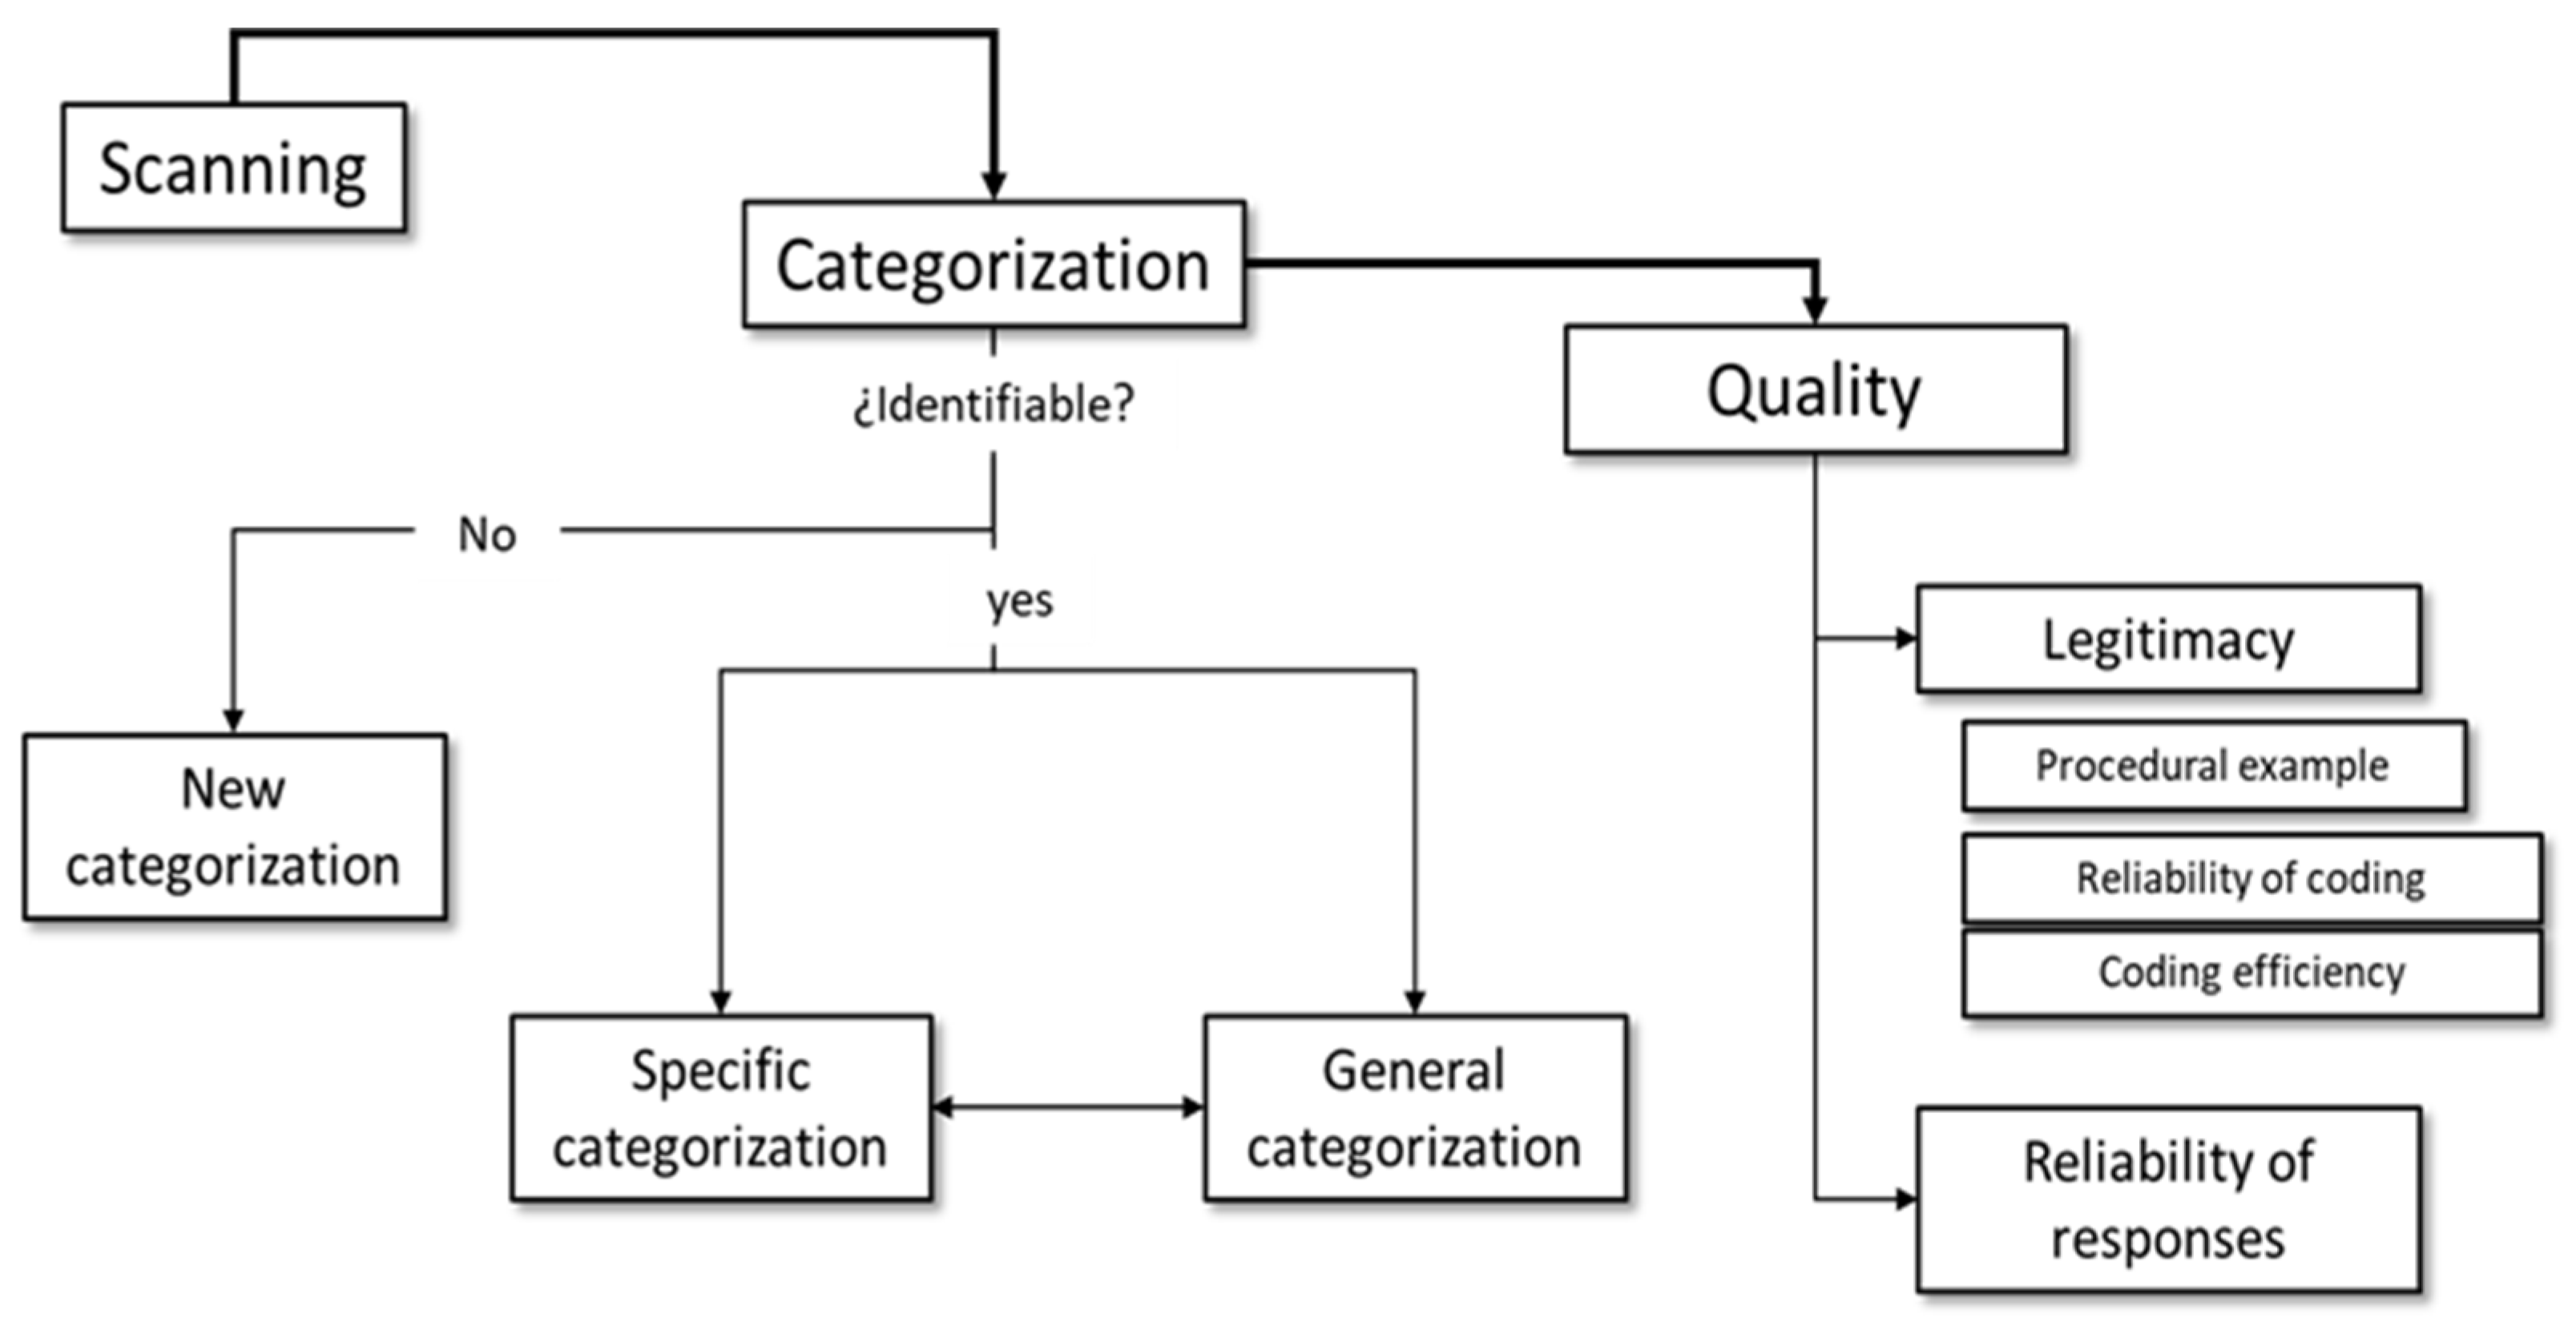
Figure 1. Visualization of coding process.
Hygiene 05 00043 g001
Figure 2. Word cloud of responses regarding the three stress triggers and emerging categories. Note: The figure shows word clouds generated from participant responses describing three different stressor groups, with all terms displayed in Spanish, the original language of data collection. The figure includes specific words or phrases reported for each stressor and highlights the main emergent categories across groups: Poor teamwork (Pobre trabajo en equipo), conflictive climate (Clima conflictivo), lack of detail (Sin detalles), unmotivating tasks (Tareas no motivantes), anxiety effect (Efecto ansiedad), physical fatigue effect (Efecto cansancio físico), effect on alertness (Efecto sobre la vigilancia), extra-work factor (Factor extra-laboral), and job insecurity (Inseguridad en el trabajo).
Hygiene 05 00043 g002
Figure 3. Word cloud of responses regarding the three drivers of engaging factors at work and emerging categories. Note: The figure shows word clouds generated from participant responses describing three different stressor groups, with all terms displayed in Spanish, the original language of data collection. The figure includes specific words or phrases reported for each stressor and highlights the main emergent categories across groups: Recreation (Recreación), Cleaning/Tidying (Limpieza/Orden), Food (Alimentos), Lack of detail (Sin detalle).
Hygiene 05 00043 g003
Table 1. Descriptive information about the participants.
N%
Sex
Male2960.4
Female1939.6
Marital status
Single3777.1
Married510.4
Cohabiting510.4
Widowed12.1
Place of birth
Lima3368.8
Outside Lima1429.2
No data12.1
Educational level
Secondary school816.7
Technical (CTE) (<3 years)48.3
Technical (CTE) (3 years)1939.6
University1735.4
Occupation
White collar125.76
Manufacturing workers2143.75
Customer service workers918.75
Others612.50
M (Md)SD (Min, Max)
Job seniority36.51 (12)49.3 (3, 24)
Age26.5 (25.0)7.4 (18, 56)
Weekly hours49.3 (48)15.0 (7, 84)
Note: M = Mean, Md = Median, SD = Standar Deviation, Min = Minimum, Max = Maximum.
Table 2. Coding efficiency of stressors.
Stressor 1Stressor 2Stressor 3
N%N%N%
Efficiency
3
Immediate
36.33675.03879.2
2
Moderate iterative
2654.2816.7510.4
1
Intense iterative
1735.412.1--
No response24.236.3510.4
Monotonic association a
Stressor 1------
Stressor 20.26 ns ----
Stressor 30.47 ns 0.53 * --
Note. a Associations are gamma coefficients. ns: statistically non-significant. * p < 0.05.
Table 3. Efficiency of engaging factors coding.
Engaging
Factor 1
Engaging
Factor 2
Engaging
Factor 3
N%N%N%
Efficiency
3
Immediate
4695.84491.74491.7
2
Moderate iterative
0024.224.2
1
Intense iterative
12.10000
No response12.124.224.2
Ordinal association a
Engaging factor 1------
Engaging factor 21.0 b ----
Engaging factor 31.0 b 1.0 --
Note a Gamma coefficients. b Gamma coefficients without discrepant data.
Table 4. Frequency of psychosocial risk factor categories.
CategoriesStressor 1
(n = 46)
Stressor 2
(n = 45)
Stressor 3
(n = 44)
N%RN%RN%R
Workload and work pace1430.42816.72920.52
High responsibility and dangerousness12.2748.3524.56
Working hours, shifts or schedules48.7336.36613.63
Cognitive demands00.0900.01024.56
Emotional (dealing with people)48.73510.4324.56
Physical effort00.0912.1900.010
Physical environment48.73510.43511.44
Harassment by supervisors00.0900.01000.010
Harassment by colleagues and subordinates00.0900.01000.010
Controlling supervision48.7324.2736.85
Negative/inadequate feedback from supervisor12.2724.2724.56
Unclassifiable (new categories)1532.611531.311227.31
Note. The table describes the frequencies of each identified psychosocial risk factor category reported by participants in three different stressor groups. For each category, the table shows the number of responses (N), the percentage of responses (%), and its ranking (R) within each group (with 1 assigned to the highest frequency).
Table 5. Prevalence of stressor classification.
DistributionStressor 1
(n = 46)
Stressor 2
(n = 45)
Stressor 3
(n = 44)
Frequent
(≥10.0%)
  • Workload and work pace
  • Unclassifiable (new categories)
  • Workload and work pace
  • Emotional (dealing with people)
  • Physical environment
  • Unclassifiable (new categories)
  • Workload and work pace
  • Working hours, shifts or schedules
  • Physical environment
  • Unclassifiable (new categories)
Somewhat frequent
(>0.0%)
  • High responsibility and dangerousness
  • Working hours, shifts or schedules
  • Emotional (dealing with people)
  • Physical environment
  • Controlling supervision
  • Negative/inadequate feedback from supervisor
  • High responsibility and dangerousness
  • Working hours, shifts or schedules
  • Physical effort
  • Physical environment
  • Controlling supervision
  • Negative/inadequate feedback from supervisor
  • High responsibility and dangerousness
  • Cognitive demands
  • Emotional (dealing with people)
  • Controlling supervision
  • Negative/inadequate feedback from supervisor
Infrequent
(0.0.%)
  • Cognitive demands
  • Physical effort
  • Harassment by superiors
  • Harassment by colleagues and subordinates
  • Cognitive demands
  • Harassment by superiors
  • Harassment by colleagues and subordinates
  • Physical effort
  • Harassment by superiors
  • Harassment by colleagues and subordinates
Note. The table shows the distribution of psychosocial risk factor categories by prevalence level across three different stressor groups. Categories are classified as Frequent (≥10.0%), Somewhat frequent (>0.0%), or Infrequent (0.0%) within each group. This classification is derived from the frequencies reported in Table 4.
Table 6. Prevalence of the classification of engaging factors at work.
CategoriesEngaging
Factor 1
(n = 47)
Engaging
Factor 2
(n = 46)
Engaging
Factor 3
(n = 46)
N%Rnk N%RnkN%Rnk
Organizational justice00.0%9 00.0%13 00.0%11
Motivating Salary24.3%7 36.5%6 36.3%6
Recognition for work24.3%7 12.2%9 714.6%2
Job and professional development opportunities (status)00.0%9 36.5%6 24.2%8
Job security or stability00.0%9 00.0%13 00.0%11
Rewarding and meaningful task1021.3%2 613.0%3 510.4%4
Influence/autonomy at work48.5%6 510.9%4 12.1%9
Use of skills at work00.0%9 12.2%9 12.1%9
Varied work (not monotonous)00.0%9 00.0%13 00.0%11
Clear functions and roles00.0%9 12.2%9 00.0%11
Material resources, equipment, and tools00.0%9 12.2%9 00.0%11
Training and education510.6%4 24.3%8 36.3%6
Support from colleagues510.6%4 919.6%1 00.0%11
Support from supervisors00.0%9 00.0%13 48.3%5
Atmosphere of unity1327.7%1 817.4%2 714.6%2
Unclassifiable (new categories)612.8%3 510.4%4 918.8%1
Note. The table shows the prevalence of various engaging factors at work, as reported by participants across three different groups. For each factor, the table shows the number of responses (N), the percentage of responses (%), and its ranking (Rnk) within each group (with 1 assigned to the highest frequency).
Table 7. Redistribution of the classification of engaging factors.
DistributionEngaging Factor 1
(n = 47)
Engaging Factor 2
(n = 46)
Engaging Factor 3
(n = 46)
Frequent
(≥10.0%)
  • Rewarding and meaningful task
  • Training and education
  • Support from colleagues
  • Atmosphere of unity
  • Unclassifiable (new categories)
  • Rewarding and meaningful task
  • Influence/autonomy at work
  • Support from colleagues
  • Atmosphere of unity
  • Unclassifiable (new categories)
  • Recognition for work
  • Rewarding and meaningful task
  • Atmosphere of unity
  • Unclassifiable (new categories)
Somewhat frequent
(>0.0%)
  • Motivating Salary
  • Recognition for work
  • Influence/autonomy at work
  • Motivating Salary
  • Recognition for work
  • Job and professional development opportunities (status)
  • Use of skills at work
  • Clear functions and roles
  • Material resources, equipment, and tools
  • Training and education.
  • Motivating Salary
  • Job and professional development opportunities (status
  • Influence/autonomy at work
  • Use of skills at work
  • Training and education
  • Supervisor support
Infrequent
(0.0%)
  • Organizational justice
  • Job and professional development opportunities (status)
  • Job security or stability
  • Use of skills at work
  • Varied work (not monotonous)
  • Clear functions and roles
  • Material resources, equipment, and tools
  • Supervisor support
  • Organizational justice
  • Job security or stability
  • Varied work (not monotonous)
  • Supervisor support
  • Organizational justice
  • Job security or stability
  • Varied work (not monotonous)
  • Clear functions and roles
  • Material resources, equipment, and tools
  • Support from colleagues
Note. The table shows the redistribution of engaging factors at work by prevalence level across three different participant groups. Categories are classified as Frequent (≥10.0%), Somewhat frequent (>0.0%), or Infrequent (0.0%) within each group. This distribution is derived from the data presented in Table 6.
Table 8. Association between the rankings (Rnk) of stressors and engaging factors at work.
Stressors
Rnk Stressor 1Rnk Stressor 2Rnk Stressor 3
Rnk stressor f 11
Rnk stressor f 20.911
Rnk stressor f 30.920.801
Engaging factors
Rnk engaging f 1Rnk engaging f 2Rnk engaging f 3
Rnk engaging f 11
Rnk engaging f 20.831
Rnk engaging f 30.630.421
Note: The table shows the association between the rankings (Rnk) of stressor factors (stressor f) and engaging factors (engaging f) at work. The table presents correlation coefficients comparing the ranking patterns among the three stressor groups and the three engaging factor groups.
Disclaimer/Publisher’s Note: The statements, opinions and data contained in all publications are solely those of the individual author(s) and contributor(s) and not of MDPI and/or the editor(s). MDPI and/or the editor(s) disclaim responsibility for any injury to people or property resulting from any ideas, methods, instructions or products referred to in the content.