
The Growth Potential of Bacillus cereus in Ready-to-Reheat Vegetable Soups

 , and
, and
Abstract
:1. Introduction
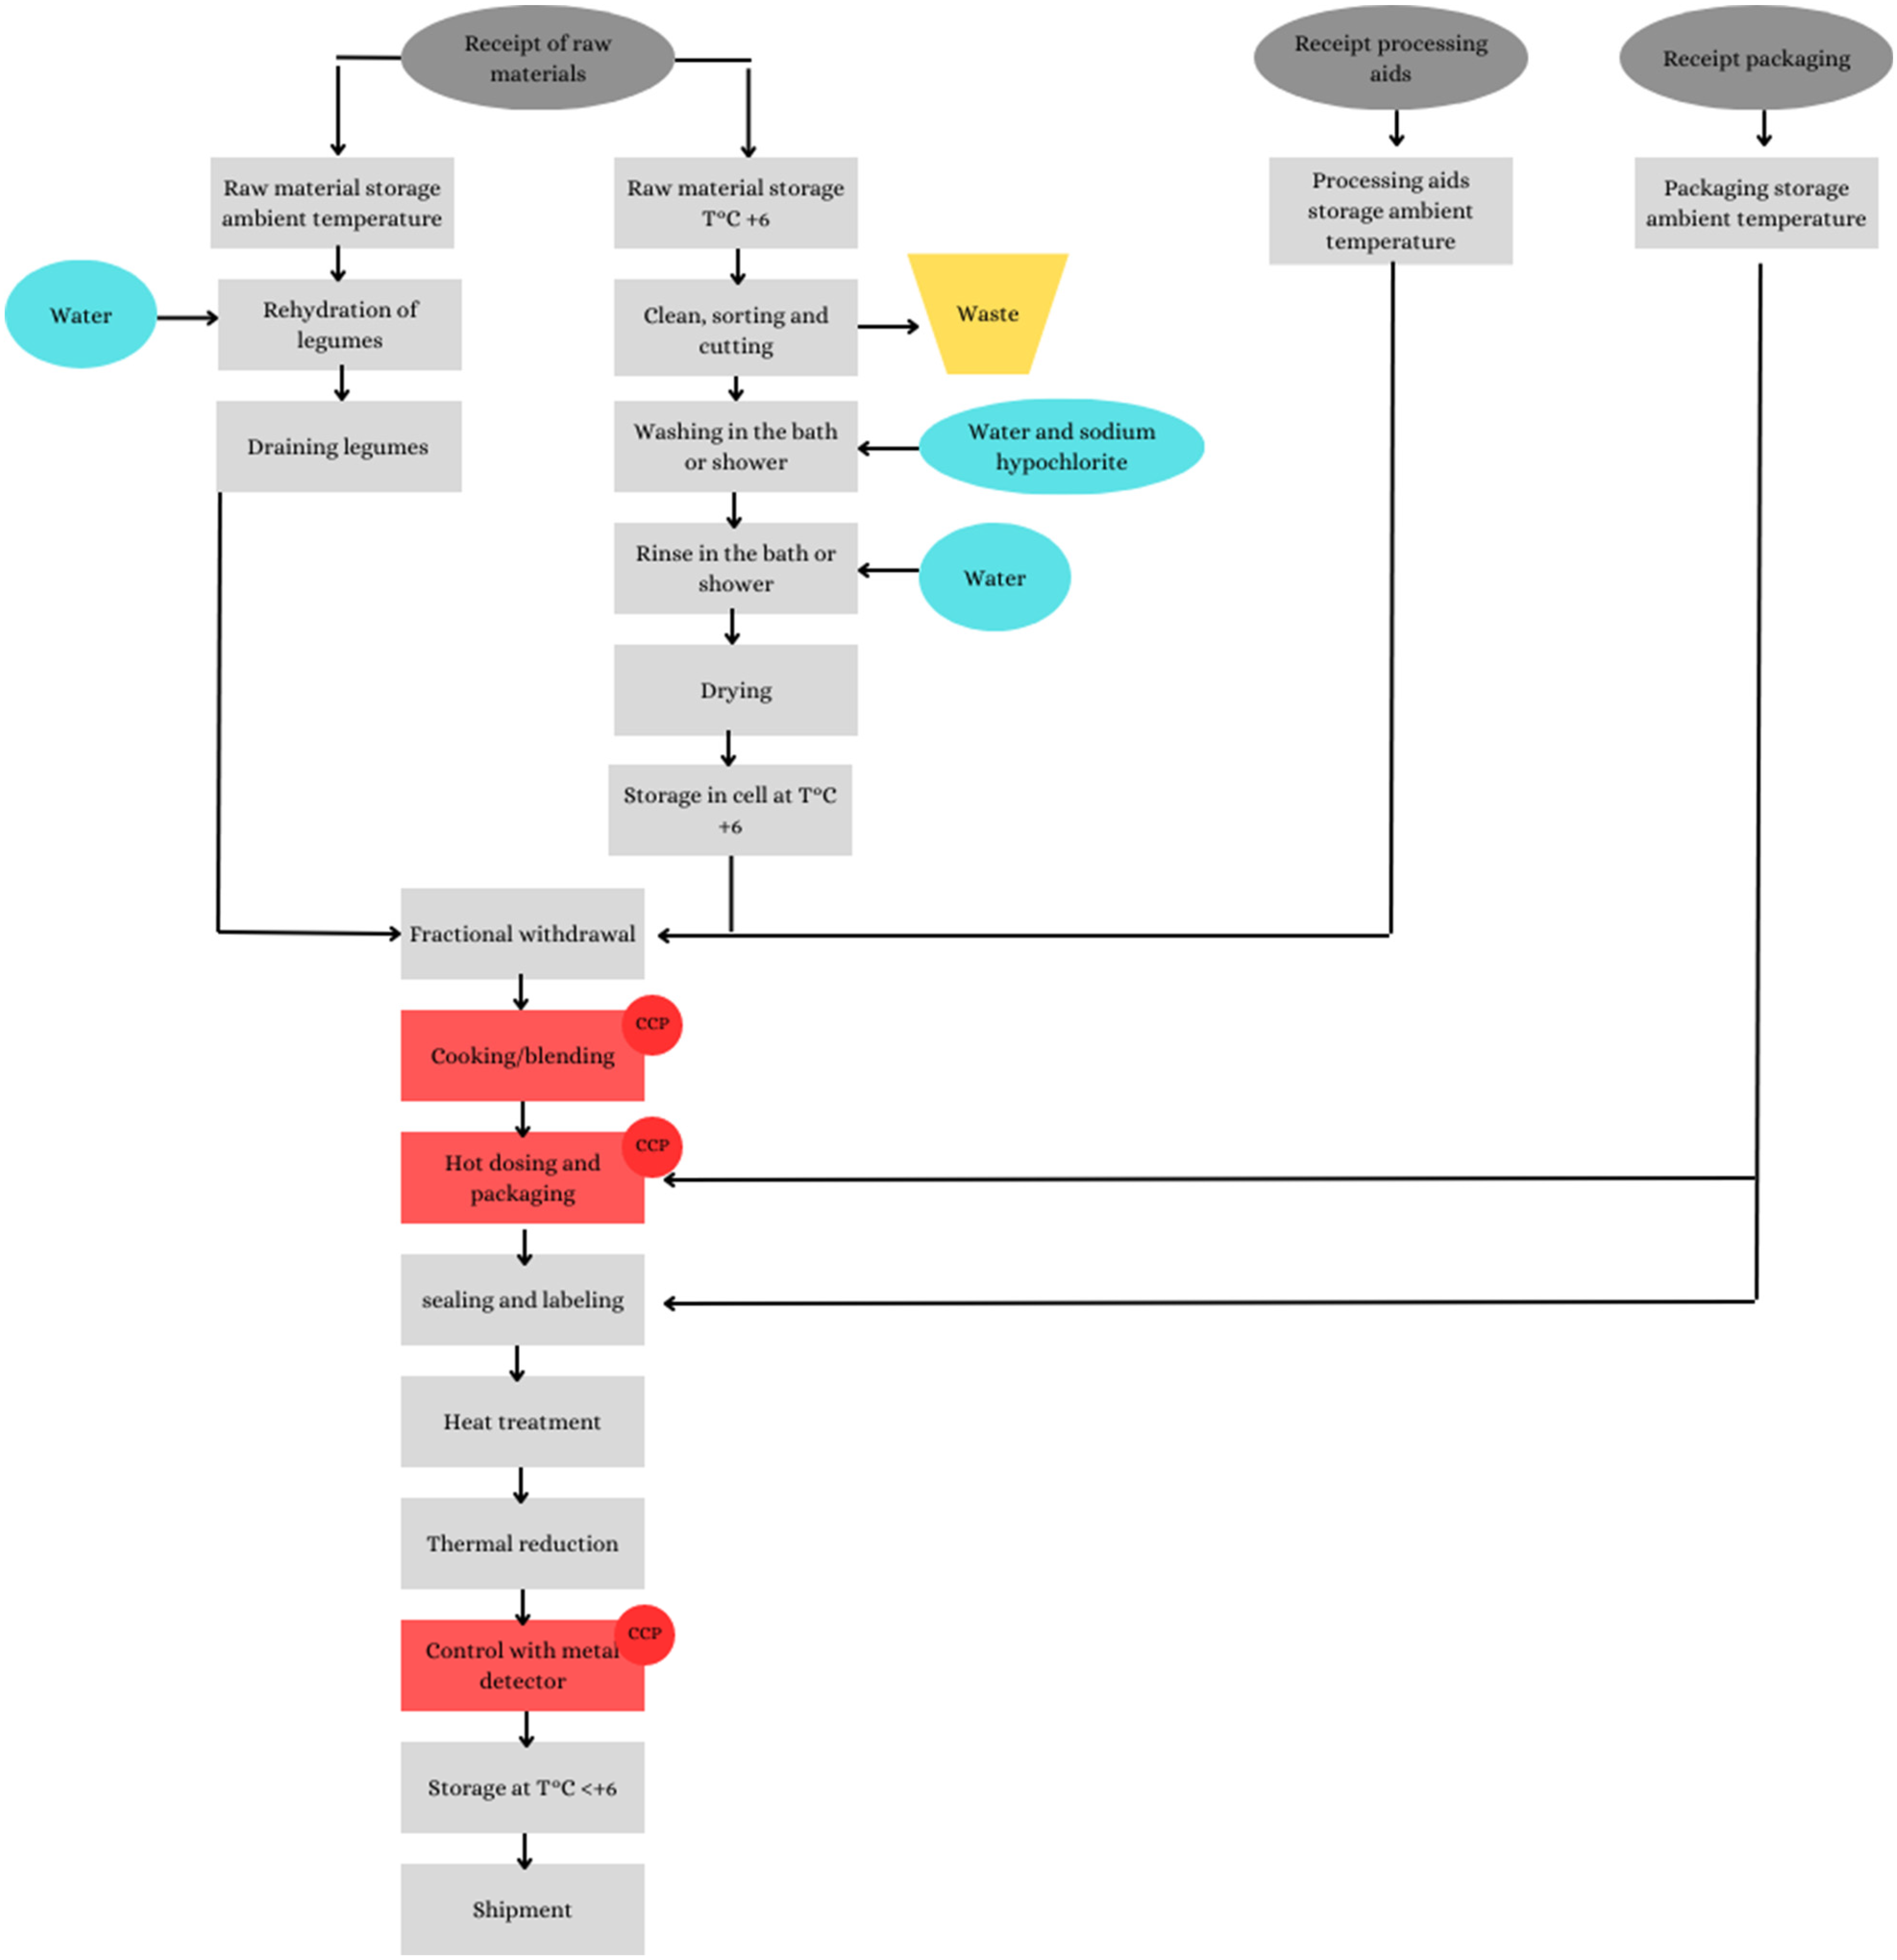
1.1. The Production Process and Its Influence on the Soup Microbiota
1.2. Bacillus Cereus as Foodborne Disease Agent
2. Materials and Methods
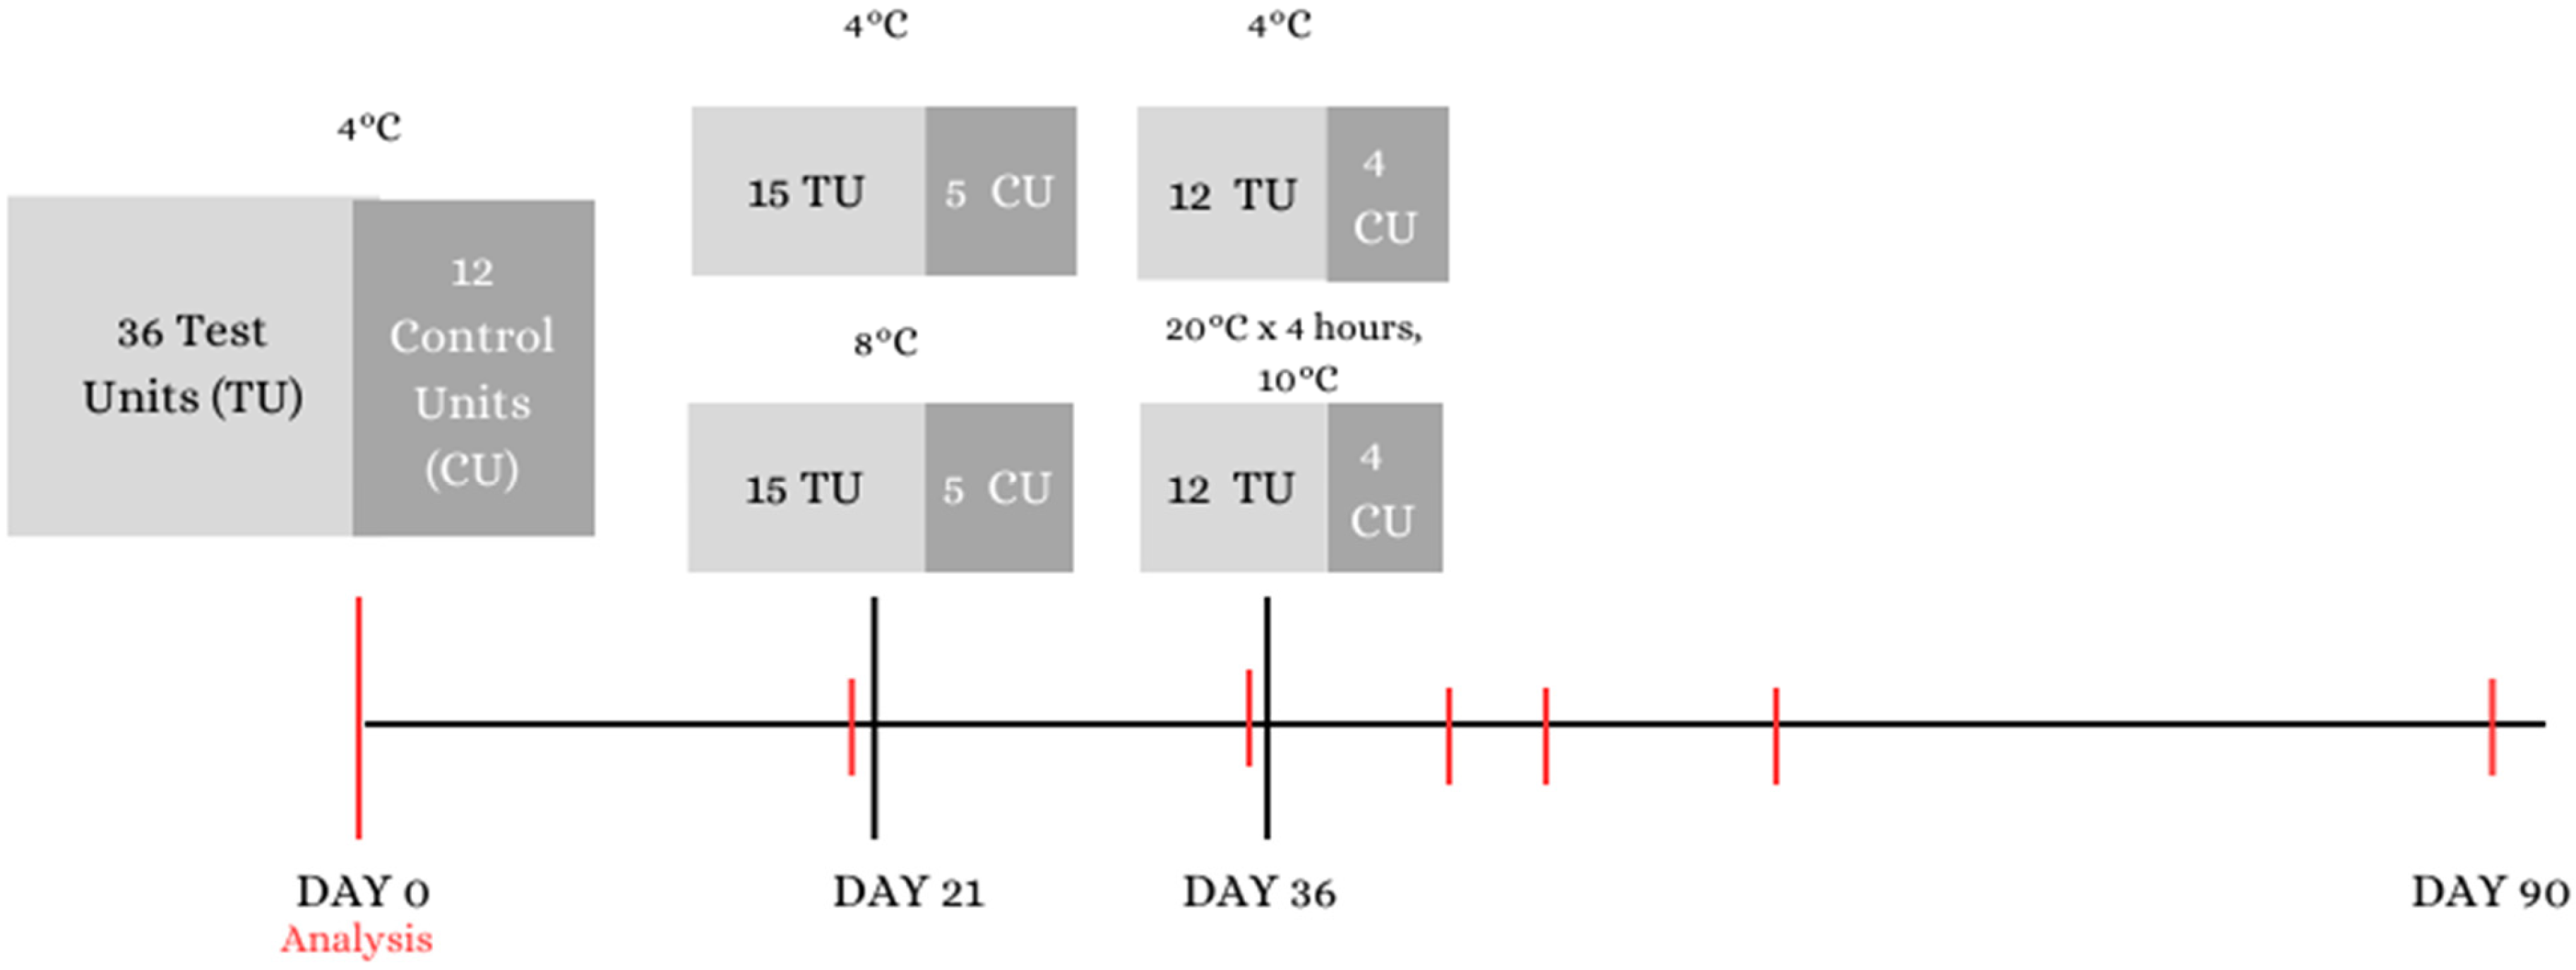
2.1. Challenge Test Design
2.2. Determination of the Inter-Batch Variability of Emmer and Vegetable Soup
2.3. Selection of the Strains to Be Inoculated
- A “wild” strain of B. cereus isolated from the same type of soup subjected to our challenge test, and from the same manufacturer. It was biochemically identified as B. cereus/Bacillus thuringiensis using the BIOLOG® system (BIOLOG Inc. 21124 Cabot Blvd., Hayward, CA, USA). The correct identification of B. cereus was then completed by evaluating, with a microscope and Gram stain, the absence of parasporal crystals in the cytoplasm of the cells, which are typical of B. thuringiensis.
2.4. Preparation of the Suspensions of the Vegetative Cells to Be Inoculated
2.5. Test Units and Control Units
2.6. Storage Conditions
- Up to the 20th test day the soups were stored at +4 °C and this situation represented storage from the manufacture to retail where there are reasonably no temperature abuses;
- From the 21st to the 35th day the bowls were kept at +8 °C to mimic retail storage;
- From the 36th day the samples were moved to +20 °C for 4 h and then to +10 °C for the rest of the test. This last situation represented the moment of transport from retail to the consumer’s home and then storage by the consumer.
2.7. Analytical Parameters
2.8. Statistical Analysis
3. Results and Discussion
- The control units of the 3 analyzed batches showed variable pH values from one batch to another (pH 6.12 in batch 1, pH 6.49 in batch 2, pH 6.34 in batch 3). In the inoculated test units and maintained regularly at 4 °C, we detected only a very slight increase of the pH value in all three batches analyzed. In the test units maintained in conditions of thermal abuse, on the other hand, we found a rather marked increase in pH in the test units of batch 1 while the pH remained practically constant in batches 2 and 3;
- The redox potential always showed positive values, indicating the aerobic condition of the substrate. The recorded value tended to decrease during storage, especially in batch 1;
- The aw value of the soups subject to the challenge test remained practically unchanged (0.98–0.99) throughout the test in all three batches of soup;
- As regards the TVC, in the three batches of soup analyzed, at the beginning of the challenge we recorded values below the detection limit of the method (<10 CFU/g).
4. Conclusions
Author Contributions
Funding
Institutional Review Board Statement
Informed Consent Statement
Data Availability Statement
Conflicts of Interest
References
- Fern, J.; Botella-Mart, C.; Navarro-Rodr, C.; Vera, D.; Viuda-Martos, M.; Elena, S.; Angel, P. Vegetable Soups and Creams: Raw Materials, Processing, 9, Health Benefits, and Innovation Trends. Plants 2020, 9, 1769. [Google Scholar]
- ISTAT (Istituto Nazionale di Statistica). Annuario Statistico Italiano; ISTAT: Rome, Italy, 2020; p. XXIV+802. ISBN 978-88-458-2066-3. [Google Scholar]
- Fulton, M. Margaret Fulton’s Encyclopedia of Food and Cookery; Hardie Grant Books: Richmond, VA, USA, 2009; p. 17. ISBN 978-1-74273-231-2. [Google Scholar]
- Smith, A. The Oxford Encyclopedia of Food and Drink in America; OUP USA: Oxford, UK, 2013; p. 242. ISBN 978-0-19-973496-2. [Google Scholar]
- Nielsen, Osservatorio Immagino. 2021. Available online: https://servizi.gs1it.org/osservatori/osservatorio-immagino-10/ (accessed on 2 August 2023).
- Colavita, G. Igiene e Tecnologie Degli Alimenti; Point Vètèrinaire Italie Autore: Milano, Italy, 2023; ISBN 8899211795. [Google Scholar]
- Ghosh, S.; Setlow, P. The preparation, germination properties and stability of superdormant spores of Bacillus cereus. J. Appl. Microbiol. 2010, 108, 582–590. [Google Scholar] [CrossRef] [PubMed]
- Jung, M.-Y.; Paek, W.K.; Park, I.-S.; Han, J.-R.; Sin, Y.; Paek, J.; Rhee, M.-S.; Kim, H.; Song, H.S.; Chang, Y.-H. Bacillus gaemokensis sp. nov., isolated from foreshore tidal flat sediment from the Yellow Sea. J. Microbiol. 2010, 48, 867–871. [Google Scholar] [CrossRef] [PubMed]
- Jung, M.Y.; Kim, J.-S.; Paek, W.K.; Lim, J.; Lee, H.; Kim, P.I.; Ma, J.Y.; Kim, W.; Chang, Y.-H. Bacillus manliponensis sp. nov., a new member of the Bacillus cereus group isolated from foreshore tidal flat sediment. J. Microbiol. 2011, 49, 1027–1032. [Google Scholar] [CrossRef] [PubMed]
- Jiménez, G.; Urdiain, M.; Cifuentes, A.; López-López, A.; Blanch, A.R.; Tamames, J.; Kämpfer, P.; Kolstø, A.-B.; Ramón, D.; Martínez, J.F.; et al. Description of Bacillus toyonensis sp. nov., a novel species of the Bacillus cereus group, and pairwise genome comparisons of the species of the group by means of ANI calculations. Syst. Appl. Microbiol. 2013, 36, 383–391. [Google Scholar] [CrossRef]
- Liu, B.; Liu, G.-H.; Hu, G.-P.; Cetin, S.; Lin, N.-Q.; Tang, J.-Y.; Tang, W.-Q.; Lin, Y.-Z. Bacillus bingmayongensis sp. nov., isolated from the pit soil of Emperor Qin’s Terra-cotta warriors in China. Antonie van Leeuwenhoek 2014, 105, 501–510. [Google Scholar] [CrossRef]
- Liu, Y.; Lai, Q.; Göker, M.; Meier-Kolthoff, J.P.; Wang, M.; Sun, Y.; Wang, L.; Shao, Z. Genomic insights into the taxonomic status of the Bacillus cereus group. Sci. Rep. 2015, 5, srep14082. [Google Scholar] [CrossRef]
- Stenfors Arnesen, L.P.; Fagerlund, A.; Granum, P.E. From soil to gut: Bacillus cereus and its food poisoning toxins. FEMS Microbiol. Rev. 2008, 32, 579–606. [Google Scholar] [CrossRef]
- Stenfors, L.P.; Mayr, R.; Scherer, S.; Granum, P.E. Pathogenic potential of fifty Bacillus weihenstephanensis strains. FEMS Microbiol. Lett. 2002, 215, 47–51. [Google Scholar] [CrossRef]
- Thorsen, L.; Hansen, B.M.; Nielsen, K.F.; Hendriksen, N.B.; Phipps, R.K.; Budde, B.B. Characterization of Emetic Bacillus weihenstephanensis, a New Cereulide-Producing Bacterium. Appl. Environ. Microbiol. 2006, 72, 5118–5121. [Google Scholar] [CrossRef]
- Thorsen, L.; Budde, B.B.; Henrichsen, L.; Martinussen, T.; Jakobsen, M. Cereulide formation by Bacillus weihenstephanensis and mesophilic emetic Bacillus cereus at temperature abuse depends on pre-incubation conditions. Int. J. Food Microbiol. 2009, 134, 133–139. [Google Scholar] [CrossRef] [PubMed]
- Glasset, B.; Herbin, S.; Guillier, L.; Cadel-Six, S.; Vignaud, M.-L.; Grout, J.; Pairaud, S.; Michel, V.; Hennekinne, J.-A.; Ramarao, N.; et al. Bacillus cereus-induced food-borne outbreaks in France, 2007 to 2014: Epidemiology and genetic characterisation. Eurosurveillance 2016, 21, 30413. [Google Scholar] [CrossRef] [PubMed]
- Glasset, B.; Herbin, S.; Granier, S.A.; Cavalié, L.; Lafeuille, E.; Guérin, C.; Ruimy, R.; Casagrande-Magne, F.; Levast, M.; Chautemps, N.; et al. Bacillus cereus, a serious cause of nosocomial infections: Epidemiologic and genetic survey. PLoS ONE 2018, 13, e0194346. [Google Scholar] [CrossRef] [PubMed]
- Hornstra, L.M.; van der Voort, M.; Wijnands, L.M.; Hil, P.J.R.-V.D.; Abee, T. Role of Germinant Receptors in Caco-2 Cell-Initiated Germination of Bacillus cereus ATCC 14579 Endospores. Appl. Environ. Microbiol. 2009, 75, 1201–1203. [Google Scholar] [CrossRef]
- Vidic, J.; Chaix, C.; Manzano, M.; Heyndrickx, M. Food Sensing: Detection of Bacillus cereus Spores in Dairy Products. Biosensors 2020, 10, 15. [Google Scholar] [CrossRef]
- Pawluk, A.M.; Kim, D.; Jin, Y.H.; Jeong, K.C.; Mah, J.-H. Biofilm-associated heat resistance of Bacillus cereus spores in vitro and in a food model, Cheonggukjang jjigae. Int. J. Food Microbiol. 2022, 363, 109505. [Google Scholar] [CrossRef]
- Guo, H.; Yu, P.; Yu, S.; Wang, J.; Zhang, J.; Zhang, Y.; Liao, X.; Wu, S.; Ye, Q.; Yang, X.; et al. Incidence, toxin gene profiling, antimicrobial susceptibility, and genetic diversity of Bacillus cereus isolated from quick-frozen food in China. LWT-Food Sci. Technol. 2021, 140, 110824. [Google Scholar] [CrossRef]
- Tuipulotu, D.E.; Mathur, A.; Ngo, C.; Man, S.M. Bacillus cereus: Epidemiology, Virulence Factors, and Host–Pathogen Interactions. Trends Microbiol. 2021, 29, 458–471. [Google Scholar] [CrossRef]
- Giaccone, V.; Colavita, G. Principi di Microecologia Degli Alimenti; Point Vètèrinaire Italie Autore: Milano, Italy, 2015; ISBN 9788895995748. [Google Scholar]
- Jessberger, N.; Dietrich, R.; Granum, P.E.; Märtlbauer, E. The Bacillus cereus Food Infection as Multifactorial Process. Toxins 2020, 12, 701. [Google Scholar] [CrossRef]
- ISO 20976-1:2019; Microbiology of the Food Chain—Requirements and Guidelines for Conducting Challenge Tests of Food and Feed Prod-ucts—Part 1: Challenge Tests to Study Growth Potential, Lag Time and Maximum Growth Rate. ISO: London, UK, 2019; ICS: 07.100.30.
- EURL (European Union Reference Laboratory for Listeria Monocytogenes). Calculator Inter-Batch Variability. Available online: https://eurl-listeria.anses.fr/en/minisite/listeria/european-union-reference-laboratory-listeria-monocytogenes-0 (accessed on 27 March 2023).
- ISO 7932:2020; Microbiology of Food and Feed for Animals—Horizontal Method for the Presumed Bacillus cereus Count—Colony Count Technique at 30 °C. ISO: London, UK, 2019; ICS: 07.100.30.
- ISO 4833-1:2022; Microbiology of the Food Chain—Horizontal Method for the Enumeration of Microorganisms—Part 1: Colony Count at 30 °C by the Pour Plate Technique. ISO: London, UK, 2019; ICS: 07.100.30.
- Italianfood.Net. Why Ready-to-Eat Soups Sales Are Booming. 2020. Available online: https://news.italianfood.net/2020/10/21/why-ready-to-eat-soups-sales-are-booming/ (accessed on 27 March 2023).
- The Vegan Society. Worldwide Growth of Veganism. Available online: https://www.vegansociety.com/news/media/statistics/worldwide (accessed on 2 August 2023).
- Rahnama, H.; Azari, R.; Yousefi, M.H.; Berizi, E.; Mazloomi, S.M.; Hosseinzadeh, S.; Derakhshan, Z.; Ferrante, M.; Conti, G.O. A systematic review and meta-analysis of the prevalence of Bacillus cereus in foods. Food Control 2023, 143, 109250. [Google Scholar] [CrossRef]
- Ehling-Schulz, M.; Frenzel, E.; Gohar, M. Food–bacteria interplay: Pathometabolism of emetic Bacillus cereus. Front. Microbiol. 2015, 6, 704. [Google Scholar] [CrossRef] [PubMed]
- Eskandani, M.A.; Misaghi, A.; Akhondzadeh-Basti, A.; Zahraei-Salehi, T.; Bokaie, S.; Noori, N. Effect of Zataria multiflora Boiss. Essential oil on the growth of Bacillus cereus ATCC 11778 in a commercial barley soup. J. Vet. Res. 2009, 64, 29–32. [Google Scholar]
- Webb, M.D.; Barker, G.C.; Goodburn, K.E.; Peck, M.W. Risk presented to minimally processed chilled foods by psychrotrophic Bacillus cereus. Trends Food Sci. Technol. 2019, 93, 94–105. [Google Scholar] [CrossRef] [PubMed]


| Time | Batch Number | Temperature (°C) | μ TVC Log10 CFU/g | μ pH Value | μ Redox Value (mV) | μ aw Value |
|---|---|---|---|---|---|---|
| T0 | Batch 1 | 4 | <1 | 6.12 | +50 | 0.987 |
| Batch 2 | 4 | <1 | 6.49 | +21 | 0.996 | |
| Batch 3 | 4 | <1 | 6.34 | +25 | 0.986 | |
| T6 (day 90) | Batch 1 | 4 | 3.20 | 6.14 | +40 | 0.993 |
| / | 10 | 6.26 | 6.44 | +39 | 0.992 | |
| Batch 2 | 4 | <1 | 6.55 | +15 | 0.990 | |
| / | 10 | 2.88 | 6.49 | +12 | 0.984 | |
| Batch 3 | 4 | <1 | 6.42 | +21 | 0.992 | |
| / | 10 | 3.51 | 6.39 | +22 | 0.992 |
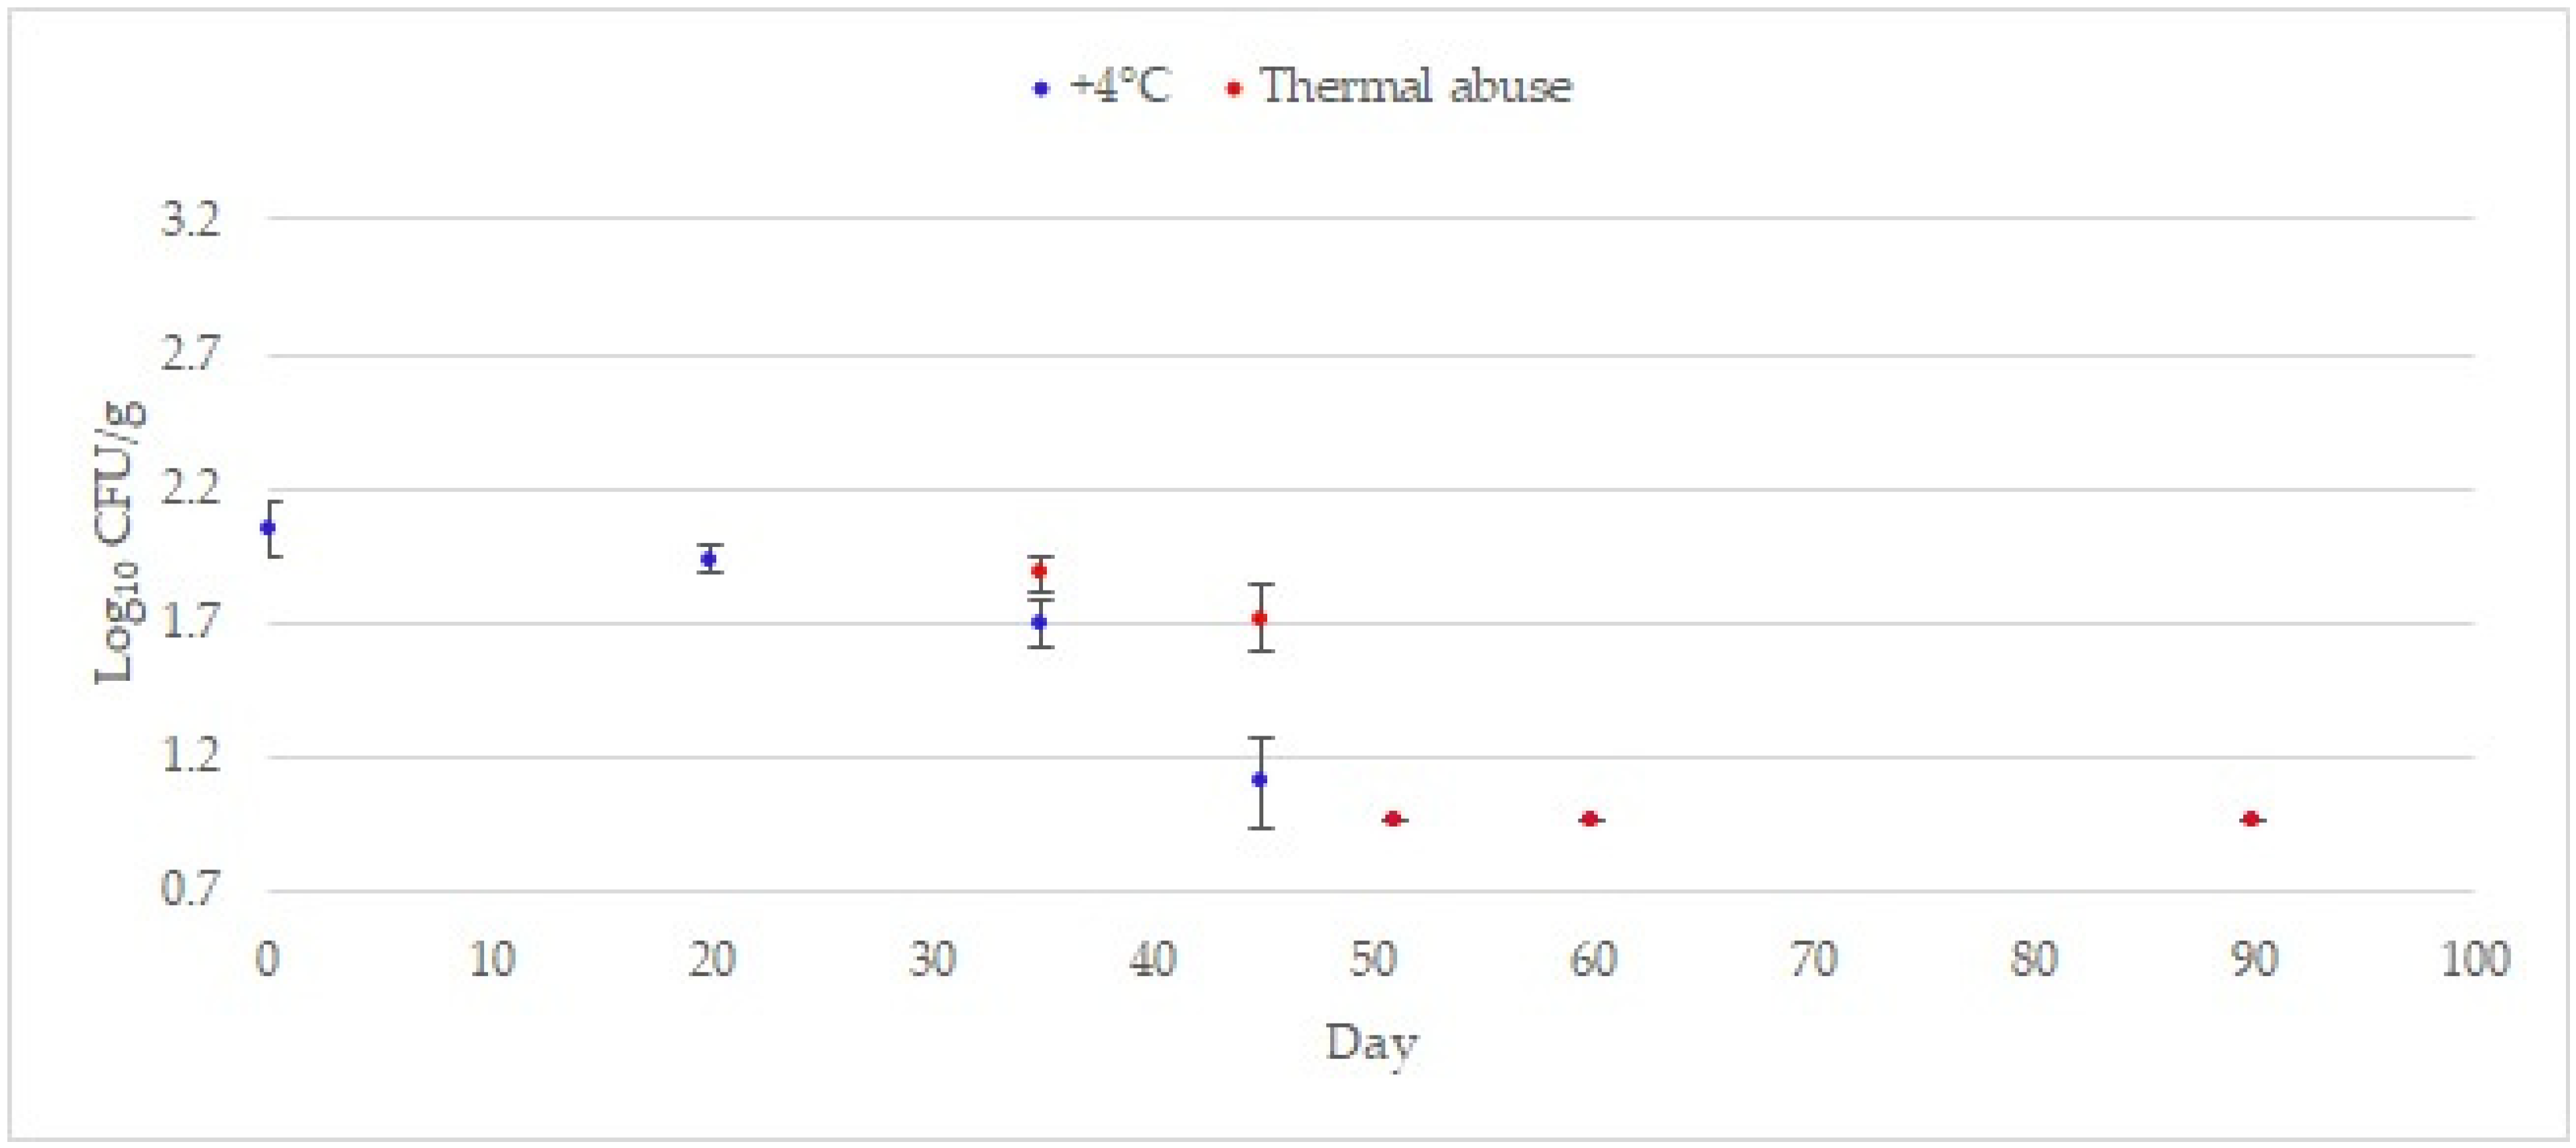
| Batch 1 | μ B. cereus Log10 CFU/g +4 °C | μ B. cereus Log10 CFU/g +8/10 °C |
|---|---|---|
| T0 | 2.25 ± 0 05 a | / |
| T1 (day 20) | 1.77 ± 0 07 b | / |
| T2 (day 35) | 1.50 ± 0 17 c | 2.25 ± 0 07 c |
| T3 (day 45) | <1 ± 0 03 d | 2.62 ± 0 07 b |
| T4 (day 51) | <1 ± 0 00 d | 3.07 ± 0 08 a |
| T5 (day 60) | <1 ± 0 00 d | 2.49 ± 0 17 b,c |
| T6 (day 90) | <1 ± 0 00 d | 1.65 ± 0 16 d |
| Batch 2 | μ B. cereus Log10 CFU/g +4 °C | μ B. cereus Log10 CFU/g +8/10 °C |
|---|---|---|
| T0 | 2.23 ± 0.05 a | / |
| T1 (day 20) | 2.12 ± 0.02 a | / |
| T2 (day 35) | 1.92 ± 0.08 b | 2.05 ± 0.10 a,b |
| T3 (day 45) | 1.59 ± 0.11 c | 1.76 ± 0 14 b |
| T4 (day 51) | <1 ± 0.00 d | 1.78 ± 0.16 b |
| T5 (day 60) | <1 ± 0.00 d | 1.72 ± 0.10 b,c |
| T6 (day 90) | <1 ± 0.00 d | 1.32 ± 0.28 c |
| Batch 3 | μ B. cereus Log10 CFU/g +4 °C | μ B. cereus Log10 CFU/g +8/10 °C |
|---|---|---|
| T0 | 2.05 ± 0.10 a | / |
| T1 (day 20) | 1.94 ± 0.06 a | / |
| T2 (day 35) | 1.69 ± 0.09 b | 1.88 ± 0.06 a,b |
| T3 (day 45) | 1.10 ± 0.17 b | 1.72 ± 0.12 b |
| T4 (day 51) | <1 ± 0.00 c | <1 ± 0.00 c |
| T5 (day 60) | <1 ± 0.00 c | <1 ± 0.00 c |
| T6 (day 90) | <1 ± 0.00 c | <1 ± 0.00 c |
| Batch | Temperature (°C) | Log10 Max–Log10 i | δ (Log 10) |
|---|---|---|---|
| Batch 1 | +4 °C +10 °C | 2.26–2.26 3.08–2.26 | 0 0.82 |
| Batch 2 | +4 °C +10 °C | 2.23–2.23 2.23–2.23 | 0 0 |
| Batch 3 | +4 °C +10 °C | 2.05–2.05 2.05–2.05 | 0 0 |
Disclaimer/Publisher’s Note: The statements, opinions and data contained in all publications are solely those of the individual author(s) and contributor(s) and not of MDPI and/or the editor(s). MDPI and/or the editor(s) disclaim responsibility for any injury to people or property resulting from any ideas, methods, instructions or products referred to in the content. |
© 2023 by the authors. Licensee MDPI, Basel, Switzerland. This article is an open access article distributed under the terms and conditions of the Creative Commons Attribution (CC BY) license (https://creativecommons.org/licenses/by/4.0/).
Share and Cite
Alberghini, G.; Fabbian, A.; Ferioli, M.; Miotti Scapin, R.; Catellani, P.; Giaccone, V. The Growth Potential of Bacillus cereus in Ready-to-Reheat Vegetable Soups. Hygiene 2023, 3, 339-350. https://doi.org/10.3390/hygiene3030025
Alberghini G, Fabbian A, Ferioli M, Miotti Scapin R, Catellani P, Giaccone V. The Growth Potential of Bacillus cereus in Ready-to-Reheat Vegetable Soups. Hygiene. 2023; 3(3):339-350. https://doi.org/10.3390/hygiene3030025
Chicago/Turabian StyleAlberghini, Giulia, Alessandro Fabbian, Marcello Ferioli, Riccardo Miotti Scapin, Paolo Catellani, and Valerio Giaccone. 2023. "The Growth Potential of Bacillus cereus in Ready-to-Reheat Vegetable Soups" Hygiene 3, no. 3: 339-350. https://doi.org/10.3390/hygiene3030025
APA StyleAlberghini, G., Fabbian, A., Ferioli, M., Miotti Scapin, R., Catellani, P., & Giaccone, V. (2023). The Growth Potential of Bacillus cereus in Ready-to-Reheat Vegetable Soups. Hygiene, 3(3), 339-350. https://doi.org/10.3390/hygiene3030025