Abstract
In this paper, we revisit the Mesolithic–Neolithic transition in western Scotland and the links between early European farmers and middens in light of new aDNA, radiocarbon, and stable isotopic evidence. New carbon and nitrogen stable isotopic data for food sources (plant and animal remains) from a Mesolithic site are presented, and dietary FRUITS models are recalculated based on these data. We also respond to recent criticisms of the Bayesian approach to diet reconstruction. Results support the view that Neolithic people had at most a minimal contribution of marine foods in their diet and also point to a dual population model of transition in western Scotland. A significant aspect of the transition in coastal western Scotland is the co-occurrence of Neolithic human remains with shell-midden deposits, which appears to contradict stable isotopic evidence indicating a minimal contribution of marine resources to the diet of early farming communities in the region. Finally, we highlight the need for further research to fully address these issues, including (1) targeted isotopic analyses of potential plant and animal resources, (2) single-entity radiocarbon and ZooMS analyses of animal bones and artefacts from shell middens, and (3) further aDNA analyses of the remains of Late Mesolithic and Neolithic people.
1. Introduction
The precise nature and timing of the transition from hunting and gathering to farming in western Scotland has been the subject of longstanding debate (e.g., Bonsall et al., 2002; Schulting & Richards, 2002; Sheridan, 2010; Schulting & Borić, 2017; Sheridan & Whittle, 2023). This debate significantly reflects the wider archaeological discourse on the spread of farming across Europe. Various models have been proposed; however, these fall broadly into two categories: demic diffusion or indigenism/acculturation (see Ammerman (2020) and Schier (2022) for reviews). Indigenous development or adoption of agricultural practices (grouped here for simplicity, although the former has never been convincingly argued for western Scotland) should be evident in the archaeological record through a gradual and/or piecemeal transition to farming with the persistence, at least over the short to medium term, of some hunting and gathering behaviours (Zvelebil & Rowley-Conwy, 1984; Thomas, 1991, 2004). By contrast, a ‘revolution’ linked to demic diffusion (demographic expansion and the dispersal of farmers) should be evidenced by a sudden and significant break from traditional hunter-gatherer activities and material culture, with the uniform and wholesale appearance of the Neolithic ‘package’ (Stevens & Fuller, 2012).
One culturally determined behaviour—diet—has long been regarded as central to this debate for two reasons: it is one of the fundamental changes in behaviour associated with the introduction of farming and can be measured directly through stable isotope analysis.
Traditionally, the diets of prehistoric populations have been ‘reconstructed’ from carbon (δ13C) and nitrogen (δ15N) stable isotope ratios of human bone through visual parsing or ‘eyeballing’ (e.g., Tauber, 1981) or by employing linear mixing models (LMMs) (e.g., Schwarcz, 1991; Phillips & Koch, 2002). Over the past two decades, the limitations of linear mixing models (LMM) have been extensively discussed (e.g., Robbins et al., 2002; Fernandes et al., 2012; Fry, 2013). Since the early 2010s, the use of Bayesian mixing models (BMM), which mitigate some of the drawbacks of LMMs, has become commonplace: Parnell et al. (2010); Fernandes et al. (2014, 2015); and see Pickard and Bonsall (2022) for FRUITS modelling of the Neolithic diet in western Scotland. However, the use of Bayesian approaches for modelling past diets has not been met with universal acclaim. For instance, Schulting et al. (2023) questioned the precision and accuracy of Bayesian models of Neolithic diets in western Scotland.
Advances in biomolecular techniques now enable the rapid and cost-effective sequencing of ancient DNA (aDNA), providing an additional line of evidence through which the Mesolithic–Neolithic transition can be investigated. The aDNA analyses of Mesolithic and Neolithic human remains from western Scotland have revealed a genetic admixture between early European farmers and indigenous hunter-gatherers (Olalde et al., 2018; Brace et al., 2019). Mithen (2022) explored the nature of the interaction between hunter-gatherers and European farmers on the Inner Hebridean island of Islay, informed by the results of aDNA sequencing and excavation records. He concluded that a biocultural merger of the two groups was likely (Mithen, 2022, p. 72). Subsequently, Patterson et al. (2022) published an expanded dataset of aDNA sequences from west Scottish Neolithic individuals, making a reassessment of the evidence timely.
Here, we examine how the combined analyses of diet and aDNA can enhance our understanding of the Mesolithic–Neolithic transition in western Scotland and explore the utility of the Bayesian modelling software FRUITS (version 3.1 Beta) in this context. We also explore the relationship between Neolithic mortuary practices and shell middens in western Scotland.
2. Archaeological and Archaeogenetic Background
The debate surrounding the introduction of farming to Britain has followed a trajectory similar to the broader European discourse, with scholars favouring either demic diffusion or indigenism/acculturation as the primary driver of the transition to agriculture (see Sheridan and Whittle (2023) for a concise overview). The discussion has continued in western Scotland due to the equivocal nature of the archaeological record (Bonsall et al., 2002). Beginning around 4000 cal BCE (and possibly as early as 4300 BCE, based on the presence of a sherd of Armorican Castellic ware in the Achnacreebeag chambered tomb), there were changes in subsistence practices, material culture, technology, architecture and monumentality, and land use in many regions of Scotland (Fairweather & Ralston, 1993; Sheridan, 2012; Thomas, 2013; Sheridan & Schulting, 2020), which had parallels in Continental Europe, and therefore were consistent with demic diffusion as the cause of cultural change. However, in western Scotland, the evidence arguably supported the continuity of hunter-gatherer lifeways, with activity at some sites seemingly spanning the transition, along with later reuse of Mesolithic locations by Neolithic communities, the persistence of certain chipped stone and bone technologies, and the exploitation of wild resources (Bonsall et al., 2002; Mithen et al., 2007). Most relevant to the current discussion are the following: (i) the continued (but not necessarily continuous) accumulation of deposits of marine resources at shell-midden sites during the Neolithic, such as at An Corran on Skye and Carding Mill Bay 1 and 2 near Oban (Connock et al., 1991; Saville et al., 2012; J. M. Bownes et al., 2017); and (ii) finds of shells at megalithic sites, some of which may represent foundation deposits hinting at the continued symbolic significance of marine resources, such as at Crarae (Scott, 1963).
Since the early 2010s, aDNA studies have become the cornerstone of resolving the debate. The DNA of European Mesolithic hunter-gatherers (WHG) compared to early European farmers (EEF) provides overwhelming support for demic diffusion—the first farmers in Europe were genetically distinct from the last hunter-gatherers (e.g., Haak et al., 2010; Mathieson et al., 2015; Olalde et al., 2018, 2019). In Britain, generally, there was a demographic transformation, the direct consequence of demic diffusion, such that, by the Late Neolithic, little to no trace of indigenous hunter-gatherer ancestry remained (Brace et al., 2019; Brace & Booth, 2023). However, in western Scotland, the population ‘replacement’ was not necessarily rapid and need not have been brought about by mass migration (Patterson et al., 2022; Brace & Booth, 2023). Ammerman (2020) has argued that contact between indigenous hunter-gatherers and incoming farmers likely occurred in many regions of Europe. This assertion is supported not only by the archaeological record (e.g., Fort, 2012) but by genomic evidence (e.g., Olalde et al., 2019; Brunel et al., 2020). The indicators of admixture between indigenous hunter-gatherers and incoming farmers in western Scotland are clear (Olalde et al., 2018; Brace et al., 2019; Patterson et al., 2022). Of the maximum of twenty west Scottish Neolithic individuals whose DNA has been sequenced (Figure 1, and see Table 1), at least eight exhibit recent (within the last ten generations or so, i.e., indigenous) hunter-gatherer ancestry. Five of these individuals (those with good coverage or ‘number of reads’ and a high count of SNPs) have been identified as genetic outliers, distinct from the broader Early Neolithic community of western Scotland (see Table 1 and the extended data Figure 2 in Patterson et al. (2022)). Therefore, genetic evidence confirms that farming was introduced to Scotland by migrants from continental Europe. The question of the nature of the interactions between the first farmers and indigenous hunter-gatherers remains unresolved. Understanding the diets of both Mesolithic and Neolithic groups remains fundamental to this discussion.
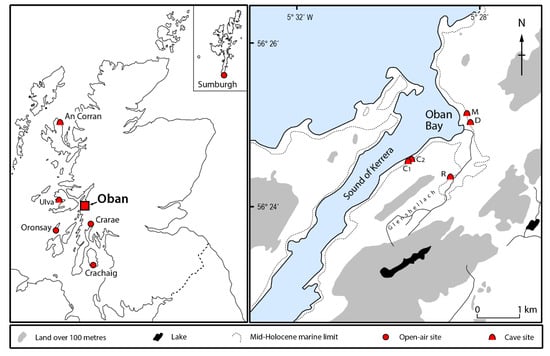
Figure 1.
Locations of western Scottish Neolithic individuals whose aDNA has been sequenced (cf. Table 1). C1—Carding Mill Bay 1; C2—Carding Mill Bay 2; D—Distillery Cave; M—MacArthur Cave; R—Raschoille Cave.

Table 1.
Radiocarbon dates of Neolithic individuals for whom aDNA has been sequenced (data from Patterson et al., 2022; see also Olalde et al., 2018). The DNA of a minimum number of 19 individuals has been sequenced. While there are 20 samples listed, I2658 and I2657 from MacArthur Cave may be duplicates or, alternatively, first-degree relatives. Individuals I12314 and I12313 may be first-degree relatives. Individual I12313, from Carding Mill Bay 2, is dated by association with two other individuals for whom 14C determinations are available (I12314 and I12317). Radiocarbon dates are calibrated to 2σ (95.4% CI) and rounded outwards to the nearest 10 years. The median age is as reported by OxCal for the 14C dates and is the mean of the upper and lower limits for contextual/associated dates. See Figure 1 for site locations.
3. Stable Isotope Analysis
Dietary changes have been used as a proxy measure for the timing and rapidity of the transition from hunting and gathering to farming in western Scotland and, thus, to distinguish between the two proposed models, acculturation versus demic diffusion. Diachronic patterns in dietary habits can be assessed in archaeological populations through stable isotope analysis. Diet reconstruction through the measurement of carbon (δ13C) and nitrogen (δ15N) stable isotope ratios is a well-established approach (e.g., Vogel & van der Merwe, 1977).
Tauber (1981, p. 333) performed the first comparative analysis of the δ13C values of Danish Mesolithic and Neolithic individuals, concluding that the hunter-gatherer groups had subsisted largely on marine resources, while the farmers consumed mainly terrestrial foods. The shift from Mesolithic to Neolithic consumption patterns appeared abrupt and uniform (Figure 2 in Tauber, 1981), in keeping with a demic diffusion model. A similar conclusion was later drawn from the isotope data for Scottish Neolithic individuals (Bonsall et al., 2002; Schulting & Richards, 2002). Schulting and Richards (2002), among others, championed a model of rapid and wholesale transition to dependence on terrestrial resources at the beginning of the Neolithic in western Scotland (e.g., Schulting, 1998; Schulting & Richards, 2002; Richards et al., 2003; Richards & Schulting, 2006; Schulting & Borić, 2017). Further, Schulting and Richards (2002, p. 155) argued that the relatively high human δ15N compared to the values of herbivores suggested that Neolithic diets were dominated by domesticated animal products and that the “animal protein (meat, blood or milk) is presumably from domestic stock, as it seems highly improbable that people would suddenly abandon marine foods in favour of wild terrestrial game at this juncture”. The focus on terrestrial resources was in sharp contrast to the diets of Scottish hunter-gatherers. Richards and Mellars (1998) estimated that individuals whose remains were recovered from the Mesolithic shell midden at Cnoc Coig on the Isle of Oronsay had derived over 90% of their dietary protein from marine food sources. In each of the aforementioned studies, the diet was interpreted through a visual analysis of scatterplots (e.g., Schulting & Borić, 2017) or ‘reconstructed’ using simple linear mixing models, based on a single dietary proxy (e.g., Richards & Mellars, 1998). These models focused solely on sources of dietary protein and did not account for the impact of the varying concentrations of protein in different foodstuffs. The development of Bayesian approaches to modelling diets, along with advances in understanding macronutrient routing in collagen synthesis (Fernandes et al., 2012, 2014), has offered us an opportunity to revisit the stable isotope data and investigate the whole diet.
J. M. Bownes et al. (2017) published the first Bayesian analysis of Neolithic diets in western Scotland, presenting data for four individuals from Carding Mill Bay 1. Bayesian mixing models, such as FRUITS (Food Reconstruction Using Isotopic Transferred Signals), offer several advantages over linear mixing models (see Fernandes et al., 2014). These include the ability to incorporate more food sources (relative to the number of proxies), uncertainties (e.g., seasonal variation in food source isotope values), and priors (e.g., health-related limitations to protein intake). Diets were modelled from bone collagen δ13C and δ15N using FRUITS. Their model indicated a ‘modest’ contribution of seafood to dietary protein of between 15 ± 11% and 21 ± 14%. J. M. Bownes et al. (2017, p. 1292) noted that their findings did not align with previously published interpretations by Richards et al. (2003) and Richards and Schulting (2006), which had “suggested a complete absence of marine resources in the Neolithic diet”. In response to the J. M. Bownes et al. (2017) paper, Schulting et al. (2023) claimed that their stance was misrepresented and that they had postulated a ‘minimal’ contribution of marine foods to diet.
Schulting et al. (2023) explored the discrepancies between published interpretations of the diets of the early farmers from Carding Mill Bay 1 and critiqued the following aspects of the J. M. Bownes et al. (2017) model:
- The Δ15N diet–consumer diet consumer offset used, i.e., +5.5 ± 0.5‰
- The Δ13C diet–consumer offset used, i.e., +1.0‰
- The inclusion of marine foods in the dietary model
- The omission of plant foods from the model
- Whether the faunal samples used to establish food source isotope values were contemporaneous with the human remains from the site.
To highlight these limitations, Schulting et al. (2023, fig. 1b) generated a revised model of protein intake for Carding Mill Bay 1 using the same parameters employed in J. M. Bownes et al. (2017), altering only the Δ13C diet–consumer offset from +1.0‰ to 4.8‰. Schulting et al. (2023, p. 54) concluded from the data generated in the revised model that the ‘most probable’ contribution of marine resources to diet was between 0% and 1%. Schulting et al. (2023) then generated two new models for one individual, Carding Mill Bay 1 OxA-7890, which incorporated three food sources: cereals, terrestrial herbivores, and young herbivores (reportedly to account for the enrichment associated with nursing), while excluding marine resources. One model included a δ15N for manured plants (3.0 ± 1.0‰), while the other incorporated a δ15N for non-manured plants (5.0 ± 2.0‰).
The parameters employed by Schulting et al. (2023) for their revised models are summarized in Table 2. The models are expanded here using FRUITS (version 3.1 Beta) to encompass all four individuals included in the J. M. Bownes et al. (2017) study. The results are presented in Table 3 and Table 4. Both models indicated that, for three of the four individuals, the mean estimated contribution of plant foods to dietary protein exceeds that from animal sources, with individual OxA-7664 being the exception, consuming nearly equal proportions of animal and plant protein. Notably, there is little difference between the manured and non-manured cereal models, which likely reflects the large standard deviations associated with the mean δ13C and δ15N values.
Table 2.
Parameters used by Schulting et al. (2023) to generate two dietary models (one using a manured cereal δ15N, the other using an unmanured cereal δ15N) for the Late Neolithic individual Carding Mill Bay 1 OxA-7890. The young herbivore value was calculated from the terrestrial herbivore value with a ‘nursing’ offset applied—see Schulting et al. (2023, p. 3).
Table 3.
Carding Mill Bay 1, Model A: Manured cereals. Protein sources routed to collagen (% mean estimate ± standard deviation and 68% credible intervals). Context information as presented by Connock et al. (1991).
Table 4.
Carding Mill Bay 1, Model B: Non-manured cereals. Protein sources routed to collagen (% mean estimate ± standard deviation and 68% credible intervals). Context information as presented by Connock et al. (1991).
We agree with Schulting et al. (2023) that the dietary model for Carding Mill Bay 1, published by J. M. Bownes et al. (2017), is flawed. However, we contend that only two of the criticisms highlighted by Schulting et al. (2023) are valid (see also Pickard and Bonsall (2022), where some of these issues were addressed).
Firstly, the assumption that 100% of dietary protein was derived from one of two sources, either the meat of terrestrial animals or the flesh of marine organisms, is problematic. J. Bownes (2018, p. 150) acknowledged that plant foods would have been exploited by both Mesolithic and Neolithic groups in Scotland but excluded this resource from dietary models on the basis that “plants contain very little … protein in relation to animal meat”. This assumption can be challenged. The macronutrient content of animal ‘meat’ and, consequently, the protein-to-lipid ratio, vary by species and also depend on the cut of meat or the part of the animal consumed. Some cereals and wild plants have protein-to-energy concentrations that are similar to those of certain animal products (see Pickard & Bonsall, 2022, tab. 8). Hazelnuts and barley, for instance, which are among the most commonly identified plant foods recovered from Scottish Neolithic sites (Bishop et al., 2010, 2014), are relatively high in protein.
Deriving dietary protein exclusively from animal products is atypical (cf. Hedges & Reynard, 2007). In modern developed countries, mean protein intake consists of 57% animal and 43% plant-derived sources. By contrast, developing countries have relative proportions of animal to plant protein at 30% and 70%, respectively. However, animal protein intake may be higher in groups that consume large quantities of dairy foods (Hedges & Reynard, 2007).
Secondly, the Δ13Cdiet–consumer offset of +1‰ used by J. M. Bownes et al. (2017) is inappropriate. Although an offset of 0‰ to +2‰ has been demonstrated between herbivore and carnivore bone collagen values (Bocherens & Drucker, 2003), this offset is not appropriate for modelling the whole diet from bone collagen stable isotope values. The food web for the Carding Mill Bay 1 human population presents a more complex scenario. Plant foods (such as cereals and wild nuts) and shellfish should both be included in the dietary models of this group. It is essential to determine the macronutrients δ13C for the tissues consumed from each of the food sources that potentially contributed to diet, and to employ an appropriate Δ13Cdiet–consumer offset, e.g., O’Connell et al. (2012).
There are also several problems with the approach of Schulting et al. (2023). These broadly fall into three categories: (i) the offsets used, (ii) the food sources included (or excluded), and (iii) the critique of Bayesian models.
3.1. Δ15Ndiet–Consumer Offset
Schulting et al. (2023) assumed a Δ15Ndiet–consumer of 4.6 ± 0.5‰ rather than the more widely used 5.5 ± 0.5‰ or higher offset, as suggested by Fernandes et al. (2014), Bickle (2018), and Pickard and Bonsall (2022). The lower offset is derived from O’Connell et al. (2012, p. 431), wherein it is described as “very conservative”. O’Connell et al. (2012) determined that the diet–collagen offset in their study population was c. 6‰, significantly higher than the offset used by J. M. Bownes et al. (2017) and lower than that observed in some other medium to large mammals (e.g., Caut et al., 2009). Schulting et al. (2023) argued that the conservative value was more realistic, in keeping with values determined in ecological food web studies. Schulting et al. (2023) cited Minagawa and Wada (1984), Post (2002), and Vanderklift and Ponsard (2003) in support of a small diet–consumer offset of 3‰, and Halffman et al. (2020), Newsome et al. (2004), and Piličiauskas et al. (2017) for an offset of 3−4‰. However, using ecological studies as comparators for human diet offsets is problematic. Vanderklift and Ponsard (2003) observed that diet–consumer offsets varied taxonomically. The mean offset reported by both Minagawa and Wada (1984) and Post (2002) was 3.4‰. However, both studies indicated large ranges in Δ15Ndiet–consumer of up to +9.2‰ (Minagawa & Wada, 1984). Furthermore, the diet–consumer food webs studied were not appropriate analogues for humans (large omnivores). Minagawa and Wada (1984) studied the food webs of a range of species, including wild fish, insects, and molluscs, as well as the controlled feeding studies of a guppy, shrimp, and a mouse. No large omnivorous mammals were included in the study. Post (2002) investigated offsets in freshwater mussels and snails. The Vanderklift and Ponsard (2003) offset was generated from a synthesis of published controlled feeding studies, but only two samples came from medium-sized terrestrial omnivores (pigs). Moreover, these specimens were part of a controlled feeding experiment and had diets that included only plant foods (Hare et al., 1991). In each of the studies mentioned, a variety of tissues were sampled and, in some instances, the data were derived from whole-body samples. These were then combined to generate a mean Δ15N offset, i.e., it is not directly comparable with the O’Connell et al. (2012) diet to bone collagen offset. The Δ15N offset used in Newsome et al. (2004) was derived from other studies. The Halffman et al. (2020) offset was derived from the Bocherens (2015) prey–predator offset determined for herbivore to carnivore collagen to collagen values. Similarly, Piličiauskas et al. (2017) used the Δ15N offset published in Bocherens and Drucker (2003). Ecological studies of diet–consumer Δ15N offsets in large omnivorous mammals are few. Black bear (Ursus americanus) diet–plasma offset values have been reported as +2.3, +4.1, and +4.2‰ (Hildebrand et al., 1996). This is consistent with a diet–collagen offset of 3.2–3.7‰, 5.0–5.4‰, and 5.1–5.5‰, respectively (cf. O’Connell et al., 2012). Notably, the diet−plasma offset in grizzly bears has been reported to be up to +6.30‰, i.e., a diet−collagen offset of 7.2–7.6‰ (Caut et al., 2009).
The 5.5 ± 0.5‰ offset proposed by Fernandes et al. (2014) encompasses the variation between the higher and lower offsets of O’Connell et al. (2012) and Schulting et al. (2023), respectively. Therefore, it is deemed appropriate to use this diet–consumer offset in modelling the diets of the study populations.
3.2. Food Sources
Ideally, when modelling human diet, the food source isotope data should be determined from animal and plant remains that originate from the same archaeological context/phase as the human remains. There are two confounding factors when modelling the diets of Neolithic people in western Scotland. Firstly, the potential introduction of Neolithic human remains into older contexts, which has been established in certain instances through 14C dating. Secondly, there is a relative scarcity of faunal remains from western Scottish sites that have been identified to species level. One solution has been to judiciously use Mesolithic faunal remains in dietary models (e.g., Pickard & Bonsall, 2022). Schulting et al. (2023) critiqued the use of fauna from the Carding Mill Bay 1 midden to model the diets of Neolithic people (J. M. Bownes et al., 2017), arguing that the animal remains might have originated from an earlier chronological or cultural phase. However, Milner and Craig (2009) encountered this issue, i.e., the potential non-contemporaneity of animal and human remains, in their investigation of diet at the midden site of An Corran, on the Isle of Skye. Milner and Craig (2009) measured the δ13C and δ15N of both faunal samples that dated much earlier than the human remains from the midden as well as those of bevel-ended tools made from animal bones that had been previously determined to be of Neolithic date, i.e., broadly contemporaneous with the human remains, and found little difference in the isotope values of the animals from the two distinct cultural phases. This implies that the stable isotope ratios of fauna from Mesolithic contexts provide appropriate food source data for modelling the Neolithic diet.
Schulting et al. (2023) presented a model limited to three food categories: young and mature terrestrial herbivores, and cereals. Although they stated that this three-source model was “a heuristic exercise” and made “no claim to have ‘revealed’ the actual proportion of these three food groups consumed by the Neolithic communities around Carding Mill Bay”, Schulting et al. (2023, p. 54) reported that the results of this food-source-restricted model were “more in keeping with what might be expected of British Neolithic farming communities, known to have practised both cereal cultivation and animal husbandry from the outset”. The argument is circular. Schulting et al. (2023) hold a preconceived notion of what an early farming community in western Scotland would have subsisted on and then generate a model that seemingly confirms this. Furthermore, it is questionable whether adding young herbivores as a food source is meaningful. One of the prerequisites for high-quality outputs from FRUITS modelling is that the food sources must be isotopically distinct (Fernandes et al., 2014). The isotope values for young herbivores are only slightly higher than those of the adults, and food sources with overlapping isotope ranges should be aggregated (Fernandes et al., 2014; Phillips et al., 2014).
Assuming a priori that marine resources did not contribute to diet—and therefore excluding them from subsequent modelling—is equally, if not more, problematic than including them in Bayesian (or indeed linear) mixing models. A more robust approach involves generating a model that includes all potential food sources appropriately grouped while ensuring that the credible interval is considered carefully when interpreting the data (Fernandes et al., 2014; Cheung & Szpak, 2021).
3.3. Critique of Bayesian Models
Schulting et al. (2023, p. 54) urged caution before accepting the output of Bayesian palaeodietary models, implying that such models do not reflect “the actual proportion… of food groups consumed”. However, this critique could apply to any form of dietary modelling that utilizes proxies, such as LMMs and visual parsing. Weaknesses in dietary ‘reconstructions’ or models arise not only from Bayesian modelling generally, or specifically FRUITS, but rather reflect the GIGO principle (output is related to the quality of the input). Limitations on the quality of input, and consequently output, arise from the partial nature of the archaeological record and constraints on research (i.e., lack of isotopic data for food sources and diet–consumer offsets), poorly considered selection of parameters, and misinterpretation or over-interpretation of the data generated. Regardless of the modelling system employed, ‘modellers’ make assumptions about which food sources are likely to have contributed to diet and select other variables or parameters that are incorporated into the models; for example, which archaeological specimens to sample to establish food source baselines or ‘dietary endpoints’, and which diet–consumer offset values to use. It is not the case that, when a food source is included in FRUITS, it is “assumed a priori to make a dietary contribution” (Schulting et al., 2023, p. 54). When a food source that was not consumed is included in the model, this is indicated by the credible interval, which will span 0. Bayesian models are not inherently more heuristic than other forms of dietary modelling, although their ability to accommodate a much broader range of food sources and to include more macronutrients and macronutrient concentrations, proxies, and a greater number of uncertainties and offsets, may make them appear so. As new data relating to one or more parameters become available, models should be updated. The capability of models to incorporate this breadth of inputs increases the accuracy of dietary models where inputs are carefully and critically evaluated. While Bayesian models may seem less precise than linear mixing models because they provide a credible interval or range rather than a unique solution or absolute value, the ‘true’ value or dietary contribution lies within this credible interval. Thus, the data are more accurate than simple linear mixing models or visual analysis of scatterplots (of course, this assumes high-quality input).
4. Discussion
Arguably, neither the J. M. Bownes et al. (2017) nor the Schulting et al. (2023) models are as robust or as detailed as current knowledge permits. Both used protein-routed models that assumed carbon in bone collagen was derived exclusively from dietary protein. While Schulting et al. (2023) pointed out that concentration-dependent modelling is necessary to model food source calorie contribution to diet, nutrient routing should also be incorporated. Fernandes et al. (2012) demonstrated that carbon from the three dietary macronutrients is routed to bone collagen (see also Hedges, 2003). This information, namely the routing of consistent proportions of carbon from protein (74 ± 4%) and energy (26 ± 4%), can be used to determine the source of dietary calories (Fernandes et al., 2012, 2014). Modelling calorie contributions of food sources can significantly enhance our understanding of diet and subsistence activities. A concentration-dependent, nutrient-routed model with appropriate food source values, offsets, uncertainties, and priors for west Scottish Neolithic populations was published by Pickard and Bonsall (2022). Using the Bayesian model FRUITS, the findings of that study were aligned with those of Schulting et al. (2023) on the contribution that marine resources made to diet. We concluded that marine resources “were, at most, a minor component of the ‘lifetime’ diet” (Pickard & Bonsall, 2022, p. 226). We also agreed with Schulting et al. (2023) that the diets of the individuals from Carding Mill Bay 1 were overwhelmingly derived from terrestrial foods. However, we suggested that, while terrestrial animals (including potentially dairy products) were a vital source of dietary protein, plant foods were likely the primary source of calories for west Scottish Neolithic people.
Since publishing our models in 2022, additional food source data have become available, as summarized in Table 5 (see Figure 2 for locations; and Figure 3 for visualization of the food source and human isotopic data). Therefore, the diets of Neolithic individuals from western Scotland are revisited here using updated food source data (with all food sources included and grouped where appropriate) but expanded to include three additional Neolithic individuals—one from Ulva Cave and two from Carding Mill Bay 2 (see Patterson et al., 2022). Table 6 presents the updated human isotope data, Table 7 shows the parameters used in our revised FRUITS models, and Table 8 displays the results of the FRUITS models. Wild and domesticated resources are included in the baseline food source isotope values. Both radiocarbon and botanical evidence suggest that dependence on cultivars to the total exclusion of wild plants is unlikely in Neolithic Scotland. Bishop et al. (2010) noted that no cereal grains have been recovered from Neolithic contexts in mainland coastal west Scotland or the Inner Hebrides. Stevens and Fuller (2012, 2015) demonstrated through radiocarbon summed probability distributions that wild plant foods, specifically hazelnuts, remained a crucial staple throughout the Neolithic in mainland Scotland, especially so from c. 3650 BCE, when a climatic downturn may have led to “a readjustment of existing subsistence systems in response to less predictable harvests, during which wild plant foods and pastoralism gained prominence” (Stevens et al., 2022, p. 11). A pilot study of modern and archaeological specimens from the Isle of Ulva suggests that hazelnuts have similar mean δ13C and δ15N values as unmanured Early Neolithic cereals. Although further work is necessary to confirm this and also to establish the variation in nutshell and kernel values (given that the number of samples analysed was small), the preliminary results suggest that mean stable isotope values of the two resources, namely cereals and hazelnuts, may be indistinguishable. The evidence for the continued exploitation of wild animals in Neolithic Scotland is limited. While remains of red deer and possibly roe deer were recovered (Bartosiewicz et al., 2010) from the upper midden deposit at Carding Mill Bay 2, in the absence of 14C dates, it is not certain that these originate from Neolithic contexts. Although ample evidence exists for stock raising, there are no published stable isotope data for domesticated mammals from western Scotland where identification to species is certain.
Table 5.
Food source δ13C and δ15N data used in the FRUITS models. The δ13C and δ15N of the archaeological plant specimens have been corrected for charring, and the modern samples have been corrected for the Suess effect (Keeling et al., 2017; see also Pickard & Bonsall, 2022). See Supplementary Material (Longin, 1971; Sayle et al., 2019) for collagen extraction and mass spectrometric methods statements for the new data.

Figure 2.
Locations of sites providing the food source δ13C and δ15N data presented in Table 5. 1. Braes of Ha’Breck; 2. Skara Brae; 3. An Corran; 4. Balbridie; 5. Bornish; 6. Ulva Cave; 7. Aird’s Bay, Loch Etive; 8. Carding Mill Bay and Raschoille, Oban; 9. Caisteal-nan-Gillean and Cnoc Coig, Oronsay.
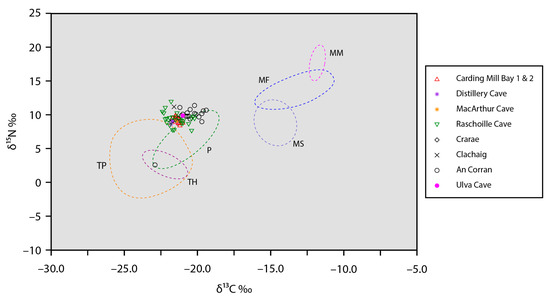
Figure 3.
Bulk collagen stable carbon and nitrogen isotope data for Neolithic humans from nine sites in western Scotland compared against the ranges of stable isotope values (represented by ellipsoid hulls) for major food groups (see Table 5): MF—marine fish; MM—marine mammals; MS—marine shellfish; P—pigs; TH—terrestrial herbivores; TP—terrestrial plants.
Table 6.
Neolithic human δ13C and δ15N data. The diets of only those individuals identified as adults are modelled.
Table 7.
Parameters input to the FRUITS 4 food source model. Constraints on protein intake are based on modern reference intake guidelines (Berryman et al., 2018).
Table 8.
Mean estimates (ME Cal) and credible intervals (CI, 68%) of calorie intake and a mean estimate of protein contribution (ME Pro) of four food groups, plants, terrestrial animals, fish, and shellfish consumed by Neolithic people from western Scotland. Values are presented as % of whole dietary intake. Samples are labelled to be consistent with Pickard and Bonsall (2022). Individuals are represented by site initials and a number: AC—An Corran; CMB—Carding Mill Bay; CRA –Crarae; MC—MacArthur Cave; RC –Raschoille Cave; UC—Ulva Cave.
4.1. Revised Dietary Models
The outputs of the models, perhaps unsurprisingly given the narrow ranges of the δ13C and δ15N values, suggest that the diets of Neolithic individuals in western Scotland were homogeneous. The 68% credible interval for each food source is very similar across all the individuals analysed (see Figure 4). The model suggests that plant foods were likely the mainstay of dietary calories. The mean estimated contribution of plant calories is approximately 75 ± 11%, with the lowest estimated CI range of 62–64% and the highest range of 87–94%. By contrast, dietary protein was likely sourced predominantly from terrestrial animal products, including meat and dairy (e.g., Cramp et al., 2014).
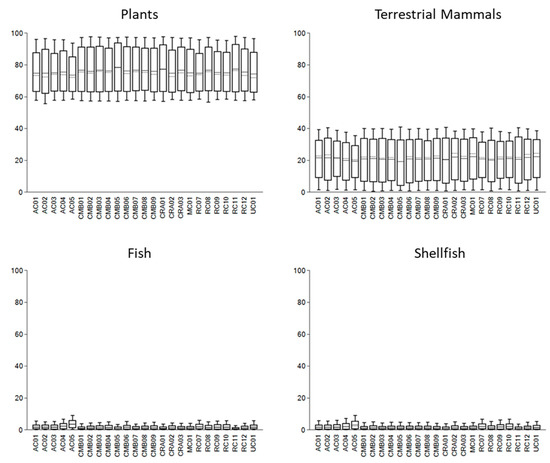
Figure 4.
FRUITS dietary models for Neolithic individuals from western Scotland grouped by food source. The solid line represents the median estimated food source contribution to dietary calories, the dotted line shows the mean estimated contribution, the box shows the 68% credible interval (CI); and the whiskers the 95% CI.
The mean estimated calorie contribution of fish varied from 1 ± 1% to 2 ± 2%, while for shellfish it ranged from 1 ± 1% to 3 ± 3%. This implies that marine resources represented, at most, a minor component of dietary calories. The mean estimated protein contributions of both fish and shellfish show a wider range of values, from 2 ± 2% to 10 ± 6% and 4 ± 4% to 10 ± 8%, respectively. This may indicate some variation, individually or between groups, in the consumption of, and nutrients derived from, marine resources. However, the credible intervals for all but two samples suggest that marine resources were not consumed—that is, the lower range of the fish and shellfish calorie contribution credible intervals is 0%. The credible intervals (68%) for two samples from An Corran (AC.04 and AC.05) indicate a small contribution of marine resources to diet but, at most, this constitutes a 6% contribution of both fish and shellfish to calories. Notably, these two samples may originate from a single individual; both were extracted from fragmentary bones, and both specimens were identified as the remains of a ‘mature’ adult (Milner & Craig, 2009).
4.2. Diet, DNA, and the Mesolithic–Neolithic Transition
Radiocarbon chronologies of Mesolithic and Neolithic sites on Islay point to the likely co-existence of hunter-gatherers and farmers on the island between c. 3790 and 3640 cal BCE, and potentially into the latter half of the 4th millennium BCE (Mithen, 2022). Mithen (2022) proposed three scenarios of indigenous hunter-gatherer and migrant farmer interaction on Islay: (a) swift succession, (b) dual populations, and (c) biocultural merger. Although developed for Islay, the scenarios serve as a valuable starting point for exploring the nature of immigrant farmer/indigenous hunter-gatherer interactions across the wider region of western Scotland.
The swift succession scenario proposes a short period of contact with some admixture or acculturation before the ‘extinction’ of hunter-gatherer groups, which Mithen (2022) argued did not wholly align with the archaeological evidence. The dual population model envisioned Neolithic and Mesolithic people coexisting in the same area, possibly even using the same locations, but with little or no contact for an extended period, possibly into the 2nd millennium BCE (Mithen, 2022). The biocultural merger model proposed a genetic and cultural union with a mixed economy, including hunting, gathering, fishing, and pastoralism (Mithen, 2022). Of the three scenarios, Mithen (2022) cautiously favoured the biocultural merger model.
All the west Scottish Neolithic individuals sampled for stable isotope analysis had diets largely, if not entirely, based on terrestrial resources. Moreover, their diets were remarkably uniform. This dietary emphasis is indicated not only by the biochemistry of human remains but is supported by organic residue analysis of Neolithic pottery sherds from coastal locations in northern Britain, including the Northern and Western Isles, which show a “near-complete absence” of residues of aquatic origin (Cramp et al., 2014, p. 3). Arguably, therefore, the Neolithic individuals represent a single dietary population even though some individuals show mixed EEF and indigenous hunter-gatherer ancestry (cf. Bollongino et al., 2013). While modelling the relative proportions of wild terrestrial species versus domesticates in the diet is not feasible due to an overlap in δ13C and δ15N values of these food groups, the isotope data clearly indicate whether marine resources were exploited. At most, fish and shellfish contributed minimally to diet, marking a significant shift in dietary focus from the Mesolithic.
Mesolithic human remains are scarce in Scotland, comprising isolated finds of disarticulated and fragmented bones or teeth. Stable isotope data are available for only six samples from adults (modelling the diet of non-adults remains problematic), with five from Cnoc Coig and one from Caisteal nan Gillean II, both shell-midden locations on Oronsay. The diets of the individuals whose remains were recovered from these two sites comprised a mix of terrestrial and aquatic resources, typically with more than a third of calories drawn from marine resources (Pickard & Bonsall, 2020, 2022). The aDNA from only one Mesolithic individual from Cnoc Coig, Oronsay, has been sequenced (Figure 3)—a female who lived between c. 4450 and 4260 BCE (5492 ± 36 BP, SUERC-69249). She had western hunter-gatherer (WHG) ancestry and presumably was an indigenous hunter-gatherer (Brace et al., 2019). This individual had among the highest δ13C and δ15N ratios of any of the human remains from Cnoc Coig that have been analysed (δ13C = −12.8‰ and δ15N = +16.6‰, GU41836). However, the collagen was extracted from the petrous portion of the temporal bone, which may reflect a combination of maternal, breastfeeding, and weaning/post-weaning diets as it begins to form in utero and does not remodel after approximately two years of age (Jørkov et al., 2009). The complex interplay between physiological effects, nursing, and diet means that it is inadvisable to use these data to model ‘typical’ Mesolithic diets. However, it is entirely conceivable that the diet of the adult from whom the petrous sample was extracted was similar to that of the other individuals from Cnoc Coig, for whom adult diet proxies are available (see Pickard & Bonsall, 2022). While it is not certain that the diets of all west Scottish hunter-gatherers were similarly constituted, the broader evidence from Atlantic Europe (e.g., Richards & Hedges, 1999; Bergsvik & Ritchie, 2020; García-Escárzaga & Gutiérrez-Zugasti, 2021) suggests that marine resources likely constituted an important element of the subsistence economy for coastal groups. While diet is only one culturally determined behaviour, turning away from the sea represents a distinct break with past traditions and habitus and, therefore, is of social and symbolic significance. As Fornander (2011, pp. 80–81) aptly summarized, “social identity, is rooted in the practices of everyday life” and “is also about defining what one is not”. The dietary evidence strongly suggests that fishing was an infrequent activity; therefore, west Scottish Neolithic people likely had a distinct socially constructed identity compared to earlier Mesolithic groups. Diachronic changes in diet are more consistent with either the dual population model or the swift succession model than with the biocultural merger model.
As Brace and Booth (2023, p. 133) observed, the aDNA evidence is inconsistent with a complete biocultural merger—migrant farmers “must have lived adjacent to people descended from local Mesolithic groups for hundreds of years but only had children with them some of the time”. In Figure 5, the Mesolithic individual from Cnoc Coig establishes the benchmark for indigenous hunter-gatherers with fully western hunter-gatherer (WHG) ancestry, while the individual(s) from MacArthur Cave set the boundary for migrant farmer (or early European farmer) ancestry (see Patterson et al. (2022) and Brace and Booth (2023) for discussion of the MacArthur Cave samples and levels of WHG ancestry in Neolithic groups). It is striking that the median dates of those individuals with evidence for increased Mesolithic ancestry (notably never exceeding 30%) are clustered between c. 3700 and 3500 BCE, a timespan which some authorities would place at the end of the Early Neolithic and the beginning of the Middle Neolithic, after which the genetic contribution reverts to the Neolithic ‘baseline’ (see the downward trend in Figure 5). As noted by Brace and Booth (2023), increases in hunter-gatherer ancestry in Middle Neolithic populations have been observed in several regions of continental Europe. However, only in rare cases does this reflect recent admixture between indigenous hunter-gatherers and migrant farmers in the Middle Neolithic, e.g., Blätterhöhle Cave, Germany, and likely among the Brześć Kujawski group, Poland (Bollongino et al., 2013; Lipson et al., 2017; Fernandes et al., 2018; Rivollat et al., 2020; Brace & Booth, 2023). At Blätterhöhle, biomolecular evidence strongly suggests the presence of two groups of Neolithic people, one subsisting entirely on agricultural resources with EEF ancestry, the other by foraging and fishing with hunter-gatherer ancestry (Bollongino et al., 2013). This is quite distinct from the uniform diet of west Scottish Neolithic groups. Furthermore, there are no 4th millennium BCE individuals who display a high level (i.e., ≥60%) of Mesolithic heritage (Brace & Booth, 2023), suggesting asymmetric gene flow between hunter-gatherers and farmers in the region. According to the Hardy–Weinberg principle, allele proportions in a population should remain constant over time unless (i) there is a significant selective advantage (in the case of Neolithic alleles), (ii) marriage practices distort the proportions (e.g., Zerjal et al., 2003), or (iii) there is a continuous influx of DNA into a population. The latter is most likely in this case, and such an influx of migrant farmers would dilute hunter-gatherer DNA allele frequency. Thus, based on both the dietary and DNA evidence, we propose a model of subsumption of the Mesolithic genetic heritage along with cultural replacement followed by continued influx of Neolithic farmers, further diluting the Mesolithic signal to complete loss, i.e., a dual population model. This is suggested cautiously for three reasons. Firstly, there is still some uncertainty about where in continental Europe the first farmers originated (Sheridan & Whittle, 2023). Resolving this issue may result in a reconsideration of the extent to which hunter-gatherers and migrant farmers interacted within Britain (see Brace & Booth, 2023). Secondly, there may be ascertainment bias—individuals with high levels of Mesolithic ancestry may have had mortuary rituals that leave little archaeological trace. Thirdly, it is difficult to determine what proportion of the people that were interred at the sites have been sampled for aDNA analysis—the sites at Carding Mill Bay and Raschoille were damaged by the construction work that led to their discovery, and an unknown number of human remains may have been lost. Ultimately, in many instances, it is difficult to reconcile whether the individuals sampled for aDNA analysis are also those whose remains have undergone stable isotope analysis for dietary modelling.

Figure 5.
The proportion of hunter-gatherer (WHG)/early European farmer (EEF) ancestry vs. the median date of the Mesolithic individual from Cnoc Coig (filled square) and Neolithic individuals (open circles) from western Scotland. Median 14C dates were calculated using OxCal 4.4 (Bronk Ramsey, 2021) and the IntCal20 dataset (Reimer et al., 2020) and are the mean of the upper and lower boundaries for contextual dates.
4.3. Shell Middens and Neolithic Burials
Various explanations have been proposed to account for the co-occurrence of Neolithic human remains with shell middens. One explanation is the use of marine resources by farmers during times of hardship, such as crop failures. This has been suggested for an Early Neolithic site at Sumburgh (in Shetland), where the consumption of marine resources is evident only in dentine increments (which provide a record of diet during childhood and over short periods, i.e., weeks to months) rather than in bone collagen, which typically reflects the average dietary intake over longer timescales (e.g., Montgomery et al., 2013). Further, Mithen (2022, p. 19) proposed that the Middle Neolithic failure of farming (Stevens & Fuller, 2012) may have led to a renewed impetus for hunting and gathering, “for which they may have required Mesolithic-type knowledge and technology” and thus served as a catalyst for increased contact with native hunter-gatherers. The use of wild resources, whether terrestrial or marine, does not require Mesolithic-type technology or skills. Marine resources can be harvested with minimal technology and experience (Groom et al., 2019). Despite their proximity and accessibility for coastal groups in western Scotland, marine resources did not feature prominently in the diets of Neolithic communities. Indeed, Schulting and Borić (2017, p. 94) expressed their surprise that the Early Neolithic people of Sumburgh did not focus all their attention on fishing, given the marginality of farming in such a northerly location. They noted that this “speaks to the cultural importance of maintaining a farming identity”. Similarly, while wild plants were exploited in Neolithic Scotland and seem to have become a crucial staple during the Middle to Late Neolithic, this does not necessitate the continuance of hunter-gatherers or the direct transfer of knowledge; as Stevens and Fuller (2012, p. 719) noted, “migrating farmers from the Continent already had a subsistence strategy encompassing both cultivated and wild foods”.
Another possibility is that farming communities were not responsible for the 4th millennium BCE midden accumulations; rather, these could represent the activities of a coexisting hunter-gatherer population. While Mithen (2022, p. 18) suggested that population collapse “may have driven local communities to relax their marriage rules to allow interbreeding with local Mesolithic groups”, it is important not to assume that hunter-gatherers were passive bystanders in the transition to farming. There may have been some resistance to merger on both sides—hunter-gatherers may also have maintained strong connections to past customs, rituals, and social structures (see Zilhão, 2011). The co-existence of dual populations in western Scotland may have been facilitated during the Mesolithic–Neolithic transition by its unique and varied coastal topography and biogeography. Gron and Sørensen (2018) observed that in Early Neolithic Denmark the transition to farming and a shift in occupation patterns to inland settlements was abrupt in regions with long, straight coastlines and relatively exposed shores. By contrast, in areas characterized by heterogeneous coastlines with multiple ecotones (regions of high productivity), similar to western Scotland, the archaeological record has indicated the concurrent presence of inland farming communities and coastal hunter-gatherers for, at most, the first three centuries of the Early Neolithic (Gron & Sørensen, 2018).
This raises the question of why, if middens were associated with hunter-gatherer activities, Neolithic people chose to deposit the remains of their deceased in these locations. Brace and Booth (2023), highlighting similarities between the depositional contexts of human remains on Oronsay and at Carding Mill Bay, imply that the act of depositing human remains at shell midden sites signifies a continuation of hunter-gatherer mortuary traditions into the Neolithic. If that were indeed the case, it suggests the persistence of funerary customs shaped by hunter-gatherer social memory despite hunter-gatherer ancestry being at low levels or absent in the individuals whose remains have been recovered from these sites. None of the individuals from Raschoille Cave was genetically closely related (Patterson et al., 2022; Brace & Booth, 2023), which suggests that placing the deceased in caves did not reflect the collective memory or practices of a small bioculturally-merged group.
Placing the remains of the dead in caves was not a Mesolithic tradition in western Scotland (Bonsall et al., 2012; Sheridan & Schulting, 2020). However, this practice is observed throughout Neolithic Europe (e.g., Peterson, 2019; Silvestri et al., 2020; Sparacello et al., 2020; Rivero et al., 2021). At Raschoille Cave, the human remains were found in or beneath angular rock debris, stratigraphically separated from the shell-midden deposits in the cave. Distillery Cave was discovered during quarrying in the 19th century. The existence of the cave and its archaeological significance were only recognized after rock blasting disturbed the deposits; hence, the archaeological context of the human remains, and their stratigraphic relationship with the shell midden are uncertain (Turner, 1895). Similarly, at An Corran, the funerary practices and the relationship between the shell midden and the human remains are uncertain. While the remains may have been intentionally inserted into pre-existing midden deposits, it has been suggested they were incidental intrusions, perhaps originally placed on a ledge of the rock shelter (Saville et al., 2012). At MacArthur Cave, the human remains were recovered from the surface of, and from within, a ‘black earth’ layer that overlay the shell-bearing deposits (Anderson, 1895), thus, post-dating the midden. Moreover, an AMS 14C date on a bone artefact from the midden (Bonsall & Smith, 1989) is substantially older than the 14C dates obtained from Neolithic human remains from the cave.
At Ulva Cave, the entrance area featured a shell midden formed by the periodic deposition of food and other refuse over thousands of years, which had become highly compacted due to human and animal trampling. The midden dates back to before 7500 cal BCE (Russell et al., 1995) but was added to intermittently during the later Mesolithic and subsequent periods. A few disarticulated human bones (one dated to the Early Neolithic—see Table 1) were found among mammalian remains recovered through hand excavation and fine sieving, but it could not be determined whether the human remains had been intentionally “buried”.
Arguably, the most compelling evidence for the intentional burial of Neolithic human remains in shell-midden deposits comes from Carding Mill Bay in Oban, where disarticulated human bones were found in shell-midden deposits within two shallow fissure caves at the base of a raised marine cliff (CMB 1 and CMB 2). Both sites had suffered damage due to land development, prompting salvage excavations at Site 1 in 1988 (Connock et al., 1991) and at Site 2 from 1992 to 1996 (Bartosiewicz et al., 2010). At CMB 1, the radiocarbon dates for human bones were, on average, several centuries younger than those for ungulate bones and bone artefacts recovered from the shell-midden deposits (Connock et al., 1991; Bonsall & Smith, 1992; Schulting & Richards, 2002; J. M. Bownes et al., 2017). This evidence implies that Neolithic human remains were either deposited in an in situ Late Mesolithic shell midden or that the shell-midden material had been brought to the site from another location specifically to conceal the human remains. At CMB 2, human remains were recovered from two distinct shell-rich layers separated by a layer of talus. Bones from two individuals with early farmer (EEF) ancestry excavated from the lower midden deposit were dated to the Early Neolithic (Table 1). The contrasting pedological and microfaunal characteristics of the two sets of midden deposits suggest that at least one, and possibly both, had not accumulated in situ but had been imported for the purpose of burying the human remains.
5. Conclusions
This paper was conceived as a contribution to discussions on how we can accurately model past diets, focusing on the nature of the transition from hunting and gathering to farming in western Scotland. FRUITS generates accurate models of past diets when appropriate parameters are input. Our FRUITS models indicate that plant foods were the primary source of dietary calories, while animal products provided the principal source of dietary protein for west Scottish Neolithic individuals. The results presented here support the long-standing view that marine resources constituted, at most, a minor component of Neolithic diets in western Scotland. Collectively, the dietary and aDNA evidence suggests subsumption with further influx dilution, that is, the dual population model of the Mesolithic–Neolithic transition in western Scotland best fits the current evidence. Extensive reliance on terrestrial resources in Neolithic western Scotland suggests deep-rooted connections to farming traditions.
The interpretations presented here are offered cautiously. We recognize that there remain significant gaps in food source isotope data that need to be addressed. While no 4th millennium BCE individuals with predominantly WHG ancestry have been identified so far, this may reflect the small number of individuals whose aDNA has been extracted and sequenced. It may also reflect ascertainment bias—hunter-gatherers might have disposed of their dead in a way that left little archaeological trace, either due to the nature of mortuary rituals or the poor preservation of bones in the acidic soils that are prevalent throughout Scotland.
To address the limitations in current dietary models, further biomolecular analyses and radiocarbon dating are essential, including the following: (i) targeted isotope analyses of potential food sources, especially domestic animals and wild plants, such as hazelnuts, from sites in western Scotland; (ii) additional radiocarbon dates from sites like Ulva Cave and Carding Mill Bay 2 to enhance our understanding of shell midden chronology; and (iii) palaeoproteomics (ZooMS) of non-diagnostic large mammal remains, which also has the potential to identify remains of humans as well as domesticates, and expand both the isotope and aDNA datasets.
Supplementary Materials
The following supporting information can be downloaded at: https://www.mdpi.com/article/10.3390/humans5010008/s1, Methods Statement for Extraction and Stable Isotope Analysis of Bone Collagen; Methods Statement for Pre-Treatment and Stable Isotope Analysis of Carbonised Hazelnut Shells.
Author Contributions
Conceptualization, C.P., E.S. and C.B.; methodology, C.P., A.B. and E.G.; validation, C.P., E.G., E.S. and C.B.; formal analysis, C.P.; investigation, C.P., E.G., E.S., A.B. and C.B.; resources, C.P. and C.B.; writing—original draft preparation, C.P.; writing—review and editing C.P., E.S. and C.B.; supervision, C.P.; visualization, C.P. and C.B.; validation, C.P. and C.B.; funding acquisition, C.P. and E.G. All authors have read and agreed to the published version of the manuscript.
Funding
This research was funded by The Moray Endowment Fund, The Munro Fund, and the School of History, Classics and Archaeology, University of Edinburgh.
Institutional Review Board Statement
The study was conducted in accordance with the Declaration of Helsinki, and the protocol was approved by the Ethics Committee of the School of History, Classics and Archaeology, University of Edinburgh (SHCA2020/EG/CP) on 30 September 2020.
Data Availability Statement
All data generated for, or utilized in, the paper is included in the manuscript and the Supplementary Materials.
Acknowledgments
Thanks are extended to the North West Mull Community Woodland Company who gave permission for the excavations on Ulva, and also to those in the Ulva Community who supported the field projects: Andy Primrose; Ruairidh Munro; Donny Munro. This work was supported by SUERC, University of Glasgow, and we thank Kerry Sayle. This work is dedicated to the memory of Andy Barlow. Thanks are also extended to two anonymous reviewers for providing helpful comments on this manuscript.
Conflicts of Interest
The authors declare no conflicts of interest. The funders had no role in the design of this study; in the collection, analyses, or interpretation of data; in the writing of the manuscript; or in the decision to publish the results.
References
- Ammerman, A. (2020). The Neolithic transition in Europe at 50 years. arXiv, arXiv:2012.11713. [Google Scholar] [CrossRef]
- Anderson, J. (1895). Notice of a cave recently discovered at Oban, containing human remains, and a refuse-heap of shells and bones of animals, and stone and bone implements. Proceedings of the Society of Antiquaries of Scotland, 29, 211–230. [Google Scholar] [CrossRef]
- Barrett, J. H., Orton, D., Johnstone, C., Harland, J., Van Neer, W., Ervynck, A., Roberts, C., Locker, A., Amundsen, C., Enghoff, I. B., Hamilton-Dyer, S., Heinrich, D., Hufthammer, A. K., Jones, A. K., Jonsson, L., Makowiecki, D., Pope, P., O’Connell, T. C., de Roo, T., & Richards, M. (2011). Interpreting the expansion of sea fishing in medieval Europe using stable isotope analysis of archaeological cod bones. Journal of Archaeological Science, 38(7), 1516–1524. [Google Scholar] [CrossRef]
- Bartosiewicz, L., Zapata, L., & Bonsall, C. (2010). A tale of two shell middens: The natural versus the cultural in ‘Obanian’ deposits at Carding Mill Bay, Oban, western Scotland. In A. VanDerwarker, & A. Peres (Eds.), Integrating zooarchaeology and paleoethnobotany: A consideration of issues, methods, and cases (pp. 205–225). Springer. [Google Scholar]
- Bergsvik, K. A., & Ritchie, K. (2020). Mesolithic fishing landscapes in western Norway. In A. Schülke (Ed.), Coastal landscapes of the Mesolithic. Human engagement with the coast from the Atlantic to the Baltic Sea (pp. 229–263). Routledge. [Google Scholar]
- Berryman, C. E., Lieberman, H. R., Fulgoni, V. L., & Pasiakos, S. M. (2018). Protein intake trends and conformity with the dietary reference intakes in the United States: Analysis of the National Health and Nutrition Examination Survey, 2001–2014. The American Journal of Clinical Nutrition, 108(2), 405–413. [Google Scholar] [CrossRef] [PubMed]
- Bickle, P. (2018). Stable isotopes and dynamic diets: The Mesolithic-Neolithic dietary transition in terrestrial Central Europe. Journal of Archaeological Science: Reports, 22, 444–451. [Google Scholar] [CrossRef]
- Bishop, R., Church, M., & Rowley-Conwy, P. (2010). Cereals, fruits and nuts in the Scottish Neolithic. Proceedings of the Society of Antiquaries of Scotland, 139, 47–103. [Google Scholar] [CrossRef]
- Bishop, R., Church, M., & Rowley-Conwy, P. (2014). Seeds, fruits and nuts in the Scottish Mesolithic. Proceedings of the Society of Antiquaries of Scotland, 143, 9–71. [Google Scholar] [CrossRef]
- Bishop, R., Gröcke, D. R., Ralston, I., Clarke, D., Lee, D. H. J., Shepherd, A., Thomas, A. S., Rowley-Conwy, P. A., & Church, M. J. (2022). Scotland’s first farmers: New insights into early farming practices in North-west Europe. Antiquity, 96(389), 1087–1104. [Google Scholar] [CrossRef]
- Bocherens, H. (2015). Isotopic tracking of large carnivore palaeoecology in the mammoth steppe. Quaternary Science Reviews, 117, 42–71. [Google Scholar] [CrossRef]
- Bocherens, H., & Drucker, D. (2003). Trophic level isotopic enrichment of carbon and nitrogen in bone collagen: Case studies from recent and ancient terrestrial ecosystems. International Journal of Osteoarchaeology, 13(1–2), 46–53. [Google Scholar] [CrossRef]
- Bollongino, R., Nehlich, O., Richards, M. P., Orschiedt, J., Thomas, M. G., Sell, C., Fajkošová, Z., Powell, A., & Burger, J. (2013). Years of parallel societies in Stone Age Central Europe. Science, 342(6157), 479–481. [Google Scholar] [CrossRef] [PubMed]
- Bonsall, C. (2000). Raschoille Cave, Oban. Discovery Excavation Scotland 1999, 112. [Google Scholar]
- Bonsall, C., Anderson, D., & Macklin, M. (2002). The Mesolithic–Neolithic transition in western Scotland and its European context. Documenta Praehistorica, 29, 1–25. [Google Scholar] [CrossRef]
- Bonsall, C., Pickard., C., & Ritchie, G. (2012). From Assynt to Oban: Some observations on prehistoric cave use in western Scotland. In K. A. Bergsvik, & R. Skeates (Eds.), Caves in context: The cultural significance of caves and rockshelters in Europe (pp. 10–21). Oxbow Books. [Google Scholar]
- Bonsall, C., & Smith, C. (1989). Late Palaeolithic and Mesolithic bone and antler artifacts from Britain: First reactions to accelerator dates. Mesolithic Miscellany, 10(1), 33–38. [Google Scholar]
- Bonsall, C., & Smith, C. (1992). New AMS 14C dates for antler and bone artifacts from Great Britain. Mesolithic Miscellany, 13(1), 28–34. [Google Scholar]
- Bownes, J. (2018). Reassessing the Scottish Mesolithic–Neolithic transition: Questions of diet and chronology [Ph.D. thesis, University of Glasgow]. Available online: https://theses.gla.ac.uk/8911/ (accessed on 19 February 2019).
- Bownes, J. M., Ascough, P. L., Cook, G. T., Murray, I., & Bonsall, C. (2017). Using stable isotopes and a Bayesian mixing model (FRUITS) to investigate diet at the Early Neolithic site of Carding Mill Bay, Scotland. Radiocarbon, 59(5), 1275–1294. [Google Scholar] [CrossRef]
- Brace, S., & Booth, T. J. (2023). The genetics of the inhabitants of Neolithic Britain: A review. In A. Whittle, J. Pollard, & S. Greaney (Eds.), Ancient DNA and the European Neolithic, relations and descent (pp. 123–146). Oxbow Books. [Google Scholar]
- Brace, S., Diekmann, Y., Booth, T. J., van Dorp, L., Faltyskova, Z., Rohland, N., Mallick, S., Olalde, I., Ferry, M., Michel, M., Oppenheimer, J., Broomandkhoshbacht, N., Stewardson, K., Martiniano, R., Walsh, S., Kayser, M., Charlton, S., Hellenthal, G., Armit, I., & Barnes, I. (2019). Ancient genomes indicate population replacement in Early Neolithic Britain. Nature Ecology & Evolution, 3(5), 765–771. [Google Scholar] [CrossRef]
- Bronk Ramsey, C. (2021). OxCal 4.4 online. Available online: https://c14.arch.ox.ac.uk/oxcal/OxCal.html (accessed on 30 November 2024).
- Brunel, S., Bennett, E. A., Cardin, L., Garraud, D., Emam, H. B., Beylier, A., Boulestin, B., Chenal, F., Ciesielski, E., Convertini, F., Dedet, B., Desbrosse-Degobertiere, S., Desenne, S., Dubouloz, J., Duday, H., Escalon, G., Fabre, V., Gailledrat, E., Gandelin, M., & Pruvost, M. (2020). Ancient genomes from present-day France unveil 7000 years of its demographic history. Proceedings of the National Academy of Sciences, 117(23), 12791–12798. [Google Scholar] [CrossRef]
- Caut, S., Angulo, E., & Courchamp, F. (2009). Variation in discrimination factors (Δ15N and Δ13C): The effect of diet isotopic values and applications for diet reconstruction. Journal of Applied Ecology, 46(2), 443–453. [Google Scholar] [CrossRef]
- Charlton, S., Alexander, M., Collins, M., Milner, N., Mellars, P., O’Connell, T. C., Stevens, R. E., & Craig, O. E. (2016). Finding Britain’s last hunter-gatherers: A new biomolecular approach to ‘unidentifiable’ bone fragments utilising bone collagen. Journal of Archaeological Science, 73, 55–61. [Google Scholar] [CrossRef]
- Cheung, C., & Szpak, P. (2021). Interpreting past human diets using stable isotope mixing models—Best practices for data acquisition. Journal of Archaeological Method and Theory, 29(1), 138–161. [Google Scholar] [CrossRef]
- Connock, K. D., Finlayson, B., Mills, A. C. M., Boardman, S. J., Crone, B. A., Hamilton-Dyer, S., McCormick, F., Lorimer, D. H., Morton, A., Russell, N. J., & Carter, S. (1991). Excavation of a shell midden site at Carding Mill Bay near Oban, Scotland. Glasgow Archaeological Journal, 17(1), 25–38. [Google Scholar] [CrossRef]
- Cramp, L. J. E., Jones, J., Sheridan, A., Smyth, J., Whelton, H., Mulville, J., Sharples, N., & Evershed, R. P. (2014). Immediate replacement of fishing with dairying by the earliest farmers of the northeast Atlantic archipelagos. Proceedings of The Royal Society B-Biological Sciences, 281(1780), 20132372. [Google Scholar] [CrossRef] [PubMed]
- Fairweather, A. D., & Ralston, I. B. M. (1993). The Neolithic timber hall at Balbridie, Grampian Region, Scotland: The building, the date, the plant macrofossils. Antiquity, 67(255), 313–323. [Google Scholar] [CrossRef]
- Fernandes, D. M., Strapagiel, D., Borówka, P., Marciniak, B., Żądzińska, E., Sirak, K., Siska, V., Grygiel, R., Carlsson, J., Manica, A., Lorkiewicz, W., & Pinhasi, R. (2018). A genomic Neolithic time transect of hunter-farmer admixture in central Poland. Scientific Reports, 8(1), 1–11. [Google Scholar] [CrossRef]
- Fernandes, R., Grootes, P. M., Nadeau, M.-J., & Nehlich, O. (2015). Quantitative diet reconstruction of a Neolithic population using a Bayesian mixing model (FRUITS): The case study of Ostorf (Germany). American Journal of Physical Anthropology, 158(2), 325–340. [Google Scholar] [CrossRef]
- Fernandes, R., Millard, A. R., Brabec, M., Nadeau, M.-J., & Grootes, P. (2014). Food Reconstruction Using Isotopic Transferred Signals (FRUITS): A Bayesian model for diet reconstruction. PLoS ONE, 9(2), e87436. [Google Scholar] [CrossRef]
- Fernandes, R., Nadeau, M.-J., & Grootes, P. M. (2012). Macronutrient-based model for dietary carbon routing in bone collagen and bioapatite. Archaeological and Anthropological Sciences, 4(4), 291–301. [Google Scholar] [CrossRef]
- Fornander, E. (2011). Consuming and communicating identities: Dietary diversity and interaction in middle neolithic sweden [Doctoral dissertation, Stockholm University]. Available online: https://www.diva-portal.org/smash/get/diva2:439410/FULLTEXT01.pdf (accessed on 2 February 2023).
- Fort, J. (2012). Synthesis between demic and cultural diffusion in the Neolithic transition in Europe. Proceedings of the National Academy of Sciences, 109(46), 18669–18673. [Google Scholar] [CrossRef]
- Fry, B. (2013). Alternative approaches for solving underdetermined isotope mixing problems. Marine Ecology Progress Series, 472, 1–13. [Google Scholar] [CrossRef]
- García-Escárzaga, A., & Gutiérrez-Zugasti, I. (2021). The role of shellfish in human subsistence during the Mesolithic of Atlantic Europe: An approach from meat yield estimations. Quaternary International, 584, 9–19. [Google Scholar] [CrossRef]
- Gron, K. J., & Sørensen, L. (2018). Cultural and economic negotiation: A new perspective on the Neolithic Transition of Southern Scandinavia. Antiquity, 92(364), 958–974. [Google Scholar] [CrossRef]
- Groom, P., Pickard, C., & Bonsall, C. (2019). Early Holocene sea fishing in western Scotland: An experimental study. The Journal of Island and Coastal Archaeology, 14(3), 426–450. [Google Scholar] [CrossRef]
- Haak, W., Balanovsky, O., Sanchez, J. J., Koshel, S., Zaporozhchenko, V., Adler, C. J., Der Sarkissian, C. S. I., Brandt, G., Schwarz, C., Nicklisch, N., Dresely, V., Fritsch, B., Balanovska, E., Villems, R., Meller, H., Alt, K. W., Cooper, A., & the Genographic Consortium. (2010). Ancient DNA from European Early Neolithic farmers reveals their Near Eastern affinities. PLoS Biology, 8(11), e1000536. [Google Scholar] [CrossRef]
- Halffman, C. M., Potter, B. A., McKinney, H. J., Tsutaya, T., Finney, B. P., Kemp, B. M., Bartelink, E. J., Wooller, M. J., Buckley, M., Clark, C. T., Johnson, J. J., Bingham, B. L., Lanoë, B., Sattler, R. A., & Reuther, J. D. (2020). Ancient Beringian paleodiets revealed through multiproxy stable isotope analyses. Science Advances, 6(36), eabc1968. [Google Scholar] [CrossRef] [PubMed]
- Hare, P. E., Fogel, M. L., Stafford, T. W., Mitchell, A. D., & Hoering, T. C. (1991). The isotopic composition of carbon and nitrogen in individual amino acids isolated from modern and fossil proteins. Journal of Archaeological Science, 18(3), 277–292. [Google Scholar] [CrossRef]
- Hedges, R. E. M. (2003). On bone collagen—apatite-carbonate isotopic relationships. International Journal of Osteoarchaeology, 13((1-2)), 66–79. [Google Scholar] [CrossRef]
- Hedges, R. E. M., & Reynard, L. M. (2007). Nitrogen isotopes and the trophic level of humans in archaeology. Journal of Archaeological Science, 34(8), 1240–1251. [Google Scholar] [CrossRef]
- Hildebrand, G. V., Farley, S. D., Robbins, C. T., Hanley, T. A., Titus, K., & Servheen, C. (1996). Use of stable isotopes to determine diets of living and extinct bears. Canadian Journal of Zoology, 74(11), 2080–2088. [Google Scholar] [CrossRef]
- Jørkov, M. L. S., Heinemeier, J., & Lynnerup, N. (2009). The petrous bone—A new sampling site for identifying early dietary patterns in stable isotopic studies. American Journal of Physical Anthropology, 138(2), 199–209. [Google Scholar] [CrossRef]
- Keeling, R. F., Graven, H. D., Welp, L. R., & Meijer, H. A. J. (2017). Atmospheric evidence for a global secular increase in carbon isotopic discrimination of land photosynthesis. Proceedings of the National Academy of Sciences, 114(39), 10361–10366. [Google Scholar] [CrossRef] [PubMed]
- Knight, M., Sheridan, A., Skoglund, P., Booth, T., Brown, L., Reich, D., Armit, I., Bonsall, C., Anastasiadou, K., Boyle, A., Büster, L. S., Oswald, M., Carver, H., Gilardet, A., Kelly, M., McCabe, J., Montgomery, J., Pickard, C., Rhodes, D., Silva, M., … Williams, M. (2021). A summary round-up list of Scottish archaeological human remains that have been sampled/analysed for DNA between January 2019 and November 2021. DES, 21, 201. [Google Scholar]
- Lipson, M., Szécsényi-Nagy, A., Mallick, S., Pósa, A., Stégmár, B., Keerl, V., Rohland, N., Stewardson, K., Ferry, M., Michel, M., Oppenheimer, J., Broomandkhoshbacht, N., Harney, E., Nordenfelt, S., Llamas, B., Mende, B. G., Köhler, K., Oross, K., Bondár, M., & Reich, D. (2017). Parallel palaeogenomic transects reveal complex genetic history of early European farmers. Nature, 551(7680), 368–372. [Google Scholar] [CrossRef]
- Longin, R. (1971). New Method of Collagen Extraction for Radiocarbon Dating. Nature, 230, 241–242. [Google Scholar] [CrossRef]
- Mathieson, I., Lazaridis, I., Rohland, N., Mallick, S., Patterson, N., Roodenberg, S. A., Harney, E., Stewardson, K., Fernandes, D., Novak, M., Sirak, K., Gamba, C., Jones, E. R., Llamas, B., Dryomov, S., Pickrell, J., Arsuaga, J. L., de Castro, J. M. B., Carbonell, E., & Reich, D. (2015). Genome-wide patterns of selection in 230 ancient Eurasians. Nature, 528(7583), 499–503. [Google Scholar] [CrossRef]
- Milner, N., & Craig, O. E. (2009). Mysteries of the middens: Change and continuity across the Mesolithic–Neolithic transition. In M. J. Allen, N. Sharples, & T. O’Connor (Eds.), Land and people. Papers in honour of John G. Evans. Prehistoric Society research paper no. 2 (pp. 169–180). Oxbow Books. [Google Scholar]
- Milner, N., & Craig, O. E. (2012). Isotope analyses. In A. Saville, K. Hardy, R. Miket, T. B. Ballin, & A. Corran (Eds.), Staffin, Skye: A rockshelter with Mesolithic and later occupation (pp. 77–79). SAIR. [Google Scholar] [CrossRef]
- Minagawa, M., & Wada, E. (1984). Stepwise enrichment of 15N along food chains: Further evidence and the relation between δ15N and animal age. Geochimica et Cosmochimica Acta, 48(5), 1135–1140. [Google Scholar] [CrossRef]
- Mithen, S. (2022). How long was the Mesolithic–Neolithic overlap in western Scotland? Evidence from the 4th millennium BC on the Isle of Islay and the evaluation of three scenarios for Mesolithic–Neolithic interaction. Proceedings of the Prehistoric Society, 88, 53–77. [Google Scholar] [CrossRef]
- Mithen, S., Pirie, A., Smith, S., & Wicks, K. (2007). The Mesolithic–Neolithic transition in western Scotland: A review and new evidence from Tiree. In A. Whittle, & V. Cummings (Eds.), Going over: The Mesolithic-Neolithic transition in North-West Europe (pp. 511–541). Oxford University Press. [Google Scholar]
- Montgomery, J., Beaumont, J., Jay, M., Keefe, K., Gledhill, A. R., Cook, G. T., Dockrill, S. J., & Melton, N. D. (2013). Strategic and sporadic marine consumption at the onset of the Neolithic: Increasing temporal resolution in the isotope evidence. Antiquity, 87(338), 1060–1072. [Google Scholar] [CrossRef]
- Newsome, S. D., Phillips, D. L., Culleton, B. J., Guilderson, T. P., & Koch, P. L. (2004). Dietary reconstruction of an Early to Middle Holocene human population from the central California coast: Insights from advanced stable isotope mixing models. Journal of Archaeological Science, 31(8), 1101–1115. [Google Scholar] [CrossRef]
- O’Connell, T. C., Kneale, C. J., Tasevska, N., & Kuhnle, G. G. C. (2012). The diet-body offset in human nitrogen isotopic values: A controlled dietary study. American Journal of Physical Anthropology, 149(3), 426–434. [Google Scholar] [CrossRef]
- Olalde, I., Brace, S., Allentoft, M. E., Armit, I., Kristiansen, K., Booth, T., Rohland, N., Mallick, S., Szécsényi-Nagy, A., Mittnik, A., Altena, E., Lipson, M., Lazaridis, I., Harper, T. K., Patterson, N., Broomandkhoshbacht, N., Diekmann, Y., Faltyskova, Z., Fernandes, D., & Reich, D. (2018). The Beaker phenomenon and the genomic transformation of Northwest Europe. Nature, 555(7695), 190–196. [Google Scholar] [CrossRef] [PubMed]
- Olalde, I., Mallick, S., Patterson, N., Rohland, N., Villalba-Mouco, V., Silva, M., Dulias, K., Edwards, C. J., Gandini, F., Pala, M., Soares, P., Ferrando-Bernal, M., Adamski, N., Broomandkhoshbacht, N., Cheronet, O., Culleton, B. J., Fernandes, D., Lawson, A. M., Mah, M., & Reich, D. (2019). The genomic history of the Iberian Peninsula over the past 8000 years. Science, 363(6432), 1230–1234. [Google Scholar] [CrossRef]
- Parnell, A. C., Inger, R., Bearhop, S., & Jackson, A. L. (2010). Source partitioning using stable isotopes: Coping with too much variation. PLoS ONE, 5(3), e9672. [Google Scholar] [CrossRef] [PubMed]
- Patterson, N., Isakov, M., Booth, T., Büster, L., Fischer, C., Olalde, I., Ringbauer, H., Akbari, A., Cheronet, O., Bleasdale, M., Adamski, N., Altena, E., Bernardos, R., Brace, S., Broomandkhoshbacht, N., Callan, K., Candilio, F., Culleton, B., Curtis, E., & Reich, D. (2022). Large-scale migration into Britain during the Middle to Late Bronze Age. Nature, 601(7894), 588–594. [Google Scholar] [CrossRef] [PubMed]
- Peterson, R. (2019). Neolithic cave burials. In Agency, structure and environment. Manchester University Press. [Google Scholar] [CrossRef]
- Phillips, D. L., Inger, R., Bearhop, S., Jackson, A. L., Moore, J. W., Parnell, A. C., Semmens, B. X., & Ward, E. J. (2014). Best practices for use of stable isotope mixing models in food-web studies. Canadian Journal of Zoology, 92(10), 823–835. [Google Scholar] [CrossRef]
- Phillips, D. L., & Koch, P. L. (2002). Incorporating concentration dependence in stable isotope mixing models. Oecologia, 130(1), 114–125. [Google Scholar] [CrossRef]
- Pickard, C., & Bonsall, C. (2020). Post-glacial hunter-gatherer subsistence patterns in Britain: Dietary reconstruction using FRUITS. Archaeological and Anthropological Sciences, 12(7), 1–22. [Google Scholar] [CrossRef]
- Pickard, C., & Bonsall, C. (2022). Reassessing Neolithic diets in western Scotland. Humans, 2(4), 226–250. [Google Scholar] [CrossRef]
- Piličiauskas, G., Jankauskas, R., Piličiauskienė, G., & Dupras, T. (2017). Reconstructing Subneolithic and Neolithic diets of the inhabitants of the SE Baltic coast (3100–2500 cal BC) using stable isotope analysis. Archaeological and Anthropological Sciences, 9(7), 1421–1437. [Google Scholar] [CrossRef]
- Post, D. M. (2002). Using stable isotopes to estimate trophic position: Models, methods, and assumptions. Ecology, 83, 703–718. [Google Scholar] [CrossRef]
- Reimer, P. J., Austin, W. E. N., Bard, E., Bayliss, A., Blackwell, P. G., Ramsey, C. B., Butzin, M., Cheng, H., Edwards, R. L., Friedrich, M., Grootes, P. M., Guilderson, T. P., Hajdas, I., Heaton, T. J., Hogg, A. G., A Hughen, K., Kromer, B., Manning, S. W., Muscheler, R., & Talamo, S. (2020). The IntCal20 northern hemisphere radiocarbon age calibration curve (0–55 cal kBP). Radiocarbon, 62(4), 725–757. [Google Scholar] [CrossRef]
- Richards, M., & Hedges, R. E. M. (1999). Stable isotope evidence for similarities in the types of marine foods used by Late Mesolithic humans at sites along the Atlantic coast of Europe. Journal of Archaeological Science, 26(6), 717–722. [Google Scholar] [CrossRef]
- Richards, M., & Mellars, P. (1998). Stable isotopes and the seasonality of the Oronsay middens. Antiquity, 72(275), 178–184. [Google Scholar] [CrossRef]
- Richards, M., Schulting, R., & Hedges, R. (2003). Sharp shift in diet at onset of Neolithic. Nature, 425(6956), 366. [Google Scholar] [CrossRef]
- Richards, M. P., & Schulting, R. (2006). Touch not the Fish: The Mesolithic–Neolithic change of diet and its significance. Antiquity, 80(308), 444–456. [Google Scholar] [CrossRef]
- Rivero, D. G., Taylor, R., Umbelino, C., Cubas, M., Barrera Cruz, M., & Díaz Rodríguez, M. J. (2021). Early Neolithic ritual funerary behaviours in the western-most regions of the Mediterranean: New insights from Dehesilla Cave (southern Iberian Peninsula). Documenta Praehistorica, 48, 298–327. [Google Scholar] [CrossRef]
- Rivollat, M., Jeong, C., Schiffels, S., Küçükkalıpçı, I., Pemonge, M., Rohrlach, A. B., Alt, K. W., Binder, D., Friederich, S., Ghesquière, E., Gronenborn, D., Laporte, L., Lefranc, P., Meller, H., Réveillas, H., Rosenstock, E., Rottier, S., Scarre, C., Soler, L., & Haak, W. (2020). Ancient genome-wide DNA from France highlights the complexity of interactions between Mesolithic hunter-gatherers and Neolithic farmers. Science Advances, 6(22), eaaz5344. [Google Scholar] [CrossRef] [PubMed]
- Robbins, C. T., Hilderbrand, G. V., & Farley, S. D. (2002). Incorporating concentration dependence in stable isotope mixing models: A response to Phillips and Koch (2002). Oecologia, 133(1), 10–13. [Google Scholar] [CrossRef]
- Russell, N., Bonsall, C., & Sutherland, D. G. (1995). The role of shellfish-gathering in the Mesolithic of western Scotland: The evidence from Ulva Cave, Inner Hebrides. In A. Fischer (Ed.), Man and sea in the Mesolithic. Coastal settlement above and below the present sea level (pp. 273–288). Oxbow Books. [Google Scholar]
- Saville, A., Hardy, K., Miket, R., & Ballin, T. B. (2012). An Corran, Staffin, Skye: A Rockshelter with Mesolithic and Later Occupation. Scottish Archaeological Internet Reports, 51, 1–101. [Google Scholar] [CrossRef]
- Sayle, K. L., Brodie, C. R., Cook, G. T., & Hamilton, W. D. (2019). Sequential measurement of δ15N, δ13C and δ34S values in archaeological bone collagen at the Scottish Universities Environmental Research Centre (SUERC): A new analytical frontier. Rapid Communications in Mass Spectrometry, 33(15), 1258–1266. [Google Scholar] [CrossRef]
- Schier, W. (2022). Modes and models of neolithization in Europe: Comments to an ongoing debate. In P. F. Biehl, & E. Rosenstock (Eds.), 6000 BC: Transformation and change in the Near East and Europe (pp. 372–392). Cambridge University Press. [Google Scholar]
- Schulting, R. J. (1998). Slighting the sea: Stable isotope evidence for the transition to farming in northwestern Europe. Documenta Praehistorica, 25, 203–218. [Google Scholar]
- Schulting, R. J., & Borić, D. (2017). A tale of two processes of Neolithisation: Southeast Europe and Britain/Ireland. In P. Bickle, V. Cummings, D. Hofmann, & J. Pollard (Eds.), The Neolithic of Europe: Papers in honour of Alasdair Whittle (pp. 82–106). Oxbow Books. [Google Scholar]
- Schulting, R. J., MacDonald, R., & Richards, M. P. (2023). FRUITS of the sea? A cautionary tale regarding Bayesian modelling of palaeodiets using stable isotope data. Quaternary International, 650, 52–61. [Google Scholar] [CrossRef]
- Schulting, R. J., & Richards, M. P. (2002). The wet, the wild and the domesticated: The Mesolithic–Neolithic transition on the west coast of Scotland. European Journal of Archaeology, 5(2), 147–189. [Google Scholar] [CrossRef]
- Schwarcz, H. P. (1991). Some theoretical aspects of isotope paleodiet studies. Journal of Archaeological Science, 18(3), 261–275. [Google Scholar] [CrossRef]
- Scott, J. G. (1963). The excavation of the chambered cairn at Crarae, Loch Fyneside, Mid Argyll. Proceedings of the Society of Antiquaries of Scotland, 94, 1–27. [Google Scholar] [CrossRef]
- Sheridan, A. (2010). The Neolithization of Britain and Ireland: The ‘Big Picture’. In B. Finlayson, & G. Warren (Eds.), Landscapes in transition (pp. 89–105). Oxbow Books. [Google Scholar]
- Sheridan, A. (2012). Contextualising Kilmartin: Building a narrative for developments in western Scotland and beyond, from the Early Neolithic to the Late Bronze Age. In A. M. Jones, J. Pollard, M. J. Allen, & J. Gardiner (Eds.), Image, memory and monumentality (pp. 163–183). Prehistoric Society Research Paper No. 5. Oxbow Books. [Google Scholar]
- Sheridan, A., & Whittle, A. (2023). aDNA and modelling the Mesolithic–Neolithic transition in Britain and Ireland. In A. Whittle, J. Pollard, & S. Greaney (Eds.), Ancient DNA and the European Neolithic, relations and descent (pp. 169–182). Oxbow Books. [Google Scholar]
- Sheridan, J. A., & Schulting, R. J. (2020). Making sense of Scottish Neolithic funerary monuments: Tracing trajectories and understanding their rationale. In A. B. Gebauer, L. Sørensen, A. Teather, & A. C. Valera (Eds.), Monumentalising life in the Neolithic: Narratives of change and continuity (pp. 195–215). Oxbow Books. [Google Scholar]
- Silvestri, L., Achino, K. F., Gatta, M., Rolfo, M. F., & Salari, L. (2020). Grotta Mora Cavorso: Physical, material and symbolic boundaries of life and death practices in a Neolithic cave of central Italy. Quaternary International, 539, 29–38. [Google Scholar] [CrossRef]
- Sparacello, V., Varalli, A., Rossi, S., Panelli, C., Goude, G., Palstra, S., Conventi, M., Del Lucchese, A., Arobba, D., De Pascale, A., Zavattaro, M., Garibaldi, P., Rossi, G., Molinari, I., Maggi, R., Moggi-Cecchi, J., Starnini, E., Biagi, P., & Dori, I. (2020). Dating the funerary use of caves in Liguria (northwestern Italy) from the Neolithic to historic times: Results from a large-scale AMS campaign on human skeletal series. Quaternary International, 536, 30–44. [Google Scholar] [CrossRef]
- Stevens, C. J., Crema, E. R., & Shoda, S. (2022). The importance of wild resources as a reflection of the resilience and changing nature of early agricultural systems in East Asia and Europe. Frontiers in Ecology and Evolution, 10, 1017909. [Google Scholar] [CrossRef]
- Stevens, C. J., & Fuller, D. Q. (2012). Did Neolithic farming fail? The case for a Bronze Age agricultural revolution in the British Isles. Antiquity, 86, 707–722. [Google Scholar] [CrossRef]
- Stevens, C. J., & Fuller, D. Q. (2015). Alternative strategies to agriculture: The evidence for climatic shocks and cereal declines during the British Neolithic and Bronze Age (a reply to Bishop). World Archaeology, 47, 856–875. [Google Scholar] [CrossRef]
- Tauber, H. (1981). 13C evidence for dietary habits of prehistoric man in Denmark. Nature, 292, 332–333. [Google Scholar] [CrossRef] [PubMed]
- Thomas, J. (1991). Rethinking the Neolithic. Cambridge University Press. [Google Scholar]
- Thomas, J. (2004). Recent debates on the Mesolithic–Neolithic transition in Britain and Ireland. Documenta Praehistorica, 31, 113–130. [Google Scholar] [CrossRef]
- Thomas, J. (2013). The birth of Neolithic Britain: An interpretive account. Oxford University Press. [Google Scholar] [CrossRef]
- Turner, W. (1895). On human and animal remains found in caves at Oban, Argyllshire. Proceedings of the Society of Antiquaries of Scotland, 29, 410–438. [Google Scholar] [CrossRef]
- Vanderklift, M. A., & Ponsard, S. (2003). Sources of variation in consumer-diet δ15N enrichment: A meta-analysis. Oecologia, 136, 169–182. [Google Scholar] [CrossRef]
- Vogel, J. C., & van der Merwe, N. J. (1977). Isotopic evidence for early maize cultivation in New York State. American Antiquity, 42(2), 238–242. [Google Scholar] [CrossRef]
- Zerjal, T., Xue, Y., Bertorelle, G., Wells, R. S., Bao, W., Zhu, S., Qamar, R., Ayub, Q., Mohyuddin, A., Fu, S., & Li, P. (2003). The genetic legacy of the Mongols. American Journal of Human Genetics, 72(3), 717–721. [Google Scholar] [CrossRef]
- Zilhão, J. (2011). Time is on my side. In A. Hadjikoumis, E. Robinson, & S. Viner (Eds.), Dynamics of Neolithisation in Europe: Studies in honour of Andrew Sherratt (pp. 46–65). Oxbow Books. [Google Scholar]
- Zvelebil, M., & Rowley-Conwy, P. (1984). Transition to farming in Northern Europe: A hunter-gatherer perspective. Norwegian Archaeological Review, 17(2), 104–128. [Google Scholar] [CrossRef]
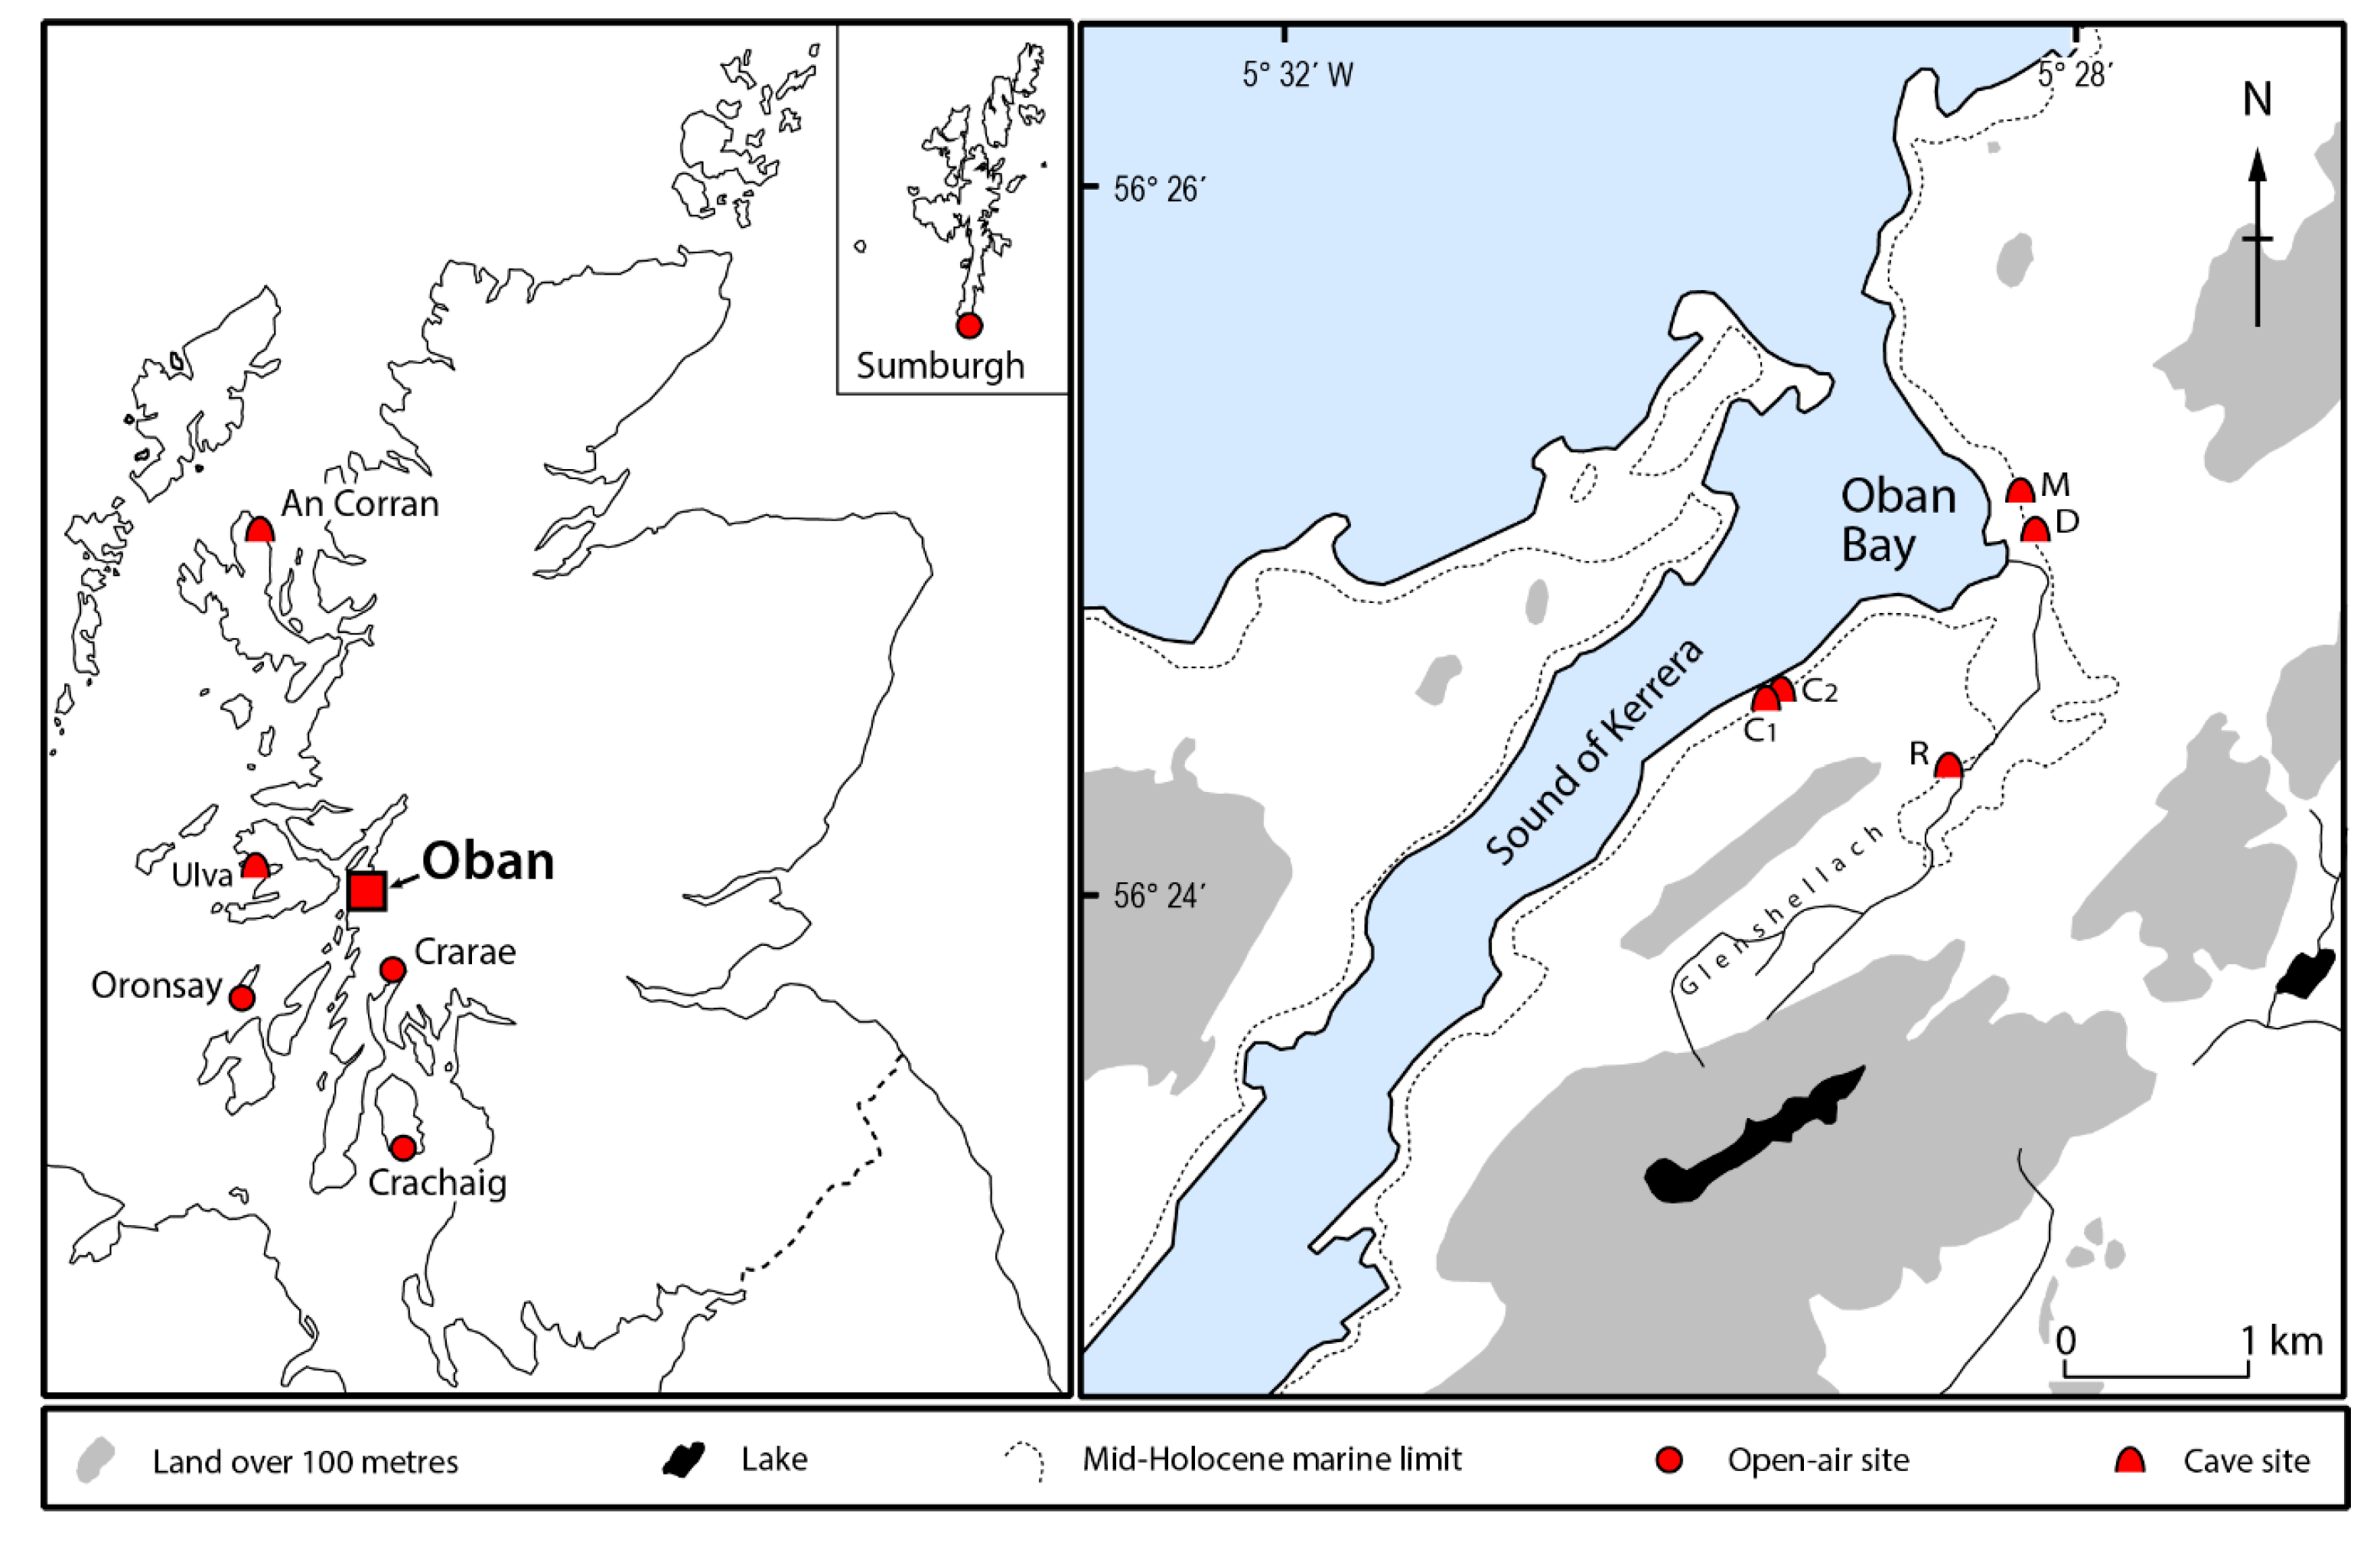
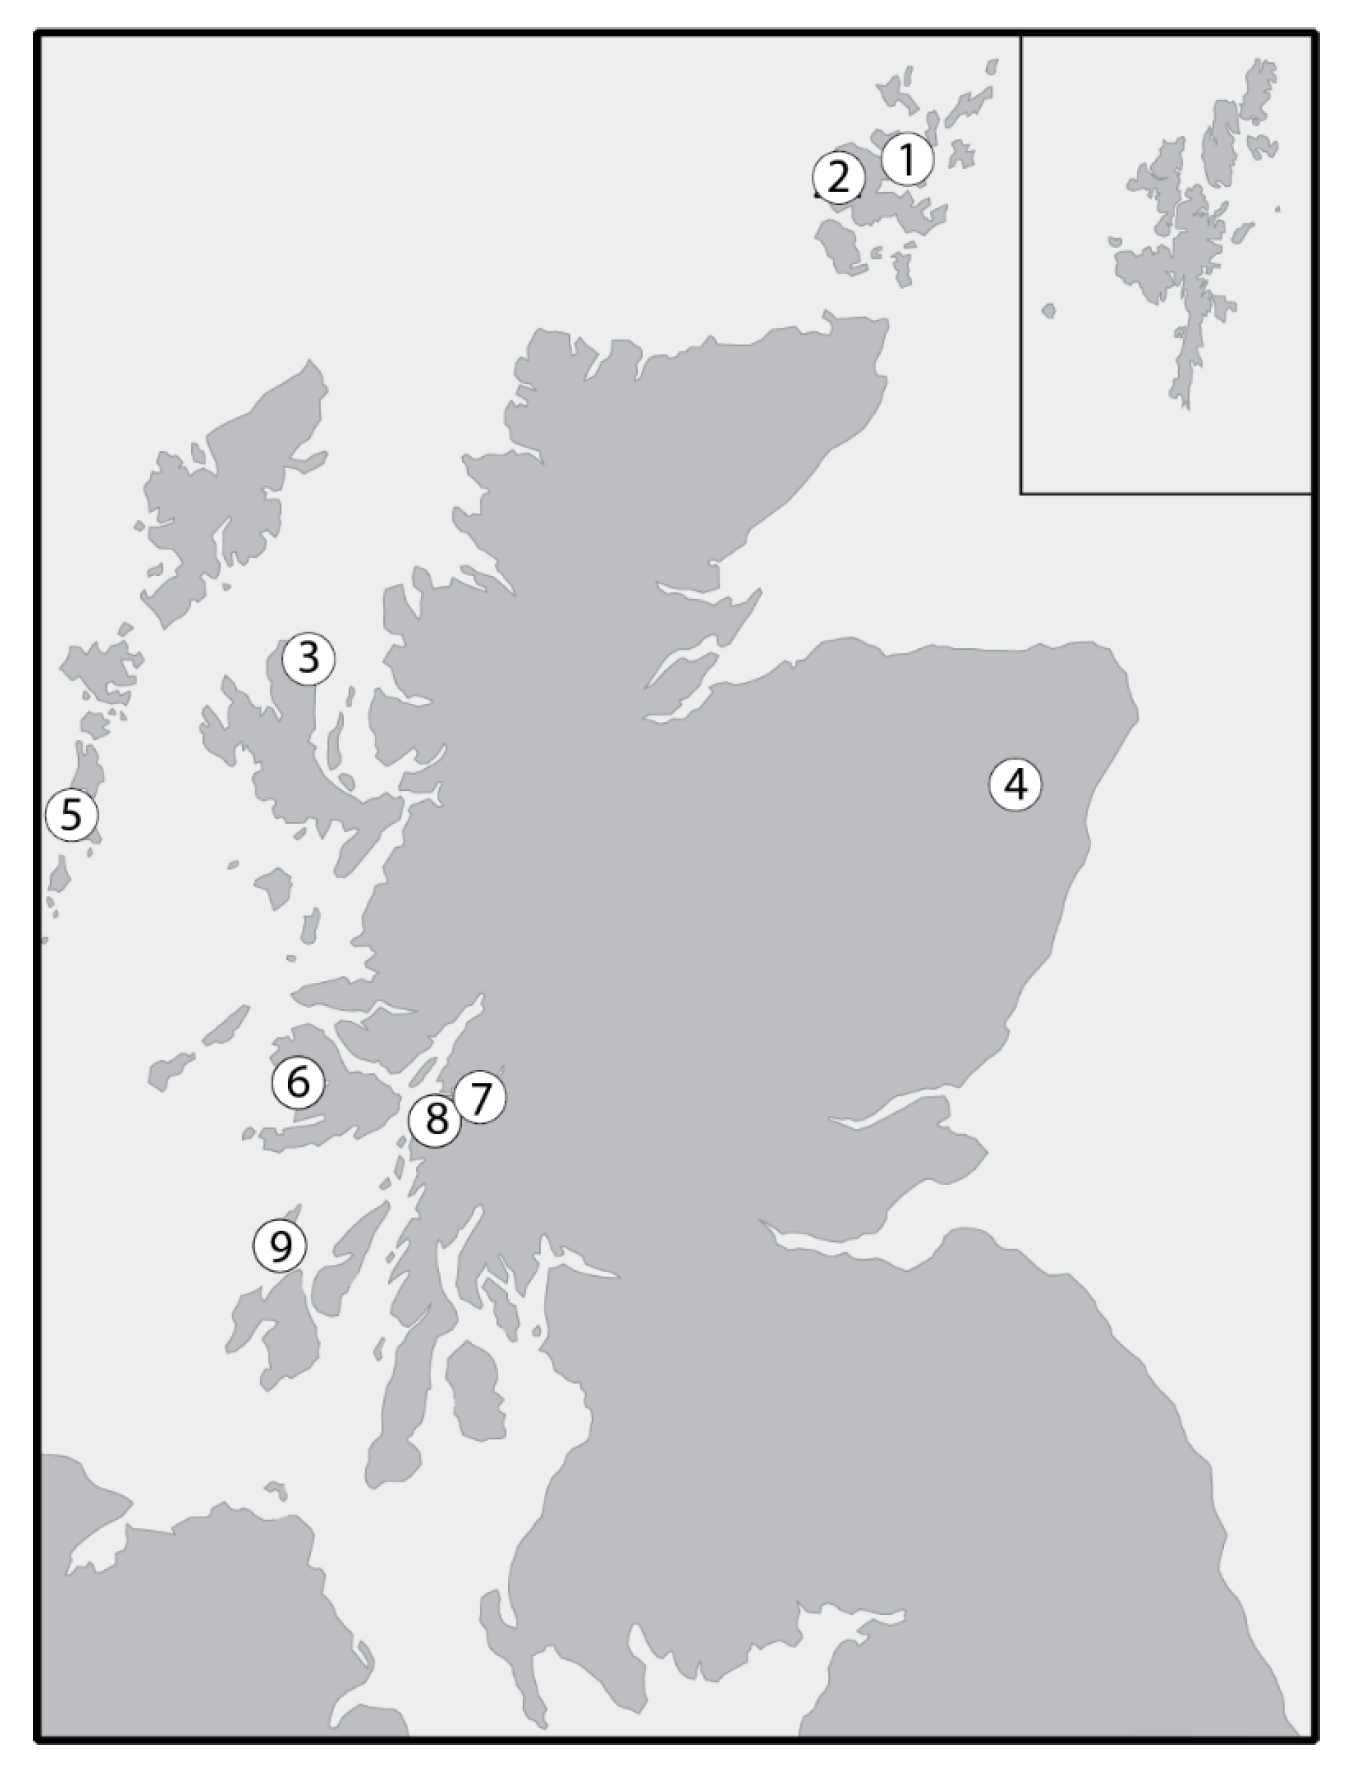
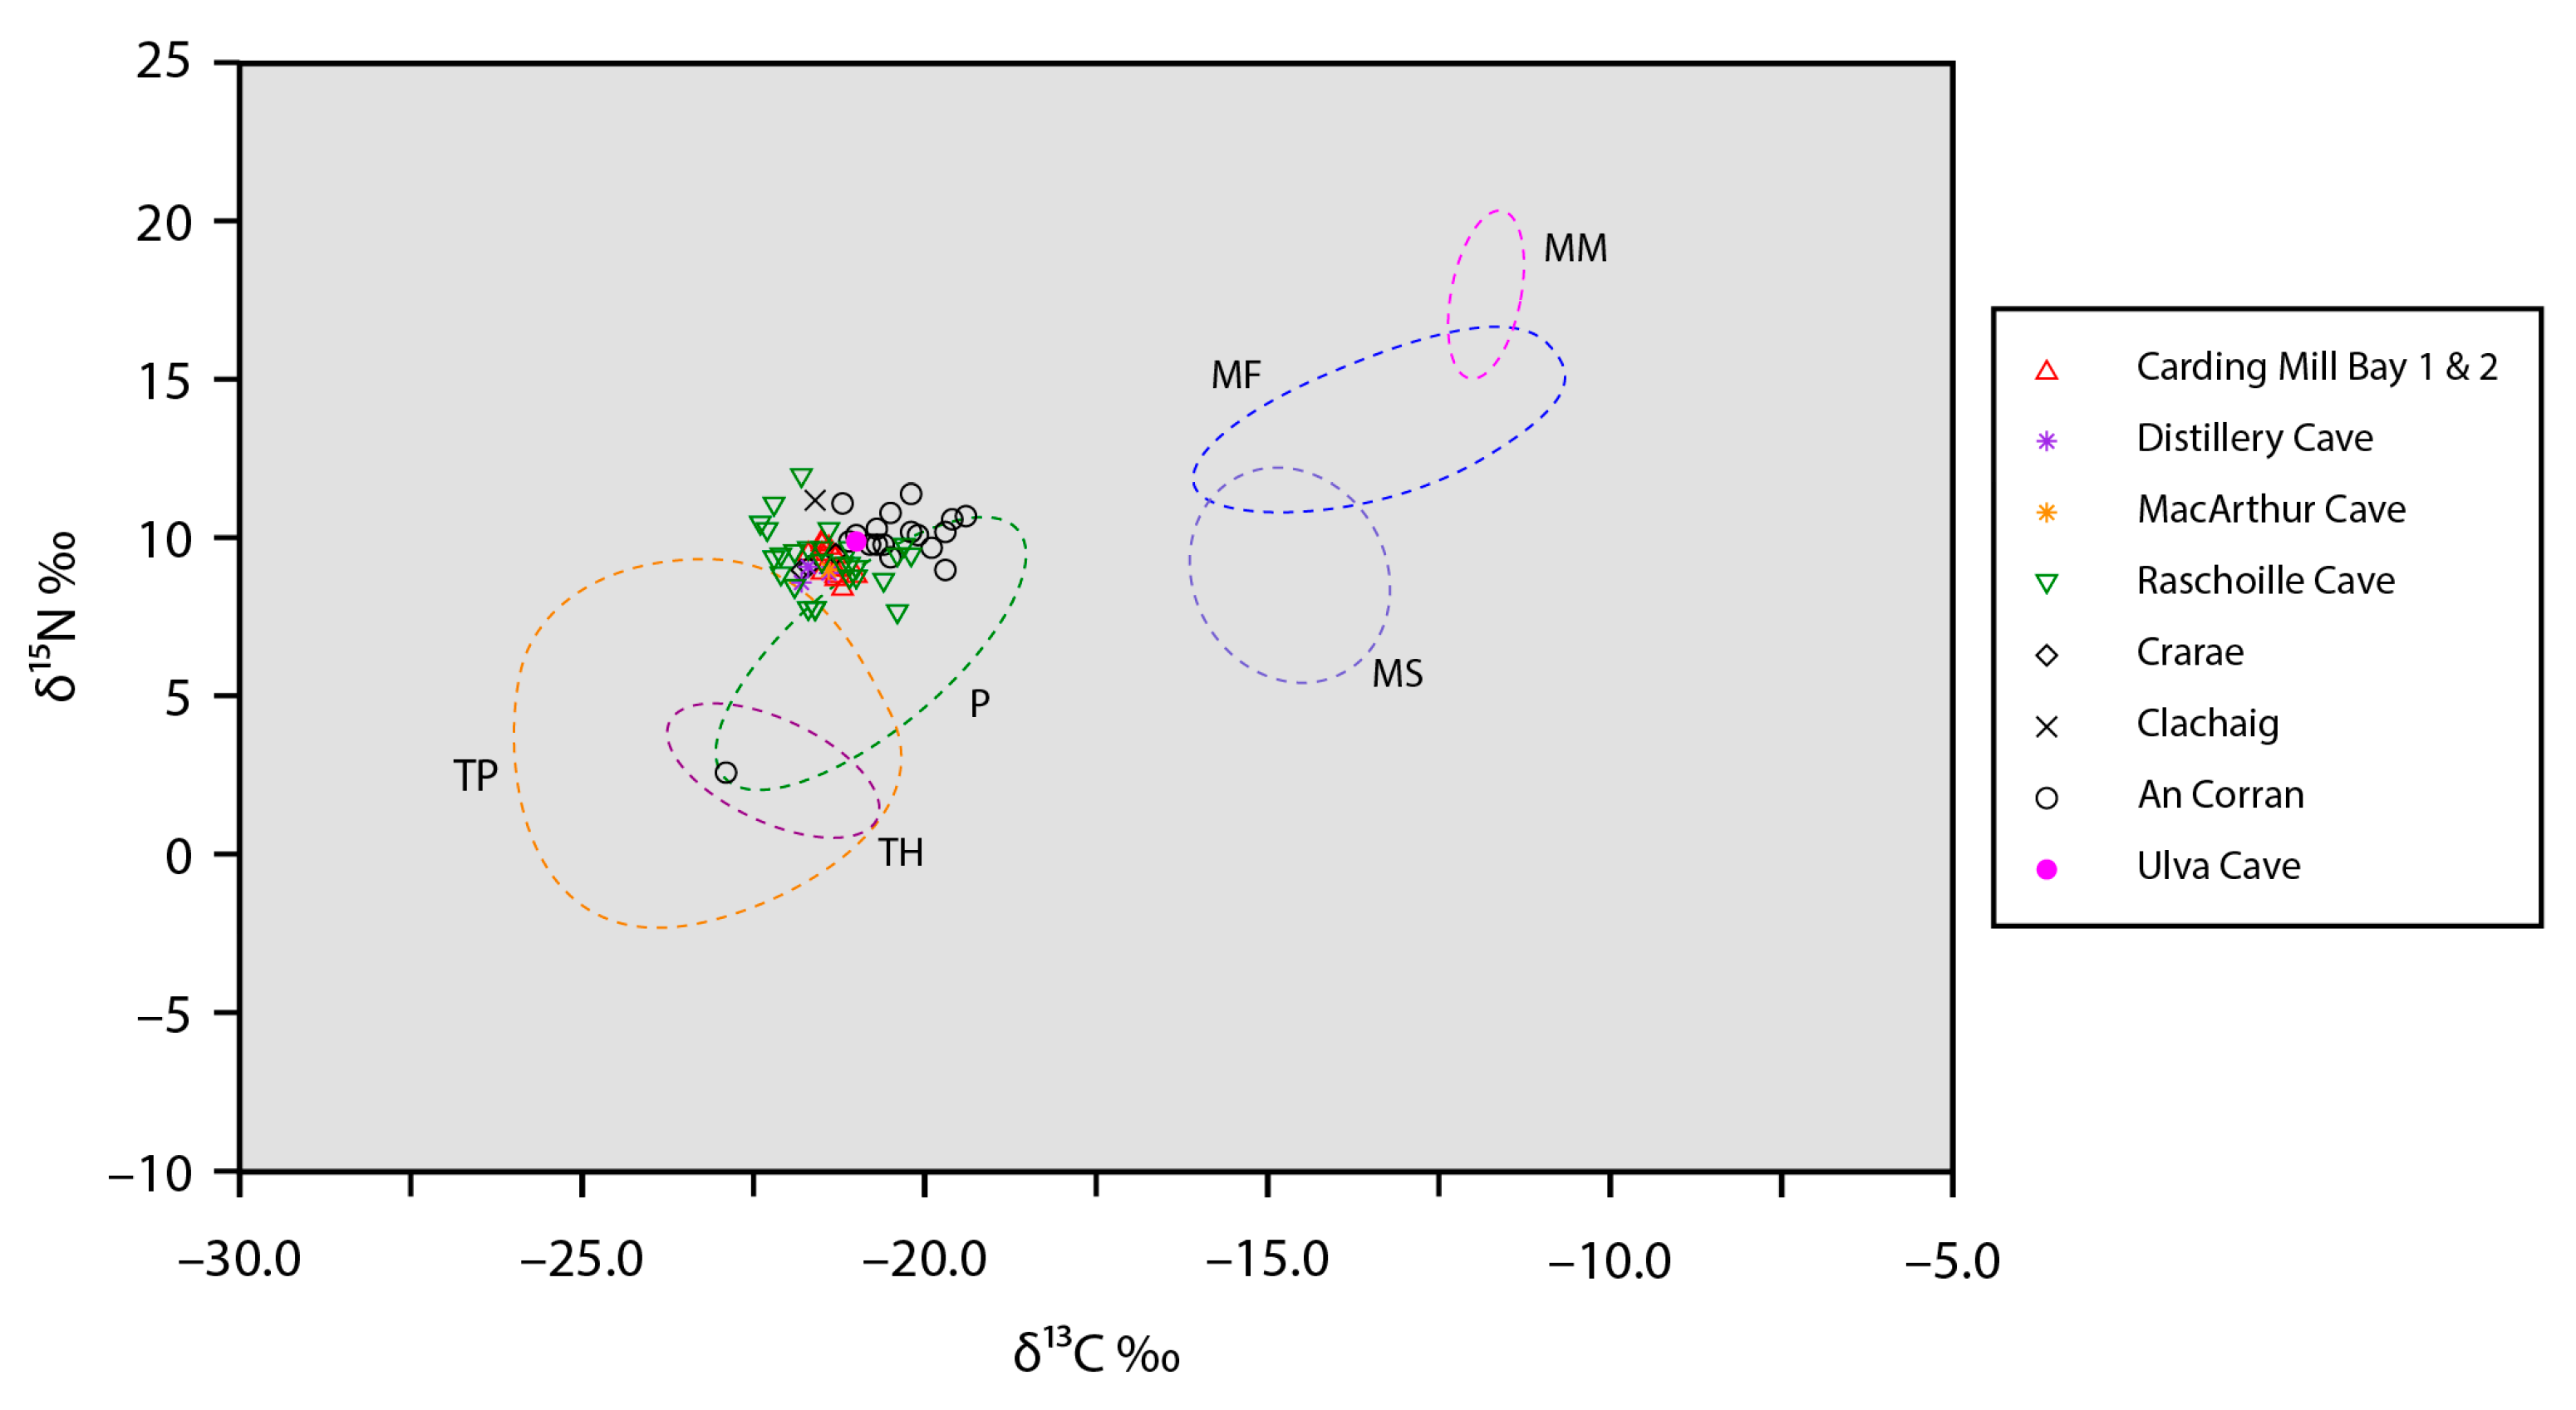
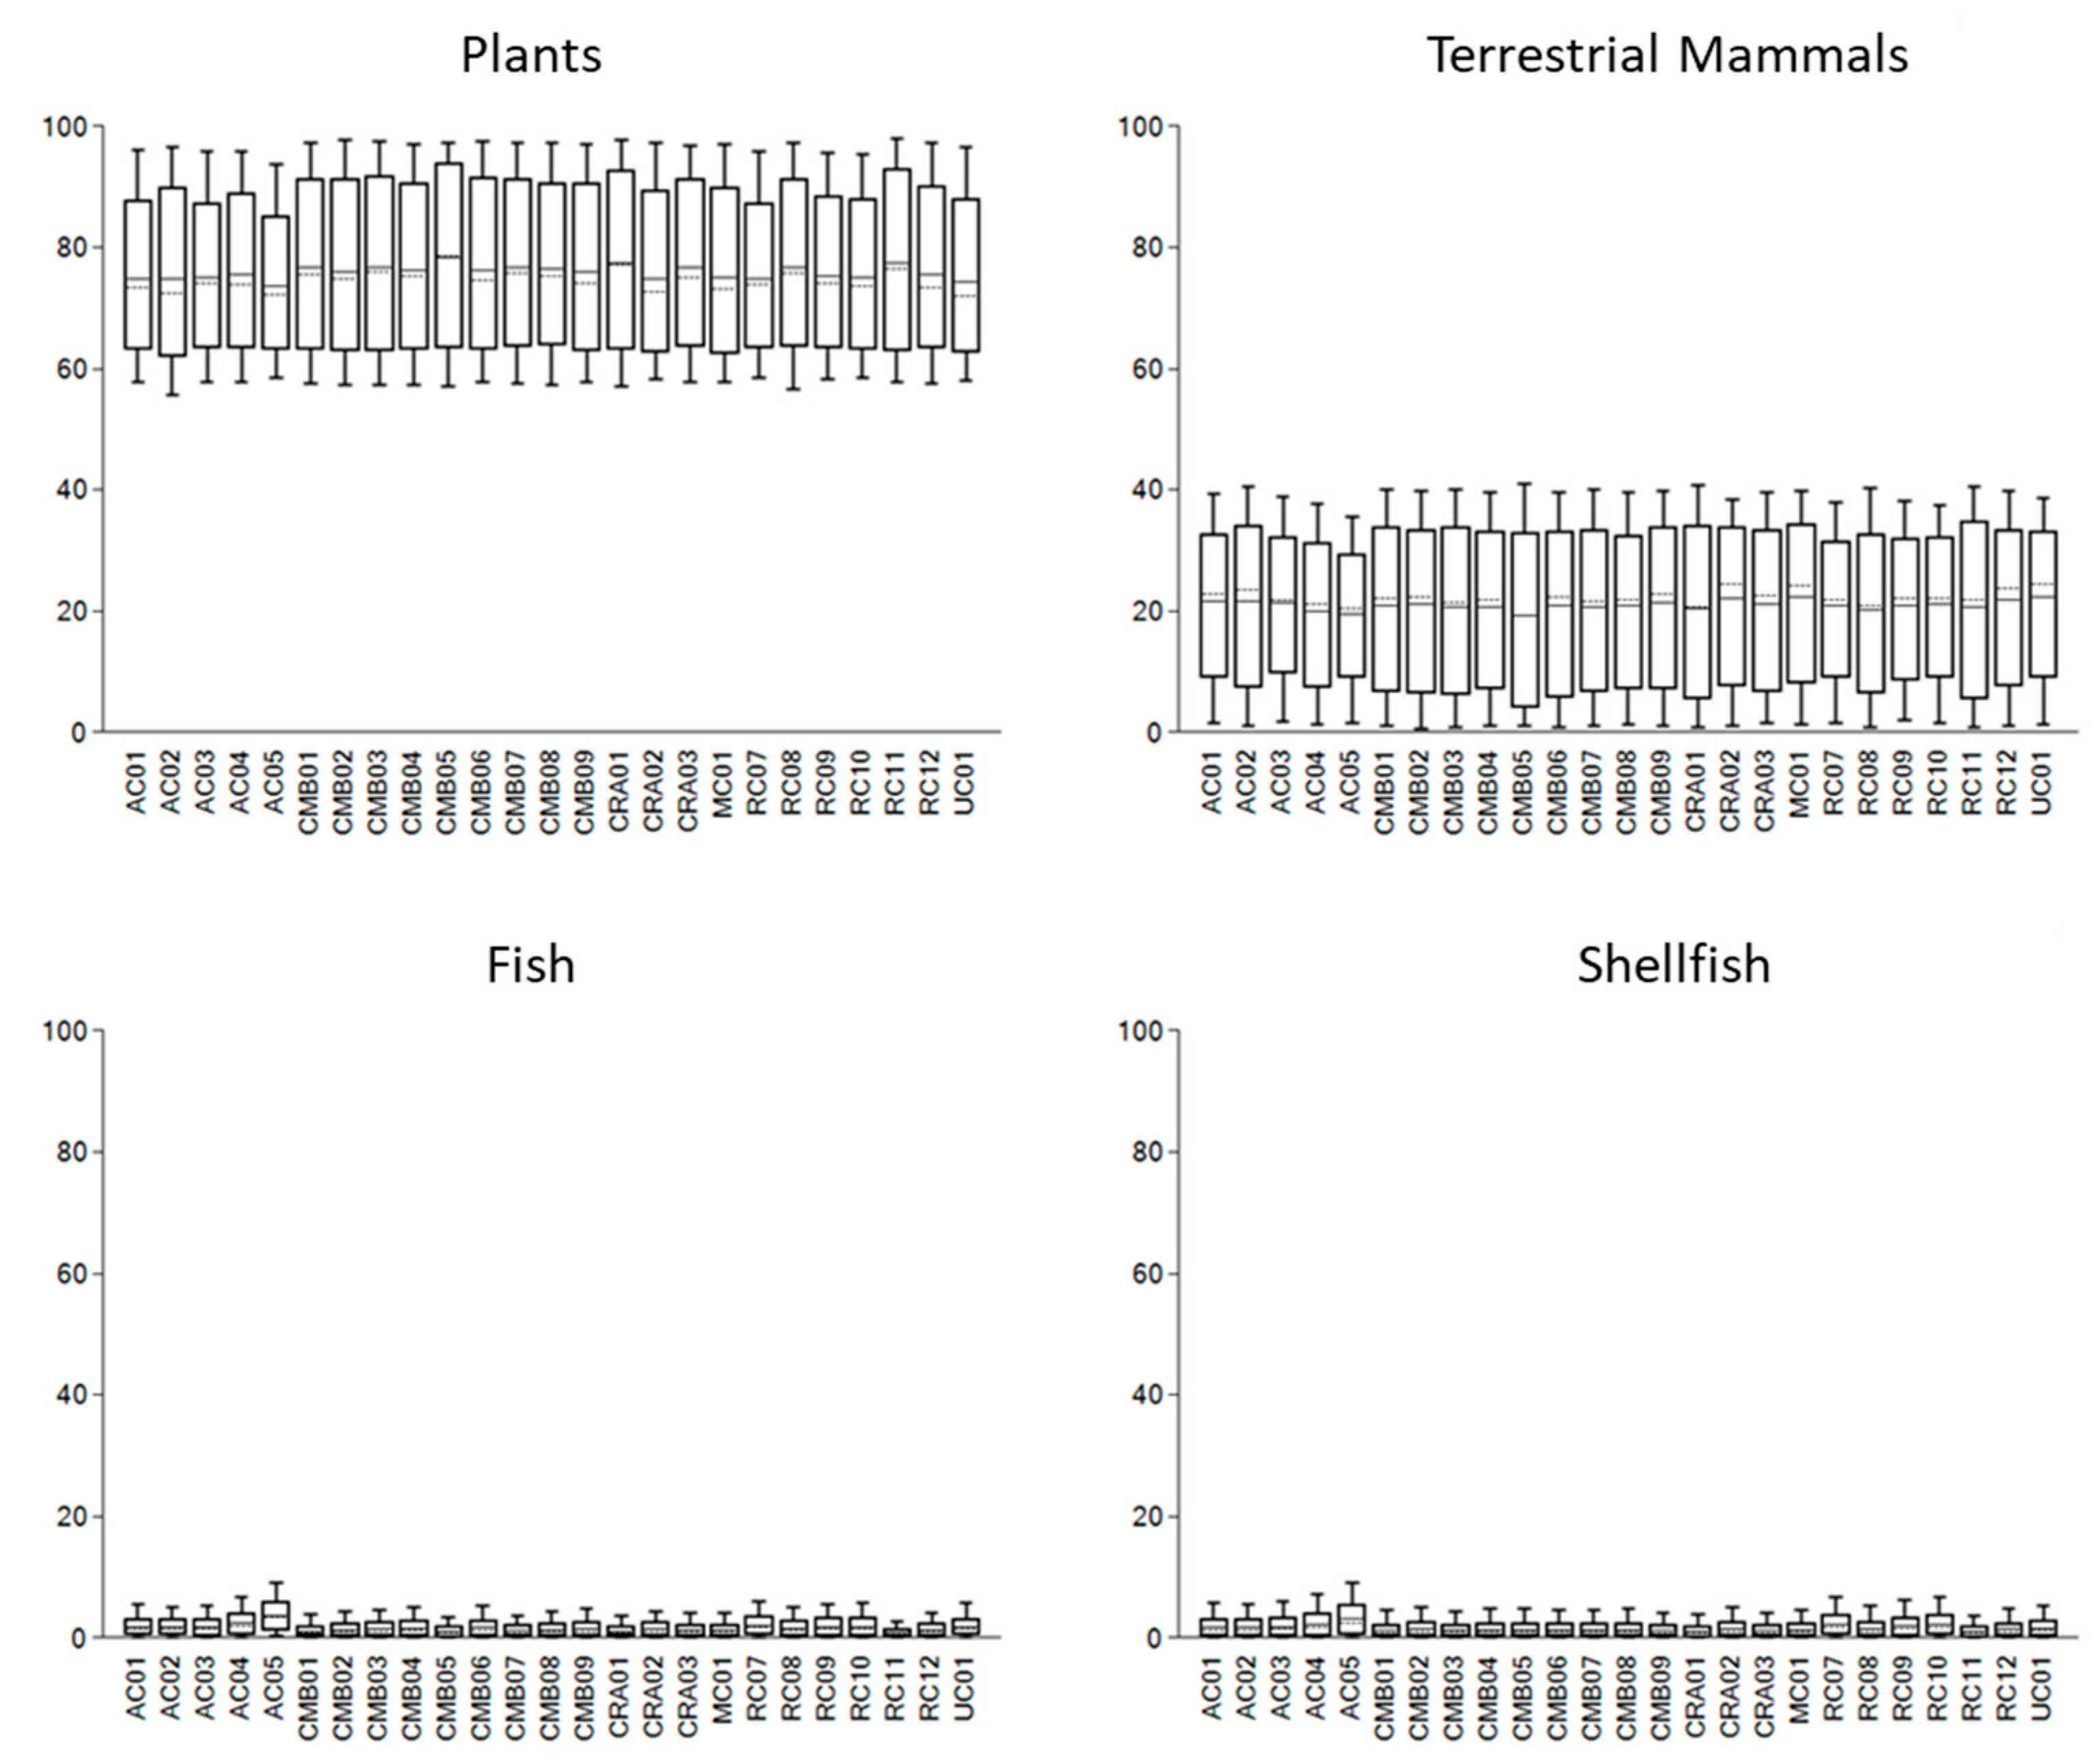
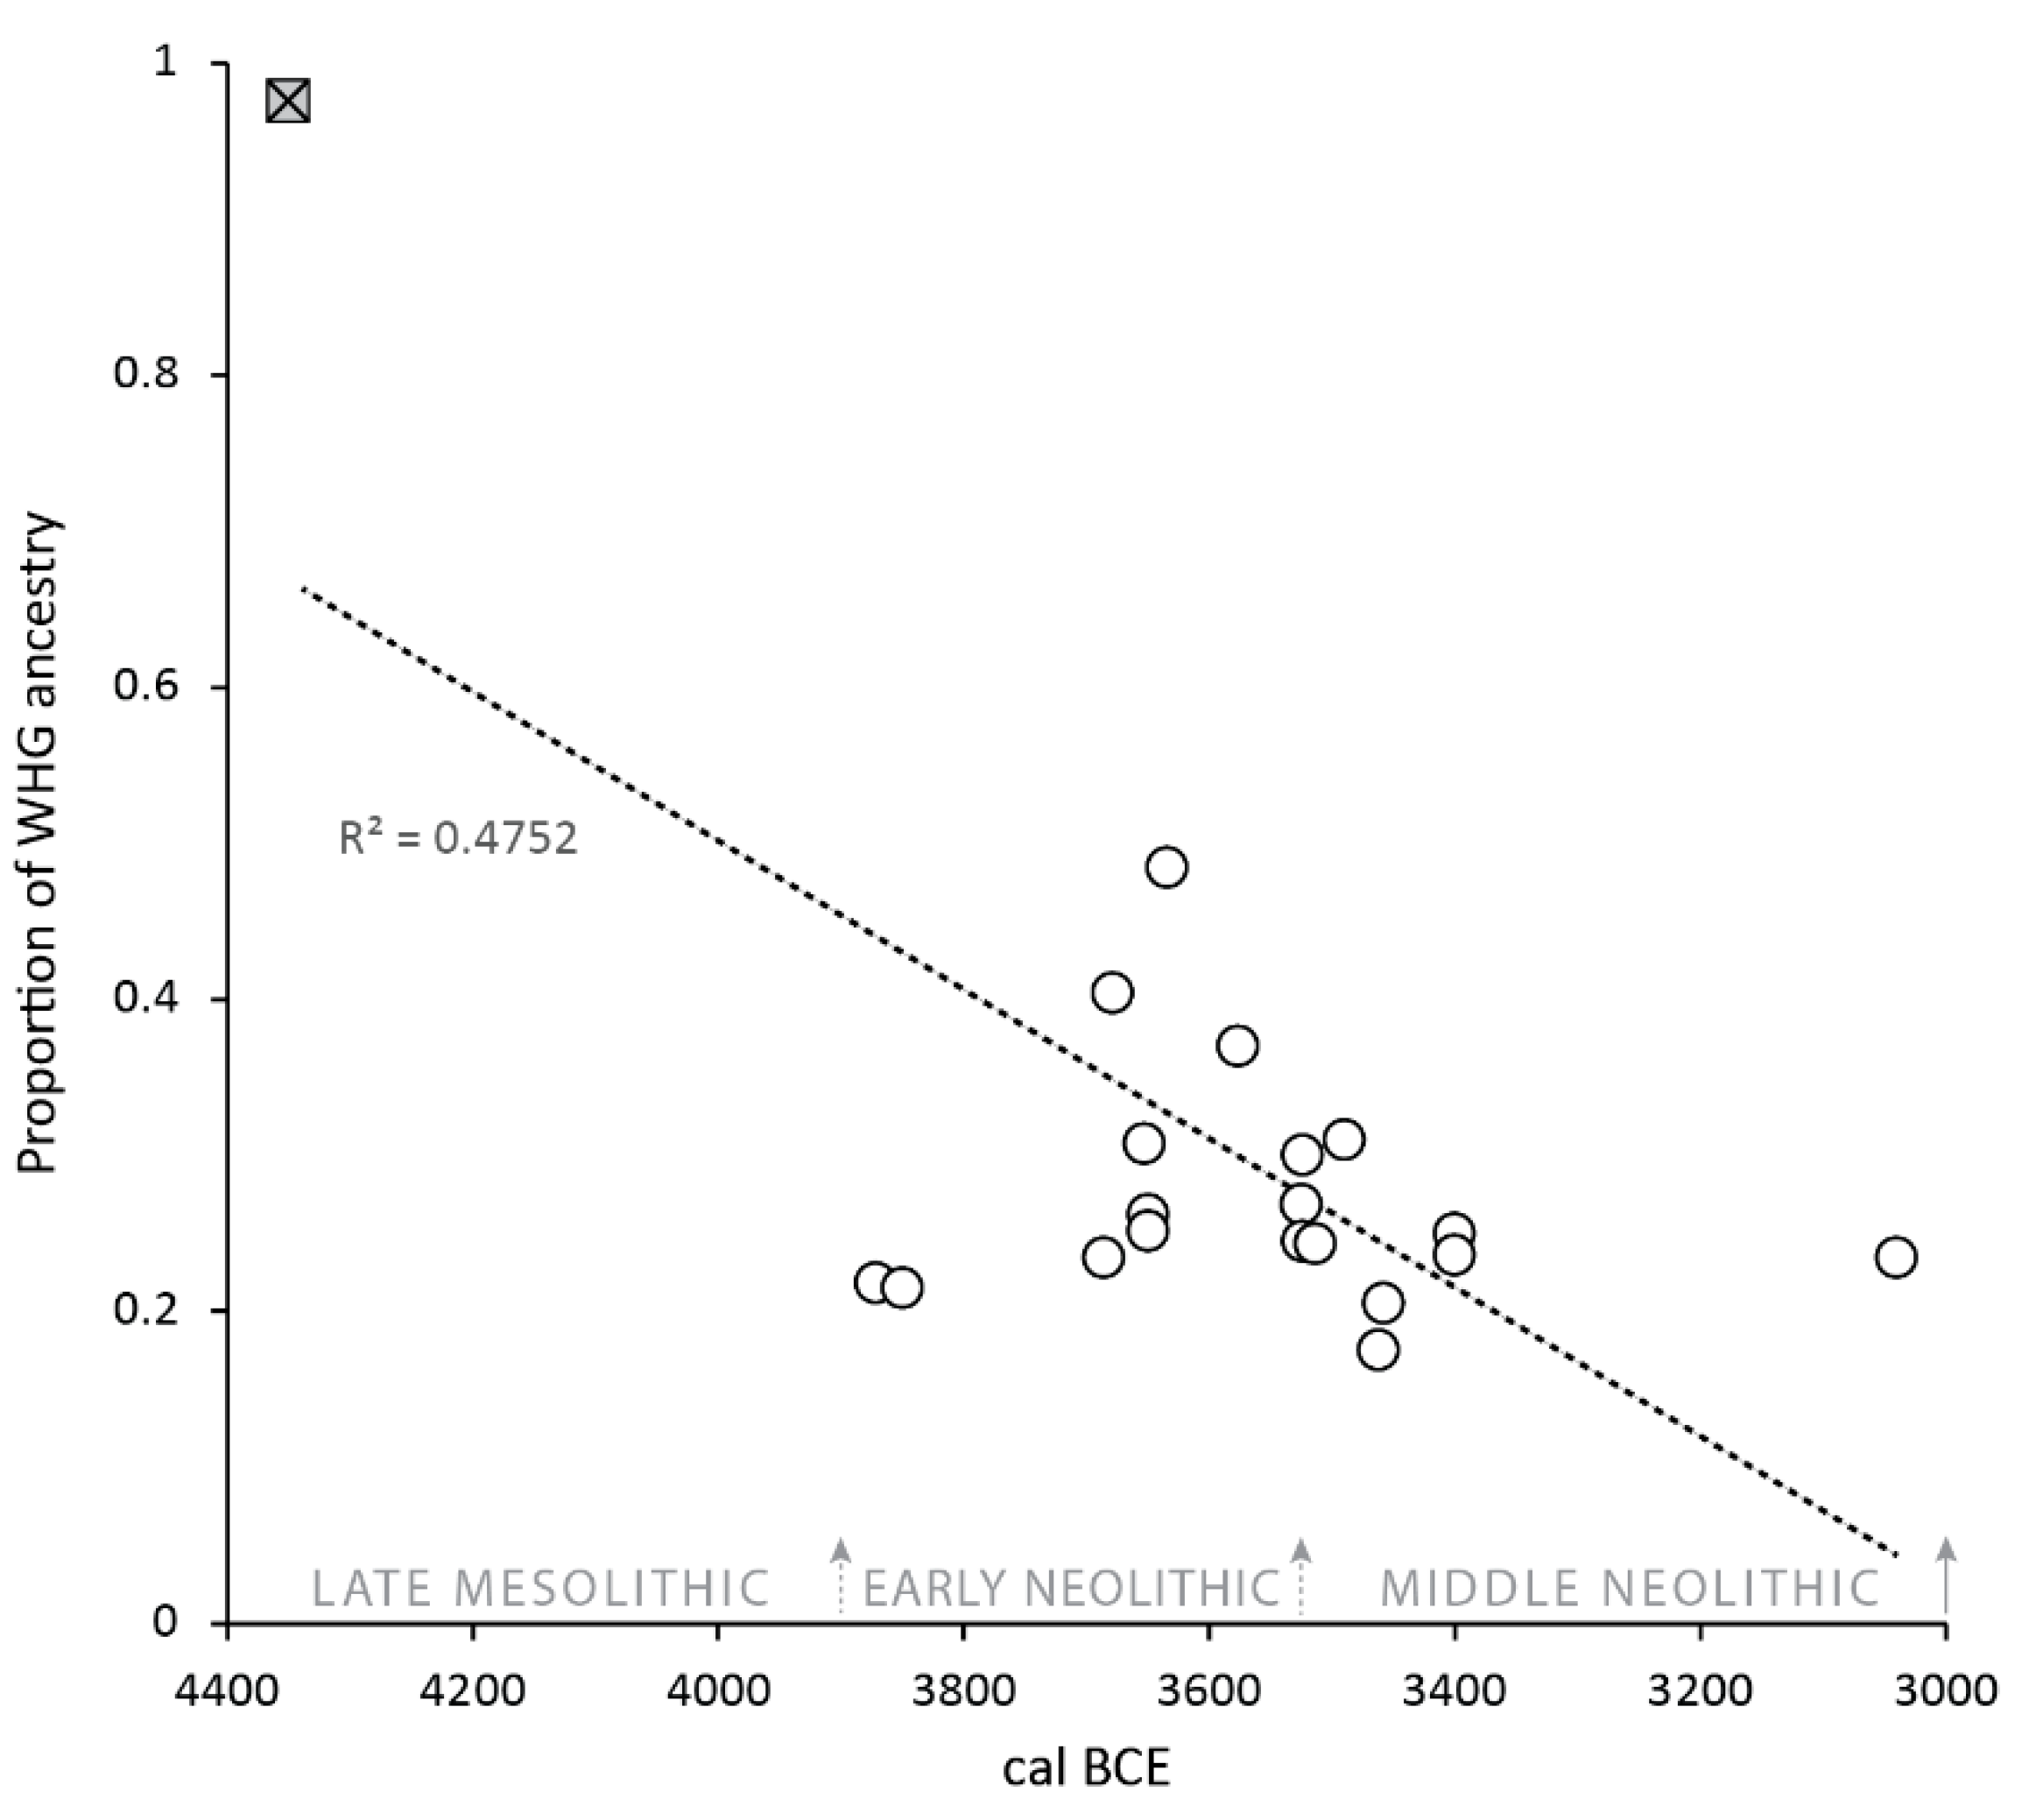
Disclaimer/Publisher’s Note: The statements, opinions and data contained in all publications are solely those of the individual author(s) and contributor(s) and not of MDPI and/or the editor(s). MDPI and/or the editor(s) disclaim responsibility for any injury to people or property resulting from any ideas, methods, instructions or products referred to in the content. |
© 2025 by the authors. Licensee MDPI, Basel, Switzerland. This article is an open access article distributed under the terms and conditions of the Creative Commons Attribution (CC BY) license (https://creativecommons.org/licenses/by/4.0/).