Article

Photodynamic Therapy of Atherosclerotic Plaque Monitored by T1 and T2 Relaxation Times of Magnetic Resonance Imaging

by
Piotr Wańczura
1,*,
David Aebisher
2,*,
Dawid Leksa
3,
Wiktoria Mytych
4,
Klaudia Dynarowicz
5,
Angelika Myśliwiec
5,
Natalia Leksa
6,
Adrian Truszkiewicz
2 and
Dorota Bartusik-Aebisher
7
1
Department of Cardiology, Medical College of Sciences, The Rzeszów University, 35-310 Rzeszów, Poland
2
Department of Photomedicine and Physical Chemistry, Medical College, The Rzeszów University, 35-310 Rzeszów, Poland
3
Rzeszów Center for Vascular and Endovascular Surgery, Rzeszów 35-310, Poland
4
English Division Science Club, Medical College, The Rzeszów University, 35-310 Rzeszów, Poland
5
Center for Innovative Research in Medical and Natural Sciences, Medical College, The Rzeszów University, 35-310 Rzeszów, Poland
6
Department of Normal and Clinical Anatomy, Medical College of Sciences, The Rzeszów University, 35-310 Rzeszów, Poland
7
Department of Biochemistry and General Chemistry, Medical College, The Rzeszów University, 35-310 Rzeszów, Poland
*
Authors to whom correspondence should be addressed.
Int. J. Transl. Med. 2024, 4(3), 505-518; https://doi.org/10.3390/ijtm4030034
Submission received: 29 May 2024 / Revised: 21 July 2024 / Accepted: 25 July 2024 / Published: 5 August 2024

Abstract

:
Atherosclerosis, marked by plaque accumulation within arteries, results from lipid dysregulation, inflammation, and vascular remodeling. Plaque composition, including lipid-rich cores and fibrous caps, determines stability and vulnerability. Photodynamic therapy (PDT) has emerged as a promising treatment, leveraging photosensitizers to induce localized cytotoxicity upon light activation. PDT targets plaque components selectively, reducing burden and inflammation. Challenges remain in optimizing PDT parameters and translating preclinical success to clinical efficacy. Nonetheless, PDT offers a minimally invasive strategy for atherosclerosis management, promising personalized interventions for cardiovascular health. The objective of the current study was to present the findings from quantitative non-contrast MRI of atherosclerosis post-PDT by assessing relaxation times. The study aimed to utilize and optimize a 1.5T MRI system. Clinical scanners were used for MRI examinations. The research involved analyzing T1 and T2 relaxation times. Following treatment of the samples with Rose Bengal and exposure to pure oxygen, PDT irradiation was administered. The results indicated that the therapy impacted the crus, evidenced by a significant decrease in relaxation times in the MRI data.

1. Introduction

Atherosclerosis and its consequences are still the main cause of mortality in developed societies [1], and the development of technologies and treatment methods will not reach a level that we could call a breakthrough in this field. Although the milestones were platelet drugs or statins [2,3], as well as various methods of revascularization of coronary [4,5], cervical [6], or peripheral vessels [7], the question remains whether it is possible to inhibit atherosclerosis globally around the main vascular beds distributing blood to the central nervous system, coronary arteries, kidney, or lower limb peripheral arteries. Treatment of atherosclerosis that significantly narrows the lumen of the vessels is scientifically established; the so-called borderline or insignificant lesions are a gray zone in the recommendations [8]. In the case of coronary artery disease, the cut-off values for atherosclerotic lesions significantly affecting stenosis and being the cause of ischemia were quite clear and transparent. The cut-off value of invasive FFR (fractional flow reserve) of <0.75 [9] and the non-invasive [10] or cross-sectional area, for example of the left main coronary artery (LM) below 6 mm2 [11], were confirmed to impact cardiovascular death in many trials. Their consequence are the guidelines of the European and American cardiac associations, which recommend treating or leaving untreated the mentioned coronary artery changes [12,13]. The management of atherosclerosis of the carotid arteries, responsible for ischemic strokes, or arteries of the vessels of the lower limbs, leading to intermittent claudication, is equally clear and defined [14,15]. The detection of TCFA or the assessment of the significance of stenosis is therefore precisely defined and possible in many vascular areas [16,17]. Magnetic Resonance Imaging (MRI) plays a crucial role in evaluating atherosclerosis, particularly in assessing changes in tissue characteristics following treatment. MRI relaxation times, specifically T1 and T2 relaxation times, provide detailed information about the tissue composition and structural integrity of atherosclerotic plaques. After treatment, such as lipid-lowering therapy or anti-inflammatory medication, changes in these relaxation times can indicate a reduction in plaque lipid content and inflammation, suggesting plaque stabilization or regression. Monitoring these parameters helps in evaluating the efficacy of the treatment and in making informed decisions about patient management. Changes in these relaxation times after PDT treatment can provide valuable insight into the efficacy of therapy and the underlying mechanisms of plaque stabilization and regression. Despite these advantages, the specific rationale for using PDT in the context of its effect on T1 and T2 relaxation times in atherosclerosis has not been clearly defined in previous studies. The inclusion of PDT in our study aims to fill this gap by highlighting its dual role as both a therapeutic and a diagnostic tool. By demonstrating the effects of PDT on T1 and T2 relaxation times, we aim to provide a comprehensive understanding of its potential to improve the treatment of atherosclerosis. This integrated approach not only underscores the innovative application of PDT but is also consistent with the broader goal of advancing cardiovascular imaging and therapy. The question remains open whether the current atherosclerotic lesions narrowing the lumen of the vessel to an insignificant degree, but meeting the criteria of vulnerable plaques, should only be treated conservatively. The goal of this article is to characterize atherosclerotic plaques, considering distinctive features useful for determining effectiveness of the application of photodynamic therapy (PDT).

Atherosclerosis Characteristics

The key pathophysiological element, which is the common nomenclature of the above-mentioned destinations, is the concept of forming or already present atherosclerotic plaque [18]. The concept of inflammation as a pivotal reason for the pathogenesis of atherosclerosis and its complications has achieved considerable attention but has not yet entered routine clinical practice [19]. Atherosclerosis is a lipoprotein-driven disease that over time leads to plaque formation at specific sites of the arterial tree due to a continuous process of intimal inflammation, necrosis, fibrosis, and calcification [20]. After decades of silent progression, such plaques may suddenly become more severe and cause life-threatening coronary thrombosis, presenting as an acute coronary syndrome. Most often, the culprit morphology is plaque rupture or local erosion with exposure of highly thrombogenic, red cell-rich necrotic core material [21]. The prognosis is more favorable for onset of the disease in stable coronary artery disease, when, over time, the atherosclerotic plaque builds up, hardens, and consequently narrows the lumen of the arteries, in this way reducing blood flow [22]. The artery walls also become thickened and stiff. This obstructive stable plaque can be detected and treated; however, the artery walls have never been brought back to their state before the onset of atherosclerosis [23]. Soft atherosclerotic plaques are a much bigger problem, leading in the case of coronary artery disease to acute coronary syndromes, including myocardial infarction or even in the worst scenario to sudden cardiac death, because the plaque can burst, leading to blood clot creation, thus starting a cascade resulting in the activation of fibrinogen platelets and the formation of the so-called primary plug [24]. These types of cases affect a section of the younger population and are associated with the presence of vulnerable atherosclerotic plaques referred to as TCFA [25]. A high content of lipid tissues and a poor connective tissue cap are the essence of this type of most vulnerable plaque [26].

2. Materials and Methods

2.1. Carotid Artery Samples

The study design is the first phase of a prospective population-based study observing the composition of atherosclerotic plaque lesions and, at a later stage, the effect of PDT therapy. The study aimed to apply an MRI method to evaluate in vitro sections of atherosclerotic plaques after PDT therapy with Rose Bengal, focusing on changes in T1 and T2 relaxation times. The research received approval (No. 17/02/2019) from the Bioethics Committee at the University of Rzeszów. A patient with clinically diagnosed atherosclerotic plaque in a specified artery was included. The study presents a sample from a male patient carotid artery with clinical vascular changes and diagnosed atherosclerosis at the time of vessel collection. Carotid artery tissue samples were obtained by endarterectomy. The study protocol was approved, and the participant gave informed consent for the use of sections from his body. A sample of a vessel with atherosclerosis lesions was taken under surgical conditions by a vascular surgeon. The sample was frozen at −80 degrees Celsius until it was removed. The sample took about 5 h to thaw at room temperature, and no thermal procedures were used (Figure 1). From the obtained specimen we prepared 5 samples with atherosclerosis with RB and 1 control sample only with RB (n = 6).

2.2. Rose Bengal Concentration

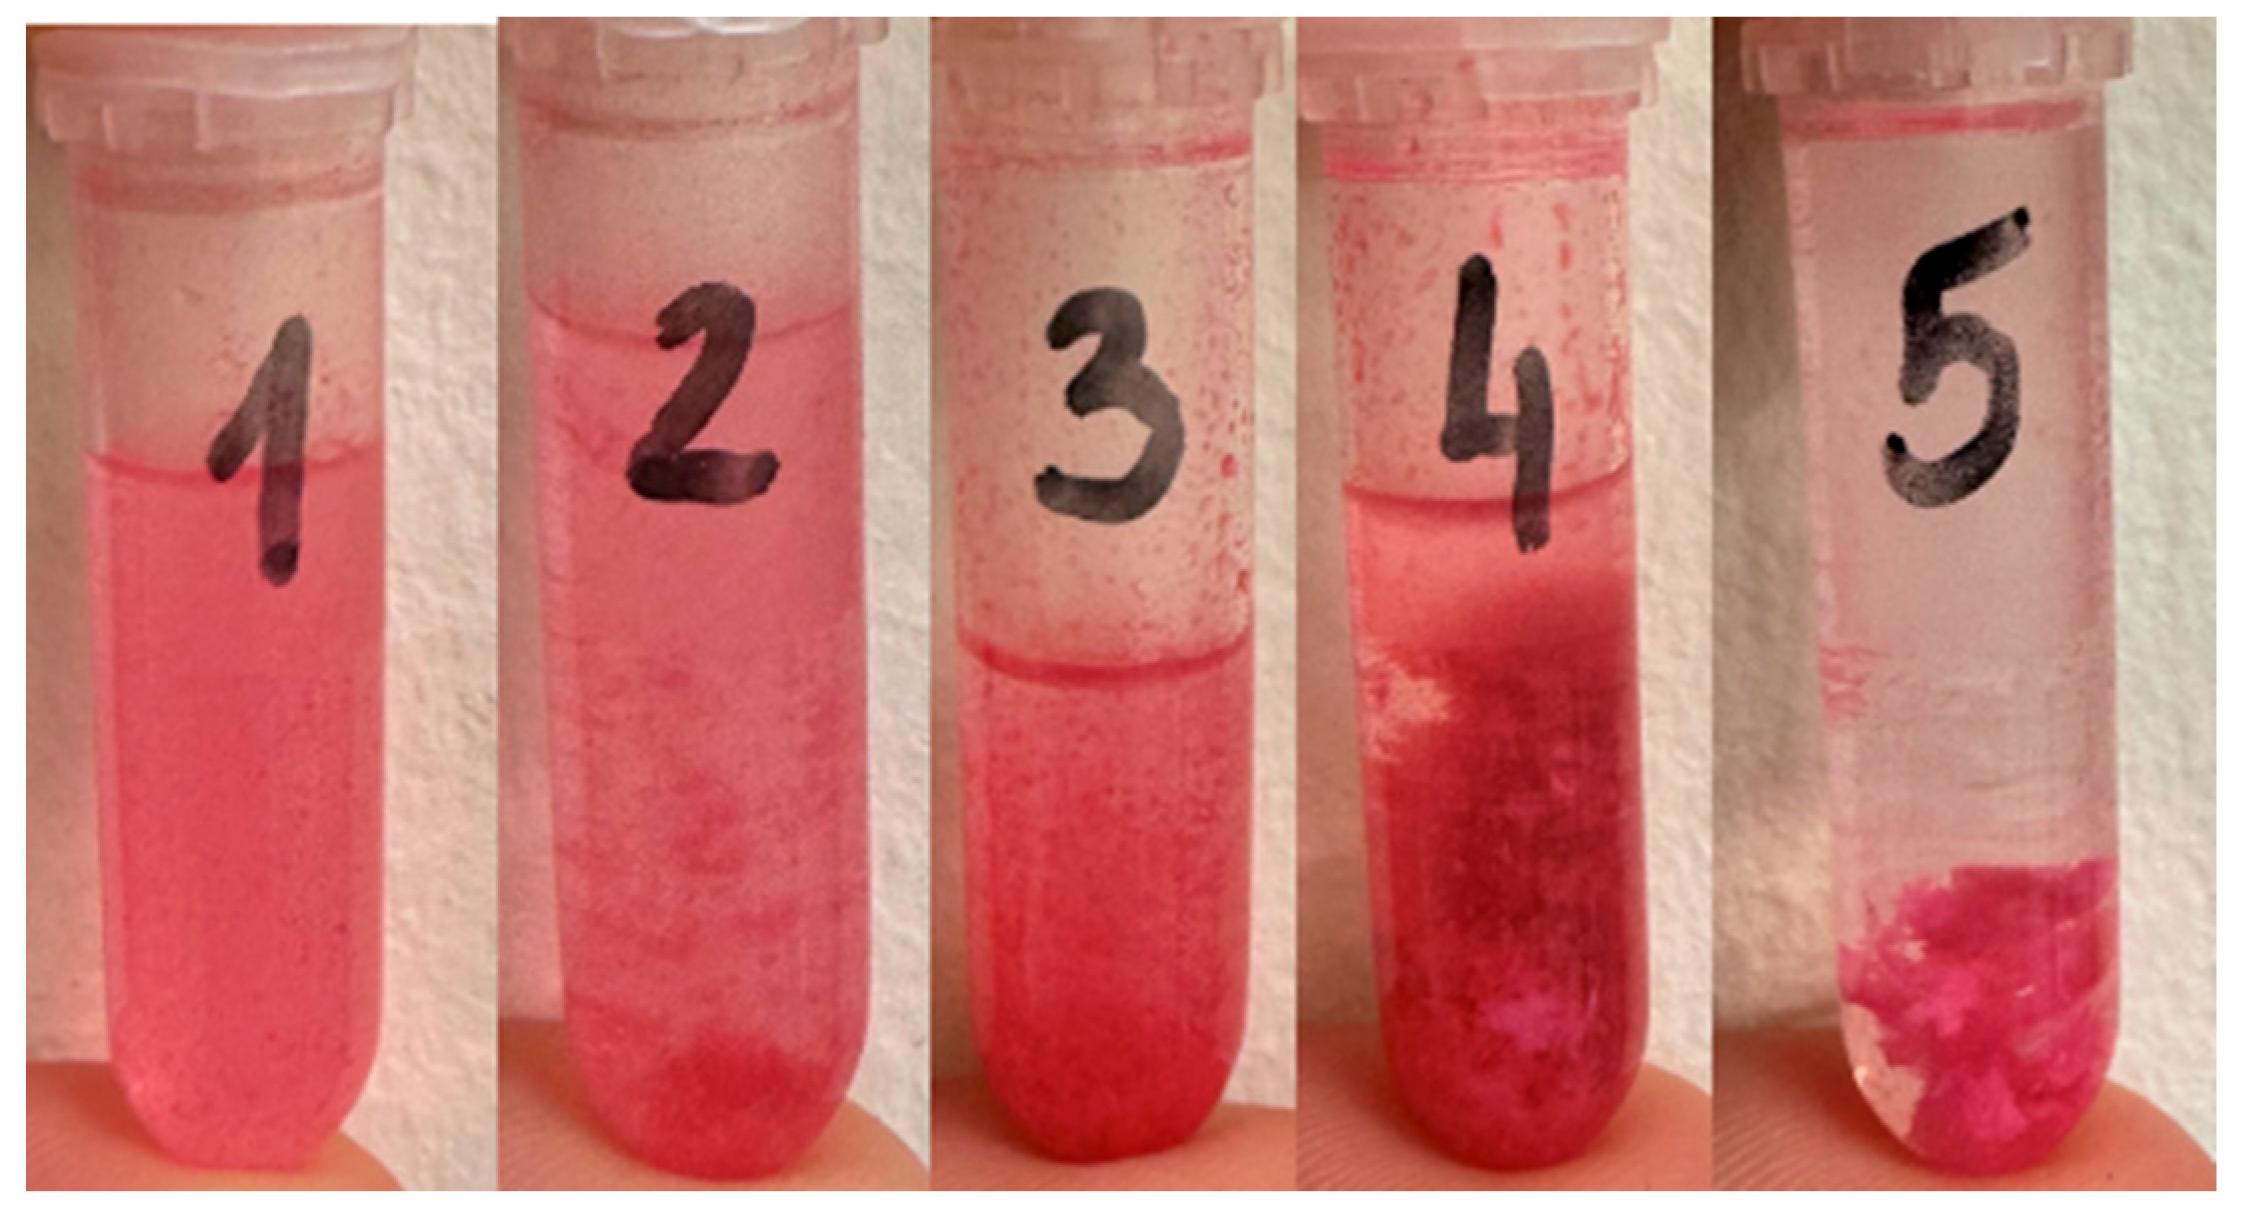
Rose Bengal disodium salt (95%) was used at concentrations of 0.01 mM, 0.02 mM, 0.03 mM, 0.04 mM, and 0.05 mM, with each concentration applied to each sample. Oxygen gas (99%) was obtained from STP & DIN Chemicals, Bielsko-Biała, Poland. The water for preparing the RB stock solutions was purified using the AquaB Duo reverse osmosis system from Fresenius Medical Care, Singapore (Figure 2). The concentration of RB applied to the tissue ranged from 0.01 mM to 0.05 mM. Lower concentrations, such as 0.01 mM, were rapidly adsorbed. Higher concentrations were able to penetrate and diffuse into the tissue.

2.3. PDT Procedure

Samples were injected with 0.1 mL of various RB concentrations and irradiated at 532 nm for 15 min. The radiant power of the 532 nm light was measured using a Newport power meter, model 1918-C. To optimize the distance between the laser light source and the samples, studies were conducted to measure tissue temperature and laser spot size by adjusting the light at distances of 5 cm, 10 cm, and 15 cm from the tissue. A solid-state laser (LD Pumped All-Solid-State Green Laser, MGL-III-532 nm/300 mW) provided 532 nm light, which is near the maximum absorption wavelength of RB. The laser was connected to a fiber optic cable. The distance between the light source and the tissue surface was chosen to avoid excessive heating, with sample temperatures not exceeding 30 °C after 15 min of exposure. The light source was positioned at a distance from the tissue surface to create an illumination area of 2.5 × 2.5 cm2. Laser fluence was determined using the formulas: energy [J] = power [W] × time [s], and fluence = energy [J]/area [cm2]. For instance, 15 min (900 s) of irradiation over an area of 6.25 cm2 with a 300 mW laser results in a fluence of 43.2 J/cm2.

2.4. MRI Analysis

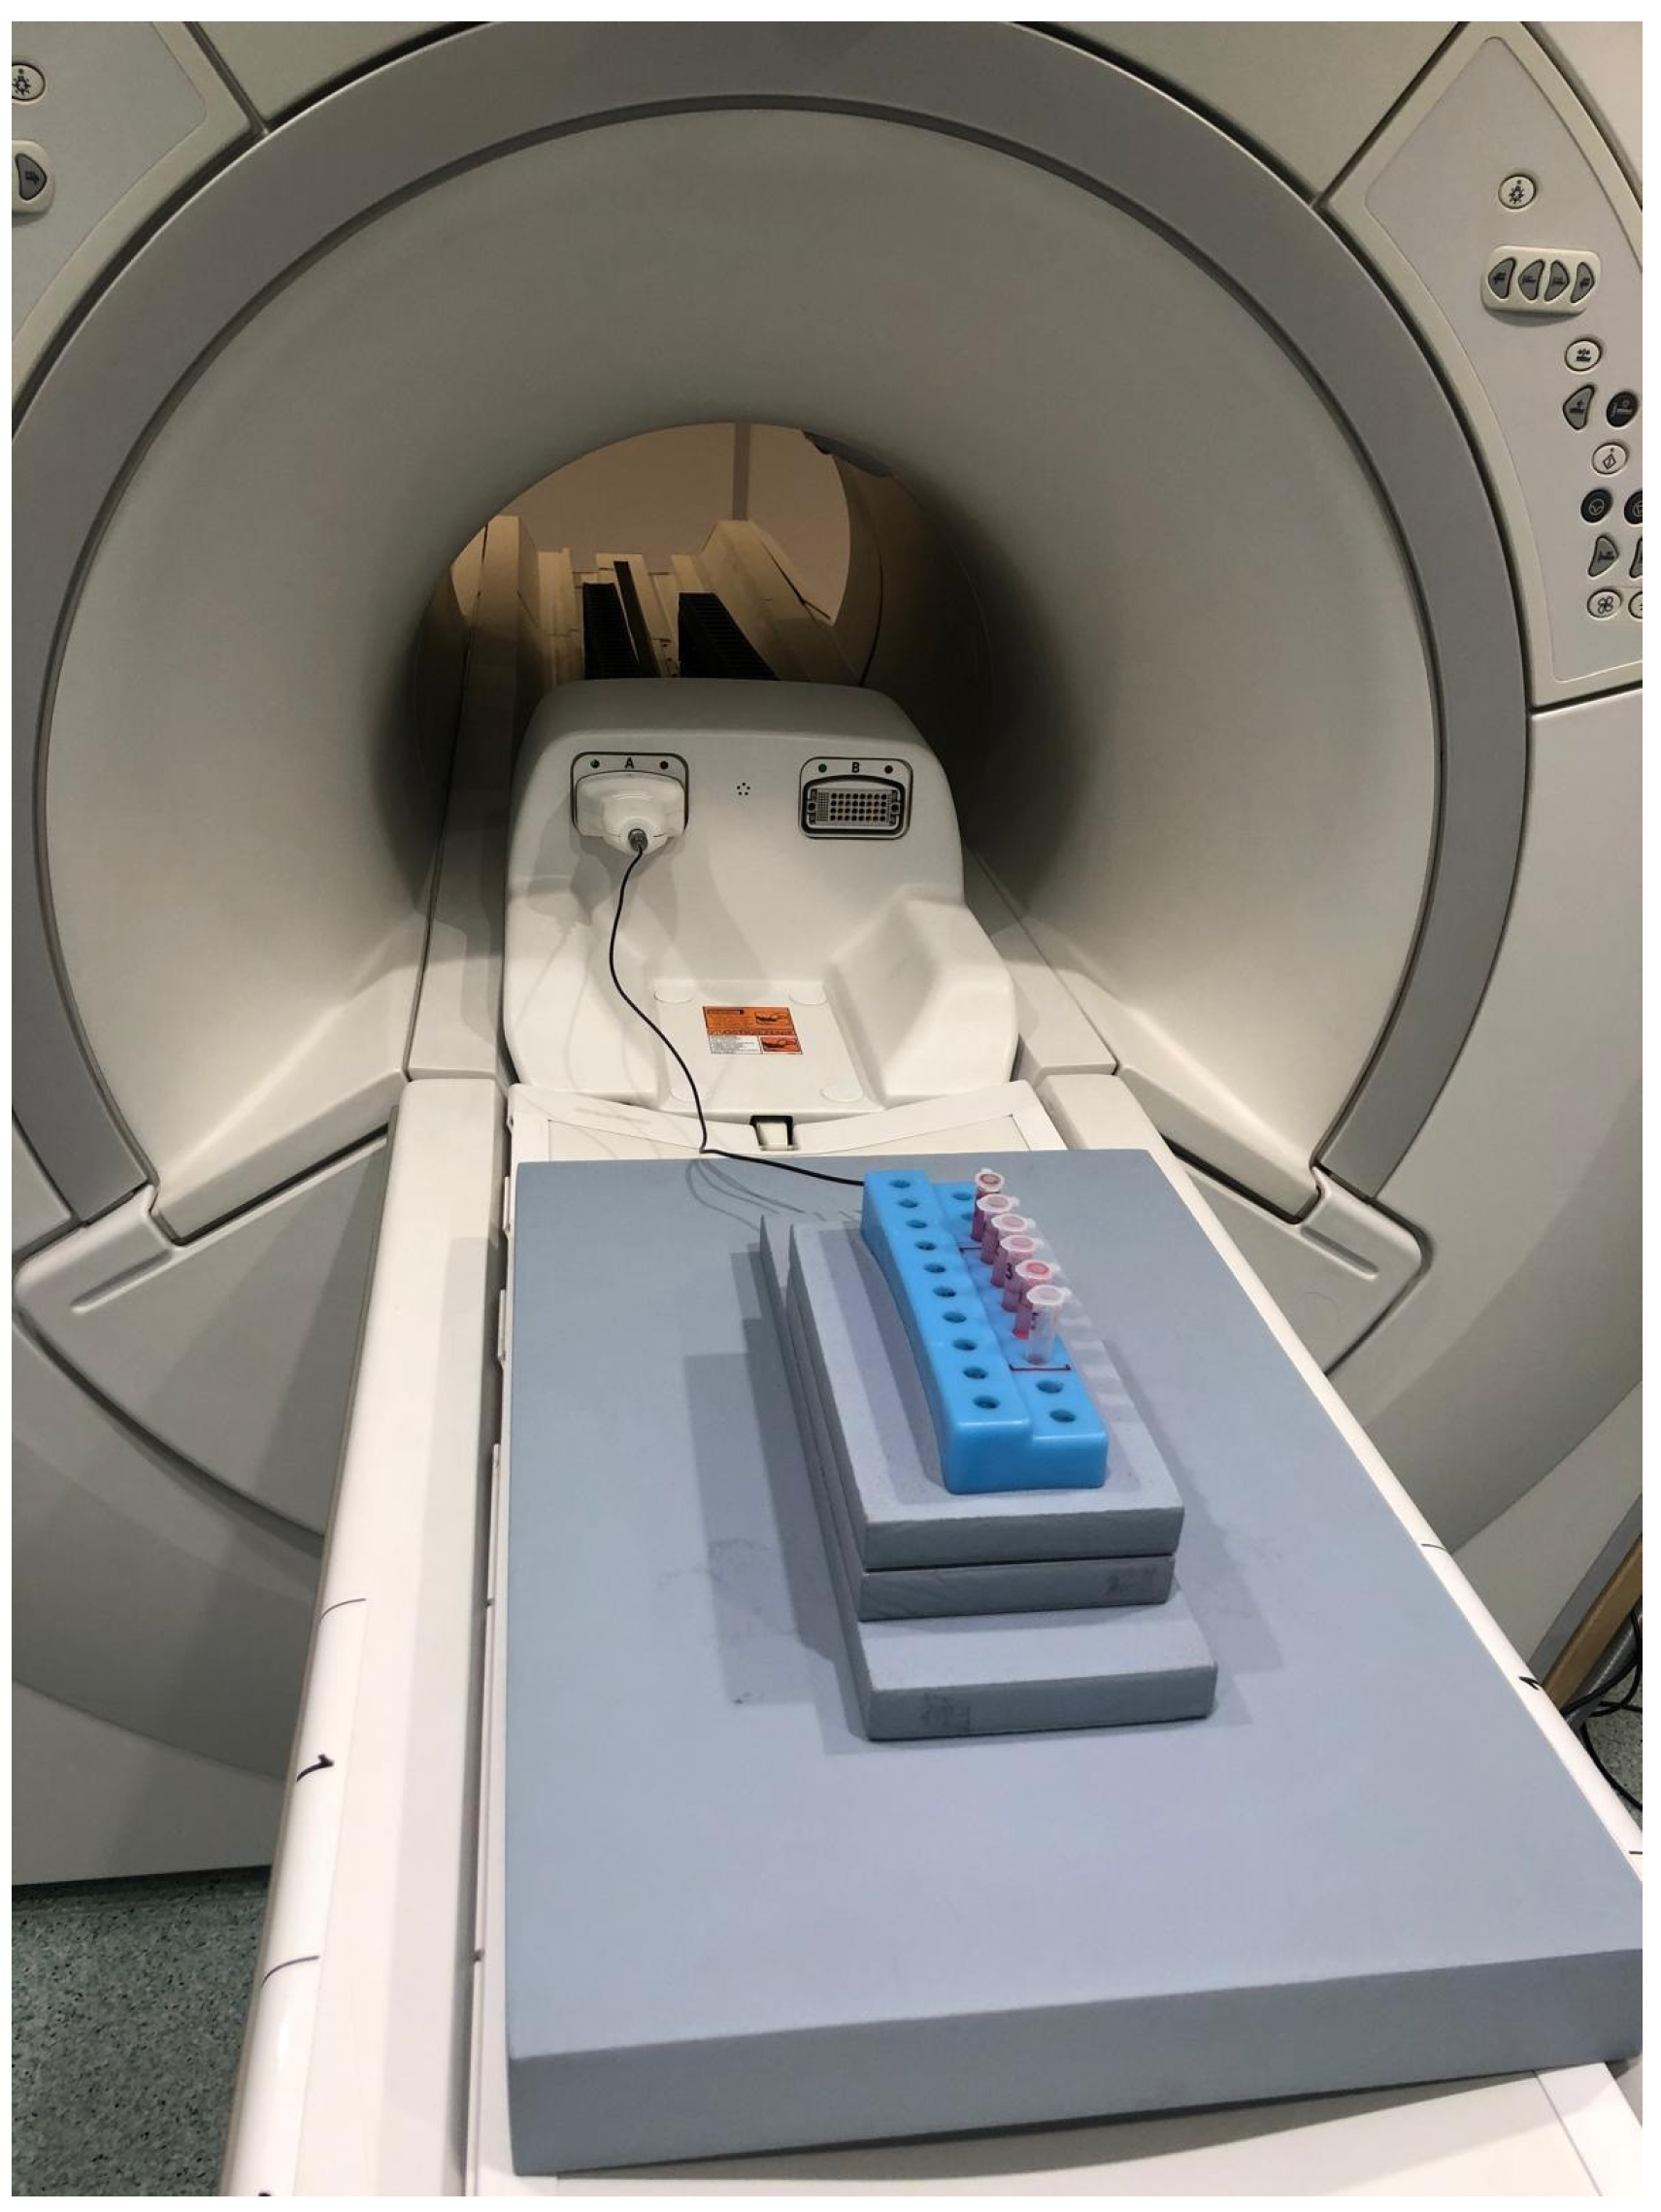
Spin–lattice (T1) and spin–spin (T2) relaxation times were measured using a Tesla Optima MR360 MRI device from General Electric Healthcare (Milwaukee, WI, USA) (Figure 3 and Figure 4), with SV23 software. The tests were performed using fast spin echo (FSE) sequences with axial projection and a small flex coil. DICOM figures were analyzed, and ROI measurements were taken from a series of figures for each test, allowing T1 and T2 relaxation times to be determined based on the collected data. The samples were examined at two different stages of the study. MRI technical parameters remained consistent throughout, with a scanning matrix of 320 × 224, section thickness of 4 mm, and NEX = 1.0. T1 measurements were conducted in 12 steps with a repetition time (TR) ranging from 200 to 12,000 ms and an echo time (TE) of 27 ms. For T2, 12 steps were performed with a fixed repetition time of 10,000 ms and an echo time ranging from 21.0 to 240.0 ms. The temperature during the test before laser irradiation was 22 degrees and after it was 20 degrees. A difference of 2 degrees is insignificant if the results of the final relaxation times are evaluated. The duration from after the PDT slides were prepared and irradiated to the time of glamorous resonance imaging was used to determine T1 and T2 relaxation times. The scanning parameters used in this stage of the study were unchanged from the first round.

3. Results

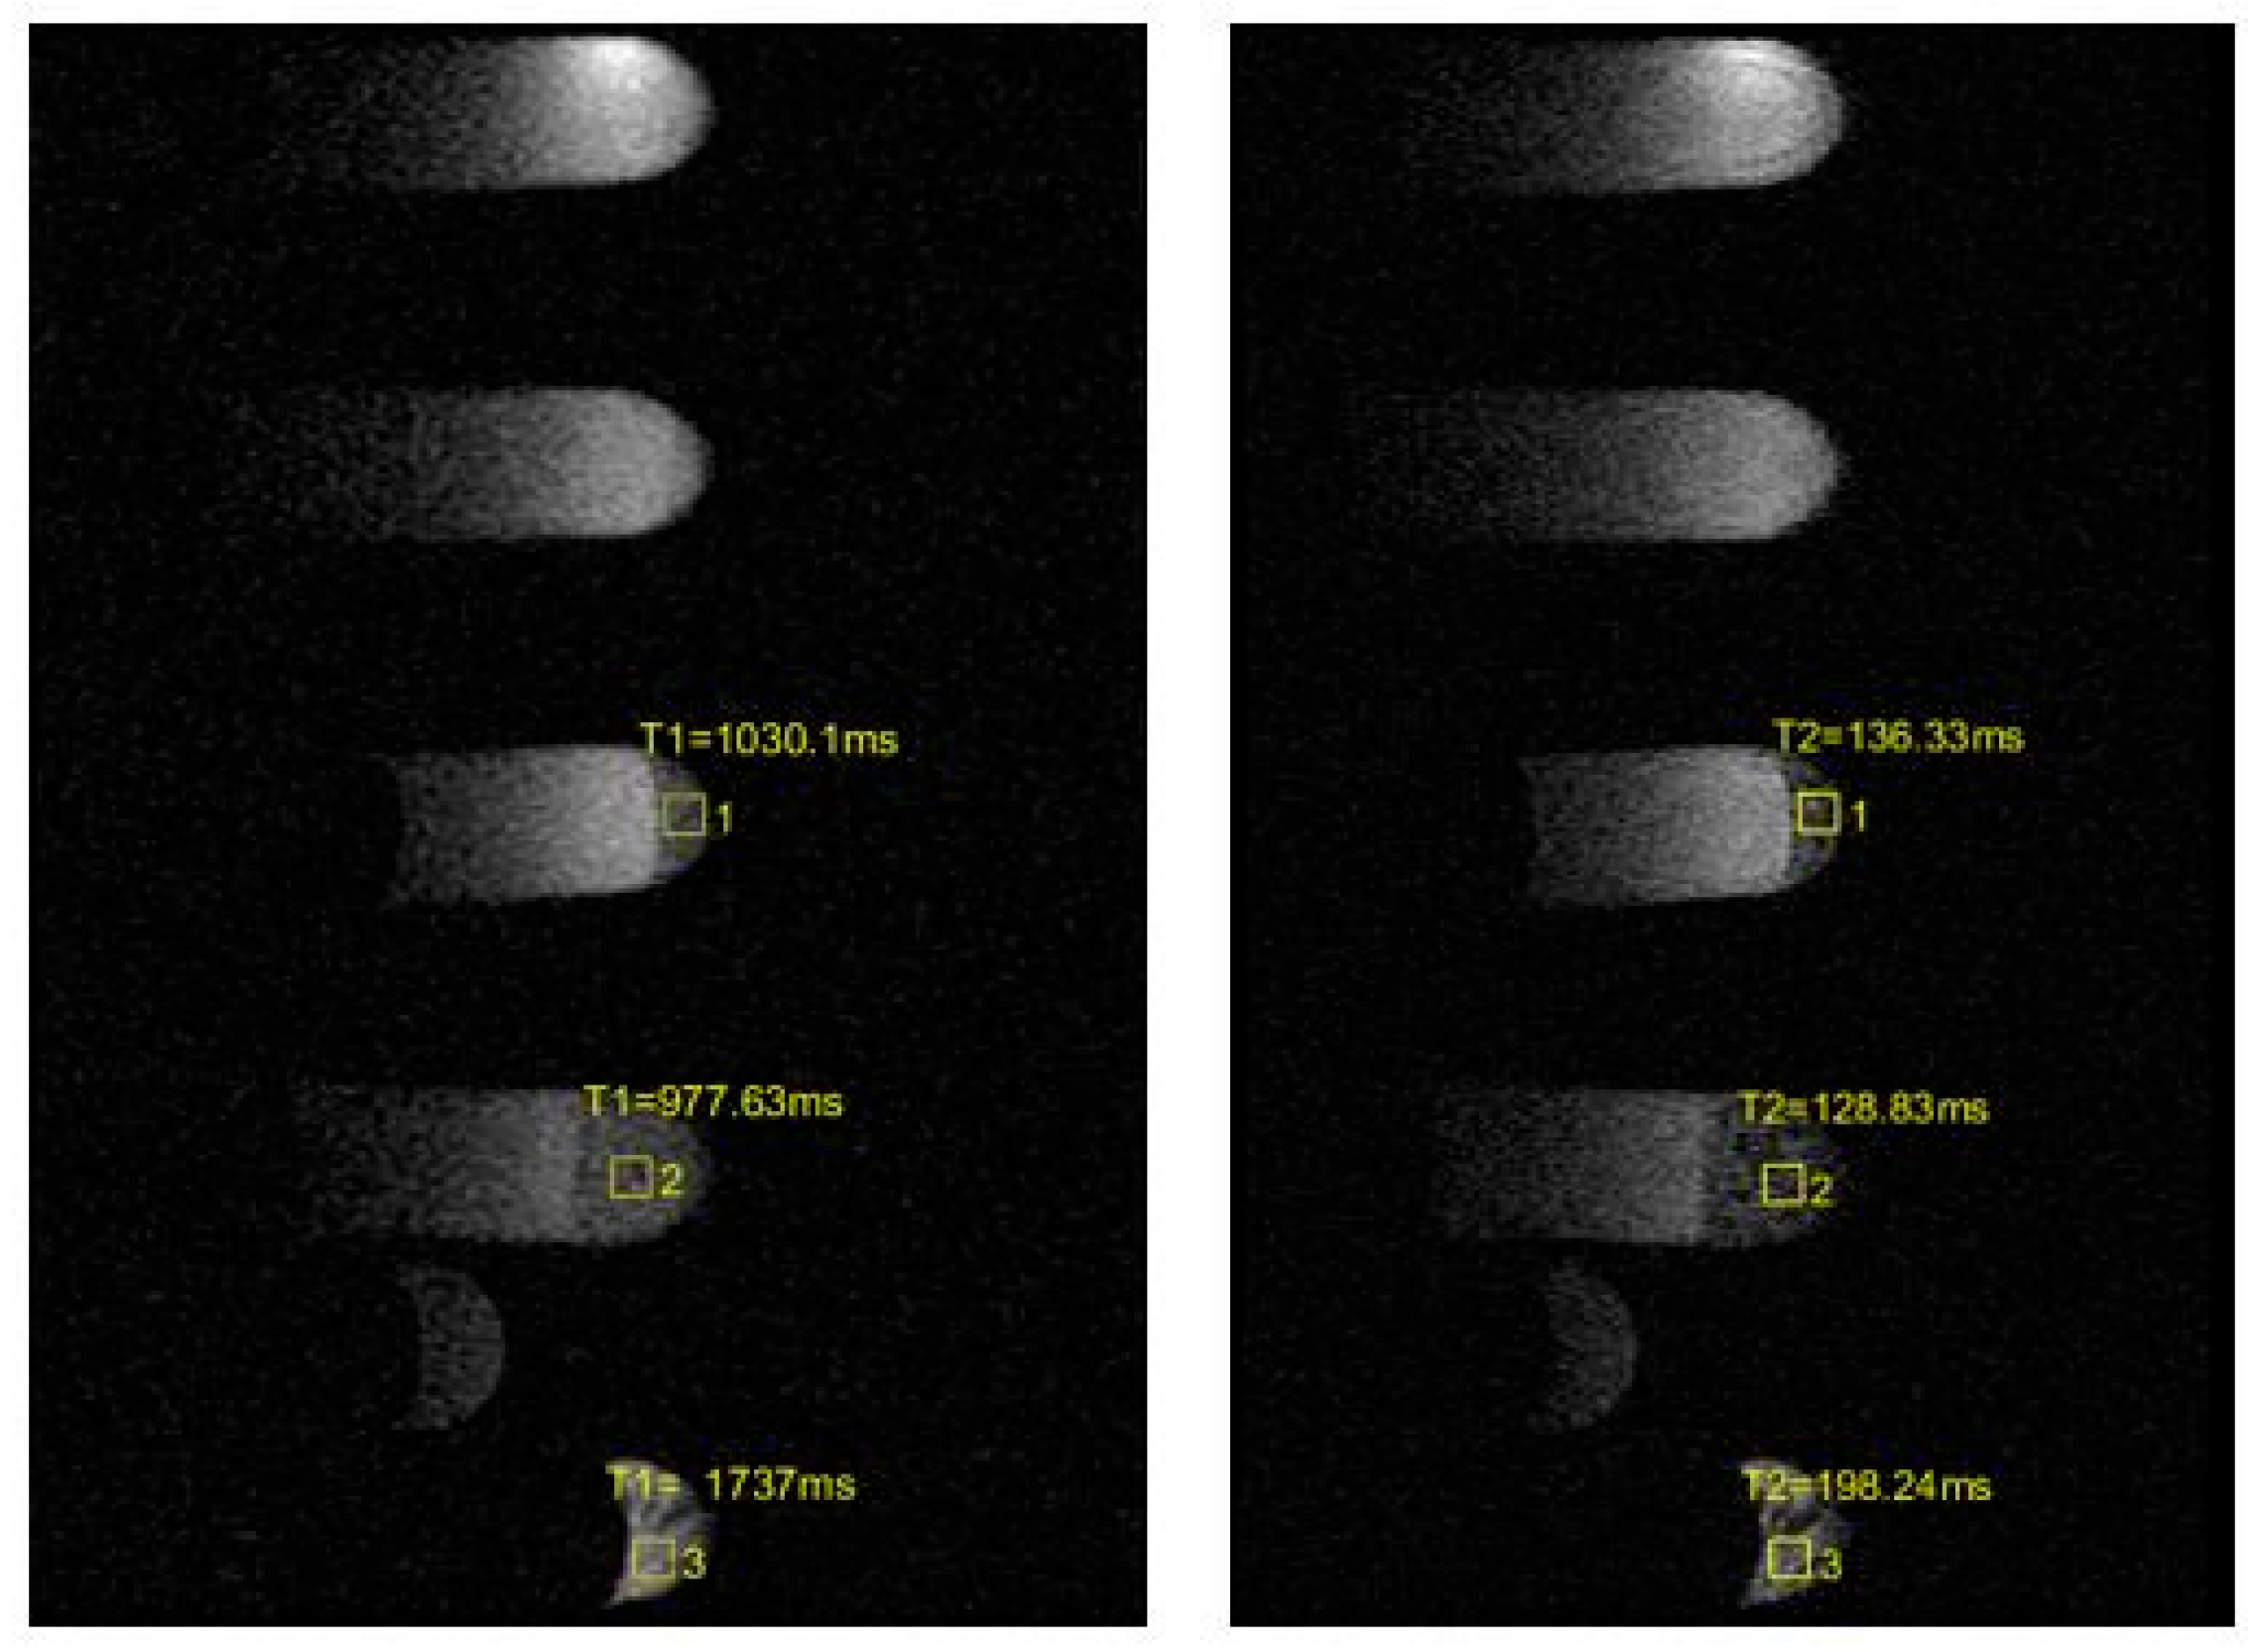
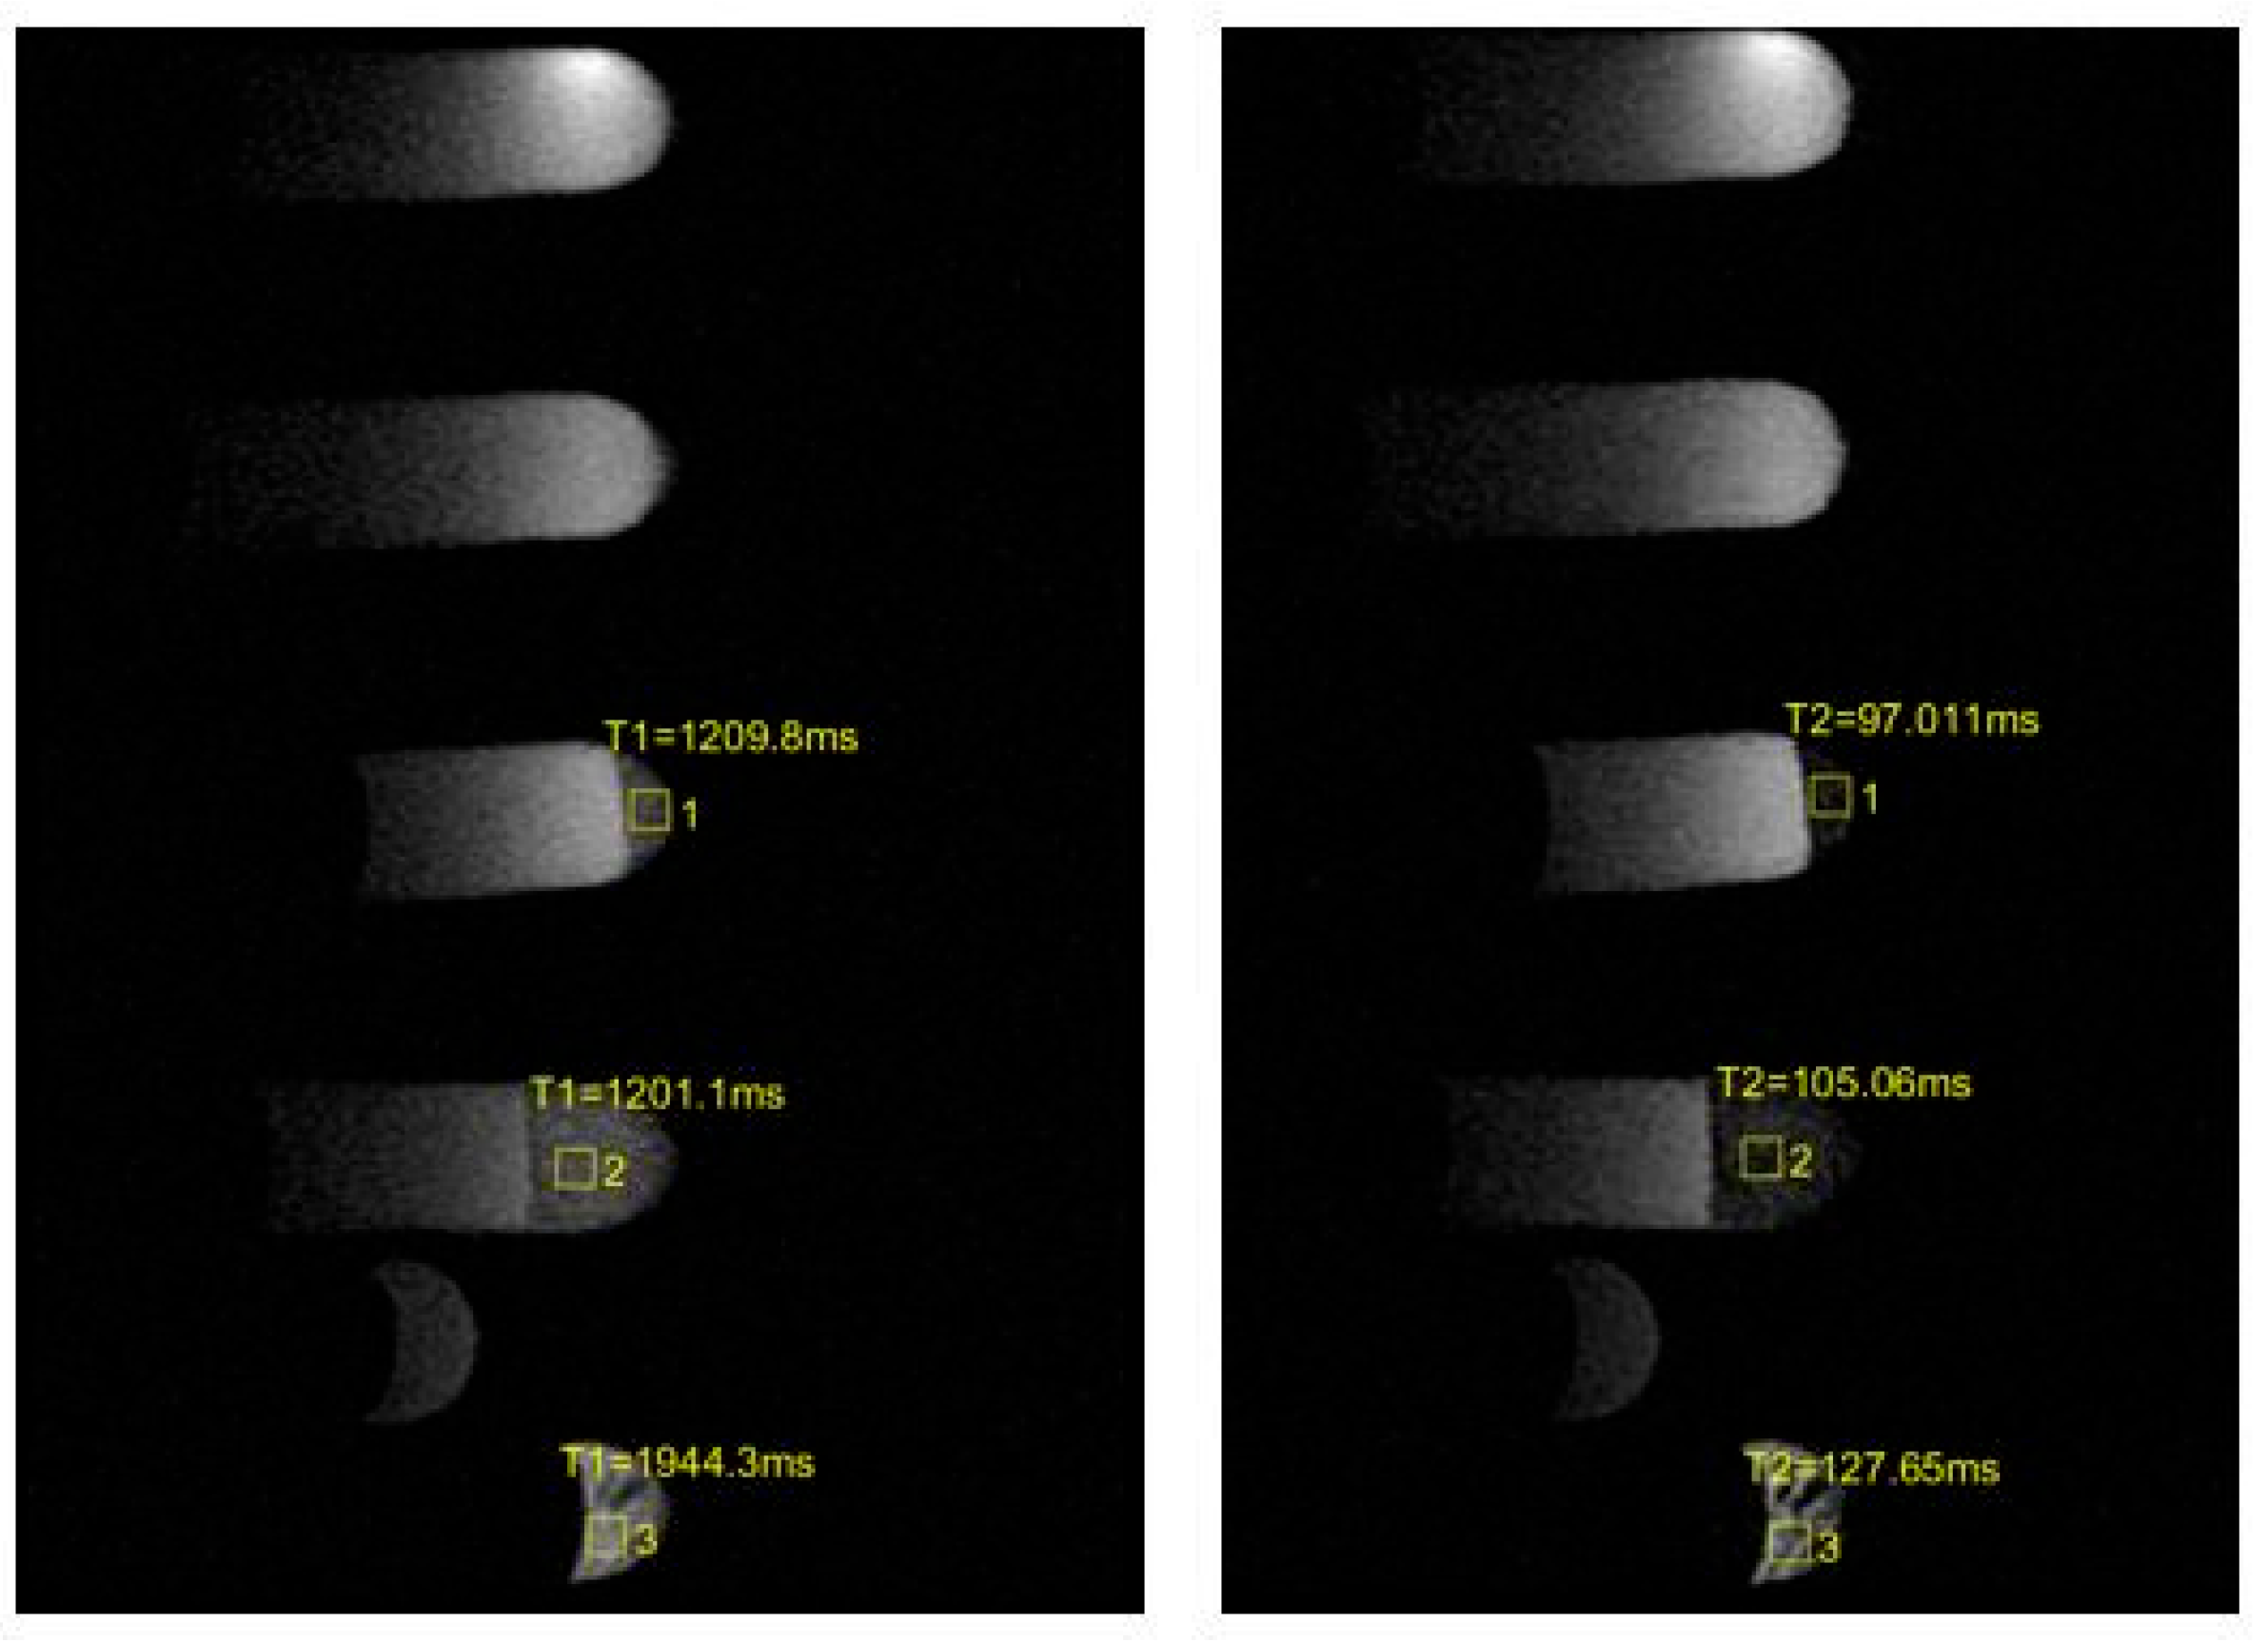
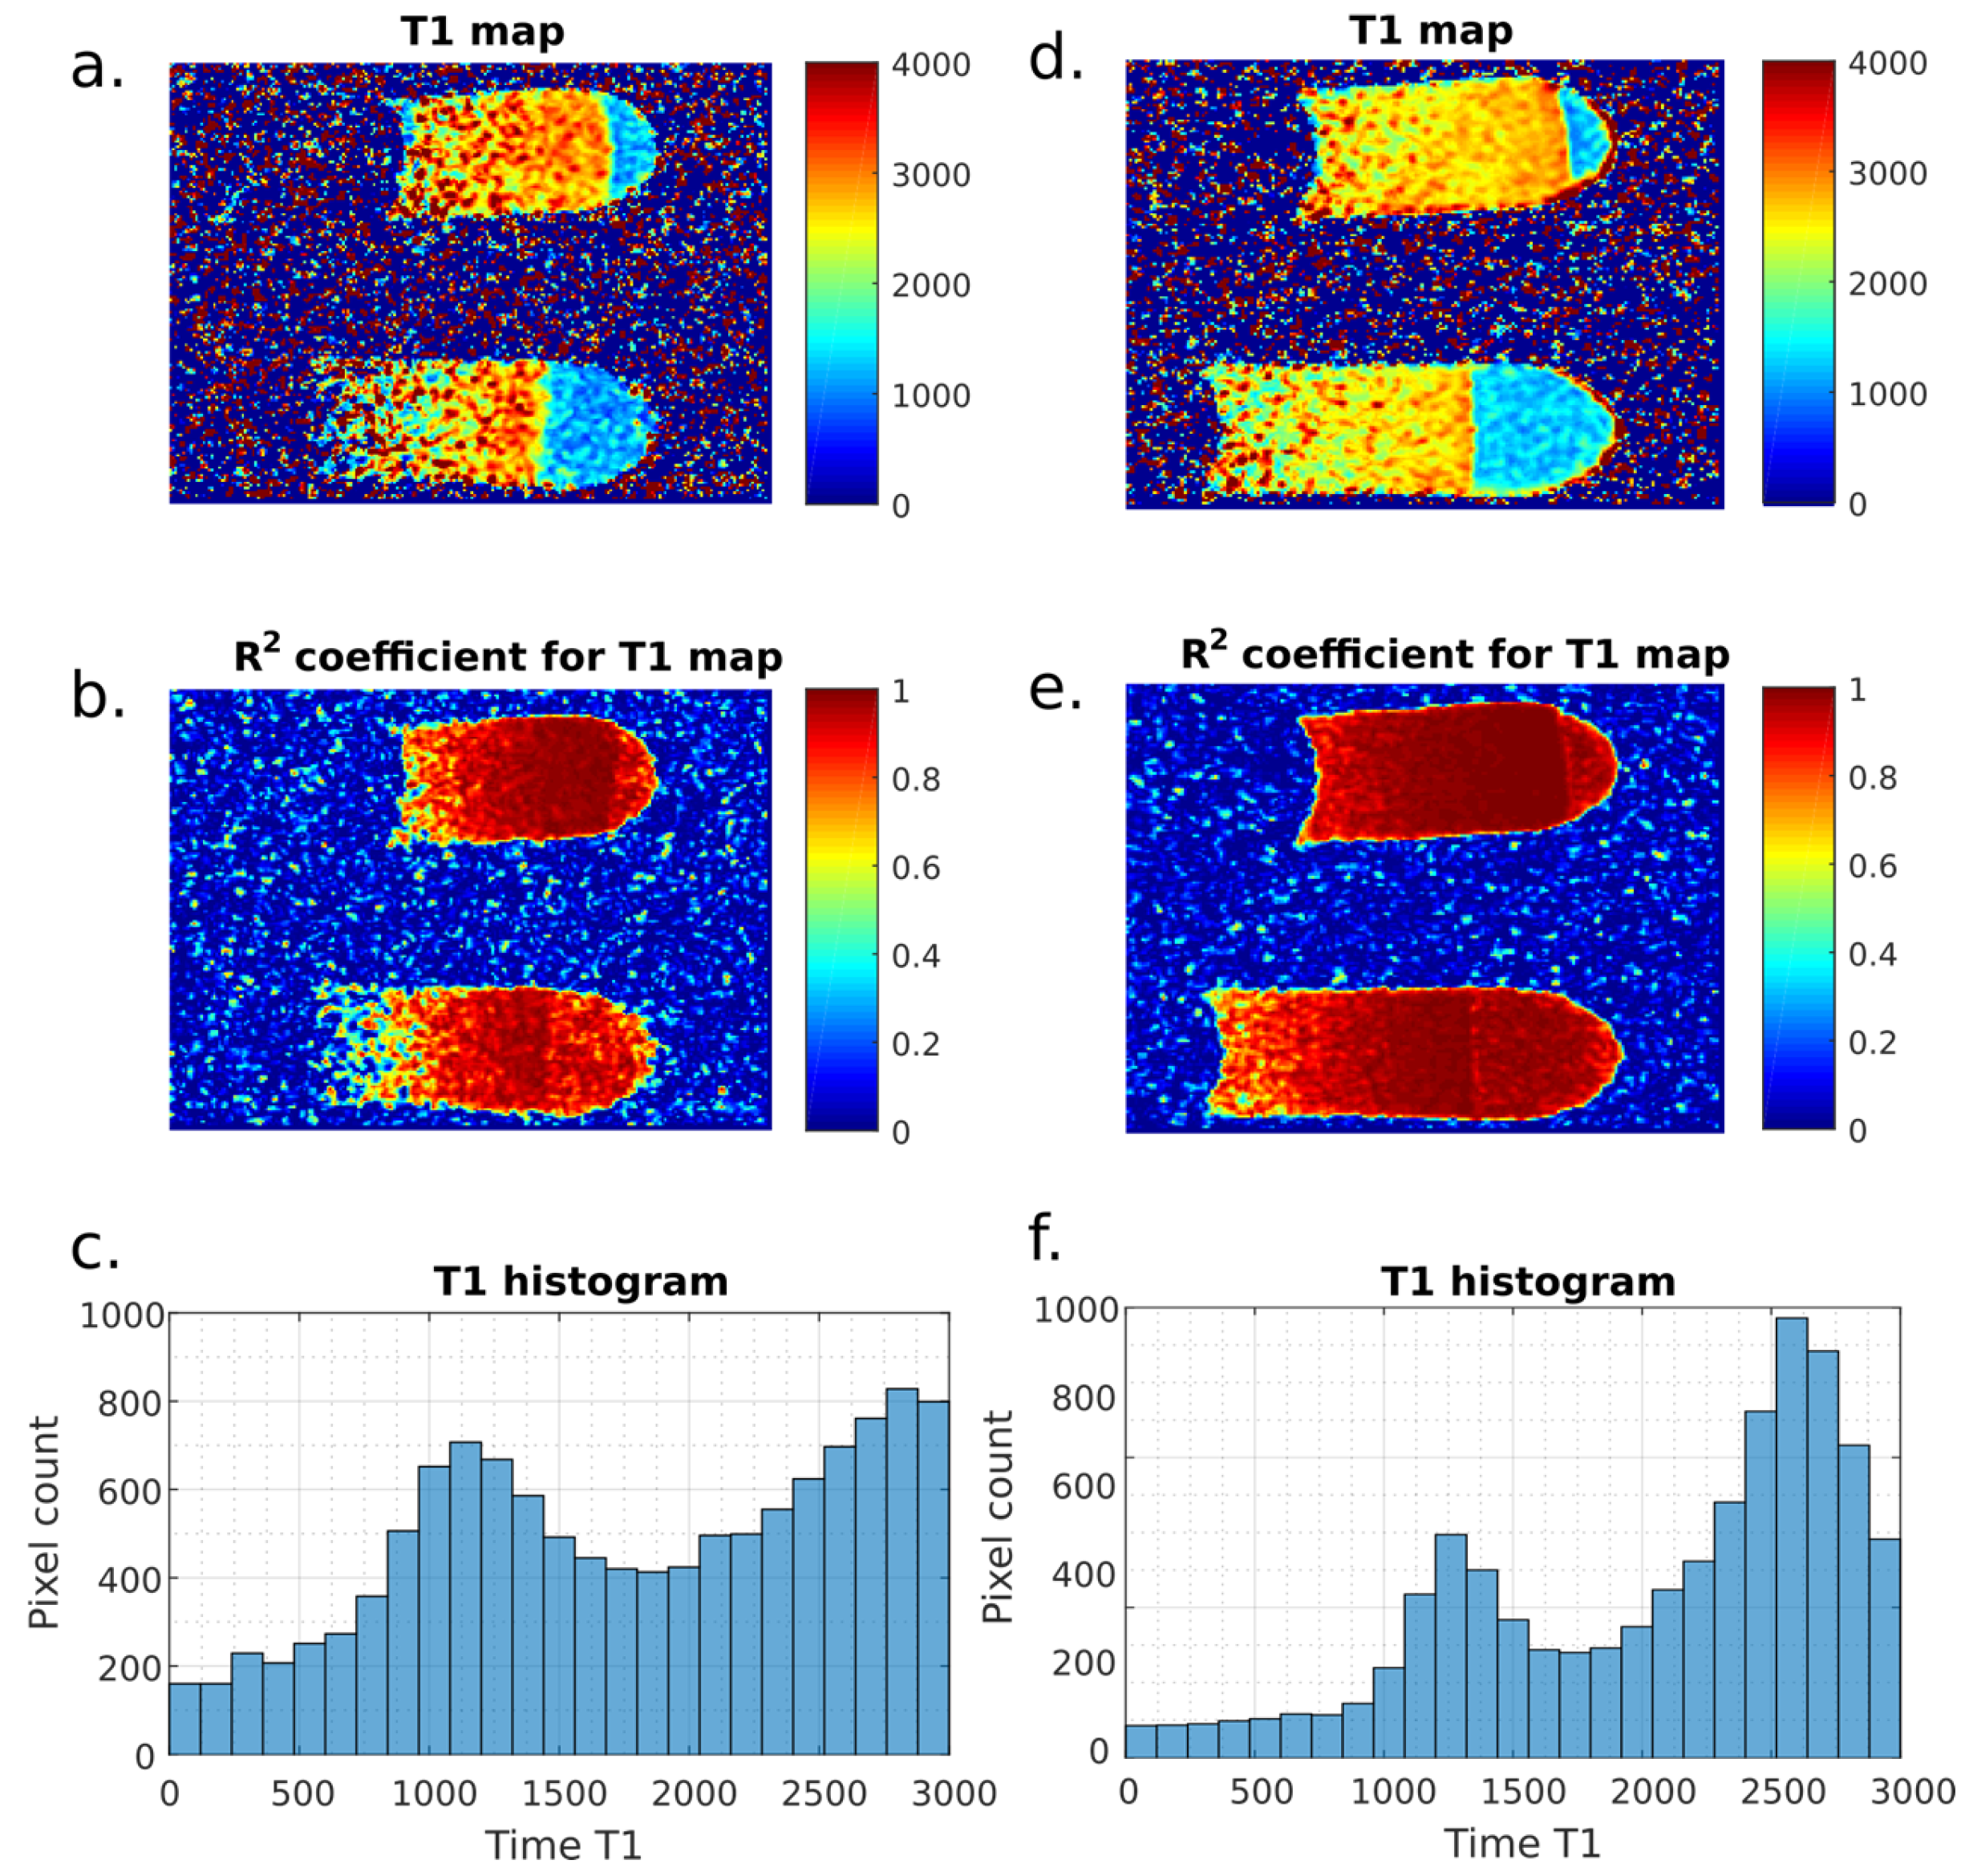
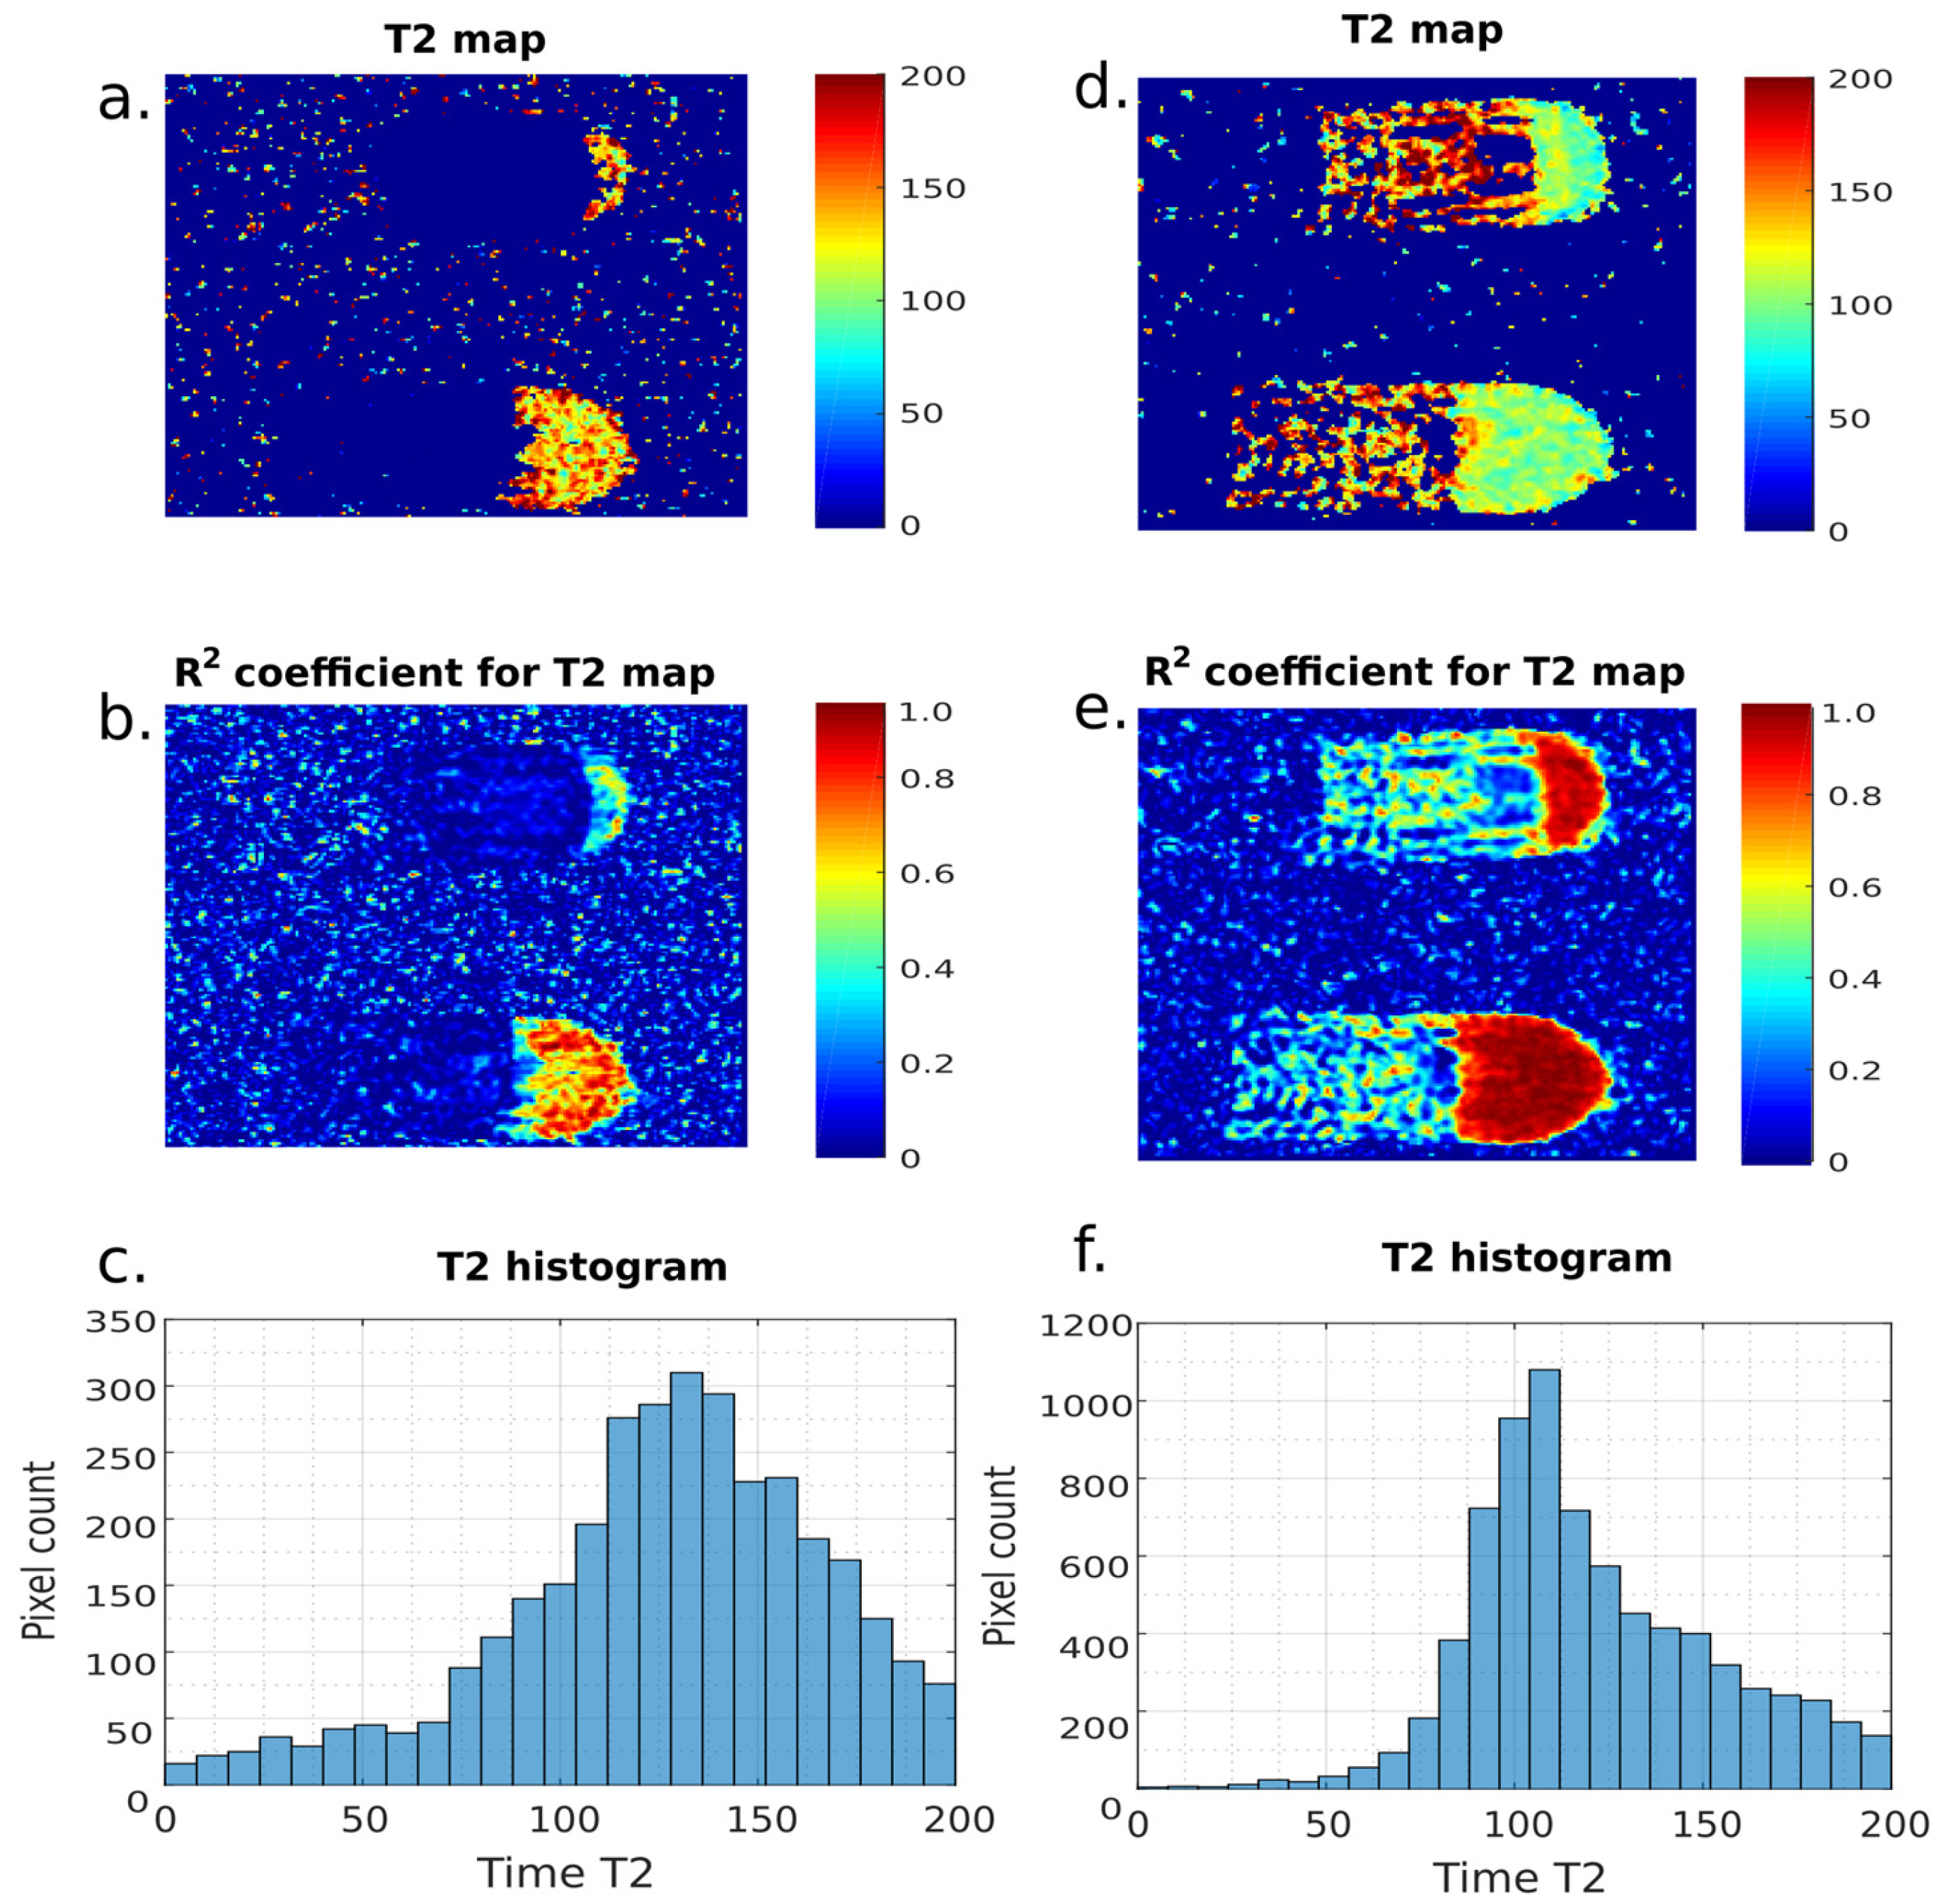
The signal intensity measure was used to determine relaxation times. The measured signal intensity of the atherosclerotic sample within the region of interest (ROI) was used to calculate the T1 and T2 relaxation times. These values were calculated in the program based on the increase in intensity of the magnetic resonance signal for T1 relaxation and the decay of the signal for T2 relaxation. Figure 5 and Figure 6 show T1 and T2 times. The figures show “Ependorf” tubes in which the tested preparations were placed. The tests were performed in the sagittal plane and not, and it was considered pointless to correct the image rotation by 90° as this action does not contribute anything to the methodology. T1 time values were determined using the SE (saturation recovery) method. This method involves recording a series of T1-weighted figures with a constant TE time (e.g., 27 ms) and a variable repetition time (TR). Then, after generating the figures, the signal intensity (IS) in the ROI is measured as a digital value saved in DICOM files. Only such an approach to the issue provides appropriate data for further analysis. The read IS data combined with the TR times at which the figures were recorded are normalized and approximated with an exponential function. Time T1 is calculated as the time at which the approximation function reaches 63% of its maximum value. The T2 time is determined in a similar way to the longitudinal relaxation time, with the difference being that the TE time changes, while the repetition time remains unchanged. Performing this operation for all image pixels allows you to draw a map of the distribution of T1 and T2 times for the examined area.
Table 1 shows the T1 and T2 values of the relaxation times of the tested samples before and after PDT.
Figure 7 and Figure 8 show images from histological analysis and T1 and T2 maps. A region of interest (ROI) was selected in the imaged tissues to calculate the T1 and T2 values. The region of interest measurements were selected very close to the tissues.

4. Discussion

Although statin-based pharmacotherapy has proven effective in numerous clinical trials, most acute coronary syndromes arise from non-critical or borderline plaques destabilized by various factors [27]. Understanding the differences in the structure and pathomechanism of atherosclerotic plaque formation may aid in developing new therapeutic methods for patients with atherosclerosis, which is not yet considered significant in terms of narrowing of the vessel lumen [28]. Carotid plaque characteristics were previously associated with restenosis at the site of carotid endarterectomy after one year [29]. Endarterectomy of lipid-rich, inflammatory plaques reduces restenosis compared to fibrous plaques, regardless of clinical characteristics [29]. Hellings et al. concluded that carotid plaque composition also predicts future cardiovascular events elsewhere in the vascular system, independently of specific risk factors and medication use. Other histological parameters, such as macrophage infiltration, large lipid core, calcifications, collagen, and smooth muscle cell infiltration, were not linked to the risk of secondary events [29]. One promising, though still underexplored, treatment method is PDT [30]. PDT generates ROS that interfere with cell survival and the remodeling process. ROS-induced cell death depends on the type of cell, photosensitizer, its cellular localization, and the light dose [31]. When light dose and target tissue are constant, PDT-mediated cell death depends on the photosensitizer and its subcellular localization [32]. Different photosensitizers can localize in multiple organelles, activating more than one cell death pathway, including programmed (apoptotic and autophagy) and nonprogrammed (necrosis) pathways. Generally, apoptosis occurs at low light intensity, while necrosis is activated at higher light doses. PDT may also stimulate autophagy, delivering cytoplasmic constituents to the lysosome [33]. In this study, PDT was evaluated using MRI, an innovative method to analyze its efficacy. PDT-treated atherosclerotic plaque showed higher mean T1 and T2 values compared to those before PDT. The mean T1 value increased from 1248.24 ms ± 187.24 before PDT to 1451.73 ms ± 217.75 after PDT. The mean T2 value decreased from 154.47 ms ± 23.17 before PDT to 109.91 ms ± 16.49 after PDT. Studies by Wang et al. and Fei et al. reported different T1 and T2 values post-PDT, consistent with the conclusion that PDT with Rose Bengal affects cell death [34,35]. This reduction in T2 relaxation time indicates altered plaque properties, demonstrating PDT’s potential as a minimally invasive treatment for atherosclerosis. The significant changes in T1 and T2 values before and after PDT therapy make MRI a non-invasive method for monitoring PDT-induced changes. In the last decade, porphyrins, chlorines, and dye-based photosensitizers have been tested for treating atherosclerotic plaques. Porphyrin-based photosensitizers selectively accumulate within plaques. In one study, a benzoporphyrin derivative selectively accumulated in rabbit atherosclerotic plaques when preassociated with low-density lipoprotein [36]. Hematoporphyrin derivative-associated PDT inhibits smooth muscle cell growth and decreases the intima/media ratio of rabbit atheroma 7–14 days post-PDT compared to controls [36,37]. Verteporfin, a second-generation photosensitizer, binds with low-density lipoproteins and induces apoptosis upon light activation by increasing mitochondrial cytochrome c and apoptosis-inducing factor levels [36]. Benzoporphyrin derivative monoacid ring A was taken up by plaques in hyperlipidemic rabbits, humans, and miniswine [36,37,38,39]. Motexafin lutetium, another photosensitizer, is distributed with the LDL-cholesterol fraction after intravascular injection in diseased animal models and shows a clear tropism to atheromatous plaques [40,41]. Protoporphyrin-IX-based PDT has been effective in preventing and treating atherosclerotic plaque in rabbits and pigs [42,43]. An endovascular light diffuser significantly reduced plaque without visible damage to the artery wall’s middle layer [44]. Equally important is the inhibition of restenosis resulting from neointima formation, caused by endothelial or medial injury followed by inflammatory cell infiltration, vascular smooth muscle cell proliferation, and migration [45]. Despite advances in stents and drug balloons, restenosis remains an issue [46,47]. The total length of atherosclerotic areas that can be treated with stents or drug balloons is limited, especially in patients with advanced kidney disease or diabetes [48,49]. PDT could fill the treatment gap by inhibiting smooth muscle cell proliferation and promoting plaque stabilization, paradoxically causing injury to almost all plaque cell types while reducing macrophage and foam cell content [50,51]. The challenge is to selectively target the plaque without harming the normal vessel wall. No photosensitizer currently meets all ideal criteria, such as no dark toxicity, high selectivity for plaque macrophages, long activation wavelengths, and targeted activation. Balloon angioplasty with photosensitizers is an attractive prospect. Light sources must be minimized and adapted to vessel size, access, and sterility. Laser sources provide powerful and bright light beams that can be coupled in optical fibers, emitting light in a narrow spectral domain, reducing illumination time for a given dose [52,53]. Despite promising animal studies, PDT has not yet fully realized its potential in treating atherosclerosis. Potential applications include treating vulnerable plaques confirmed by intravascular ultrasound assessment (IVUS) or optic coherence tomography (OCT). These methods help detect TCFA in human coronary arteries, targeting vulnerable changes for therapy, including PDT. Approximately 14% of patients experience plaque ruptures post-stenting, with PDT potentially stabilizing these plaques and reducing rupture risk. Another application is preventing neoatherosclerosis leading to restenosis within treated segments. New techniques, such as drug balloons with paclitaxel or sirolimus, do not completely protect against plaque destabilization [54,55]. PDT’s capability to provoke plaque stabilization qualifies it as a complementary tool for treating plaque rupture and neoatherosclerotic lesions. Although new stent generations and drug-covered balloons have reduced in-stent restenosis risk, neither is entirely resistant [56,57,58]. Combining PDT with percutaneous coronary intervention may prevent stent-induced restenosis recurrence or eliminate the need for stents in borderline lesions within vulnerable plaques. Miniaturizing PDT emitters and selecting the right photosensitizer for local delivery could revive clinical work on PDT for human atherosclerosis treatment. The known physicochemical properties of atherosclerotic plaques, presented in this article, are steps toward this goal. MRI’s utility in plaque characterization relies on T1 and T2 relaxation times, providing insights into tissue properties. T1 reflects the tissue’s fat content and fibrosis, while T2 indicates inflammation, edema, and necrosis. By analyzing these times, MRI differentiates between lipid-rich, fibrous, and calcified plaques, aiding in risk stratification and treatment planning [59,60]. MRI with T1 and T2 mapping could complement PDT by identifying plaques suitable for treatment and monitoring response over time [61,62]. Studies have significantly advanced understanding of atherosclerotic plaque characteristics using MRI. Yuan et al. (2001) used multispectral MRI to identify lipid-rich necrotic cores and intraplaque hemorrhage [63]. Zhao et al. (2001) showed intensive lipid-lowering therapy’s effects on plaque characteristics [64]. Cai et al. (2005) compared contrast-enhanced MRI with histology to quantify fibrous cap and lipid-rich necrotic core sizes [65,66]. Cappendijk et al. (2004) focused on MRI detection of plaque hemorrhage [67]. Trivedi et al. (2004) investigated ultrasmall superparamagnetic iron oxide-enhanced MRI to detect macrophages [68]. Fayad et al. (1998) enabled high-resolution MRI of atherosclerotic lesions in mice [69]. Edelman et al. developed fast selective black blood MRI techniques for visualizing plaque morphology [70,71]. Tang et al. (2009) evaluated atorvastatin therapy’s effects on macrophage activity using ultrasmall superparamagnetic iron oxide-enhanced MRI [72]. MRI has become crucial for understanding plaque composition, vulnerability, and therapeutic intervention effects in carotid disease.

5. Conclusions

While pharmacotherapy, particularly statins, has proven effective in clinical trials, most acute coronary syndromes arise from non-essential or borderline plaques destabilized by various factors. Understanding the structural and pathomechanical differences in atherosclerotic plaque formation is crucial for developing new therapeutic approaches, especially for patients with early-stage atherosclerosis. This study focuses on carotid plaque characteristics post-surgery, highlighting their relevance for restenosis prediction and cardiovascular event prognosis. PDT emerges as a promising but still underexplored treatment method for atherosclerosis. PDT selectively targets plaque components, inducing cell death and promoting plaque stabilization. Various photosensitizers, such as porphyrins and chlorines, have shown promise in preclinical studies by demonstrating selective plaque accumulation and inhibition of smooth muscle cell proliferation. PDT’s potential lies in its ability to inhibit neointimal hyperplasia post-revascularization, addressing a critical challenge in preventing restenosis. Despite remaining challenges in photosensitizer selectivity and delivery methods, PDT holds promise as a complementary tool in atherosclerosis management, offering potential for personalized, targeted interventions to mitigate cardiovascular risk. Continued research and technological advancements in PDT are essential for translating its therapeutic potential into clinical practice effectively. MRI has established itself as a crucial modality in the non-invasive assessment of atherosclerotic plaques, providing detailed information on plaque composition, morphology, and activity. Recent advances in MRI technology, such as 3T and 7T MRI systems, have significantly improved spatial resolution and signal-to-noise ratio, enabling more detailed plaque characterization. The development of novel contrast agents, including those targeting specific molecular markers of plaque instability, holds promise for more precise identification of high-risk plaques. Additionally, the integration of MRI with other imaging modalities, such as PET/MRI, provides complementary information on plaque metabolism and inflammation, offering a more comprehensive assessment of plaque pathophysiology. Despite its advantages, MRI in atherosclerosis plaque imaging faces several challenges. Motion artifacts from cardiac and respiratory movements can degrade image quality, particularly in coronary artery imaging. Moreover, MRI is contraindicated in patients with certain implants or devices, and the use of gadolinium-based contrast agents carries a risk of nephrogenic systemic fibrosis in patients with severe renal impairment. This study represents a first step in assessing the impact of PDT therapy through T1 and T2 relaxation times. MRI provides information on relaxation time values and their differences in healthy and atherosclerotic plaques, allowing for the assessment of physicochemical differences in plaques. The results indicate the utility of MRI relaxation times in differentiating myoablative plaques. In vitro PDT therapy, combined with MRI, enabled imaging of changes in atherosclerotic plaques. This experiment may lead to further studies on monitoring PDT in vitro as well as in vivo by MRI.

Author Contributions

Conceptualization, P.W., D.A., D.L., W.M., K.D., A.M., N.L., A.T. and D.B.-A.; methodology, P.W., D.A., D.L., W.M., K.D., A.M., N.L., A.T. and D.B.-A.; formal analysis, P.W., D.A., D.L., W.M., K.D., A.M., N.L., A.T. and D.B.-A.; resources, P.W., D.A., D.L., W.M., K.D., A.M., N.L., A.T. and D.B.-A.; data curation, P.W., D.A., D.L., W.M., K.D., A.M., N.L., A.T. and D.B.-A.; writing—original draft preparation, P.W., D.A., D.L., W.M., K.D., A.M., N.L., A.T. and D.B.-A.; writing—review and editing, P.W., D.A., D.L., W.M., K.D., A.M., N.L., A.T. and D.B.-A.; visualization, P.W., D.A., D.L., W.M., K.D., A.M., N.L., A.T. and D.B.-A.; supervision, P.W. and D.A. All authors have read and agreed to the published version of the manuscript.

Funding

This research received no external funding.

Institutional Review Board Statement

The study was conducted in accordance with the Declaration of Helsinki and approved by the Ethics Committee of the University of Rzeszów (protocol code 17/02/2019 and date of approval: 14 February 2019).

Informed Consent Statement

Informed consent was obtained from all subjects involved in the study.

Data Availability Statement

All data are included in the manuscript.

Conflicts of Interest

The authors declare no conflicts of interest.

References

  1. Münzel, T.; Sørensen, M.; Hahad, O.; Nieuwenhuijsen, M.; Daiber, A. The contribution of the exposome to the burden of cardiovascular disease. Nat. Rev. Cardiol. 2023, 20, 651–669. [Google Scholar] [CrossRef] [PubMed]
  2. Kouhpeikar, H.; Delbari, Z.; Sathyapalan, T.; Simental-Mendía, L.E.; Jamialahmadi, T.; Sahebkar, A. The Effect of Statins through Mast Cells in the Pathophysiology of Atherosclerosis: A Review. Curr. Atheroscler. Rep. 2020, 22, 19. [Google Scholar] [CrossRef] [PubMed]
  3. Gawaz, M.; Geisler, T.; Borst, O. Current concepts and novel targets for antiplatelet therapy. Nat. Rev. Cardiol. 2023, 20, 583–599. [Google Scholar] [CrossRef] [PubMed]
  4. Lawton, J.S.; Tamis-Holland, J.E.; Bangalore, S.; Bates, E.R.; Beckie, T.M.; Bischoff, J.M.; Bittl, J.A.; Cohen, M.G.; DiMaio, J.M.; Don, C.W.; et al. 2021 ACC/AHA/SCAI Guideline for Coronary Artery Revascularization: Executive Summary: A Report of the American College of Cardiology/American Heart Association Joint Committee on Clinical Practice Guidelines. Circulation 2022, 145, e4–e17. [Google Scholar] [CrossRef] [PubMed]
  5. Knuuti, J.; Wijns, W.; Saraste, A.; Capodanno, D.; Barbato, E.; Funck-Brentano, C.; Prescott, E.; Storey, R.F.; Deaton, C.; Cuisset, T.; et al. 2019 ESC Guidelines for the diagnosis and management of chronic coronary syndromes. Eur. Heart J. 2020, 41, 407–477. [Google Scholar] [CrossRef] [PubMed]
  6. Safian, R.D. Carotid Artery Revascularization: The Known Knowns and the Known Unknowns. J. Am. Coll. Cardiol. 2017, 69, 2276–2278. [Google Scholar] [CrossRef] [PubMed]
  7. Shamaki, G.R.; Markson, F.; Soji-Ayoade, D.; Agwuegbo, C.C.; Bamgbose, M.O.; Tamunoinemi, B.-M. Peripheral Artery Disease: A Comprehensive Updated Review. Curr. Probl. Cardiol. 2022, 47, 101082. [Google Scholar] [CrossRef] [PubMed]
  8. Shibutani, H.; Fujii, K.; Matsumura, K.; Otagaki, M.; Morishita, S.; Bando, K.; Motohiro, M.; Umemura, S.; Shiojima, I. Differential influence of lesion length on fractional flow reserve in intermediate coronary lesions between each coronary artery. Catheter. Cardiovasc. Interv. 2020, 95, E168–E174. [Google Scholar] [CrossRef] [PubMed]
  9. Leone, A.M.; Arioti, M.; Cialdella, P.; Vergallo, R.; Zimbardo, G.; Migliaro, S.; Anastasia, G.; Di Giusto, F.; Galante, D.; Basile, E.; et al. Prognostic impact of FFR/contrast FFR discordance. Int. J. Cardiol. 2021, 327, 40–44. [Google Scholar] [CrossRef]
  10. Nørgaard, B.L.; Leipsic, J.; Gaur, S.; Seneviratne, S.; Ko, B.S.; Ito, H.; Jensen, J.M.; Mauri, L.; De Bruyne, B.; Bezerra, H.; et al. Diagnostic performance of noninvasive fractional flow reserve derived from coronary computed tomography angiography in suspected coronary artery disease: The NXT trial (Analysis of Coronary Blood Flow Using CT Angi-ography: Next Steps). J. Am. Coll. Cardiol. 2014, 63, 1145–1155. [Google Scholar] [CrossRef] [PubMed]
  11. Cortese, B.; Piraino, D.; Gentile, D.; Onea, H.; Lazar, L. Intravascular imaging for left main stem assessment: An update on the most recent clinical data. Catheter. Cardiovasc. Interv. 2022, 100, 1220–1228. [Google Scholar] [CrossRef]
  12. A Byrne, R.; Fremes, S.; Capodanno, D.; Czerny, M.; Doenst, T.; Emberson, J.R.; Falk, V.; Gaudino, M.; McMurray, J.J.V.; Mehran, R.; et al. 2022 Joint ESC/EACTS review of the 2018 guideline recommendations on the revascularization of left main coronary artery disease in patients at low surgical risk and anatomy suitable for PCI or CABG. Eur. J. Cardio-Thoracic Surg. 2023, 64, ezad286. [Google Scholar] [CrossRef] [PubMed]
  13. Davidson, L.J.; Cleveland, J.C.; Welt, F.G.; Anwaruddin, S.; Bonow, R.O.; Firstenberg, M.S.; Gaudino, M.F.; Gersh, B.J.; Grubb, K.J.; Kirtane, A.J.; et al. A Practical Approach to Left Main Coronary Artery Disease: JACC State-of-the-Art Review. J. Am. Coll. Cardiol. 2022, 80, 2119–2134. [Google Scholar] [CrossRef] [PubMed]
  14. Lamanna, A.; Maingard, J.; Barras, C.D.; Kok, H.K.; Handelman, G.; Chandra, R.V.; Thijs, V.; Brooks, D.M.; Asadi, H. Carotid artery stenting: Current state of evidence and future directions. Acta Neurol. Scand. 2019, 139, 318–333. [Google Scholar] [CrossRef] [PubMed]
  15. Meads, C.; Cummins, C.; Jolly, K.; Stevens, A.; Burls, A.; Hyde, C. Coronary artery stents in the treatment of ischaemic heart disease: A rapid and systematic review. Health Technol Assess. 2000, 4, 1–153. [Google Scholar] [CrossRef] [PubMed]
  16. Sawada, T.; Shite, J.; Garcia-Garcia, H.M.; Shinke, T.; Watanabe, S.; Otake, H.; Matsumoto, D.; Tanino, Y.; Ogasawara, D.; Kawamori, H.; et al. Feasibility of combined use of intravascular ultrasound radiofrequency data analysis and optical coherence tomography for detecting thin-cap fibroatheroma. Eur. Heart J. 2008, 29, 1136–1146. [Google Scholar] [CrossRef] [PubMed]
  17. Hirai, T.; Chen, Z.; Zhang, L.; Baaj, S.; Kovarnik, T.; Porcaro, K.; Kaminski, J.; Hawn, S.; Agrawal, A.; Makki, N.; et al. Evaluation of Variable Thin-Cap Fibroatheroma Definitions and Association of Virtual Histology-Intravascular Ultrasound Findings with Cavity Rupture Size. Am. J. Cardiol. 2016, 118, 162–169. [Google Scholar] [CrossRef]
  18. Libby, P. The changing landscape of atherosclerosis. Nature 2021, 592, 524–533. [Google Scholar] [CrossRef] [PubMed]
  19. Geovanini, G.R.; Libby, P. Atherosclerosis and inflammation: Overview and updates. Clin. Sci. 2018, 132, 1243–1252. [Google Scholar] [CrossRef]
  20. Bentzon, J.F.; Otsuka, F.; Virmani, R.; Falk, E. Mechanisms of Plaque Formation and Rupture. Circ. Res. 2014, 114, 1852–1866. [Google Scholar] [CrossRef]
  21. Libby, P.; Pasterkamp, G.; Crea, F.; Jang, I.-K. Reassessing the Mechanisms of Acute Coronary Syndromes. Circ. Res. 2019, 124, 150–160. [Google Scholar] [CrossRef] [PubMed]
  22. Wohlschlaeger, J.; Bertram, S.; Theegarten, D.; Hager, T.; Baba, H. Coronary atherosclerosis and progression to unstable plaques: Histomorphological and molecular aspects. Herz 2015, 40, 837–844. [Google Scholar] [CrossRef]
  23. Desai, K.P.; Sidhu, M.S.; Boden, W.E. Evaluation of the stable coronary artery disease patient: Anatomy trumps physiology. Trends Cardiovasc. Med. 2014, 24, 332–340. [Google Scholar] [CrossRef] [PubMed]
  24. Badimon, L.; Vilahur, G. Thrombosis formation on atherosclerotic lesions and plaque rupture. J. Intern. Med. 2014, 276, 618–632. [Google Scholar] [CrossRef] [PubMed]
  25. Narula, J.; Kovacic, J.C. Putting TCFA in Clinical Perspective. J. Am. Coll. Cardiol. 2014, 64, 681–683. [Google Scholar] [CrossRef] [PubMed]
  26. Virmani, R. Are our tools for the identification of TCFA ready and do we know them? JACC Cardiovasc. Imaging 2011, 4, 656–658. [Google Scholar] [CrossRef]
  27. Salem, A.M.; Davis, J.; Gopalan, D.; Rudd, J.H.; Clarke, S.C.; Schofield, P.M.; Bennett, M.R.; Brown, A.J.; Obaid, D.R. Characteristics of conventional high-risk coronary plaques and a novel CT defined thin-cap fibroatheroma in patients undergoing CCTA with stable chest pain. Clin. Imaging 2023, 101, 69–76. [Google Scholar] [CrossRef]
  28. Kunadian, V.; Chieffo, A.; Camici, P.G.; Berry, C.; Escaned, J.; Maas, A.H.E.M.; Prescott, E.; Karam, N.; Appelman, Y.; Fraccaro, C.; et al. Consensus Document on Ischaemia with Non-Obstructive Coronary Arteries in Collaboration with European Society of Cardiology Working Group on Coronary Pathophysiology & Microcirculation Endorsed by Coronary Vasomotor Disorders International Study Group. Eur. Heart J. 2020, 41, 3504–3520. [Google Scholar] [CrossRef] [PubMed]
  29. Hellings, W.E.; Peeters, W.; Moll, F.L.; Piers, S.R.; van Setten, J.; Van der Spek, P.J.; de Vries, J.-P.P.; Seldenrijk, K.A.; De Bruin, P.C.; Vink, A.; et al. Composition of carotid atherosclerotic plaque is associated with cardiovascular outcome: A prog-nostic study. Circulation 2010, 121, 1941–1950. [Google Scholar] [CrossRef]
  30. Wu, G.; Yu, G.; Zheng, M.; Peng, W.; Li, L. Recent Advances for Dynamic-Based Therapy of Atherosclerosis. Int. J. Nanomed. 2023, 18, 3851–3878. [Google Scholar] [CrossRef]
  31. Wagnières, G.; van den Bergh, H.; Cook, S.; Giraud, M.; Jain, M.; Zellweger, M. Photodynamic therapy for the treatment of atherosclerotic plaque: Lost in translation? Cardiovasc. Ther. 2017, 35, e12238. [Google Scholar] [CrossRef]
  32. Mroz, P.; Yaroslavsky, A.; Kharkwal, G.B.; Hamblin, M.R. Cell death pathways in photodynamic therapy of cancer. Cancers 2011, 3, 2516–2539. [Google Scholar] [CrossRef] [PubMed]
  33. Glick, D.; Barth, S.; MacLeod, K.F. Autophagy: Cellular and molecular mechanisms. J. Pathol. 2010, 221, 3–12. [Google Scholar] [CrossRef] [PubMed]
  34. Wang, K.K.; Lutzke, L.; Borkenhagen, L.; Westra, W.; Song, M.W.K.; Prasad, G.; Buttar, N.S. Photodynamic therapy for Barrett’s esophagus: Does light still have a role? Endoscopy 2008, 40, 1021–1025. [Google Scholar] [CrossRef] [PubMed]
  35. Fei, B.; Wang, H.; Meyers, J.D.; Feyes, D.K.; Oleinick, N.L.; Duerk, J.L. High-field magnetic resonance imaging of the response of human prostate cancer to Pc 4-based photodynamic therapy in an animal model. Lasers Surg. Med. 2007, 39, 723–730. [Google Scholar] [CrossRef]
  36. Allison, B.A.; Crespo, M.T.; Jain, A.K.; Richter, A.M.; Hsiang, Y.N.; Levy, J.G. Delivery of benzoporphyrin derivative, a photosensitizer, into atherosclerotic plaque of Watanabe heritable hyperlipidemic rabbits and balloon-injured New Zealand rabbits. Photochem. Photobiol. 1997, 65, 877–883. [Google Scholar] [CrossRef]
  37. Usui, M.; Asahara, T.; Naitoh, Y.; Katoh, T.; Ibukiyama, C. Photodynamic therapy for the prevention of intimal hyperplasia in balloon-injured rabbit arteries. Jpn. Circ. J. 1999, 63, 387–393. [Google Scholar] [CrossRef] [PubMed]
  38. Granville, D.J.; Cassidy, B.A.; Ruehlmann, D.O.; Choy, J.C.; Brenner, C.; Kroemer, G.; van Breemen, C.; Margaron, P.; Hunt, D.W.; McManus, B.M. Mitochondrial release of apoptosis-inducing factor and cytochrome c during smooth muscle cell apoptosis. Am. J. Pathol. 2001, 159, 305–311. [Google Scholar] [CrossRef]
  39. Hsiang, Y.N.; Crespo, M.T.; Richter, A.M.; Jain, A.K.; Fragoso, M.; Levy, J.G. In vitro and in vivo uptake of benzoporphyrin derivative into human and miniswine atherosclerotic plaque. Photochem. Photobiol. 1993, 57, 670–674. [Google Scholar] [CrossRef]
  40. Yamaguchi, A.; Woodburn, K.W.; Hayase, M.; Hoyt, G.; Robbins, R.C. Photodynamic therapy with motexafin lutetium (Lu-Tex) reduces experimental graft coronary artery disease. Transplantation 2001, 71, 1526–1532. [Google Scholar] [CrossRef]
  41. Yamaguchi, A.; Woodburn, K.W.; Hayase, M.; Robbins, R.C. Reduction of vein graft disease using photodynamic therapy with motexafin lutetium in a rodent isograft model. Circulation 2000, 102 (Suppl. S3), III275–III280. [Google Scholar] [CrossRef] [PubMed]
  42. Lin, Y.; Xie, R.; Yu, T. Photodynamic Therapy for Atherosclerosis: Past, Present, and Future. Pharmaceutics 2024, 16, 729. [Google Scholar] [CrossRef]
  43. Jenkins, M.P.; Buonaccorsi, G.A.; Mansfield, R.; Bishop, C.C.; Bown, S.G.; McEwan, J.R. Reduction in the response to coronary and iliac artery injury with pho-todynamic therapy using 5-aminolaevulinic acid. Cardiovasc. Res. 2000, 45, 478–485. [Google Scholar] [CrossRef] [PubMed]
  44. Kwon, O.; Yoon, H.; Kim, K.; Kim, H.; Yoon, Y.; Kim, J. Fluorescence kinetics of protoporphyrin-IX induced from 5-ALA compounds in rabbit postballoon injury model for ALA-photoangioplasty. Photochem. Photobiol. 2008, 84, 1209–1214. [Google Scholar] [CrossRef] [PubMed]
  45. Van Eps, R.G.S.; ChandraSekar, N.R.; Hasan, T.; LaMuraglia, G.M. Importance of the treatment field for the application of vascular photodynamic therapy to inhibit intimal hyperplasia. Photochem Photobiol. 1998, 67, 337–342. [Google Scholar] [CrossRef]
  46. Waksman, R.; McEwan, P.E.; Moore, T.I.; Pakala, R.; Kolodgie, F.D.; Hellinga, D.G.; Seabron, R.C.; Rychnovsky, S.J.; Vasek, J.; Scott, R.W.; et al. PhotoPoint photodynamic therapy promotes stabilization of atherosclerotic plaques and inhibits plaque progression. J. Am. Coll. Cardiol. 2008, 52, 1024–1032. [Google Scholar] [CrossRef] [PubMed]
  47. Van Eps, R.G.S.; Adili, F.; Watkins, M.T.; Anderson, R.R.; Lamuraglia, G.M. Photodynamic therapy of extracellular matrix stimulates endothelial cell growth by inactivation of matrix-associated transforming growth factor-beta. Lab. Investig. A J. Tech. Methods Pathol. 1997, 76, 257–266. [Google Scholar]
  48. Giustino, G.; Colombo, A.; Camaj, A.; Yasumura, K.; Mehran, R.; Stone, G.W.; Kini, A.; Sharma, S.K. Coronary In-Stent Restenosis: JACC State-of-the-Art Review. J. Am. Coll. Cardiol. 2022, 80, 348–372. [Google Scholar] [CrossRef] [PubMed]
  49. Zhang, J.; Zhang, Q.M.; Zhao, K.M.; Bian, Y.-J.M.; Liu, Y.M.; Xue, Y.-T. Risk factors for in-stent restenosis after coronary stent implantation in patients with coronary artery disease: A retrospective observational study. Medicine 2022, 101, e31707. [Google Scholar] [CrossRef] [PubMed]
  50. Habib, R.H.; Dimitrova, K.R.; Badour, S.A.; Yammine, M.B.; El-Hage-Sleiman, A.-K.M.; Hoffman, D.M.; Geller, C.M.; Schwann, T.A.; Tranbaugh, R.F. CABG Versus PCI: Greater Benefit in Long-Term Outcomes with Multiple Arterial Bypass Grafting. J. Am. Coll. Cardiol. 2015, 66, 1417–1427. [Google Scholar] [CrossRef]
  51. Peng, C.; Li, Y.; Liang, H.; Cheng, J.; Li, Q.; Sun, X.; Li, Z.; Wang, F.; Guo, Y.; Tian, Z.; et al. Detection and photodynamic therapy of inflamed atherosclerotic plaques in the carotid artery of rabbits. J. Photochem. Photobiol. B Biol. 2011, 102, 26–31. [Google Scholar] [CrossRef] [PubMed]
  52. Borshch, V.N.; Andreeva, E.R.; Kuz’min, S.G.; Vozovikov, I.N. New medicines and approaches to treatment of atherosclerosis. Russ. J. Gen. Chem. 2012, 82, 554–563. [Google Scholar] [CrossRef]
  53. Xie, Y.; Mintz, G.S.; Yang, J.; Doi, H.; Iñiguez, A.; Dangas, G.D.; Serruys, P.W.; McPherson, J.A.; Wennerblom, B.; Xu, K.; et al. Clinical outcome of nonculprit plaque ruptures in patients with acute coronary syndrome in the PROSPECT study. JACC Cardiovasc. Imaging 2014, 7, 397–405. [Google Scholar] [CrossRef] [PubMed]
  54. Komiyama, H.; Takano, M.; Hata, N.; Seino, Y.; Shimizu, W.; Mizuno, K. Neoatherosclerosis: Coronary stents seal atherosclerotic lesions but result in making a new problem of atherosclerosis. World J. Cardiol. 2015, 7, 776–783. [Google Scholar] [CrossRef] [PubMed]
  55. Cortese, B.; Orrego, P.S.; Agostoni, P.; Buccheri, D.; Piraino, D.; Andolina, G.; Seregni, R.G. Effect of Drug-Coated Balloons in Native Coronary Artery Disease Left with a Dissection. JACC Cardiovasc. Interv. 2015, 8, 2003–2009. [Google Scholar] [CrossRef]
  56. Kalra, A.; Rehman, H.; Khera, S.; Thyagarajan, B.; Bhatt, D.L.; Kleiman, N.S.; Yeh, R.W. New-Generation Coronary Stents: Current Data and Future Directions. Curr. Atheroscler. Rep. 2017, 19, 14. [Google Scholar] [CrossRef]
  57. Gonzalo, N.; Ryan, N.; Escaned, J. New light on second-generation drug-eluting stent restenosis. EuroIntervention 2017, 13, 265–266. [Google Scholar] [CrossRef]
  58. Yerasi, C.; Case, B.C.; Forrestal, B.J.; Torguson, R.; Weintraub, W.S.; Garcia-Garcia, H.M.; Waksman, R. Drug-Coated Balloon for De Novo Coronary Artery Disease: JACC State-of-the-Art Review. J. Am. Coll. Cardiol. 2020, 75, 1061–1073. [Google Scholar] [CrossRef]
  59. Saam, T.; Ferguson, M.; Yarnykh, V.; Takaya, N.; Xu, D.; Polissar, N.; Hatsukami, T.; Yuan, C. Quantitative evaluation of carotid plaque composition by in vivo MRI. Arter. Thromb. Vasc. Biol. 2007, 27, 2342–2348. [Google Scholar] [CrossRef]
  60. Underhill, H.R.; Hatsukami, T.S.; Fayad, Z.A.; Fuster, V.; Yuan, C. MRI of carotid atherosclerosis: Clinical impli-cations and future directions. Nat. Rev. Cardiol. 2010, 7, 165–173. [Google Scholar] [CrossRef]
  61. Corti, R.; Fuster, V. Imaging of atherosclerosis: Magnetic resonance imaging. Eur. Heart J. 2011, 32, 1709–1719. [Google Scholar] [CrossRef] [PubMed]
  62. Fuster, V.; Badimon, L. Mechanisms of disease: The pathogenesis of coronary disease and the acute coronary syndromes. N. Engl. J. Med. 2010, 326, 242–250. [Google Scholar]
  63. Yuan, C.; Mitsumori, L.M.; Ferguson, M.S.; Polissar, N.L.; Echelard, D.; Ortiz, G.; Small, R.; Davies, J.W.; Kerwin, W.S.; Hatsukami, T.S. In vivo accuracy of multispectral magnetic resonance imaging for identifying lipid-rich necrotic cores and intraplaque hemorrhage in advanced human carotid plaques. Circulation 2001, 104, 2051–2056. [Google Scholar] [CrossRef] [PubMed]
  64. Zhao, X.Q.; Yuan, C.; Hatsukami, T.S.; Frechette, E.H.; Kang, X.J.; Maravilla, K.R.; Brown, B.G. Effects of prolonged intensive lipid-lowering therapy on the characteristics of carotid atherosclerotic plaques in vivo by MRI: A case-control study. Arterioscler. Thromb. Vasc. Biol. 2001, 21, 1623–1629. [Google Scholar] [CrossRef]
  65. Cai, J.; Hatsukami, T.S.; Ferguson, M.S.; Kerwin, W.S.; Saam, T.; Chu, B.; Takaya, N.; Polissar, N.L.; Yuan, C. In vivo quantitative measurement of intact fibrous cap and lipid-rich necrotic core size in atherosclerotic carotid plaque: Comparison of high-resolution, contrast-enhanced magnetic resonance imaging and histology. Circulation 2005, 112, 3437–3444. [Google Scholar] [CrossRef]
  66. Yuan, C.; Mitsumori, L.M.; Beach, K.W.; Maravilla, K.R. Carotid atherosclerotic plaque: Noninvasive MR characterization and identification of vulnerable lesions. Radiology 2001, 221, 285–299. [Google Scholar] [CrossRef] [PubMed]
  67. Cappendijk, V.C.; Cleutjens, K.B.; Heeneman, S.; Schurink, G.W.H.; Welten, R.J.T.J.; Kessels, A.G.; van Suylen, R.J.; Daemen, M.J.; van Engelshoven, J.M.; Kooi, M.E. In vivo detection of hemorrhage in human atherosclerotic plaques with magnetic resonance imaging. J. Magn. Reson. Imaging 2004, 20, 105–110. [Google Scholar] [CrossRef] [PubMed]
  68. Trivedi, R.A.; U-King-Im, J.M.; Graves, M.J.; Cross, J.J.; Horsley, J.; Goddard, M.J.; Skepper, J.N.; Quartey, G.; Warburton, E.; Joubert, I.; et al. In vivo detection of macrophages in human carotid atheroma: Temporal dependence of ultrasmall superparamagnetic particles of iron oxide-enhanced MRI. Stroke 2004, 35, 1631–1635. [Google Scholar] [CrossRef] [PubMed]
  69. Fayad, Z.A.; Fallon, J.T.; Shinnar, M.; Wehrli, S.; Dansky, H.M.; Poon, M.; Badimon, J.J.; Charlton, S.A.; Fisher, E.A.; Breslow, J.L.; et al. Noninvasive in vivo high-resolution magnetic resonance imaging of atherosclerotic lesions in genetically engineered mice. Circulation 1998, 98, 1541–1547. [Google Scholar] [CrossRef]
  70. Edelman, R.R.; Chien, D.; Kim, D. Fast selective black blood MR imaging. Radiology 1991, 181, 655–660. [Google Scholar] [CrossRef]
  71. Edelman, R.R.; Mattle, H.P.; Wallner, B.; Bajakian, R.; Kleefield, J.; Kent, C.; Skillman, J.J.; Mendel, J.B.; Atkinson, D.J. Extracranial carotid arteries: Evaluation with “black blood” MR angiography. Radiology 1990, 177, 45–50. [Google Scholar] [CrossRef] [PubMed]
  72. O’Keefe, J.H.; Lee, J.H.; Bell, D.S.; Holick, M.F. The ATHEROMA (Atorvastatin Therapy: Effects on Reduction of Macrophage Activity) Study. Evaluation using ultrasmall superparamagnetic iron oxide-enhanced magnetic resonance imaging in carotid disease. J. Am. Coll. Cardiol. 2009, 53, 2039–2050. [Google Scholar] [CrossRef]
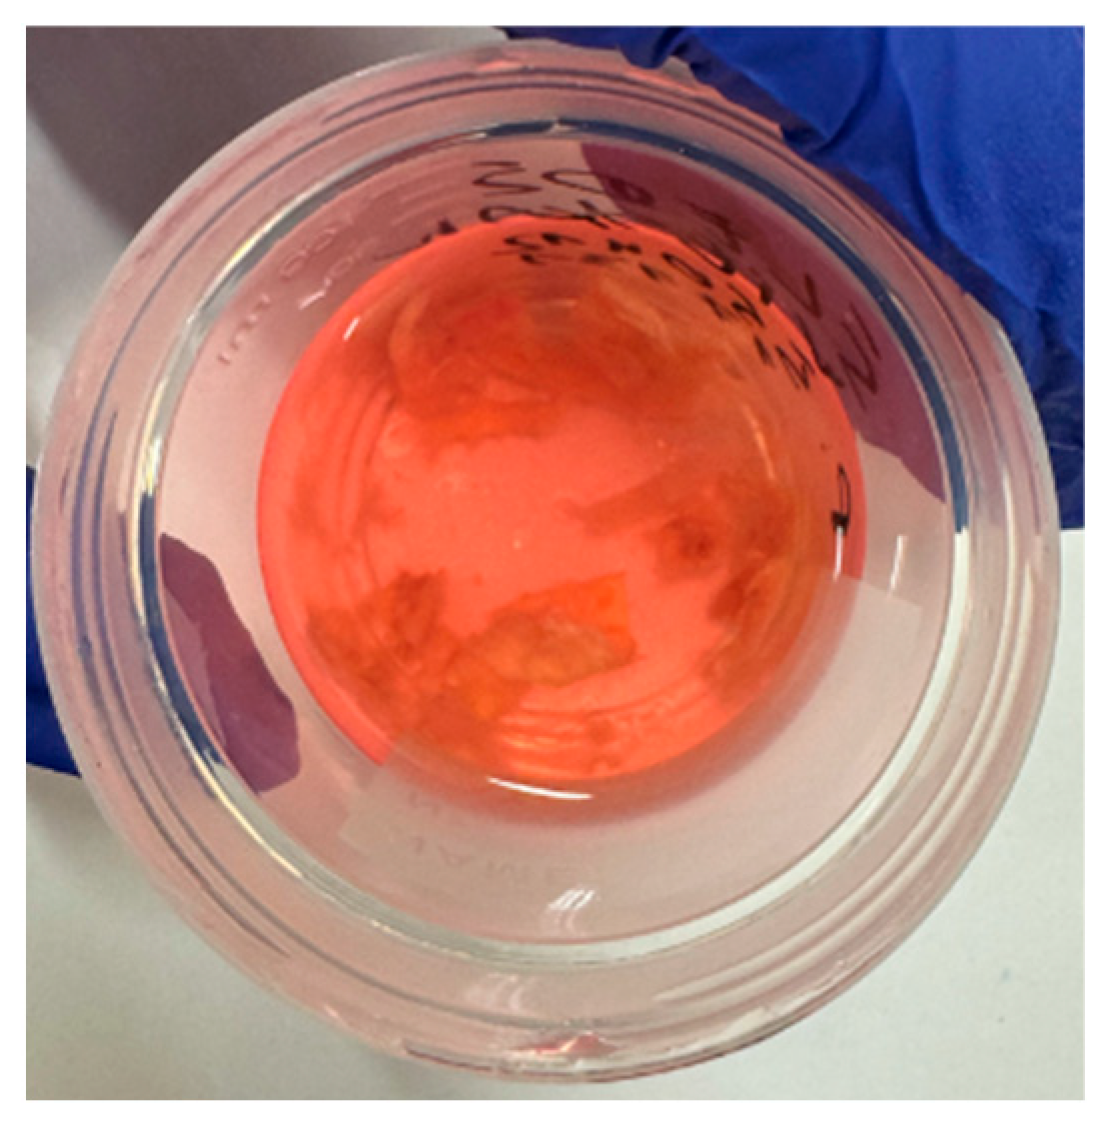
Figure 1. View of the retrieved vessel after defrosting.
Ijtm 04 00034 g001
Figure 2. Samples with Rose Bengal disodium salt at concentrations of 0.01 mM (No. 1), 0.02 mM (No. 2), 0.03 mM (No. 3), 0.04 mM (No. 4), and 0.05 mM (No. 5).
Ijtm 04 00034 g002
Figure 3. Pre and post samples irradiated at 532 nm for 15 min. Samples with Rose Bengal disodium salt at concentrations of 0.01 mM (No. 1), 0.02 mM (No. 2), 0.03 mM (No. 3), 0.04 mM (No. 4), and 0.05 mM (No. 5).
Ijtm 04 00034 g003
Figure 4. Tesla Optima MR360 MRI used to determine T1 and T2 relaxation times.
Ijtm 04 00034 g004
Figure 5. Determined T1 and T2 relaxation times of atherosclerotic samples before PDT. The yellow box is the area of the Voxel.
Ijtm 04 00034 g005
Figure 6. Determined T1 and T2 relaxation times of atherosclerotic samples after PDT. The yellow box is the area of the Voxel.
Ijtm 04 00034 g006
Figure 7. (a,d) contain the results of mapping the longitudinal relaxation times. They present maps of the distribution of T1 times. The sharp demarcation between the fluid and the examined structures is clearly visible. (b,e) present the distribution of the R2 coefficient—it is a measure of the fit of the approximating curve describing the measurement data. It is clearly seen that this coefficient is close to “1”. This proves a very good fit. These figures also show a decrease in the R2 value for regions more distant from the coil plane. This is a characteristic phenomenon because the coil used has the characteristics of a flat-loop coil which produces very good figures in its plane, but when moving away from it, the signal quality decreases and noise increases. This type of coil was chosen due to the geometric characteristics of the tested objects. The aim of the study was to image the structures lying in the plane of the urethra as well as possible. The figures presented in (c,f) are histograms, allowing determination of the quantitative distribution of pixels in the examined figures. The histogram plot is the number of pixels in the image (vertical axis) with a particular brightness value (horizontal axis). The histogram plot is the distribution of the number of pixels according to their intensities, corresponding to the time value that is calculated.
Ijtm 04 00034 g007
Figure 8. (a,d) contain the results of mapping the transverse relaxation times. It should be said that in this case the noise is significantly increased. Very short relaxation times resulted in poorer image quality—the system used for research has limitations regarding the parameters that can be set for TE and TR times. This is most noticeable in the parts of the image showing fluids. The regions imaging the structures being examined are mapped with greater accuracy—their times are significantly longer than the T2 of fluid areas. In the context of the decrease in the quality of fitting the curves to the measurement data, the figures for R2 (b,e) are very telling, where the fluid areas are dark blue and therefore R2 is close to the value “0”. (c,f) are histograms showing the distribution of the number of pixels in the examined region. The histogram plot is the number of pixels in the image (vertical axis) with a particular brightness value (horizontal axis). The histogram plot is the distribution of the number of pixels according to their intensities, corresponding to the time value that is calculated.
Ijtm 04 00034 g008
Table 1. Comparison of relaxation times before and after irradiation.
SampleBeforeAfter
100
200
3T1 = 1030.1 ms ± 154.52
T2 = 136.33 ms ± 20.45
T1 = 1209.8 ms ± 181.47
T2 = 97.011 ms ± 14.55
4T1 = 977.63 ms ± 146.64
T2 = 128.83 ms ± 19.32
T1 = 1201.1 ms ± 180.17
T2 = 105.06 ms ± 15.76
5T1 = 1737 ms ± 260.55
T2 = 198.24 ms ± 29.74
T1 = 1944.3 ms ± 291.60
T2 = 127.65 ms ± 19.15
Disclaimer/Publisher’s Note: The statements, opinions and data contained in all publications are solely those of the individual author(s) and contributor(s) and not of MDPI and/or the editor(s). MDPI and/or the editor(s) disclaim responsibility for any injury to people or property resulting from any ideas, methods, instructions or products referred to in the content.