
Evaluation of TOPSIS Algorithm for Multi-Criteria Handover in LEO Satellite Networks: A Sensitivity Analysis

 , , ,
, , ,  , and
, and
Abstract
1. Introduction
2. Related Work
3. Methodology
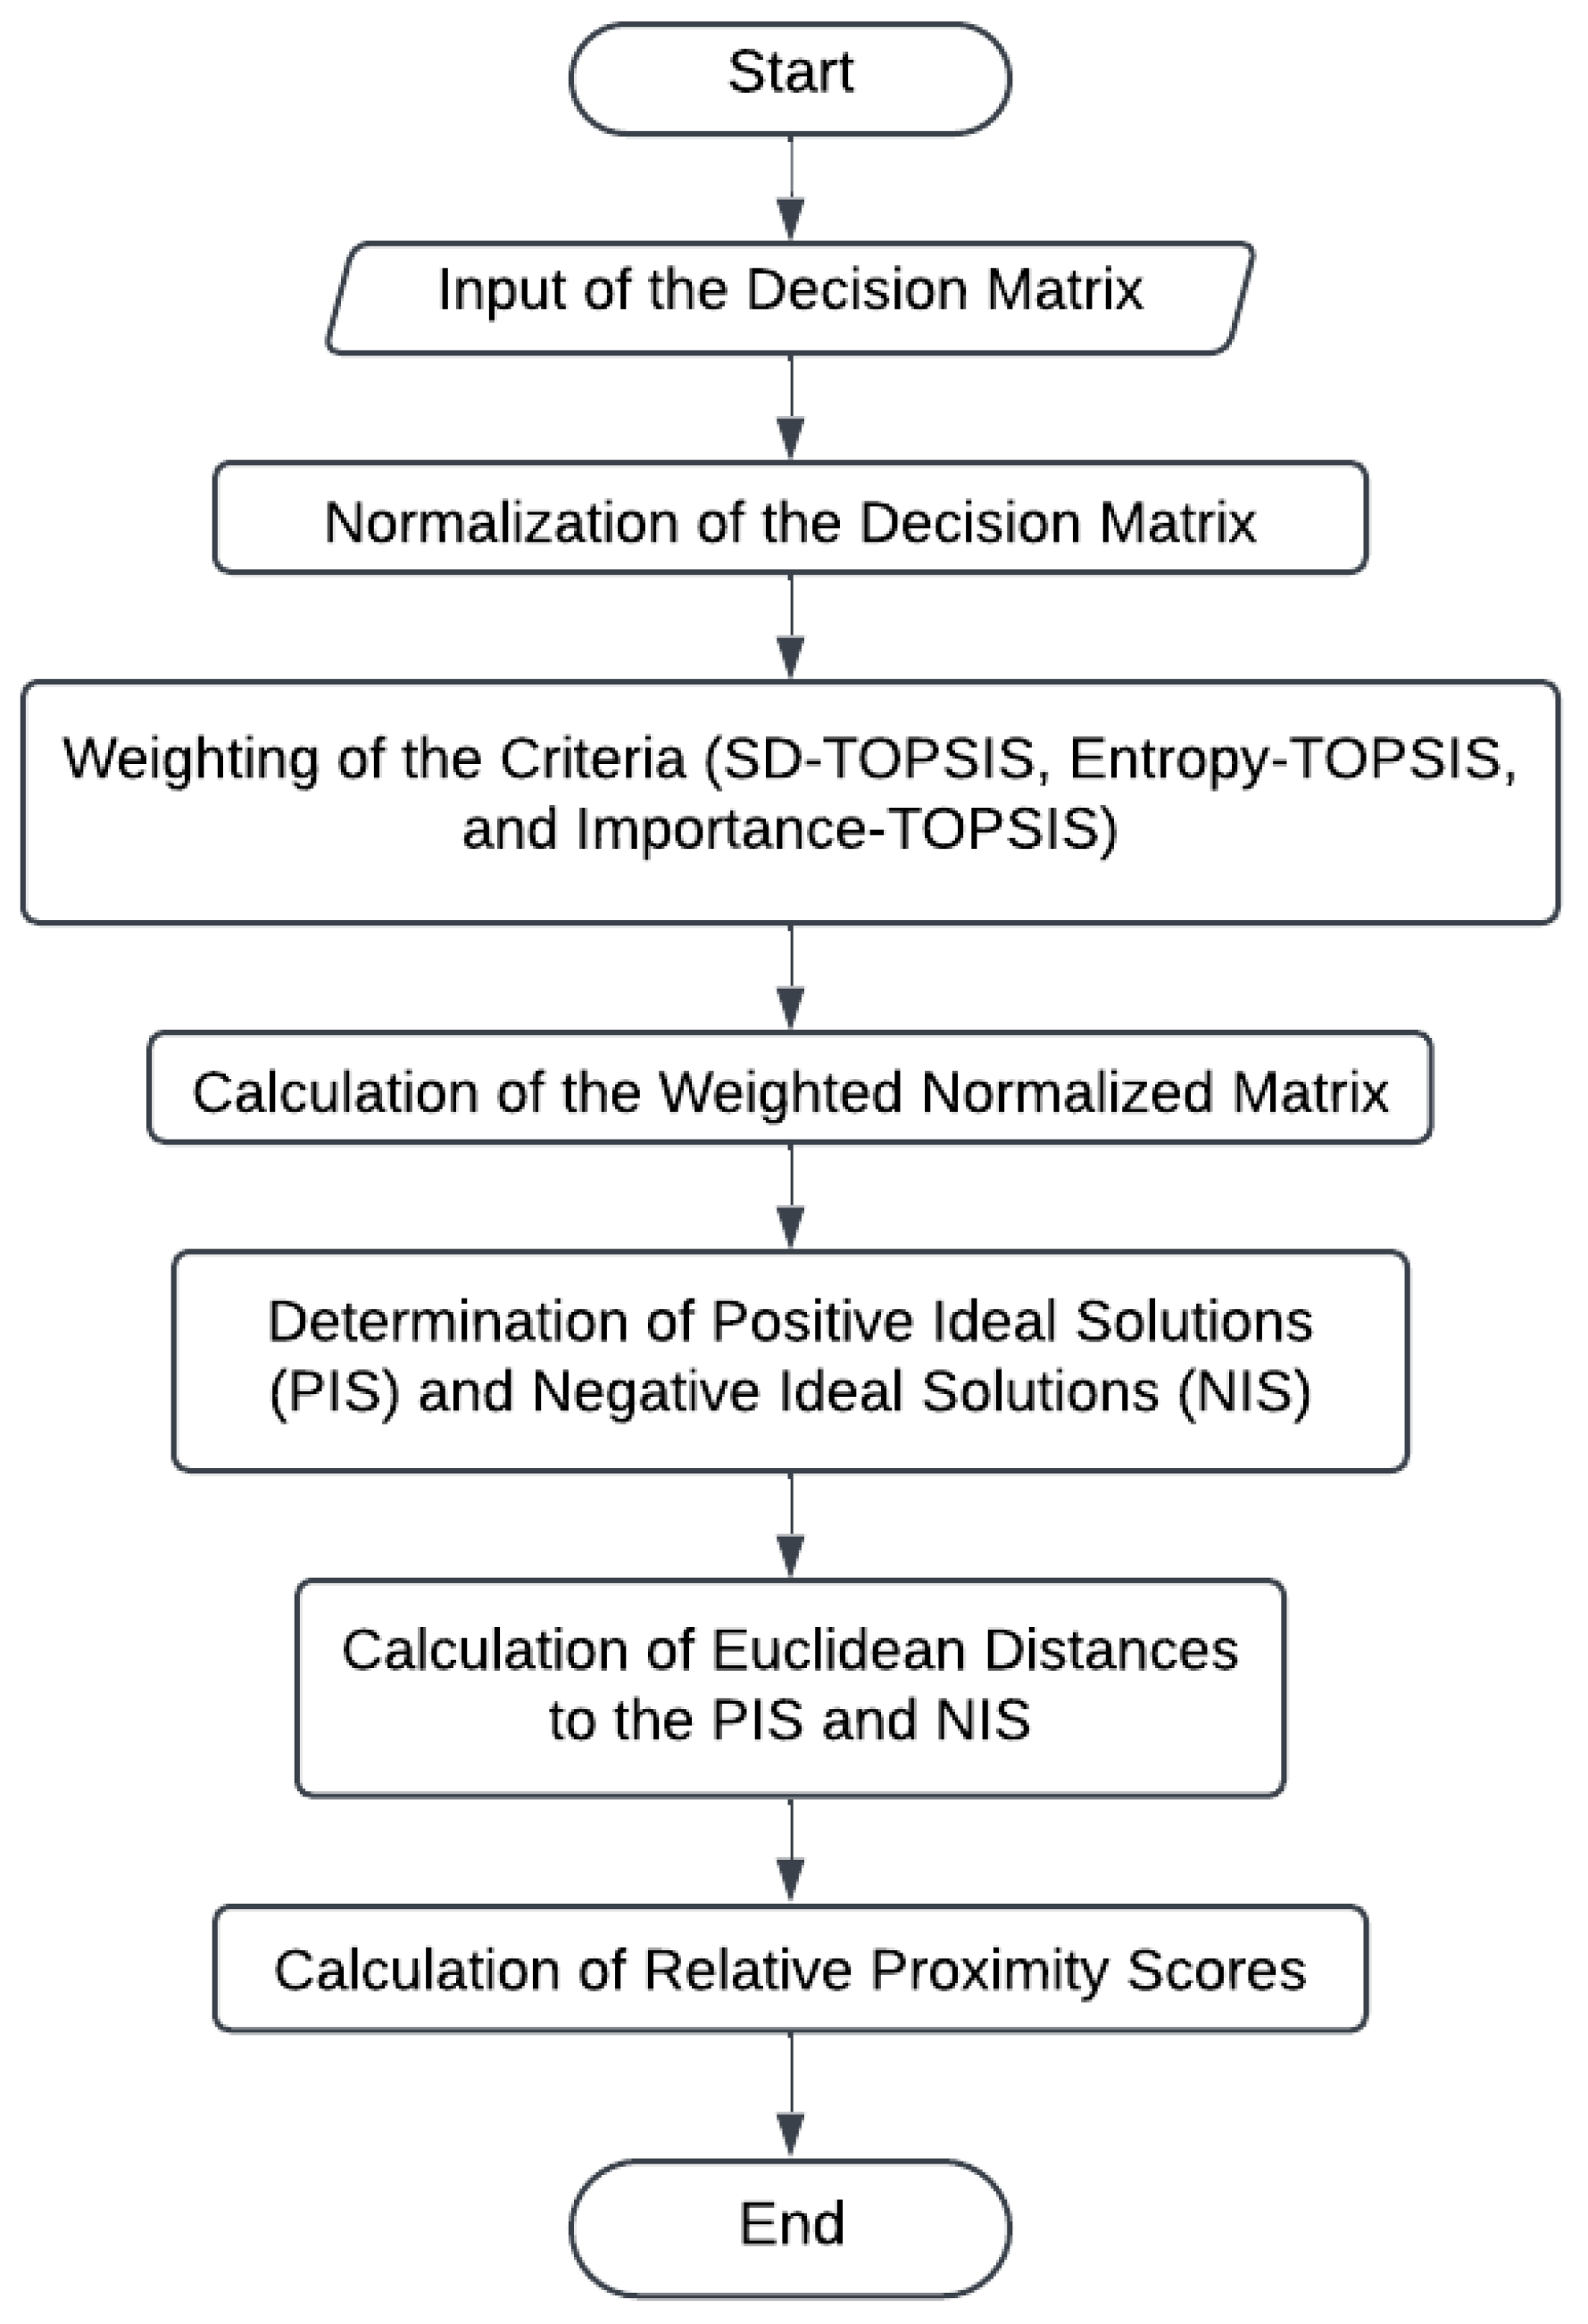
3.1. The TOPSIS Algorithm
3.1.1. Input of the Decision Matrix
3.1.2. Normalization of the Decision Matrix
3.1.3. Criteria Weighting
- SD-TOPSIS: The standard deviation measures the dispersion of values around the mean and allows for evaluating the variability of a criterion [10]. A criterion with a larger standard deviation receives a higher weight, and vice versa. SD-TOPSIS is particularly useful when criteria exhibit different levels of variability. It is more practical and objective for handover management in satellite networks, as several parameters fluctuate rapidly due to the fast movement of LEO satellites. It removes the subjectivity in defining the weights of criteria by assigning moderate and precise weights based on real data. Considering m as the number of alternatives and j as the index of the criterion, the standard deviation of each criterion is calculated as follows:where is an element from , and the average value. The weight of each of the criterion j among the n criteria is then given by:
- Entropy-TOPSIS: The entropy measures data uncertainty by using probability theory [13]. The wider the data, the higher the uncertainty. Entropy-TOPSIS is a type of objective weighting technique that measures the weights of criteria based on their relative differences. The main limitation is that it requires the data to exhibit good diversity. Homogeneous data can lead to less effective results as the method tends to overweight the criterion with the highest entropy. Considering j as the index of the criterion, the value of the entropy divergence degree coefficient can be measured using the normalized decision matrix, with 0 1:withThe weight of each criterion is then given by:
- Importance-TOPSIS: This technique uses continuous replacement to calculate the impact of individual changes of each criterion value on the target value (the score in our case), and give higher weight to the criteria that have more impact on the target [7]. The steps of the continuous replacement method are as follows:
- Step 1. Let , be such that their difference is . Suppose the order of substitution is to change first, then change .
- Step 2. Replace only and find . is obtained by changing on the basis of Q. Calculate the influence of :
- Step 3. Replace only and find . is obtained by changing on the basis of . Calculate the influence of :It can be observed that:
- Step 4. Calculate the weight:with .
3.1.4. Weighted Normalized Decision Matrix
3.1.5. Determination of the Positive Ideal Solution (PIS) and Negative Ideal Solution (NIS)
3.1.6. Calculation of Distances to PIS and NIS
3.1.7. Calculation of the Relative Proximity Score
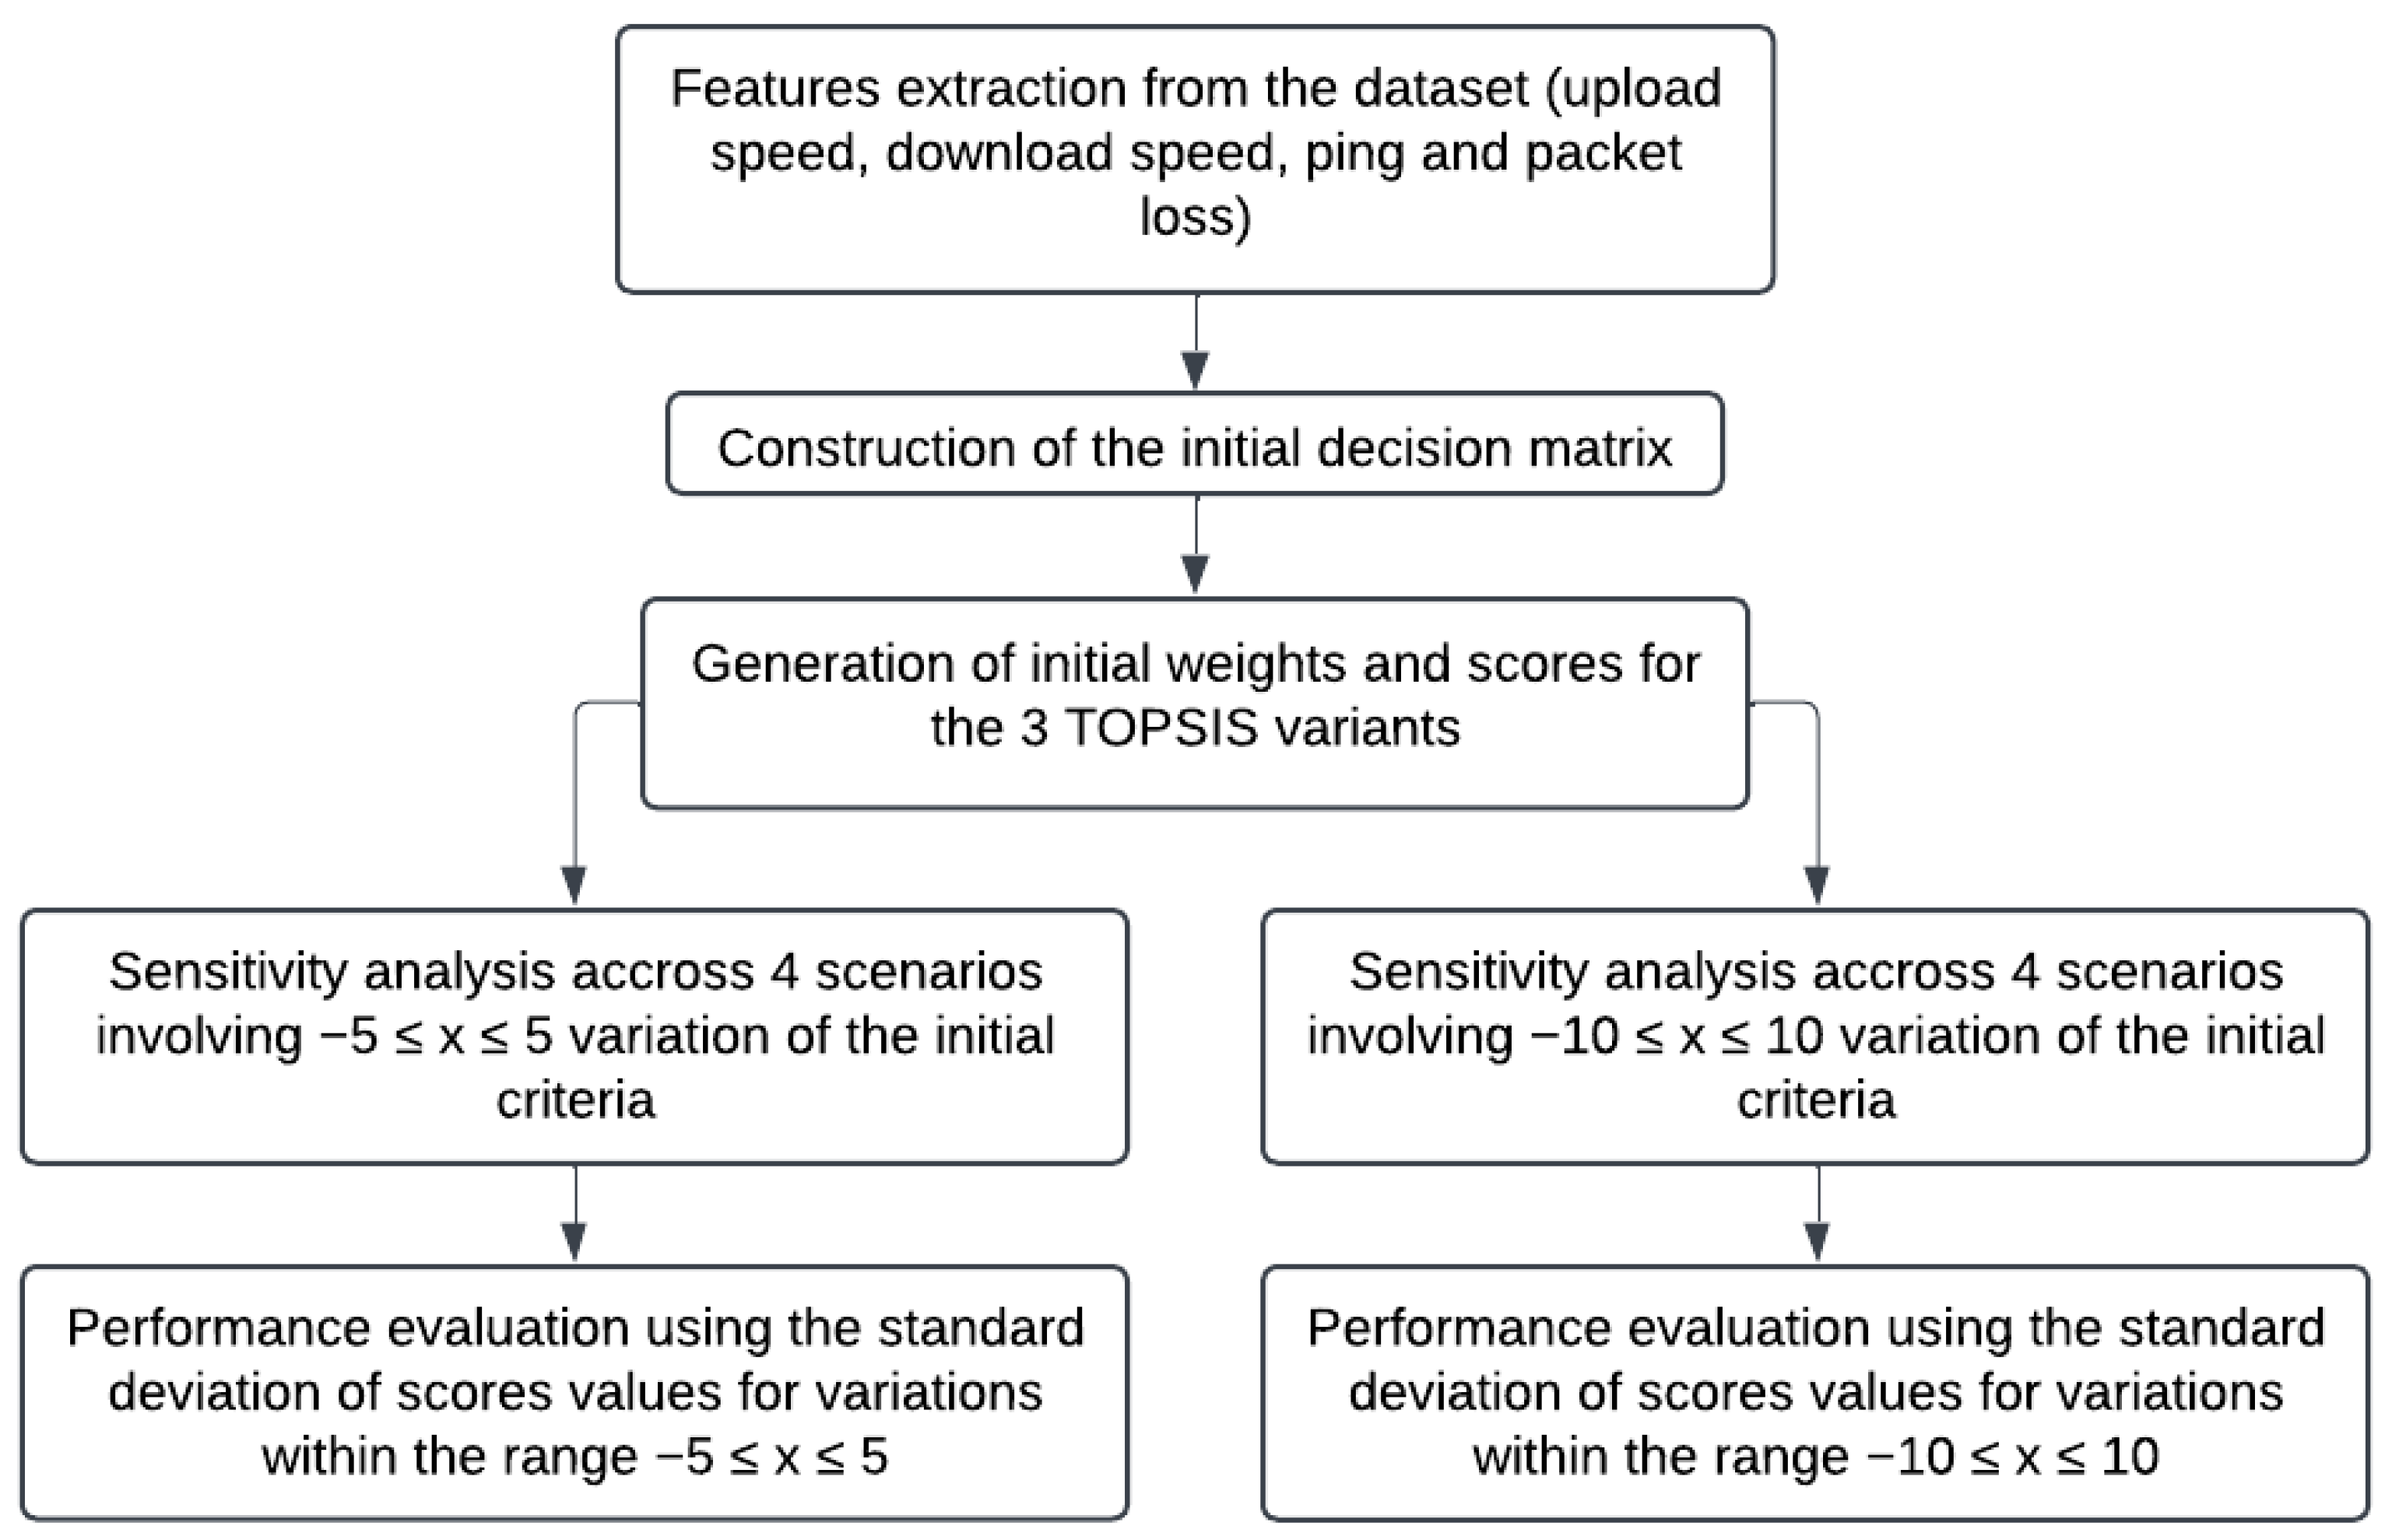
3.2. Sensitivity Analysis
- First scenario: For each satellite, apply a random change on the upload speed value only, while keeping other criteria values unchanged.
- Second scenario: For each satellite, apply a random change on the download speed value in addition to the previously changed upload speed value and keep the packet loss values unchanged.
- Third scenario: For each satellite, apply a random change on the ping value in addition to the previously changed upload speed and download speed values and keep the packet loss value unchanged.
- Fourth scenario: For each satellite, apply a random change on the packet loss value in addition to the previously changed upload speed, download speed, and ping.
3.3. Experimental Setup
4. Simulation Results and Discussion
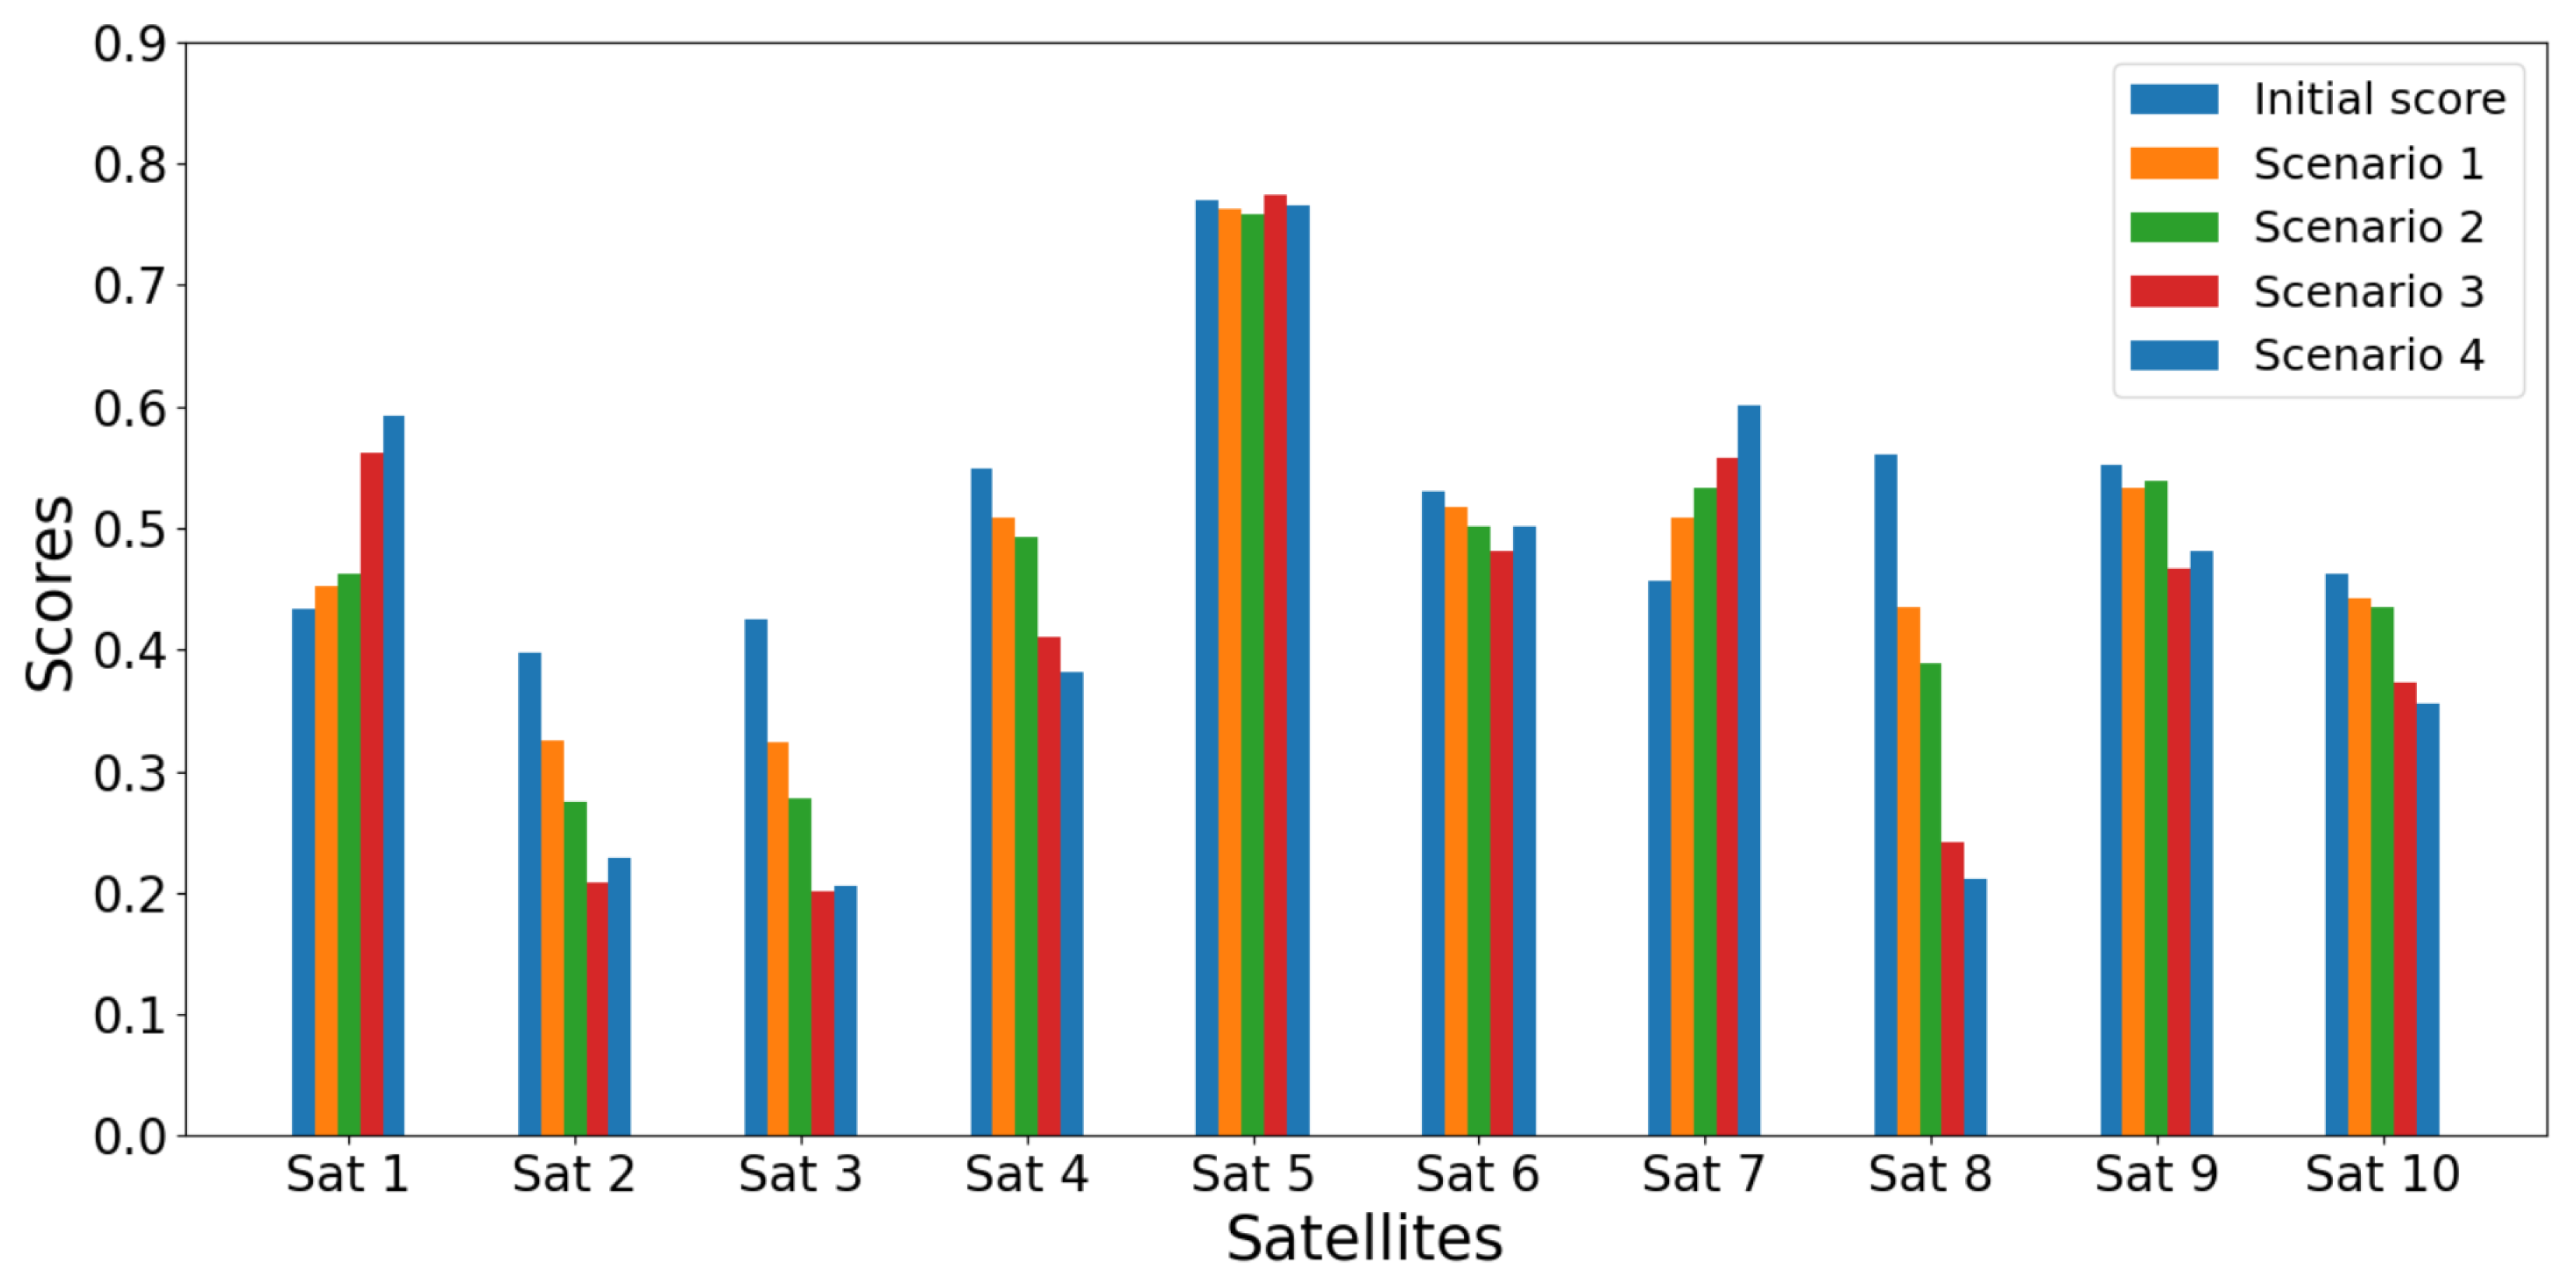
4.1. Initial Case
4.2. Case 1: Sensitivity Analysis for Criterion Variation Within
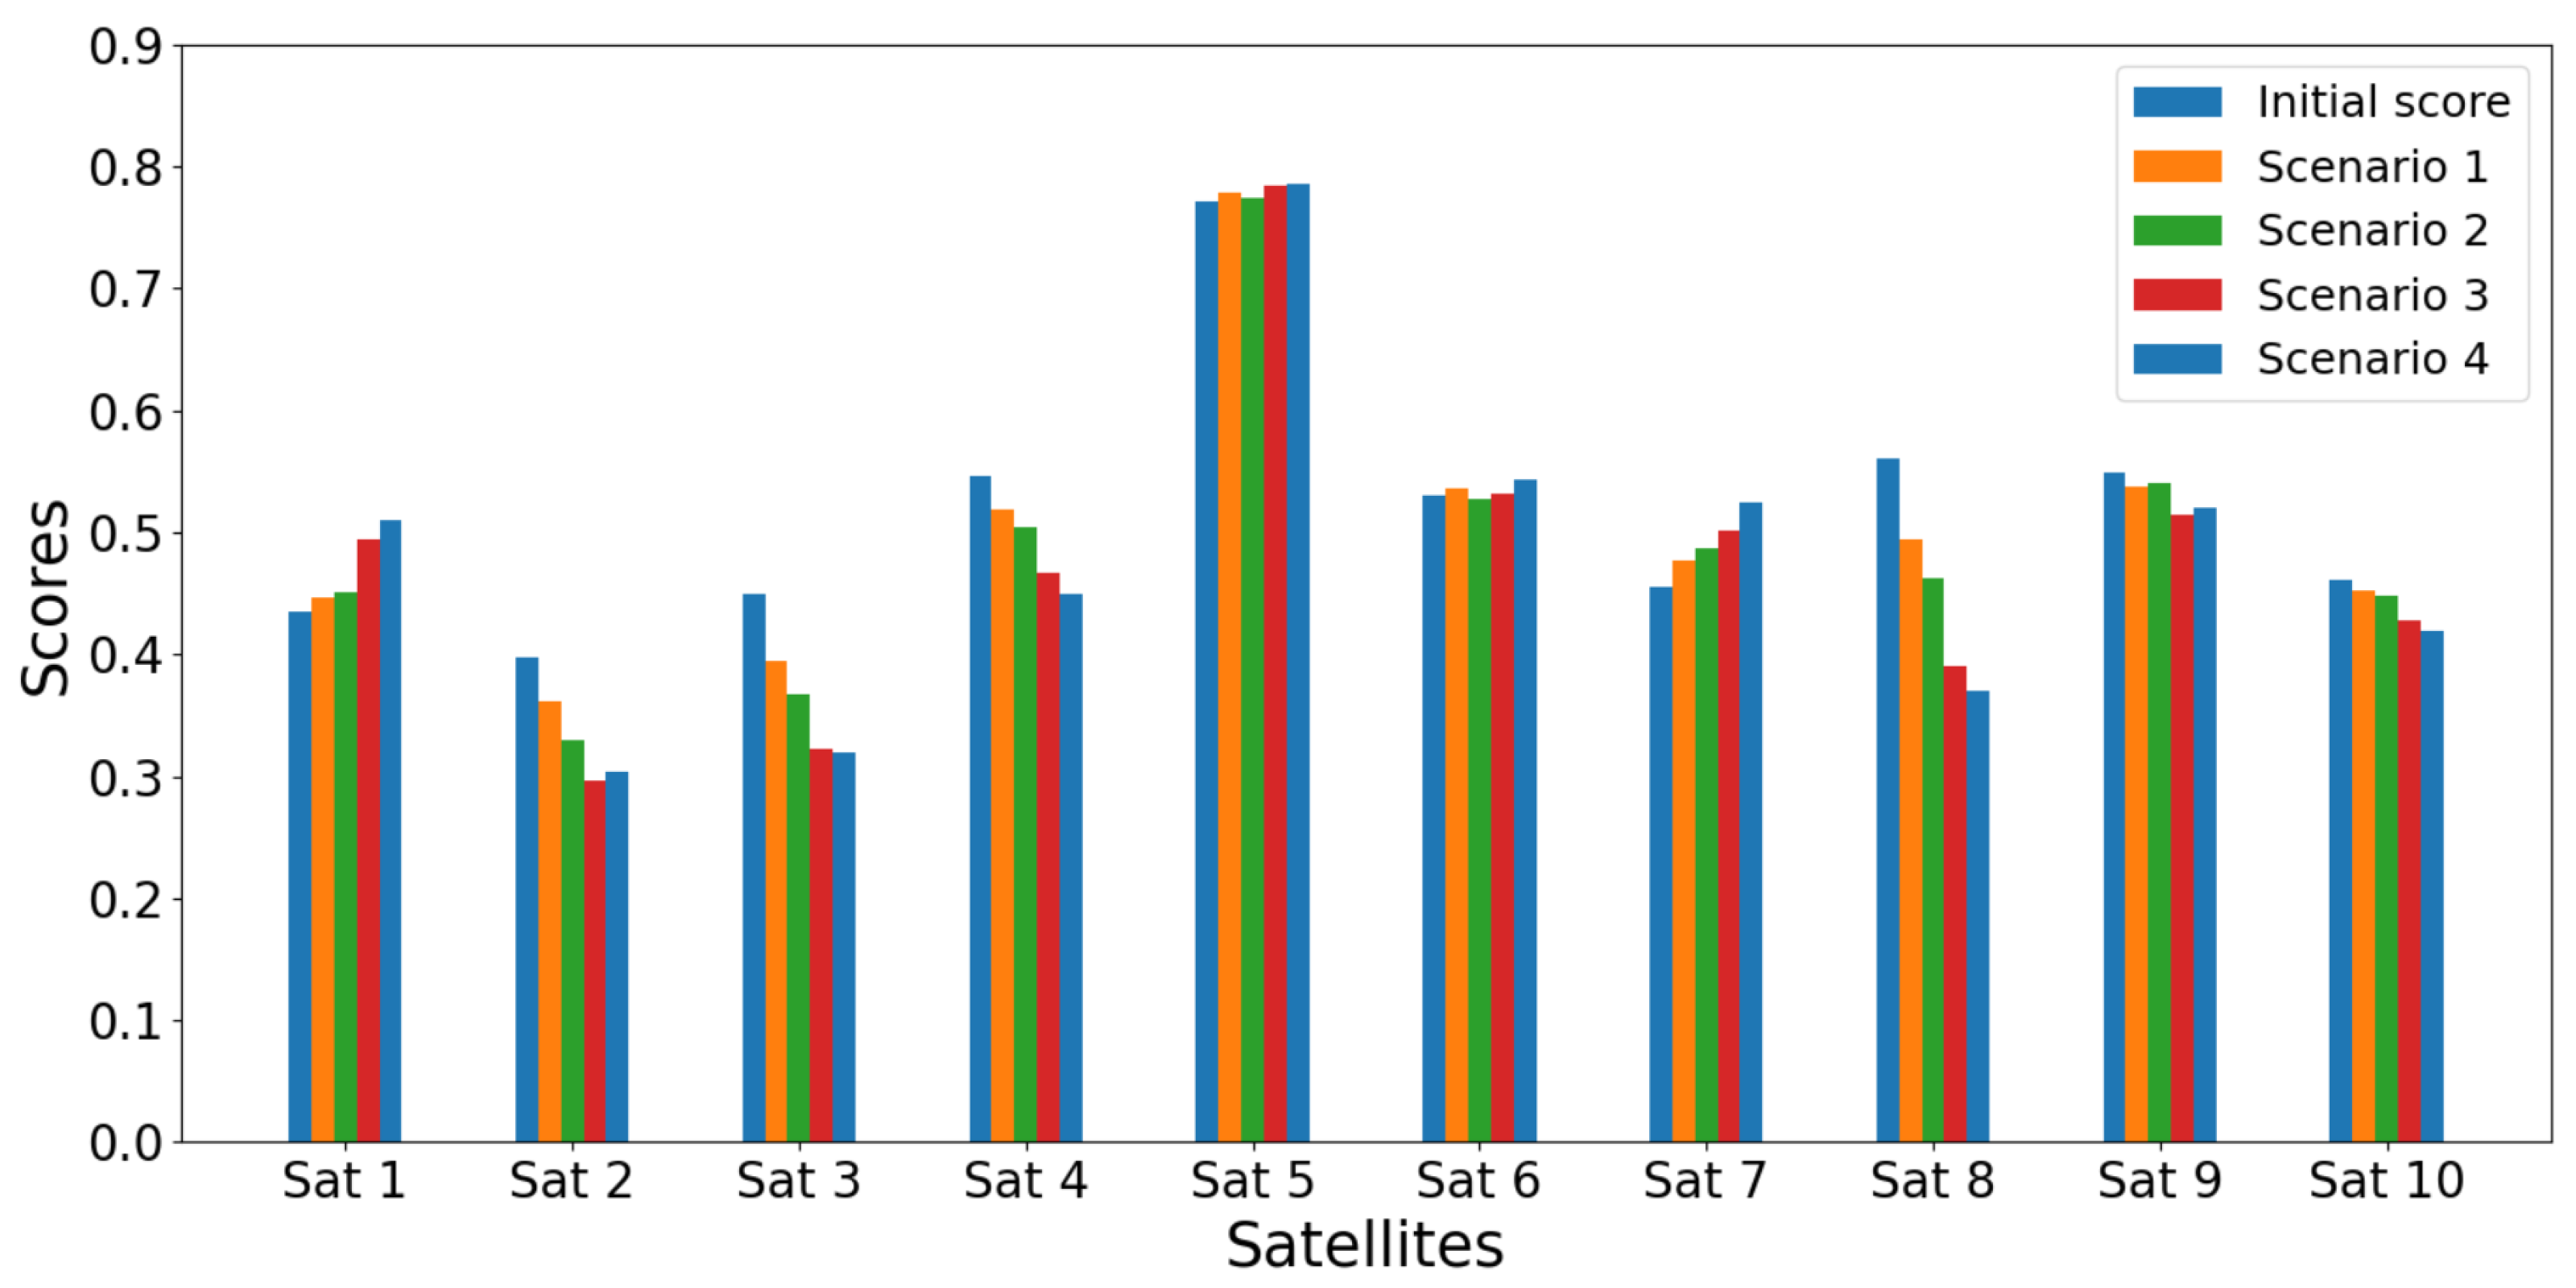
4.2.1. Scenario 1: Variation in Upload Speed
4.2.2. Scenario 2: Variation in Upload Speed and Download Speed
4.2.3. Scenario 3: Variation in Upload Speed, Download Speed, and Ping
4.2.4. Scenario 4: Variation in Upload Speed, Download Speed, Ping, and Packet Loss
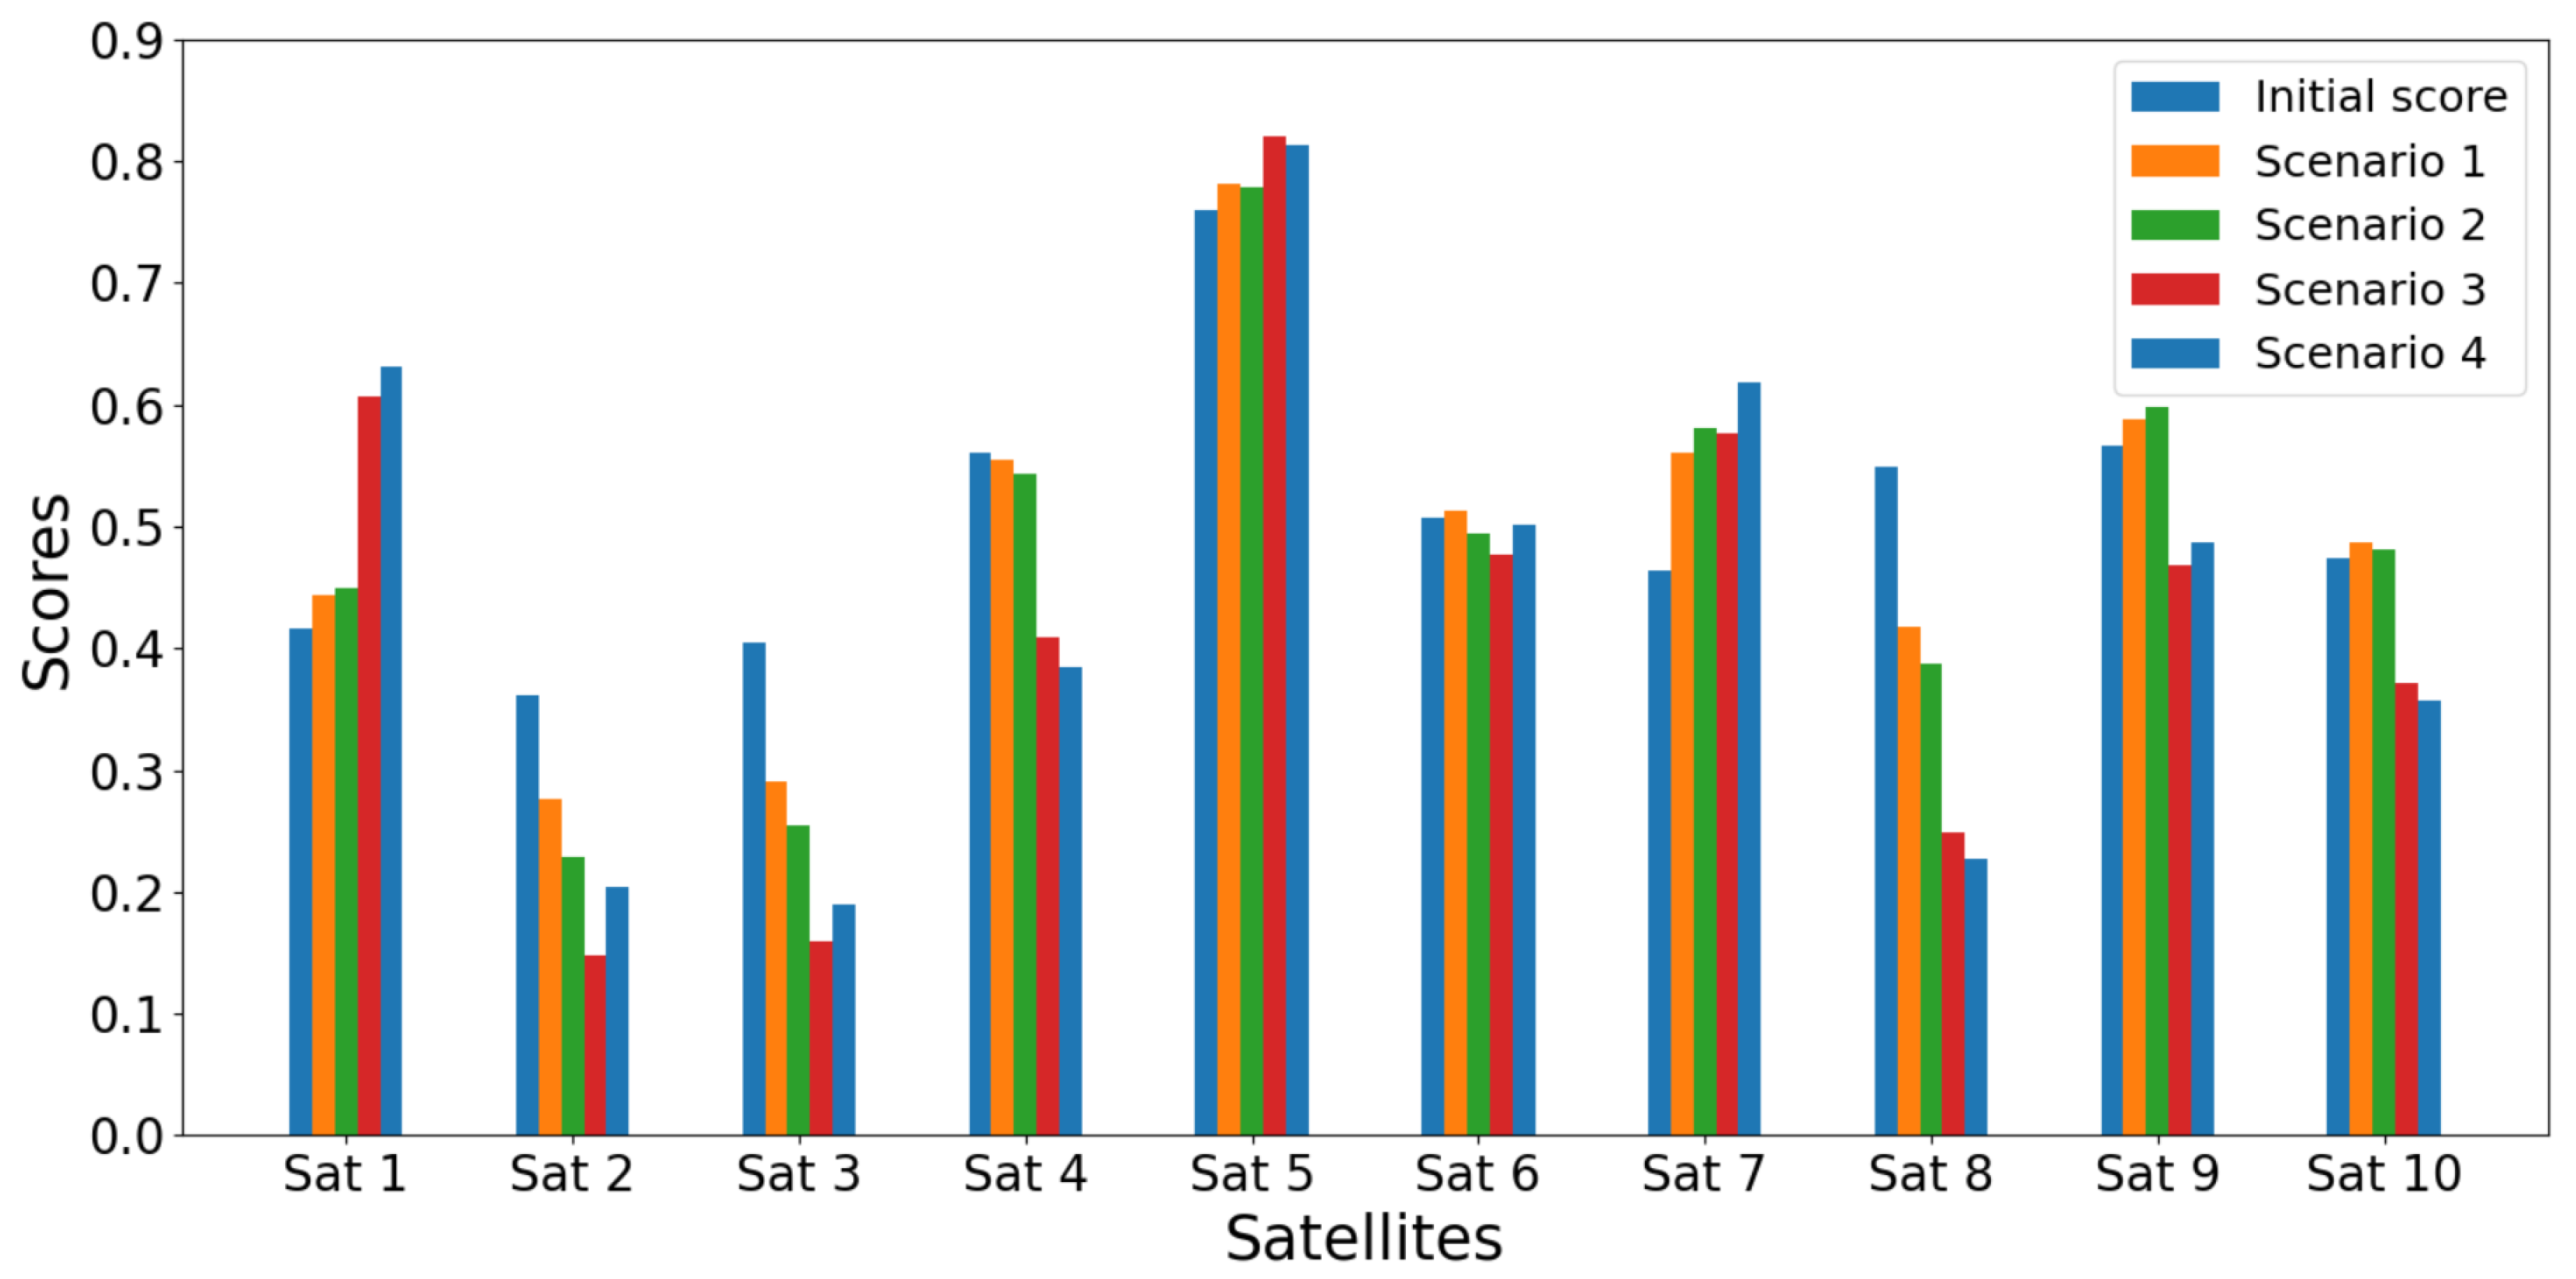
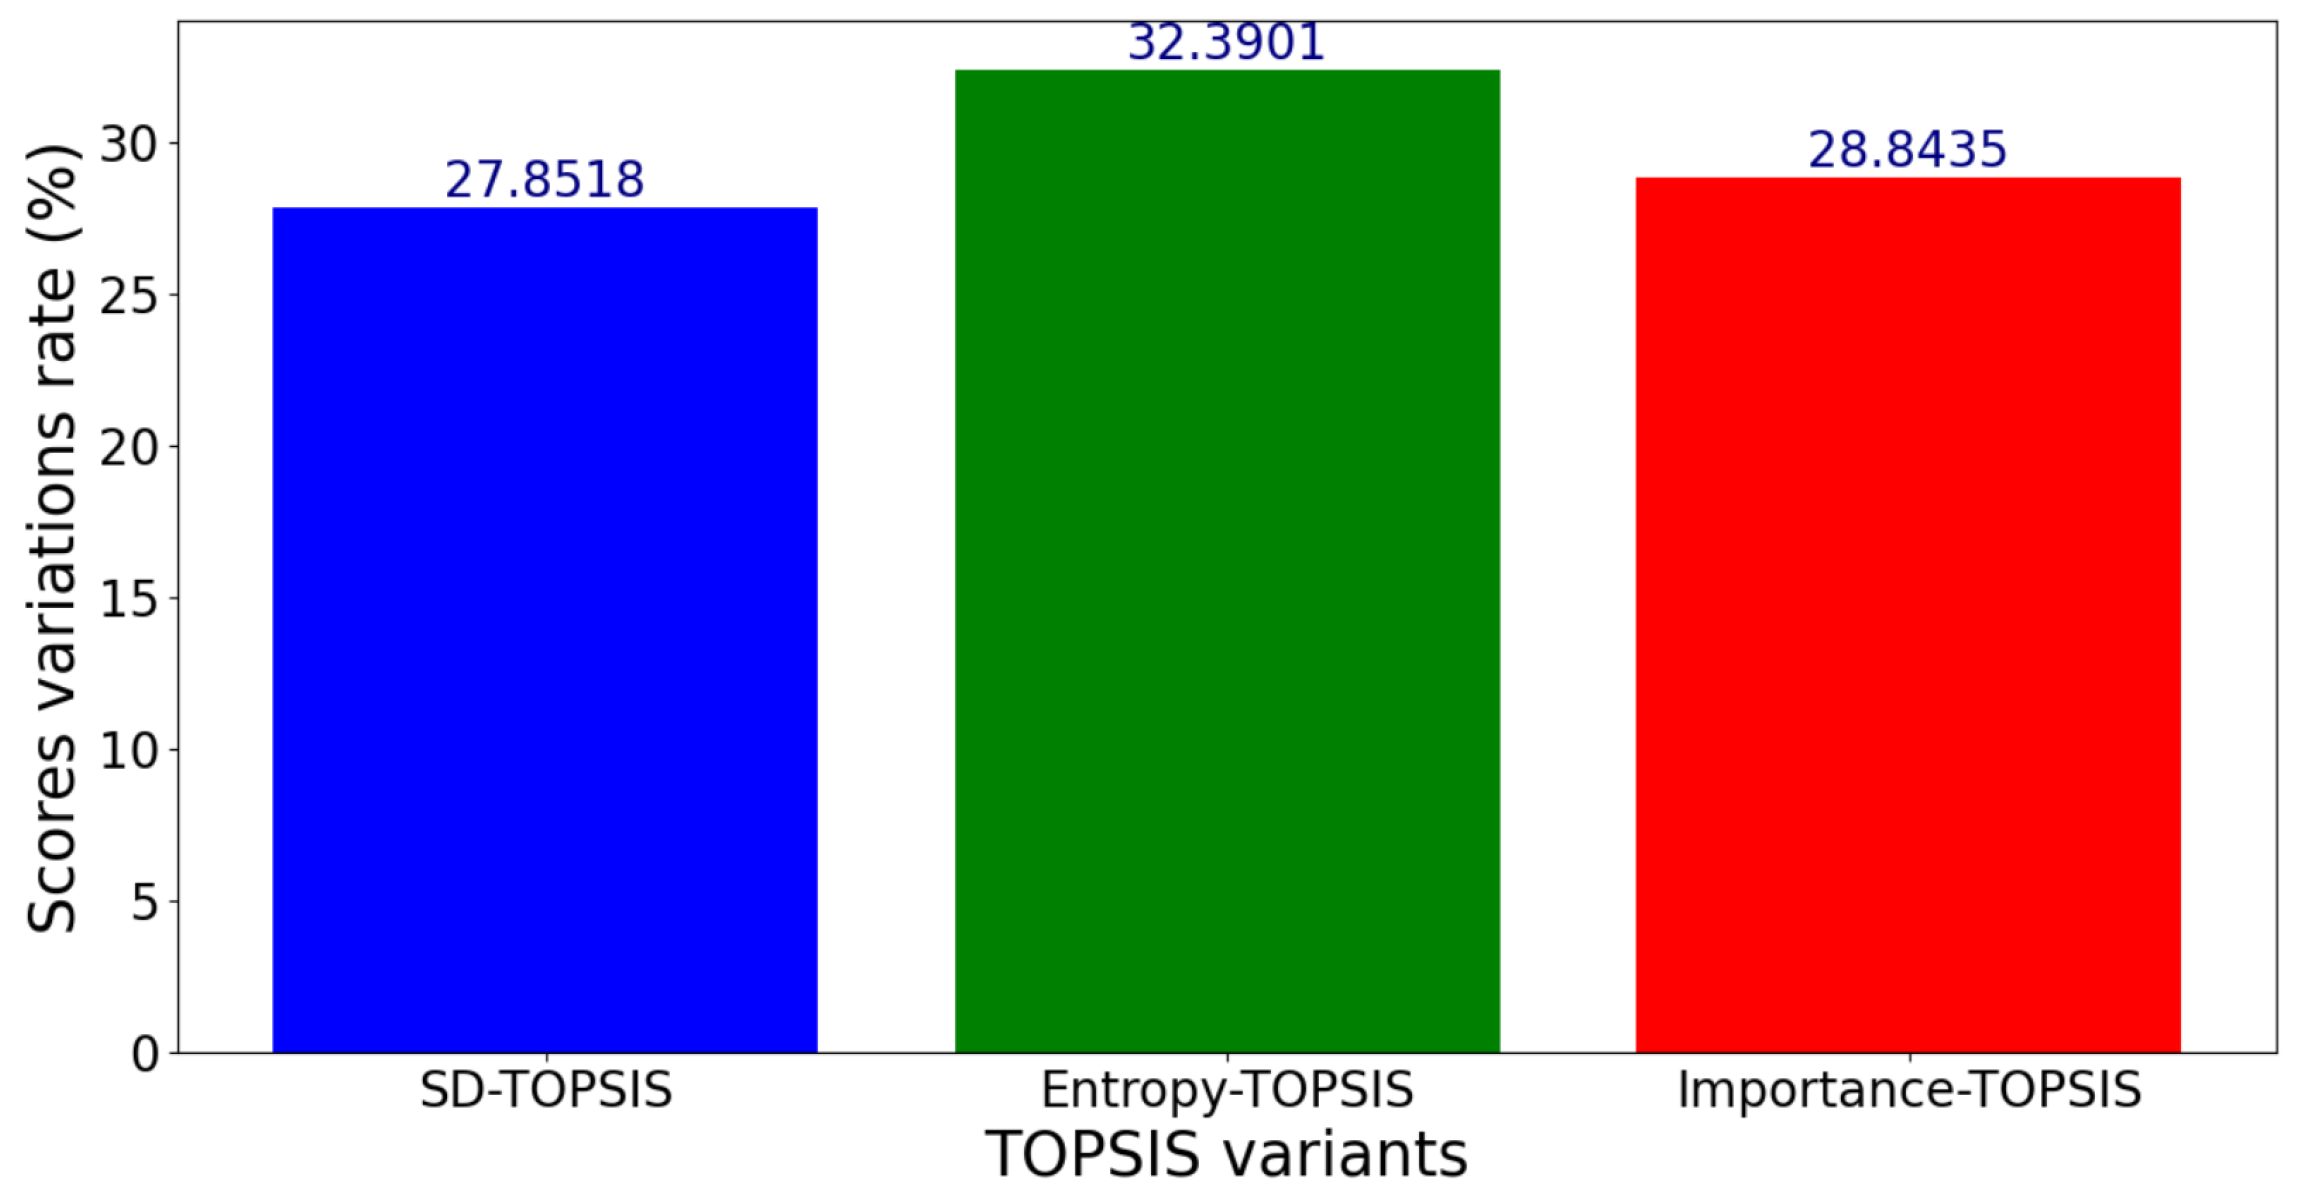
4.2.5. Scores Variation
4.2.6. Sensitivity Analysis
4.3. Case 2: Sensitivity Analysis with Criterion Variation Within
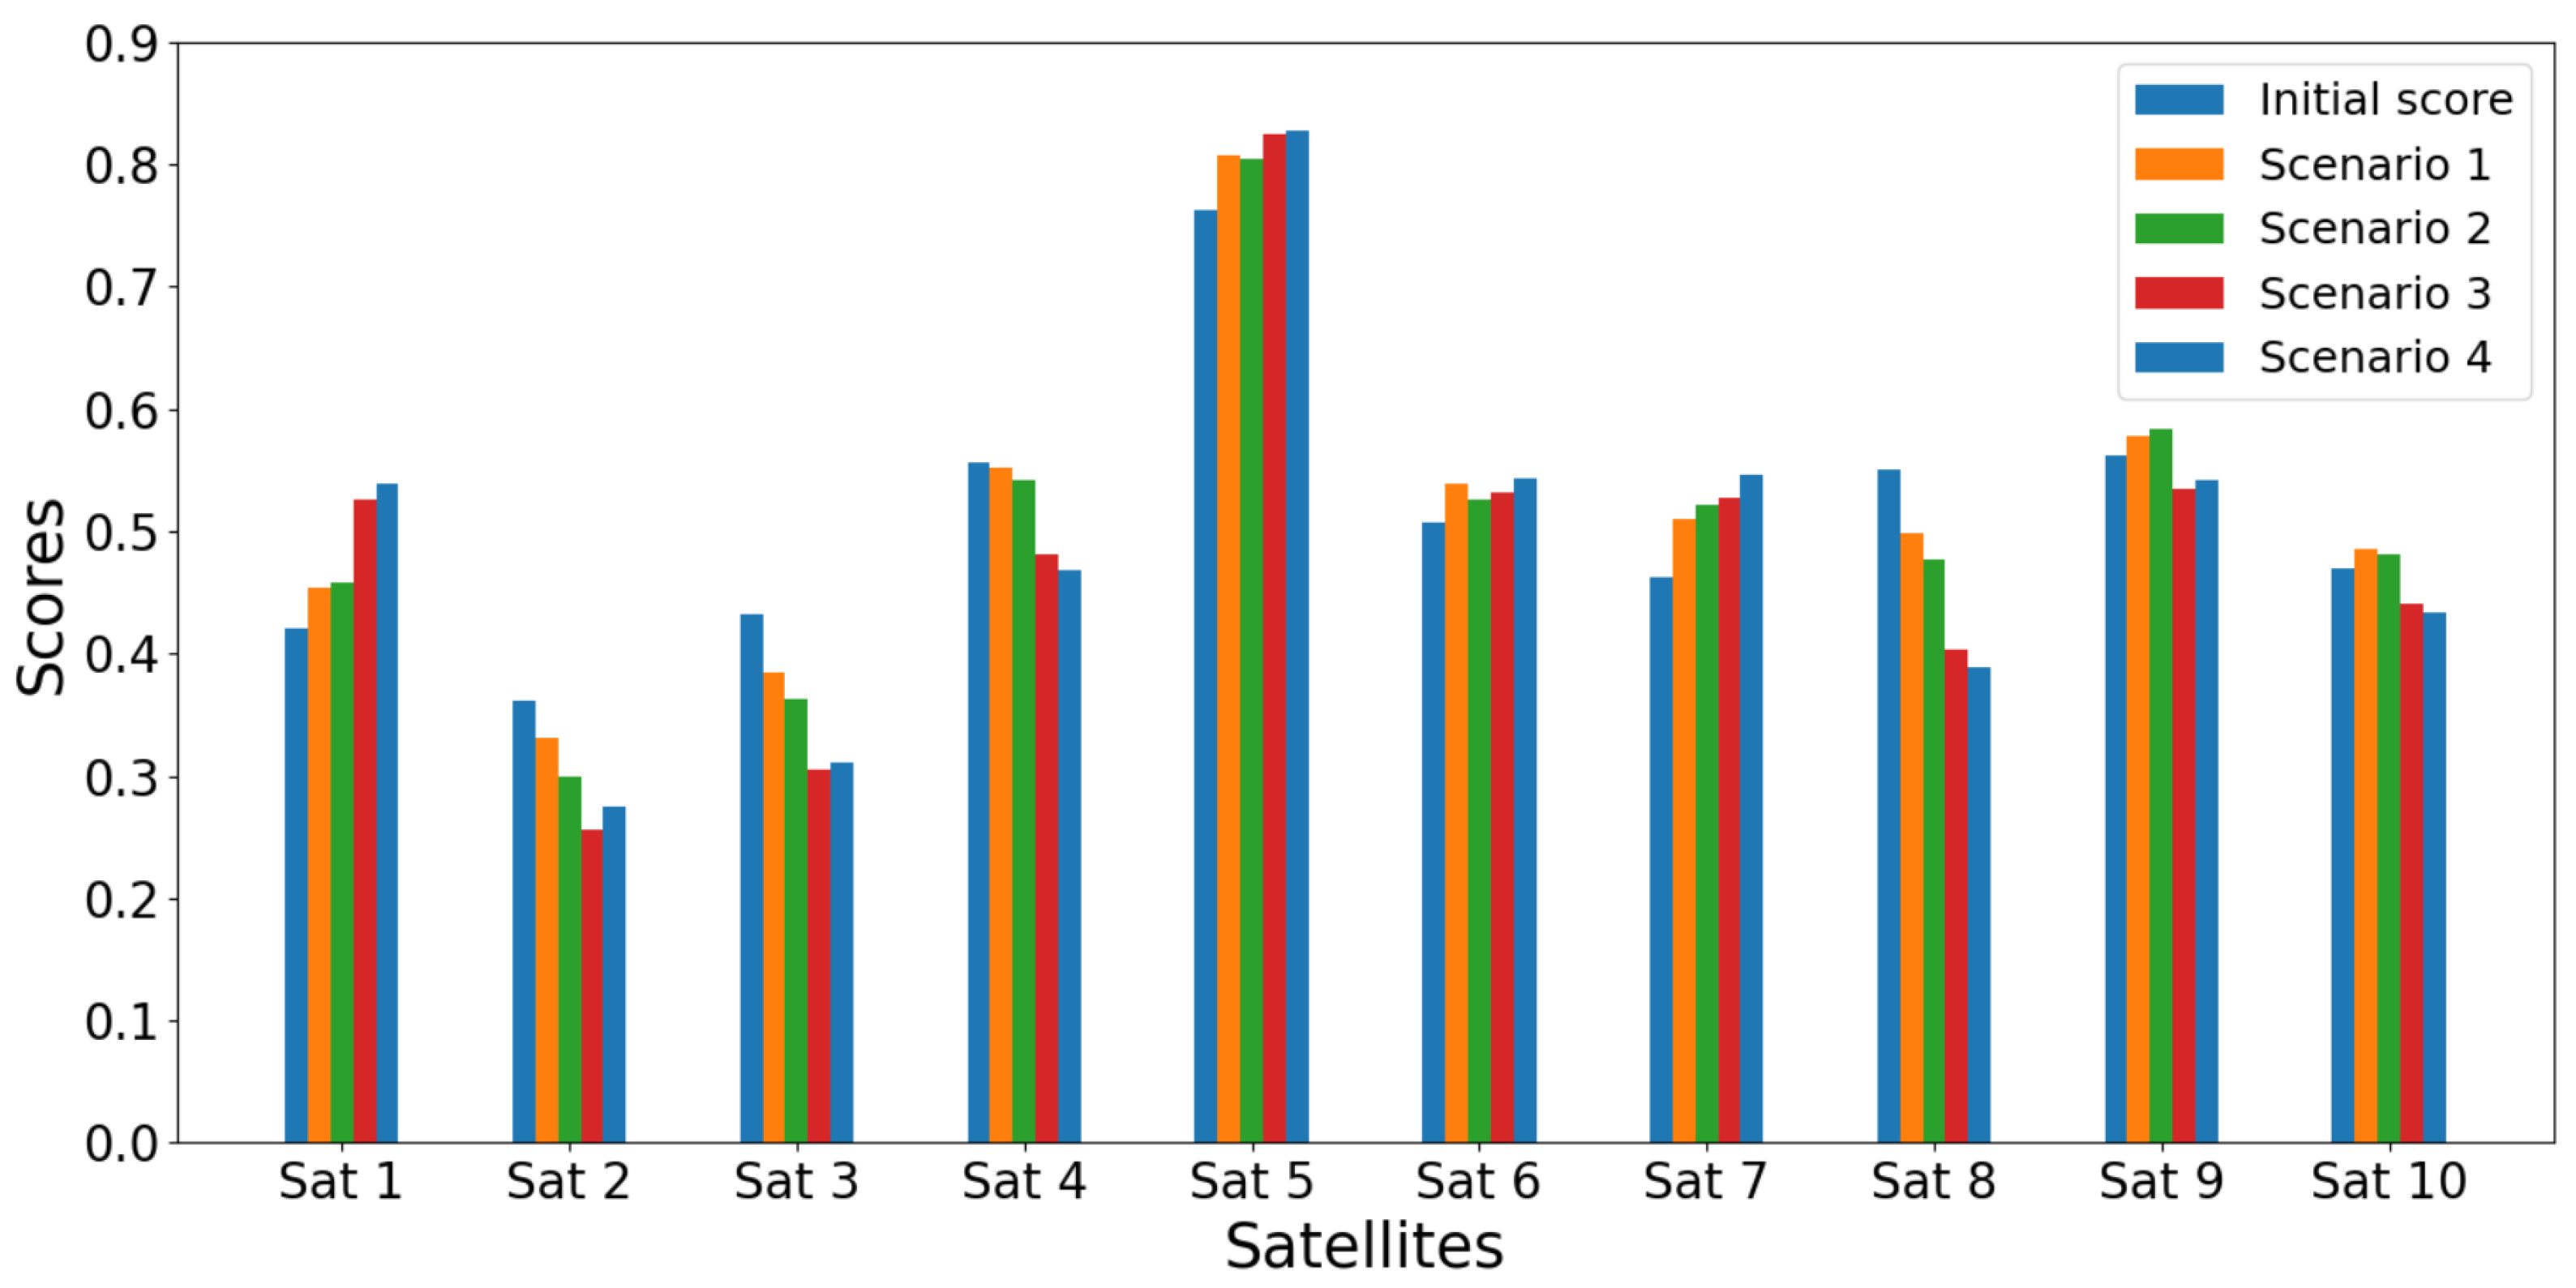
4.3.1. Scenario 1: Variation in Upload Speed
4.3.2. Scenario 2: Variation in Upload Speed and Download Speed
4.3.3. Scenario 3: Variation in Upload Speed, Download Speed, and Ping
4.3.4. Scenario 4: Variation in Upload Speed, Download Speed, Ping, and Packet Loss
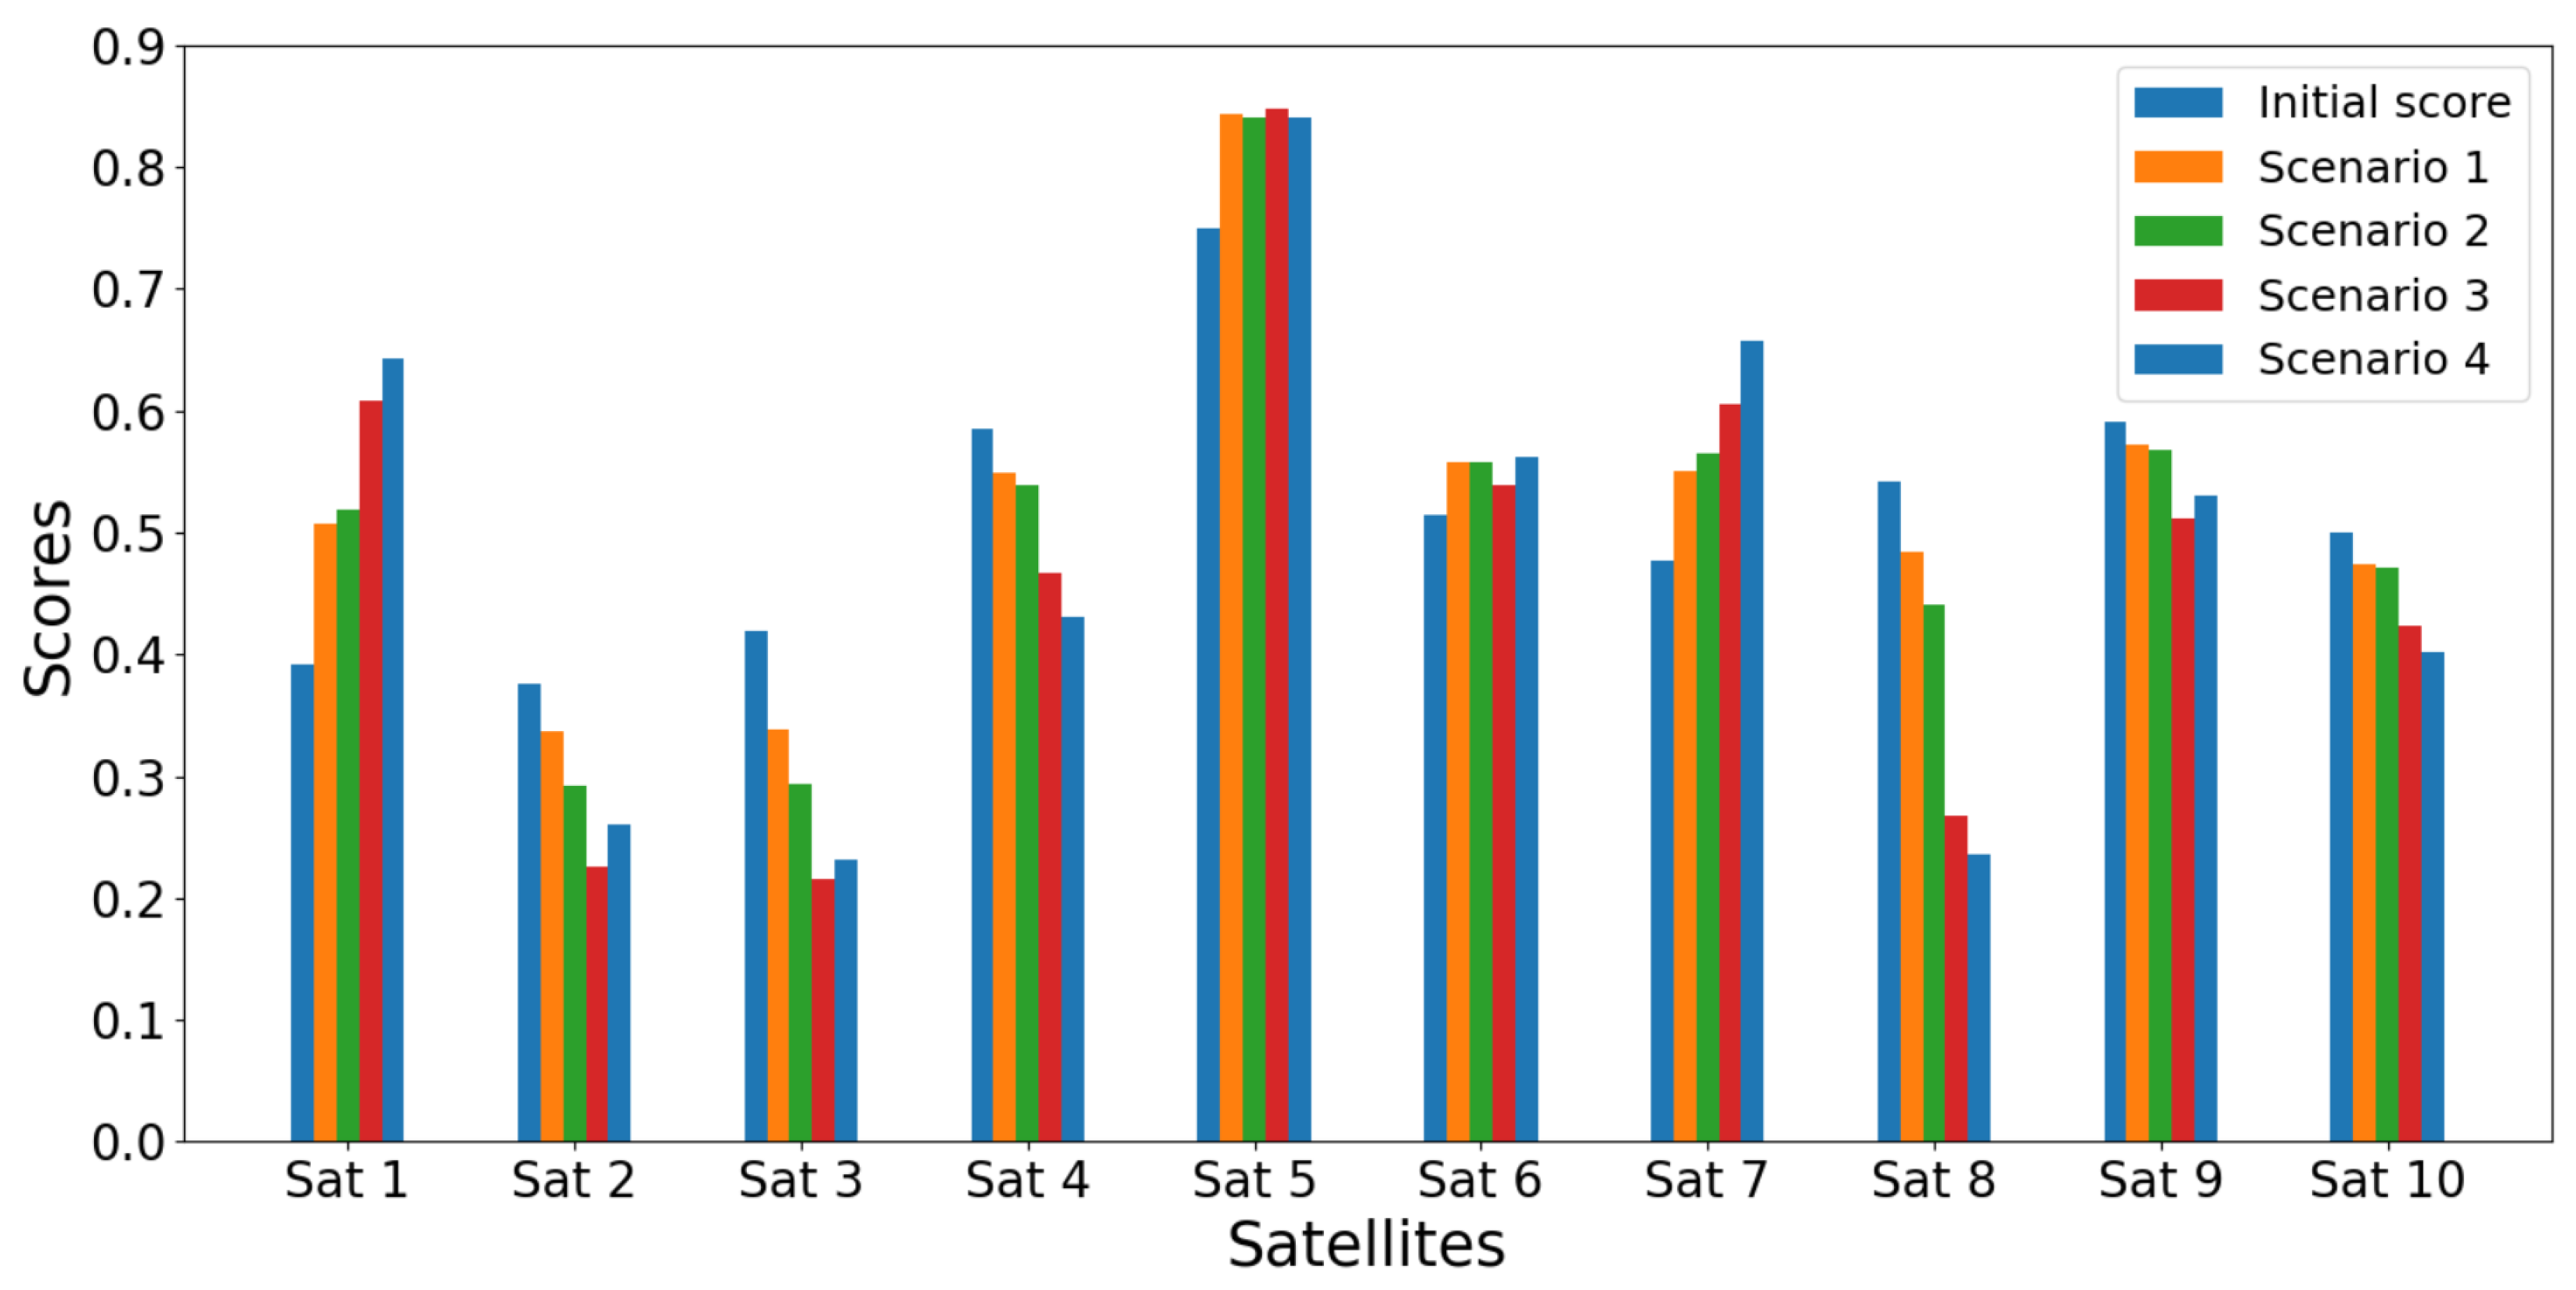
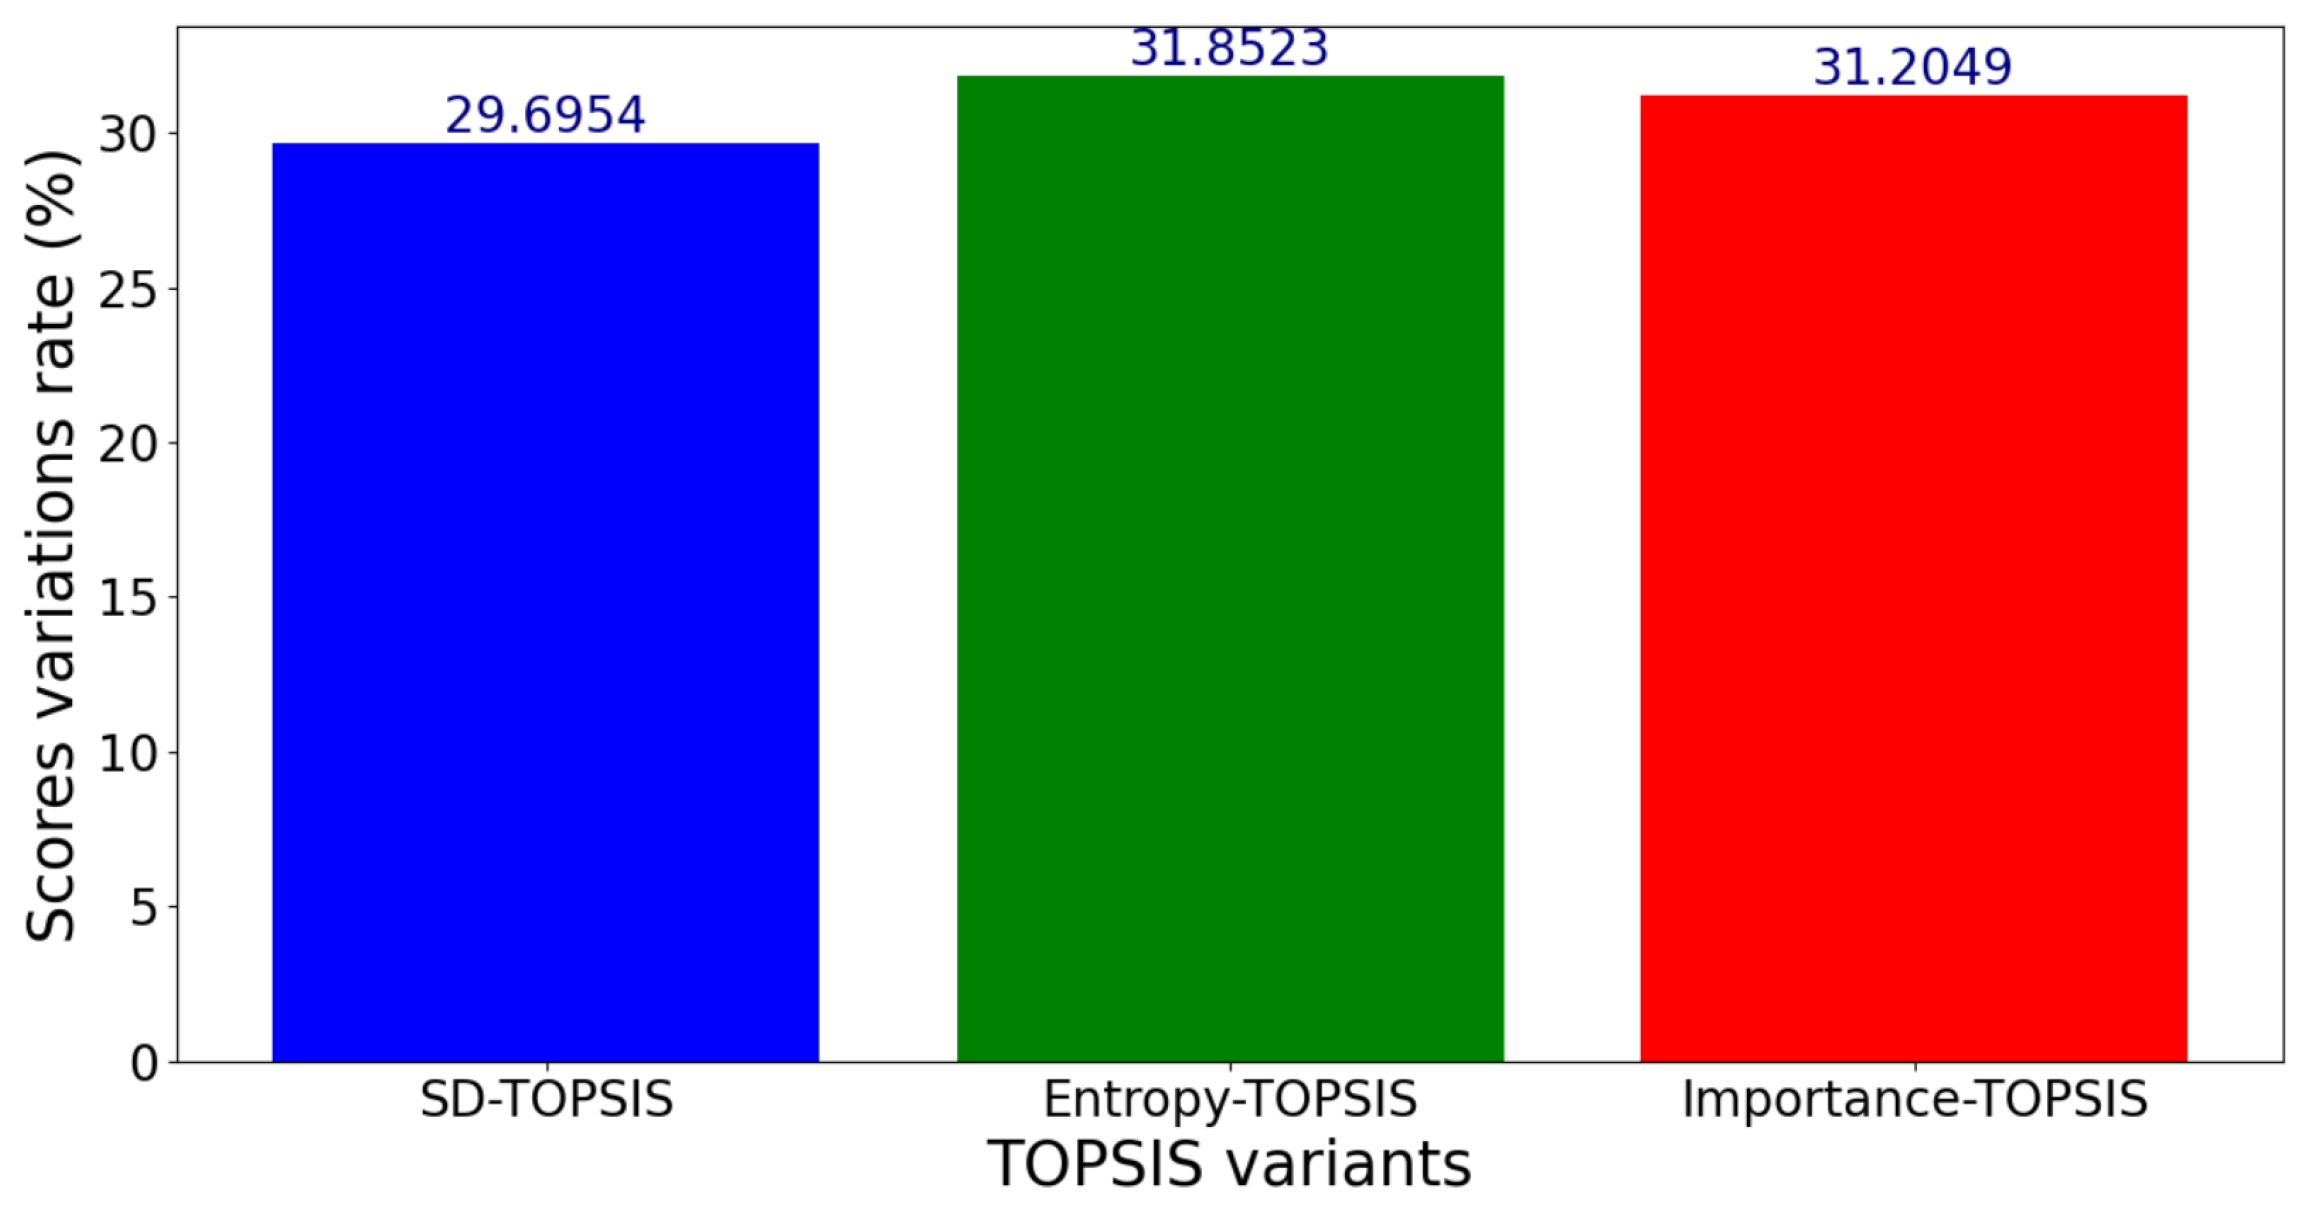
4.3.5. Scores Variation
4.3.6. Sensitivity Analysis
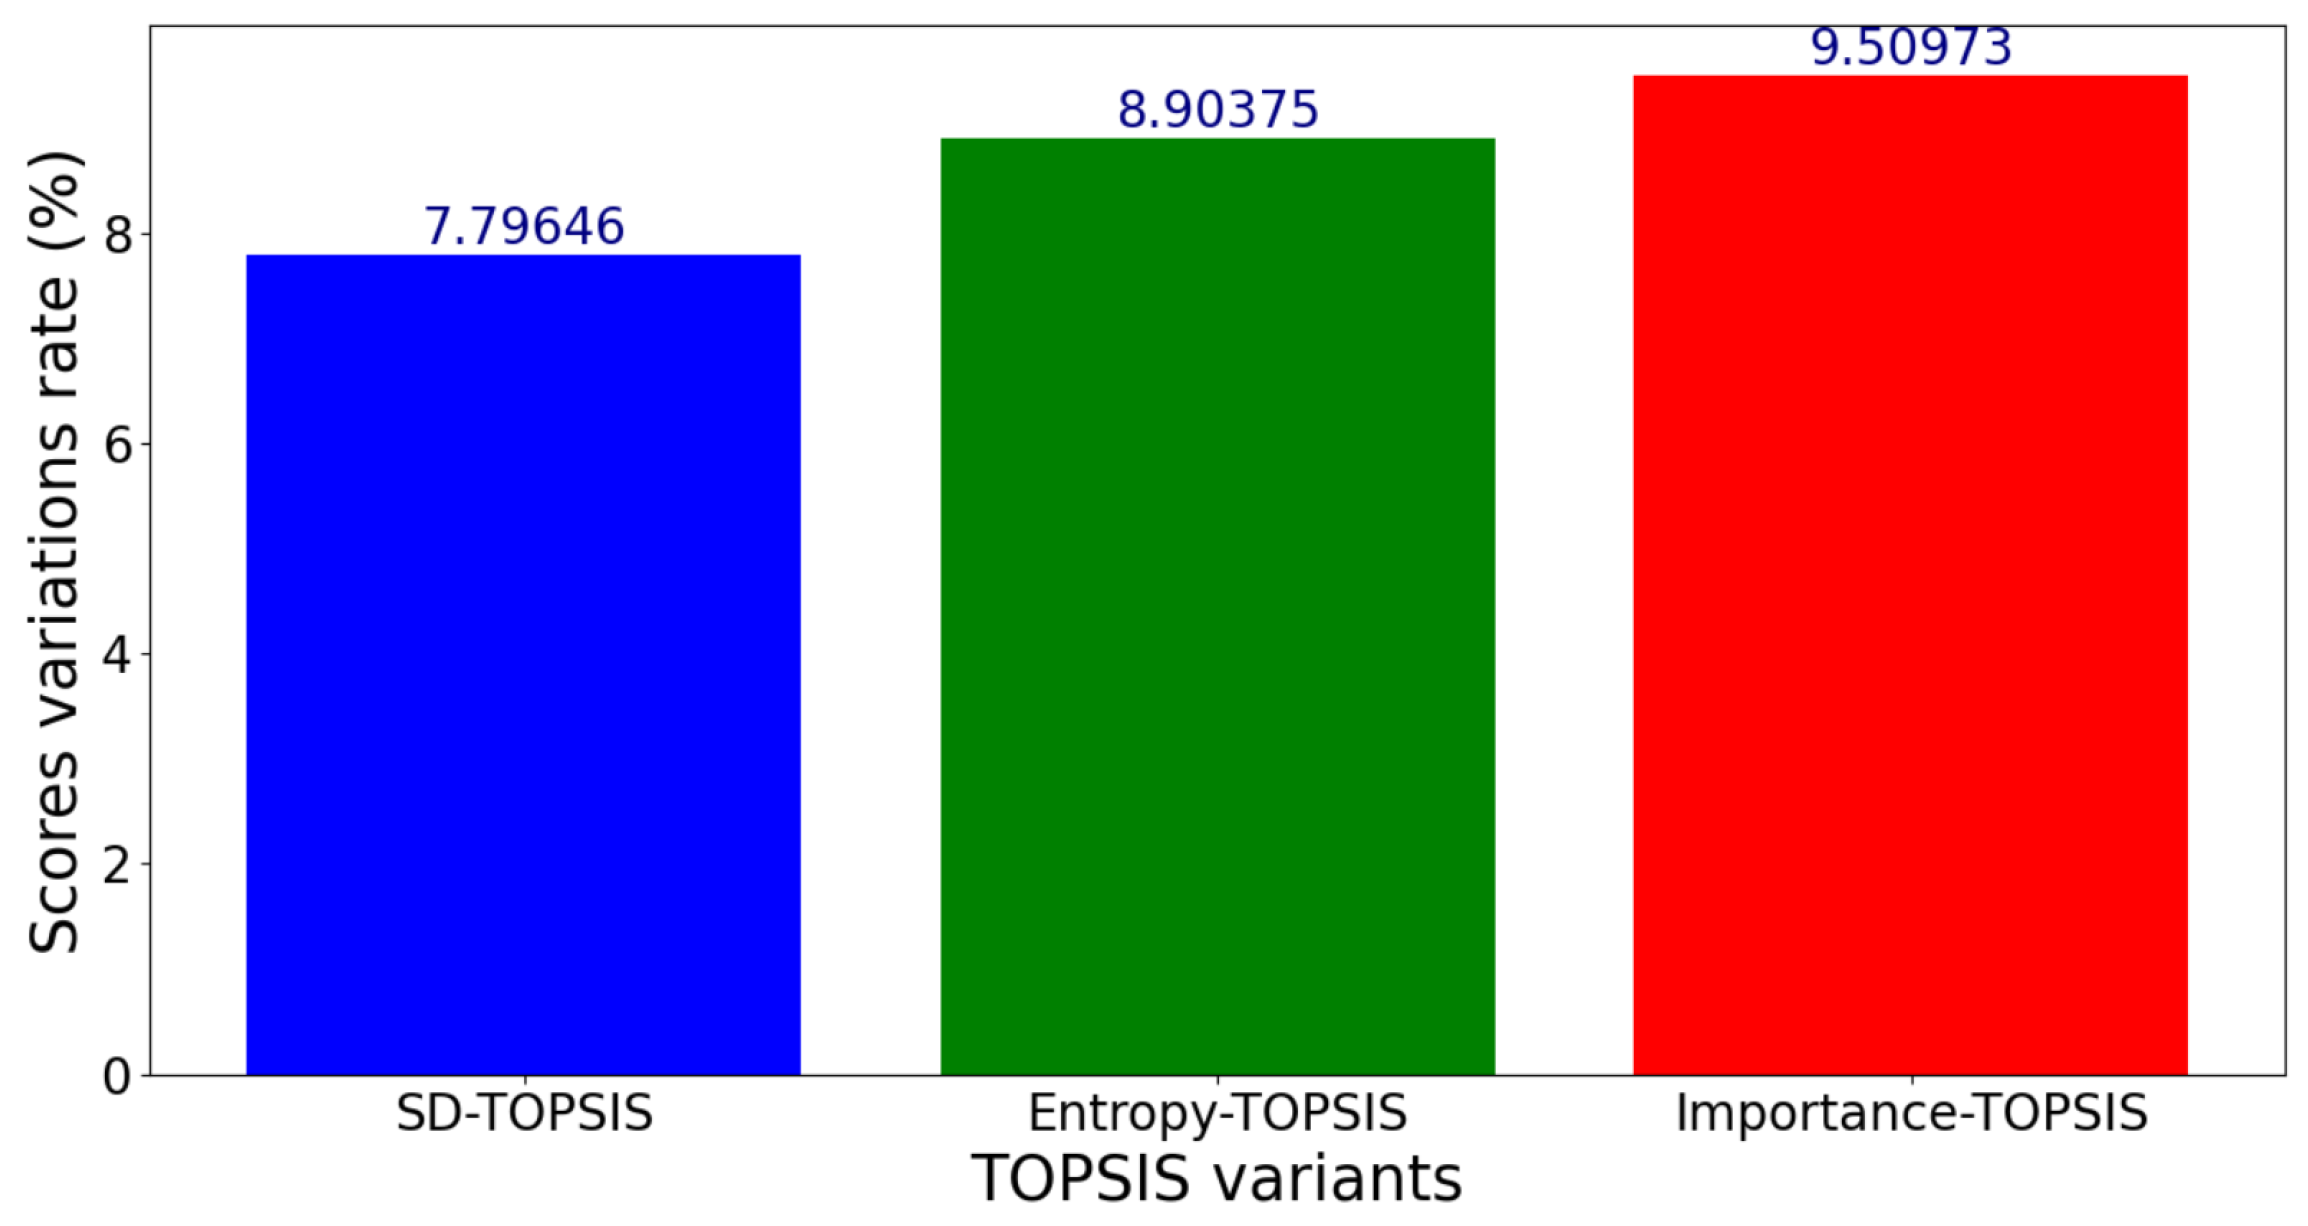
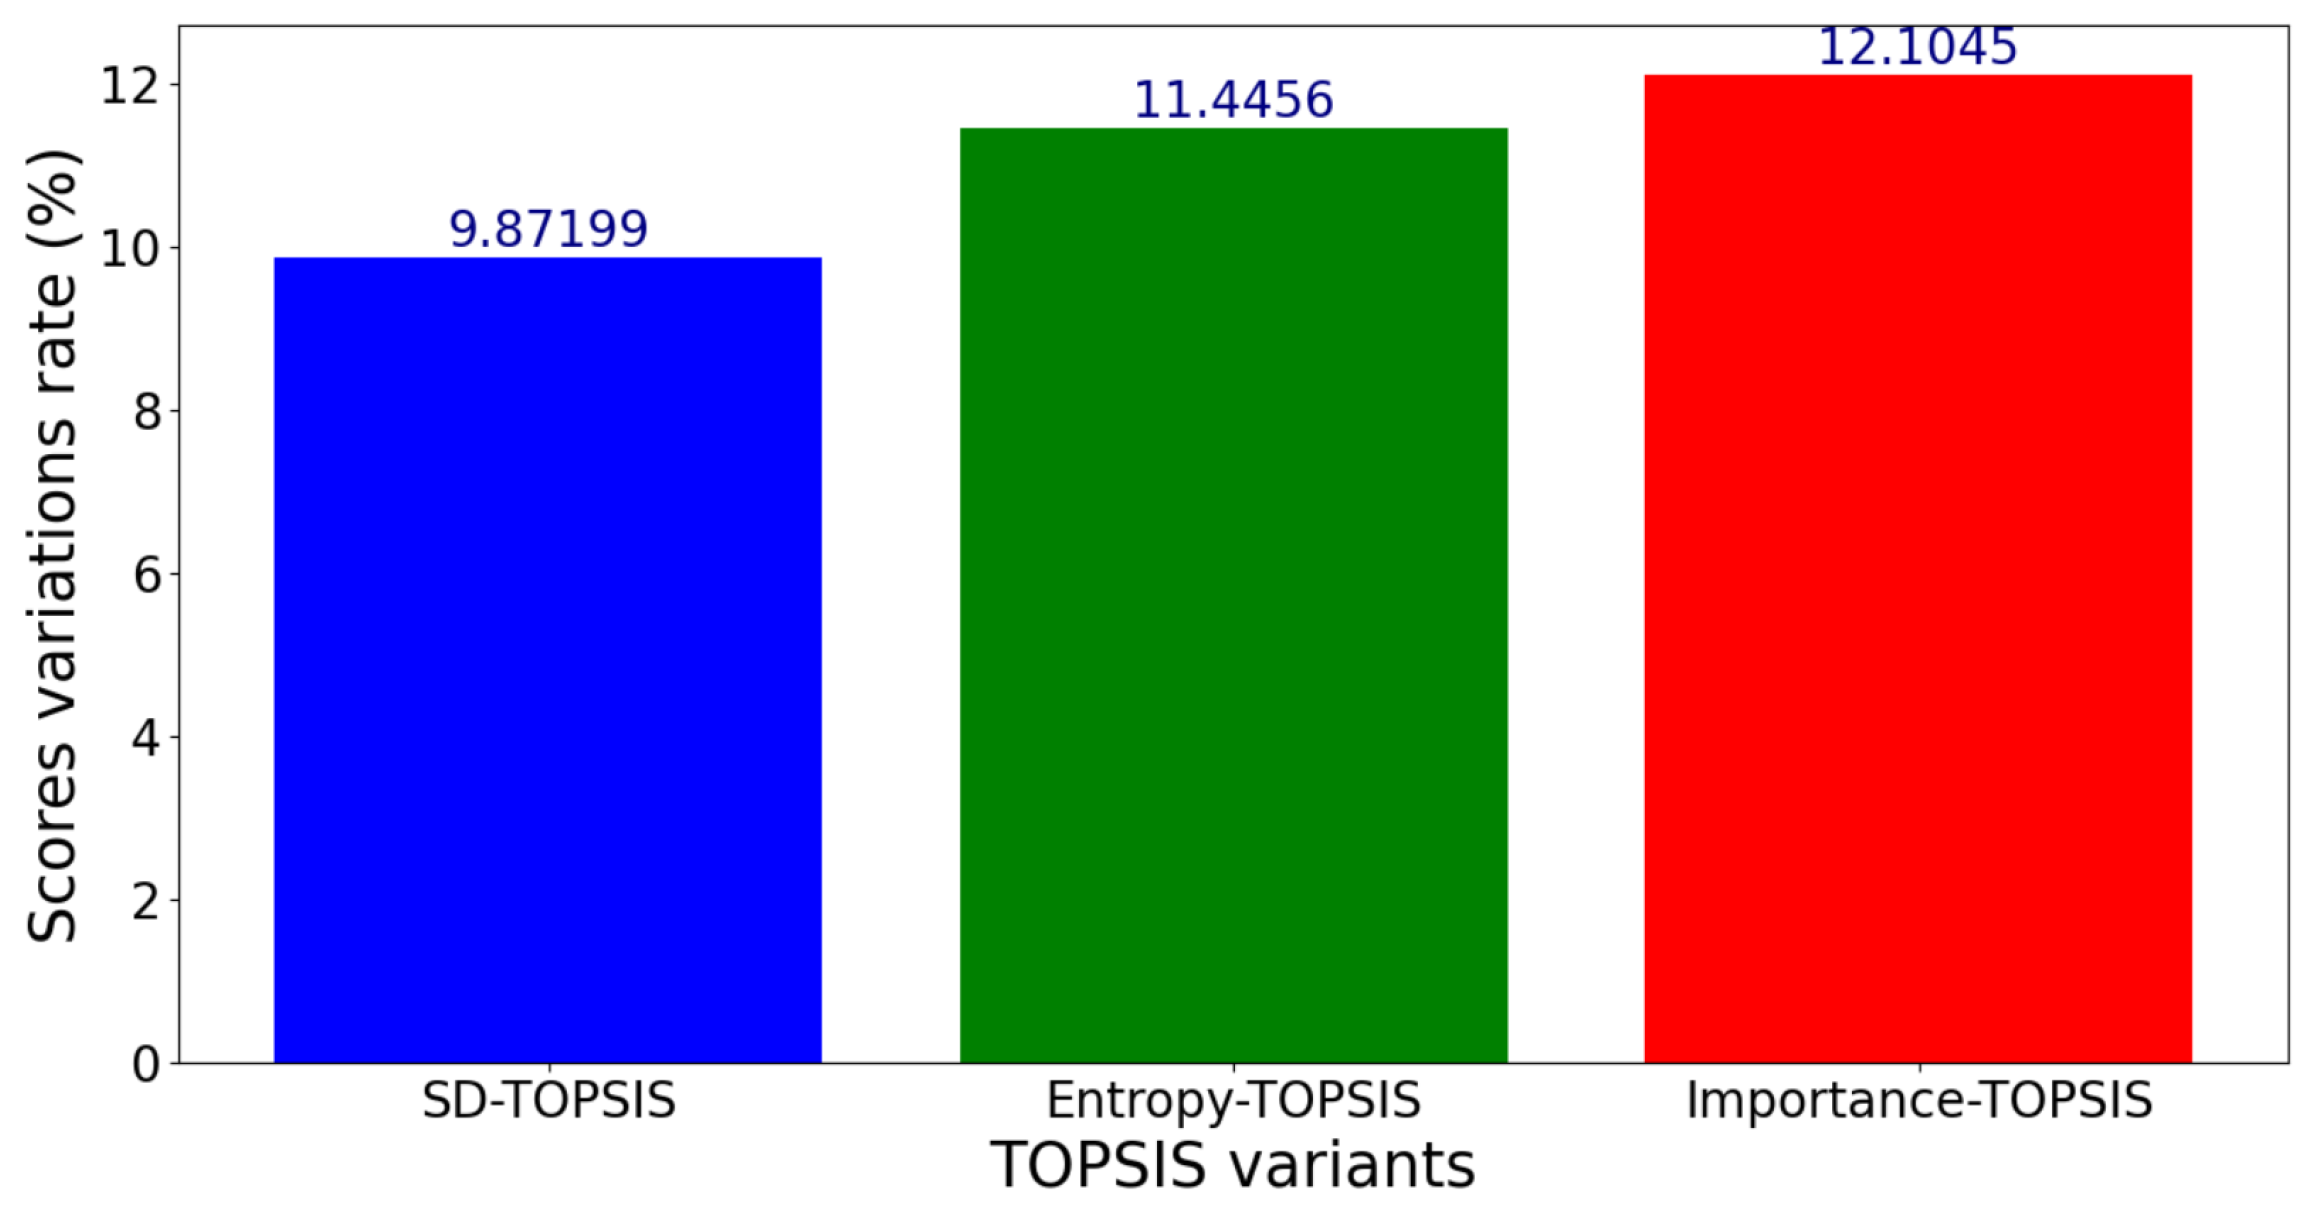
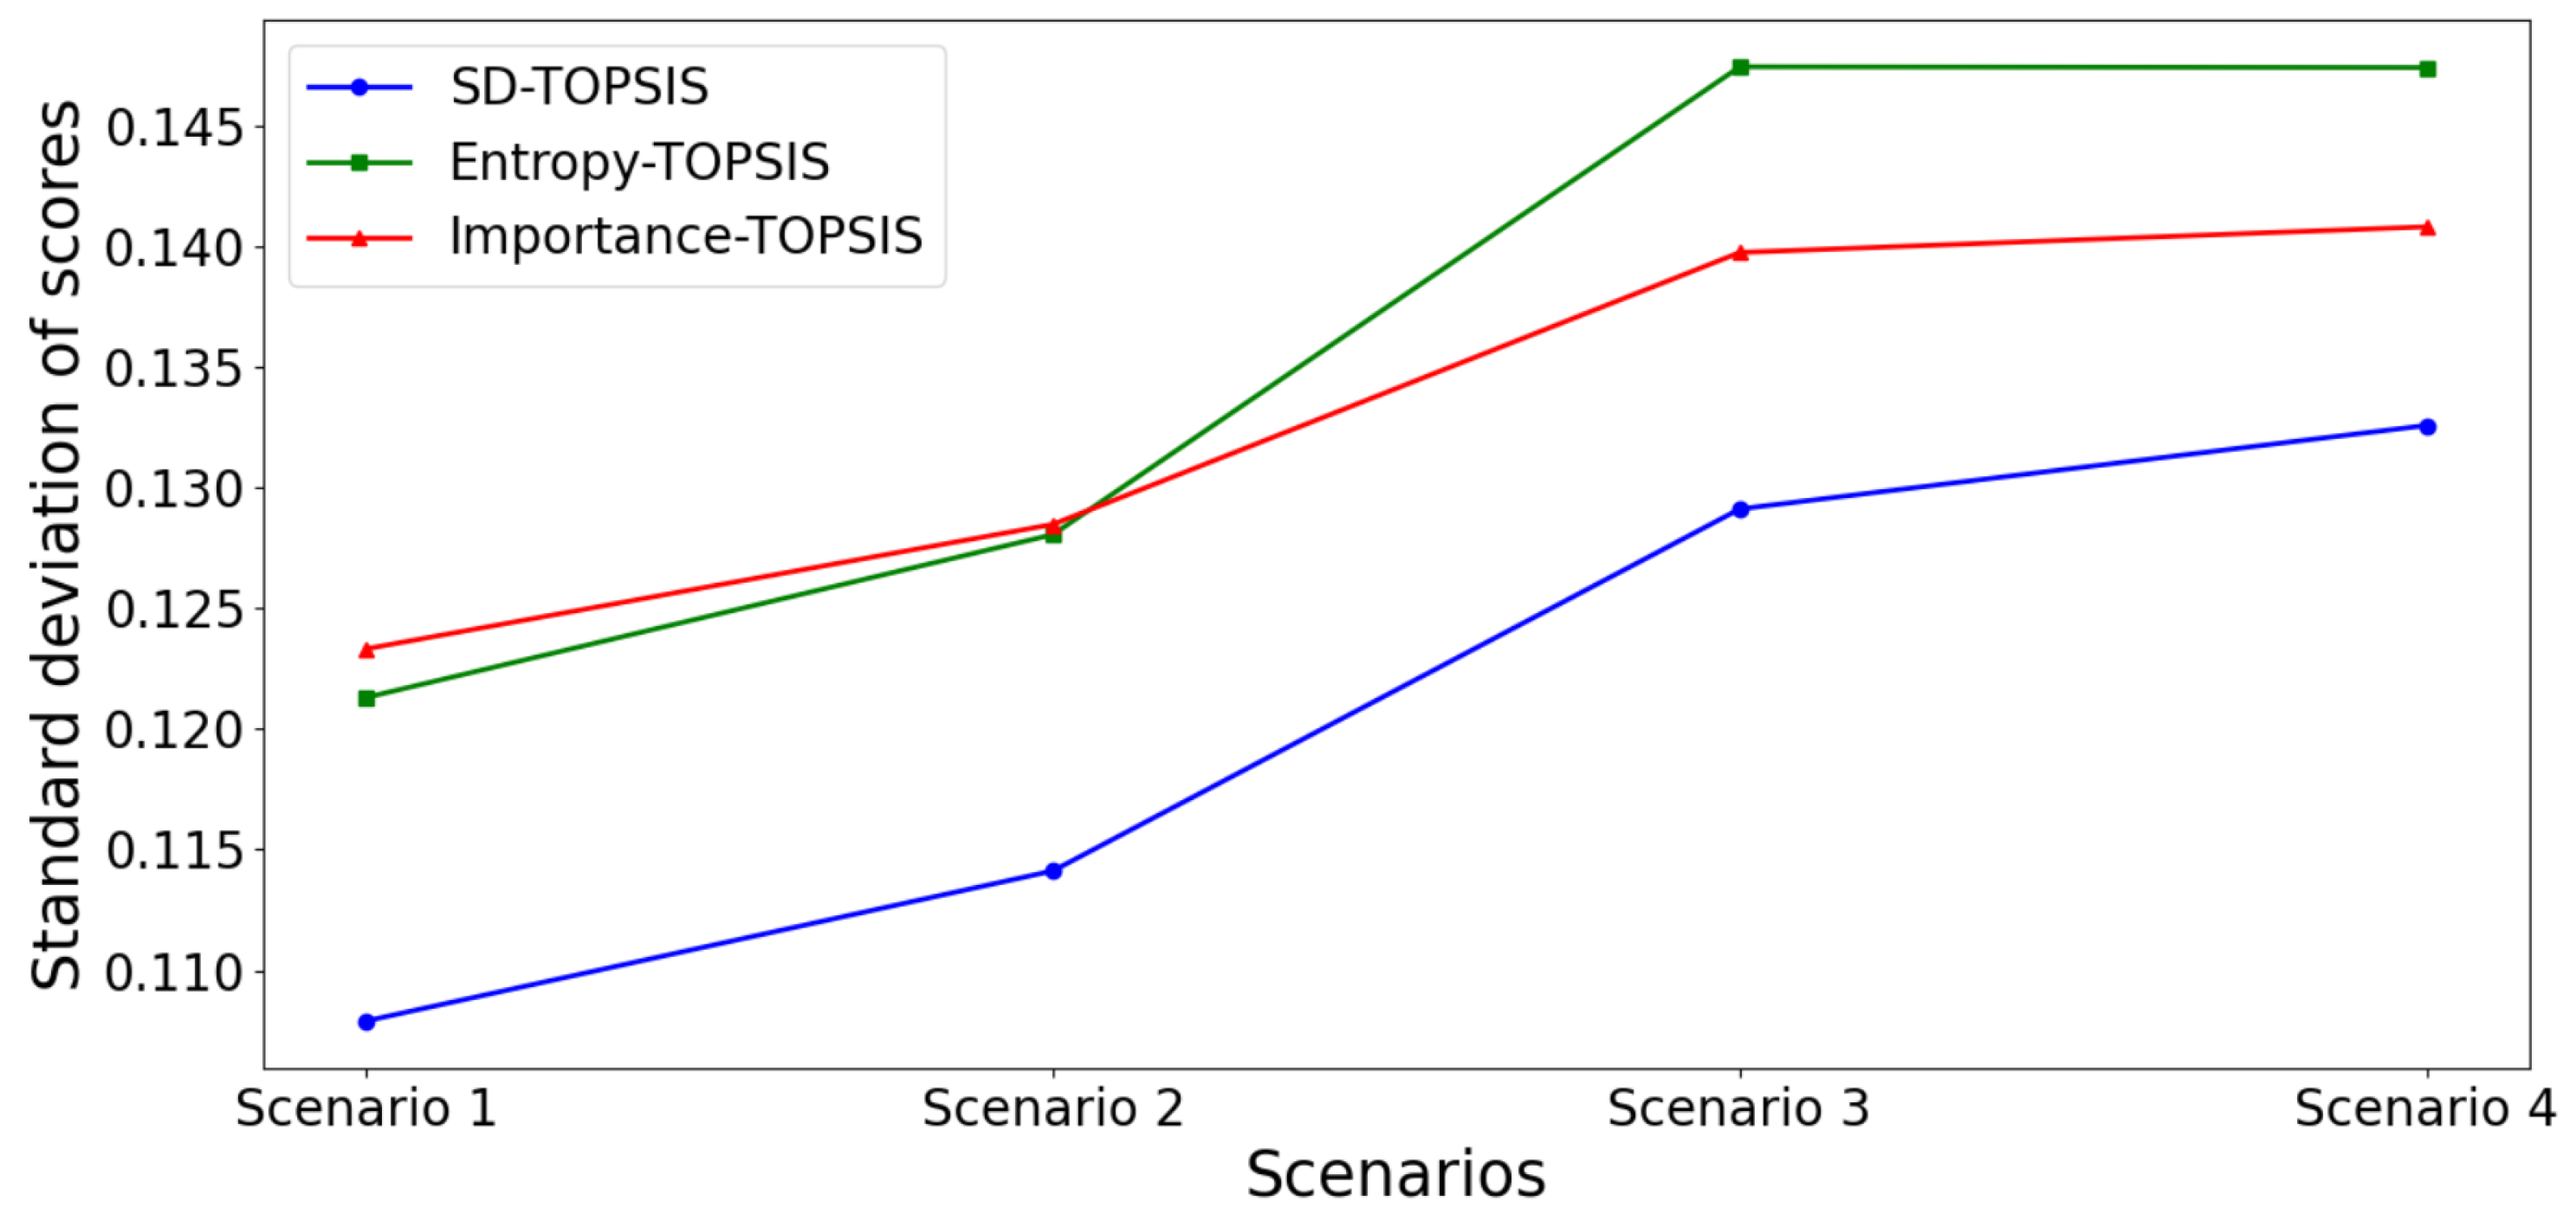
- Scenario 1: After variations in upload speed values, the standard deviations for SD-TOPSIS, Entropy-TOPSIS and Importance-TOPSIS are, respectively, 0.1078, 0.1213 and 0.1233.
- Scenario 2: After variations in download speed values in addition to those in upload speed, SD-TOPSIS has a standard deviation of 0.1141, Entropy-TOPSIS exhibits a standard deviation of 0.128, and Importance-TOPSIS reaches a standard deviation of 0.1284.
- Scenario 3: After variations in ping values in addition to those in upload speed and download speed, SD-TOPSIS has a standard deviation of 0.1291, Entropy-TOPSIS exhibits a standard deviation of 0.1474, and Importance-TOPSIS reaches a standard deviation of 0.1397.
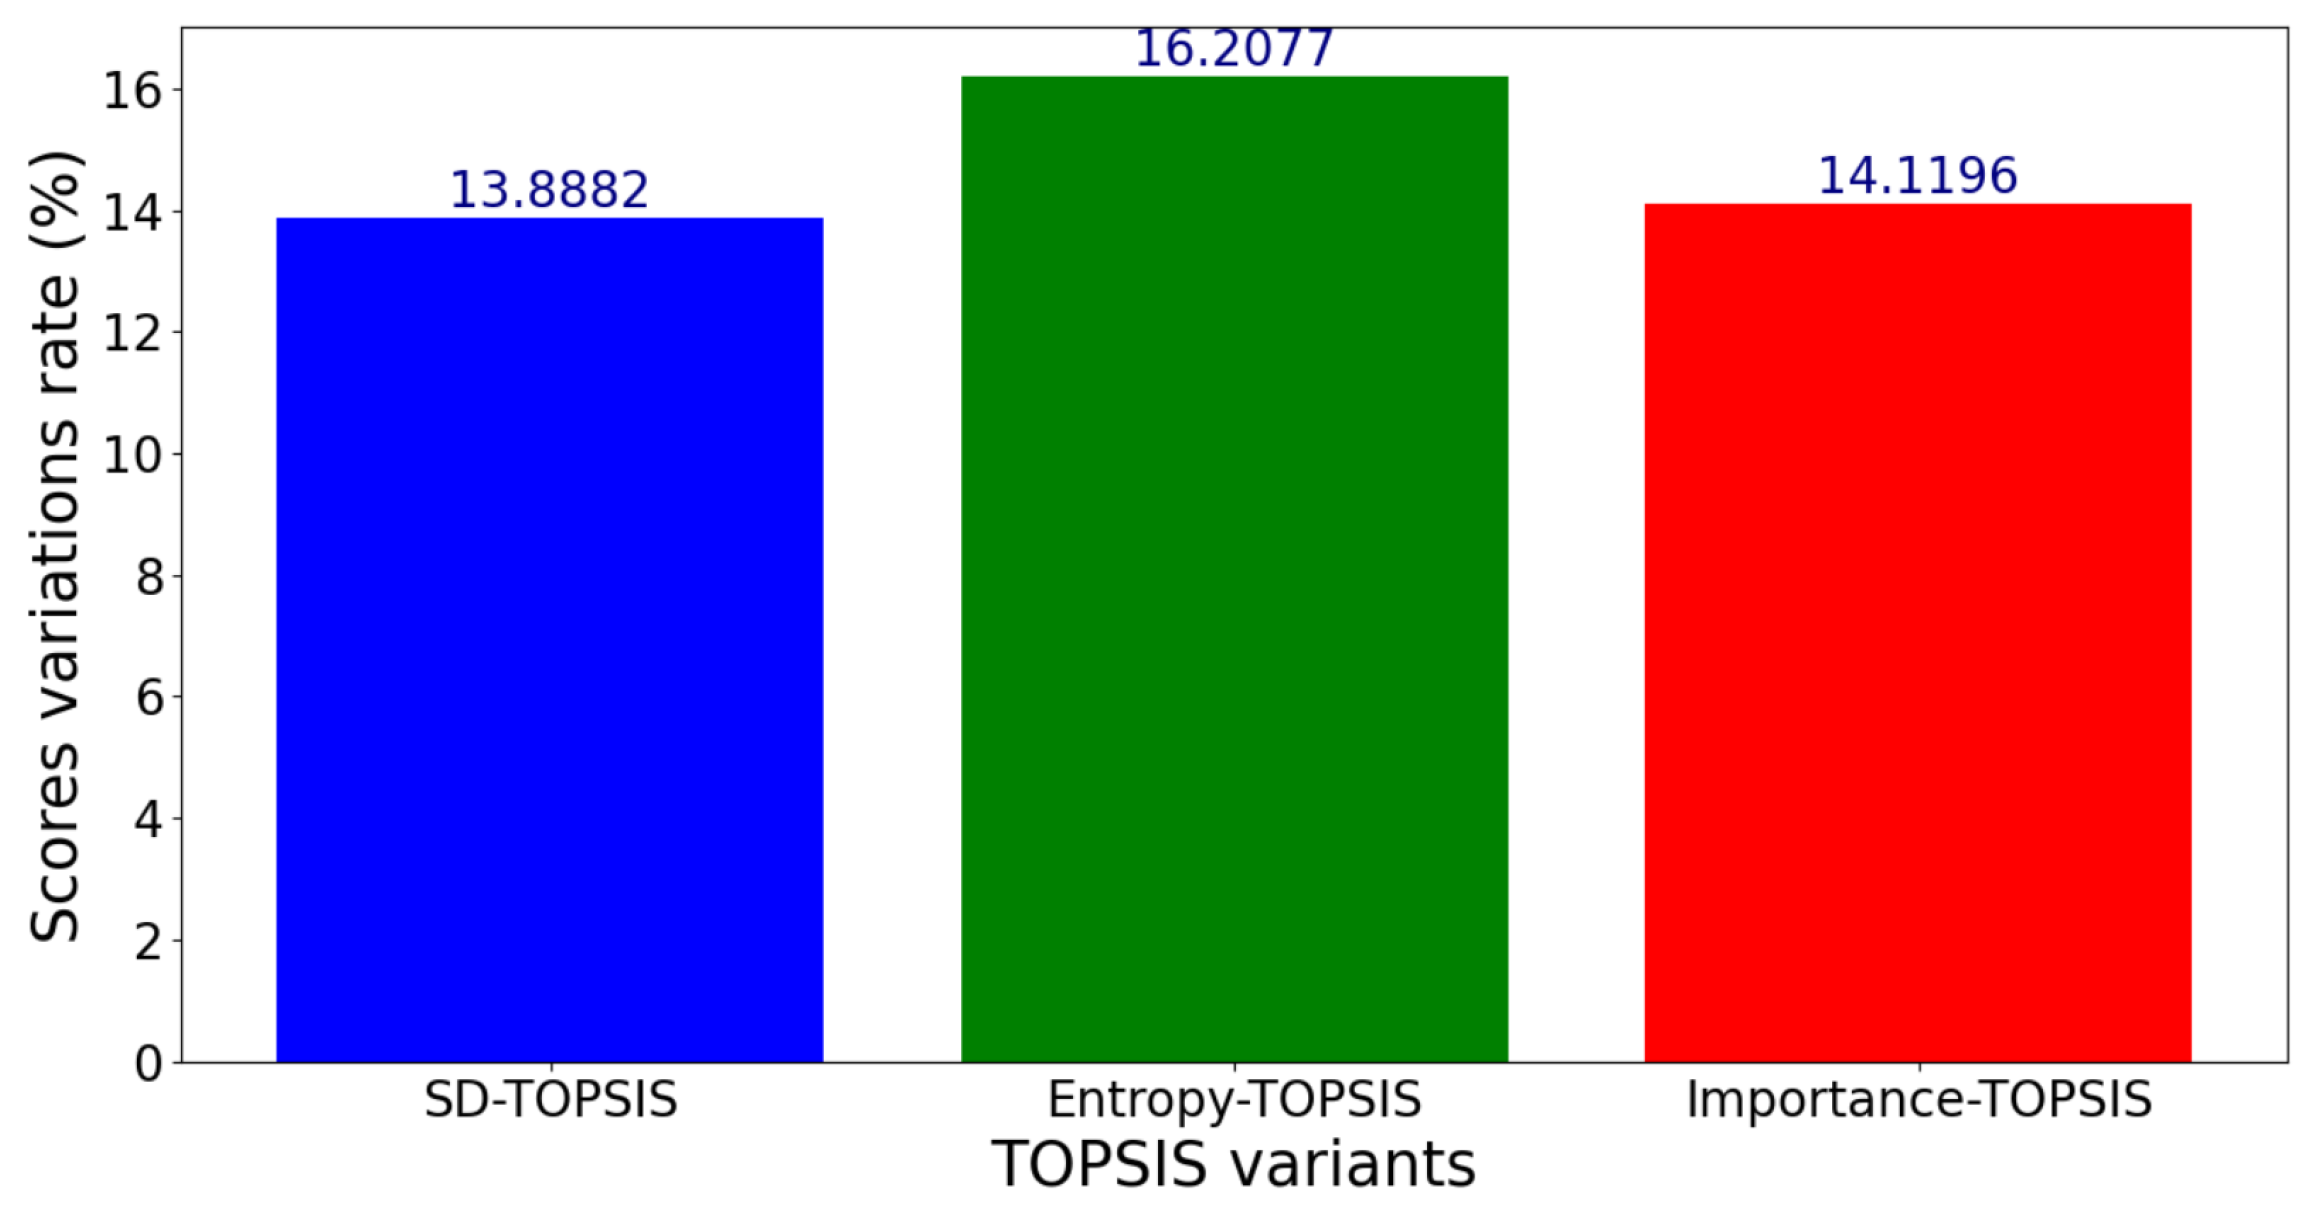
- Scenario 4: Following the variation in packet loss values in addition to upload speed, download speed, and ping, SD-TOPSIS remains the most stable algorithm, with a standard deviation of 0.1325, whereas Entropy-TOPSIS reaches 0.1474, and Importance-TOPSIS presents a standard deviation of to 0.1408 maintaining an intermediate position.
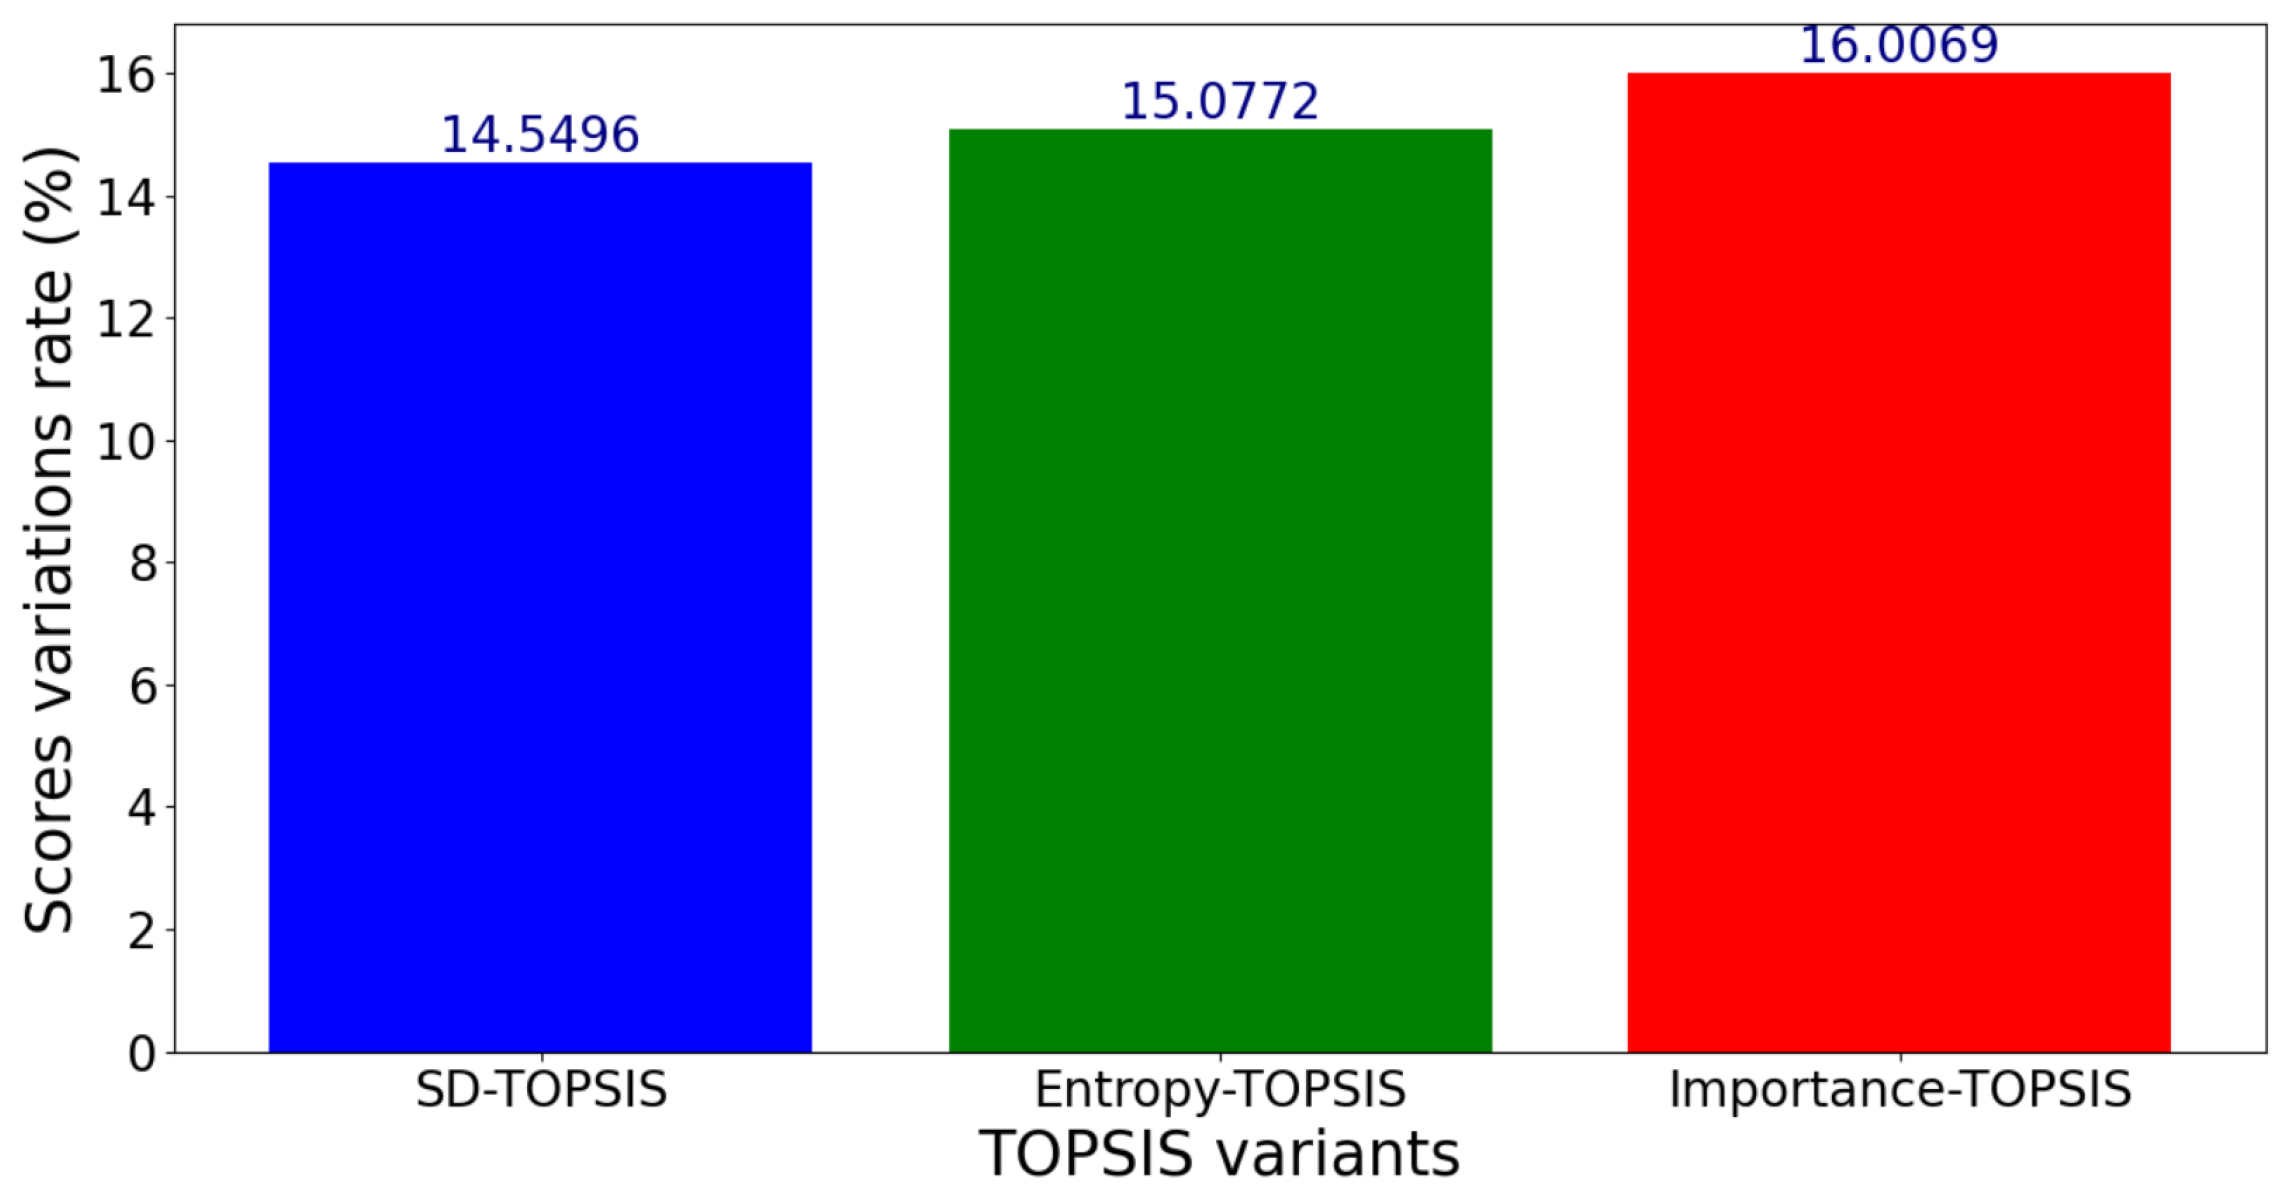
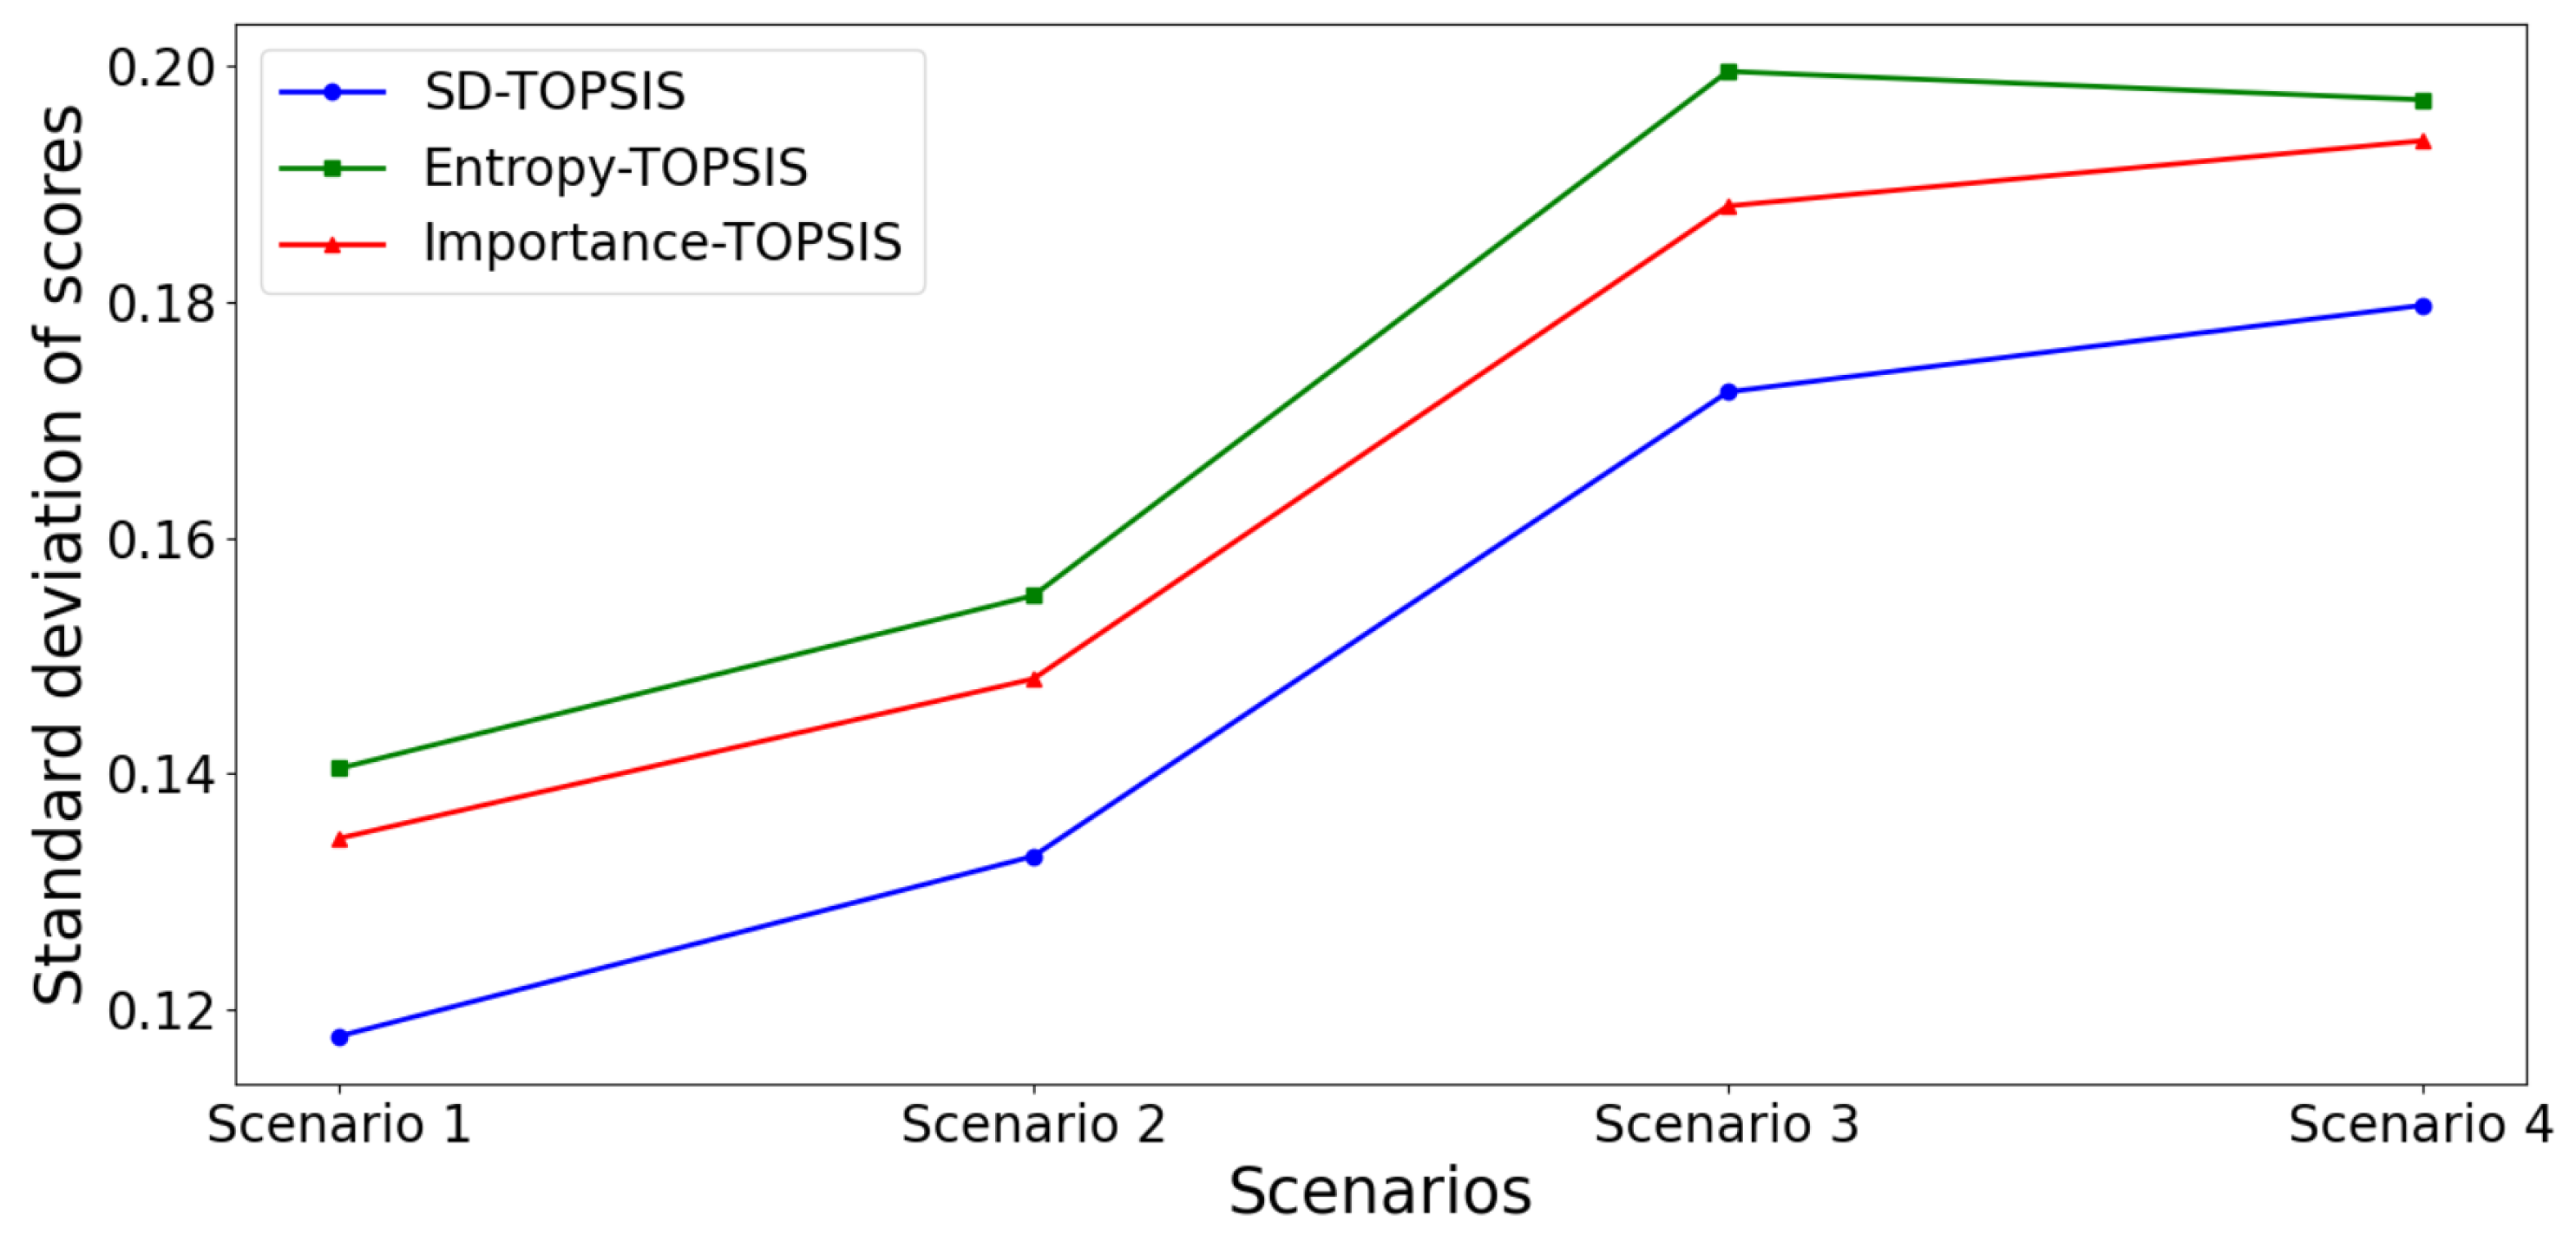
- Scenario 1: After variations in upload speed values, the standard deviations for SD-TOPSIS, Entropy-TOPSIS and Importance-TOPSIS are, respectively, 0.1177, 0.1404 and 0.1345.
- Scenario 2: After variations in download speed values in addition to those in upload speed, SD-TOPSIS has a standard deviation of 0.1329, Entropy-TOPSIS exhibits a standard deviation of 0.155, and Importance-TOPSIS reaches a standard deviation of 0.148.
- Scenario 3: After variations in ping values in addition to those in upload speed and download speed, SD-TOPSIS has a standard deviation of 0.1723, Entropy-TOPSIS exhibits a standard deviation of 0.1995, and Importance-TOPSIS reaches a standard deviation of 0.1881.
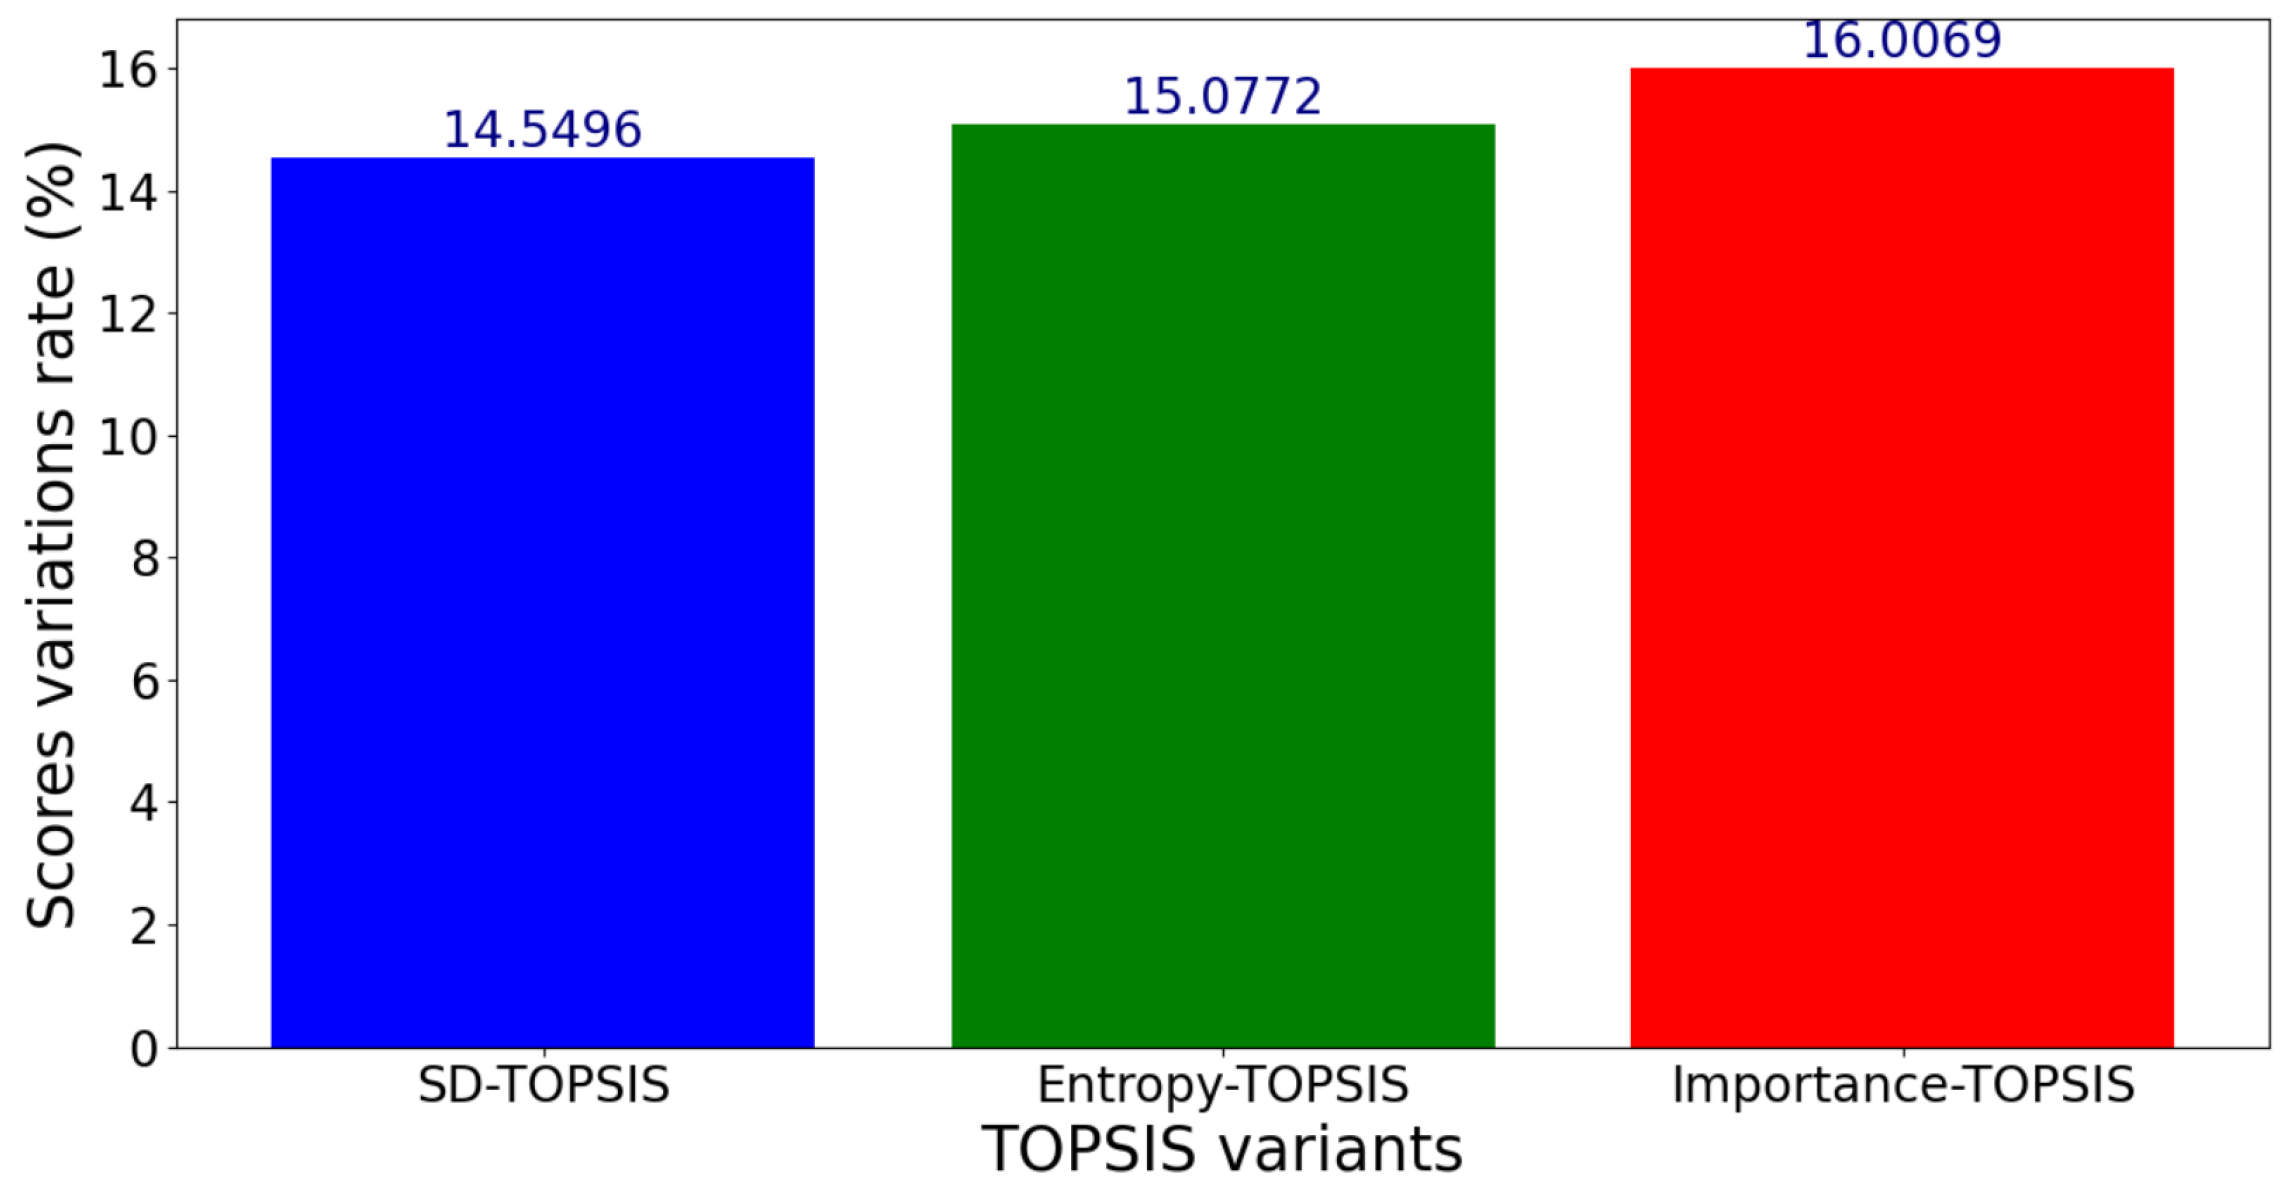
- Scenario 4: Following the variation in packet loss values in addition to upload speed, download speed, and ping, SD-TOPSIS remains the most stable algorithm, with a standard deviation of 0.1797, whereas Entropy-TOPSIS reaches 0.1971, and Importance-TOPSIS presents a standard deviation of to 0.1936 maintaining an intermediate position.
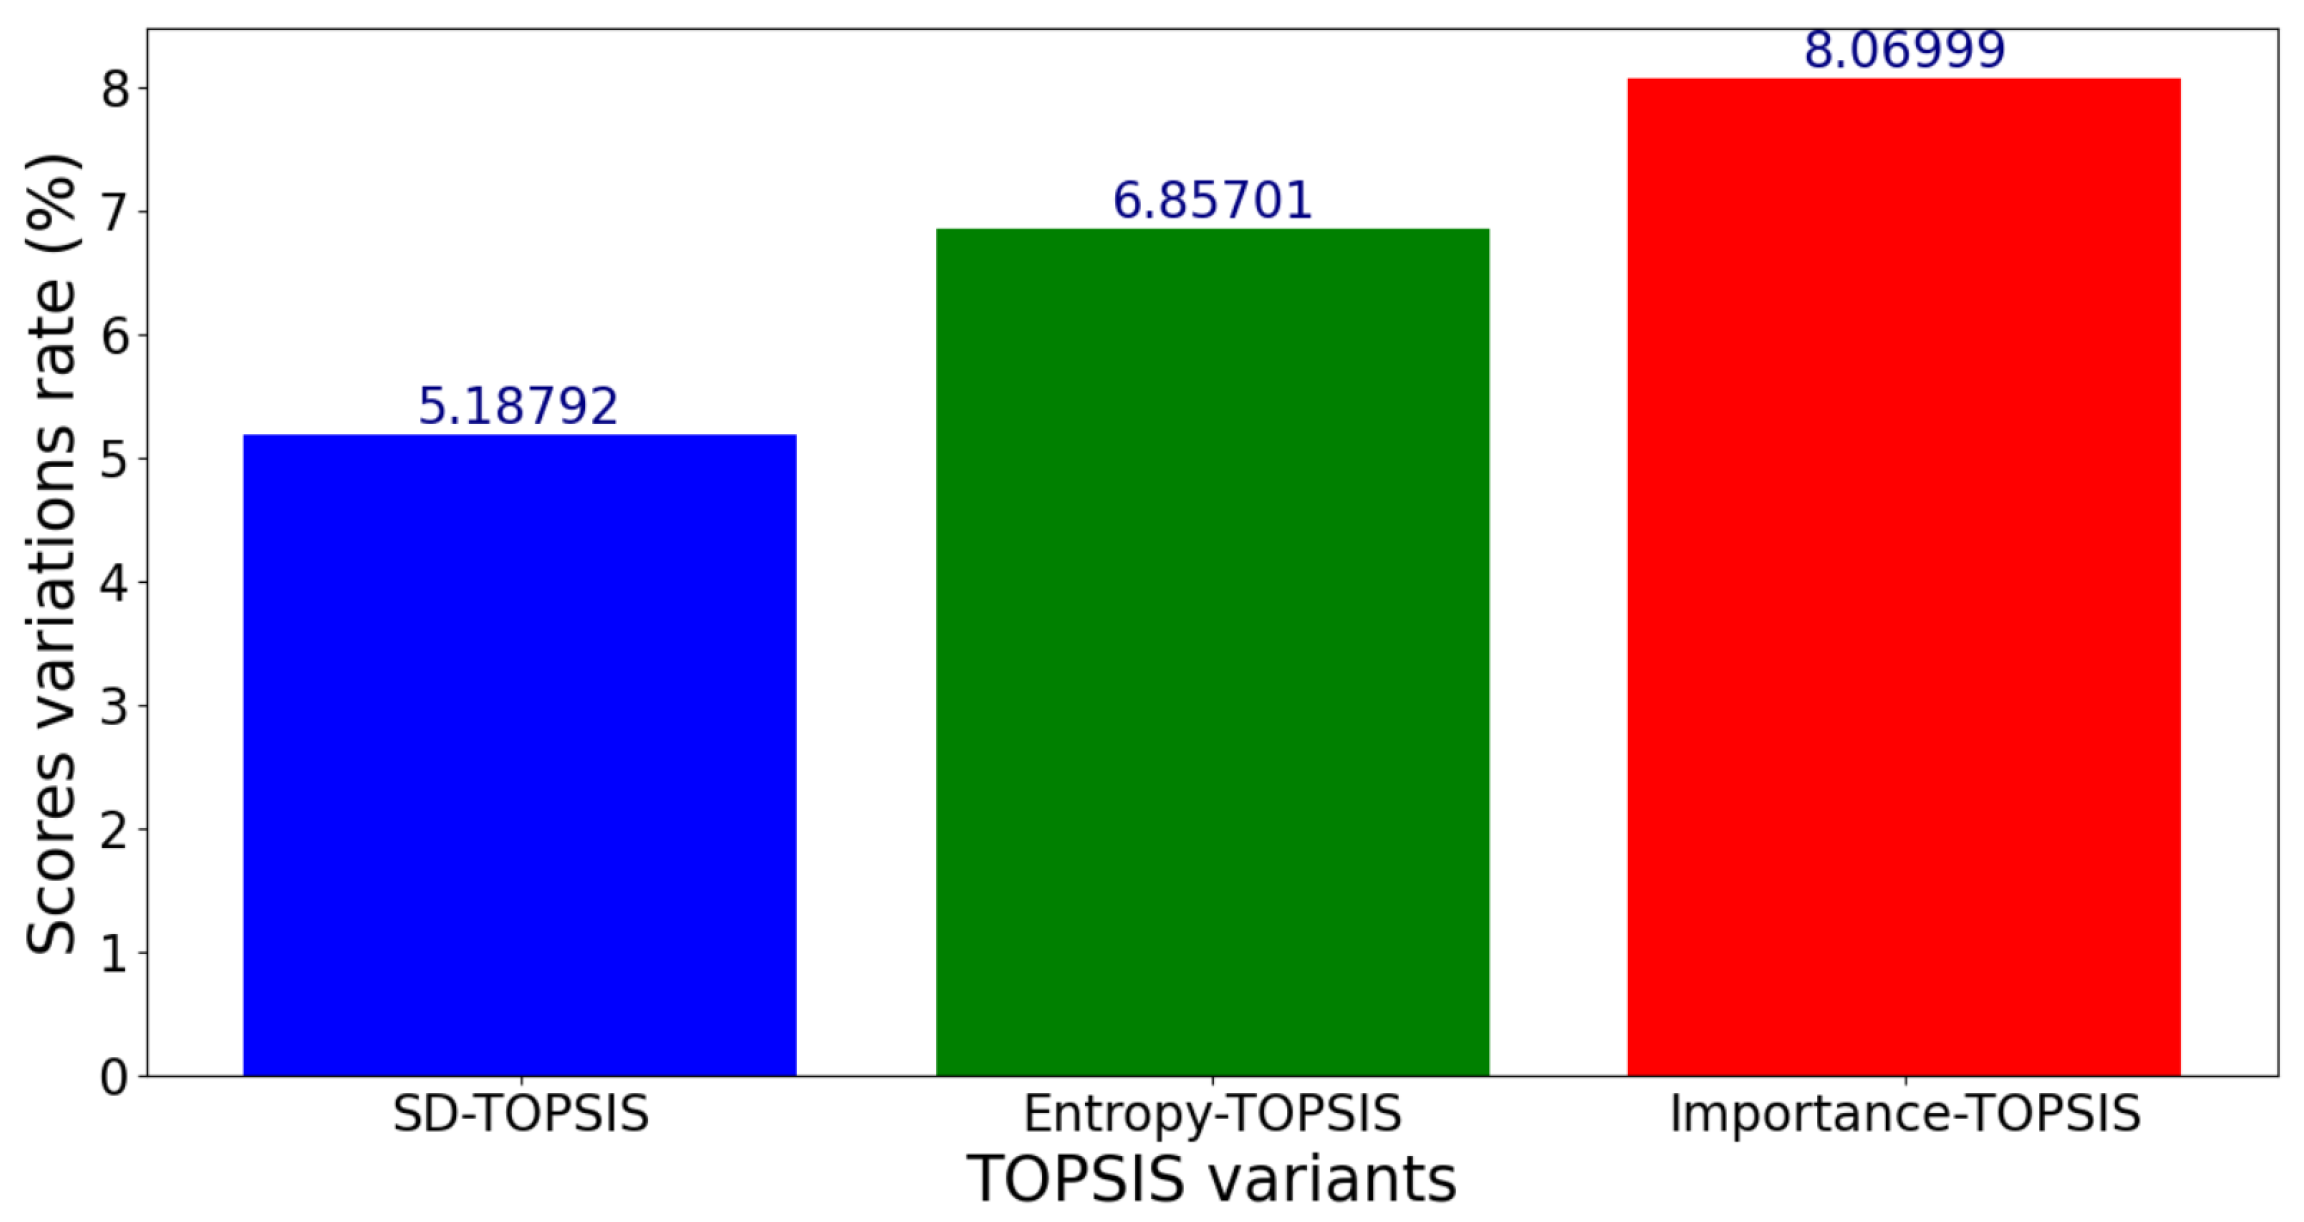
- SD-TOPSIS is the most stable algorithm, as its standard deviation remains the lowest in all four scenarios, meaning that it is less affected by small changes in criteria values.
- Entropy-TOPSIS is the most sensitive, exhibiting a continuous increase in standard deviation, which indicates a high variability in scores in response to small changes in criteria.
- Importance-TOPSIS falls in between SD-TOPSIS and Entropy-TOPSIS, with moderate variations in standard deviation, meaning intermediate stability.
5. Conclusions
Author Contributions
Funding
Institutional Review Board Statement
Informed Consent Statement
Data Availability Statement
Conflicts of Interest
References
- Jiang, W. Software defined satellite networks: A survey. Digit. Commun. Netw. 2023, 9, 1243–1264. [Google Scholar] [CrossRef]
- Baltaci, A.; Dinc, E.; Ozger, M.; Alabbasi, A.; Cavdar, C.; Schupke, D. A Survey of Wireless Networks for Future Aerial Communications (FACOM). IEEE Commun. Surv. Tutor. 2021, 23, 2833–2884. [Google Scholar] [CrossRef]
- Li, Y.; Wei, H.; Li, L.; Han, Y.; Zhou, J.; Zhou, W. An Extensible Multi-Layer Architecture Model Based on LEO-MSS and Performance Analysis. In Proceedings of the 2019 IEEE 90th Vehicular Technology Conference (VTC2019-Fall), Honolulu, HI, USA, 22–25 September 2019; pp. 1–6. [Google Scholar]
- Song, H.; Liu, S.; Hu, X.; Li, X.; Wang, W. Load Balancing and QoS Supporting Access and Handover Decision algorithm for GEO/LEO Heterogeneous Satellite Networks. In Proceedings of the 2018 IEEE 4th International Conference on Computer and Communications (ICCC), Chengdu, China, 7–10 December 2018; pp. 640–645. [Google Scholar] [CrossRef]
- Li, J.; Xue, K.; Liu, J.; Zhang, Y. A User-Centric Handover Scheme for Ultra-Dense LEO Satellite Networks. IEEE Wirel. Commun. Lett. 2020, 9, 1904–1908. [Google Scholar] [CrossRef]
- Lahby, M.; Sekkaki, A. Optimal vertical handover based on TOPSIS algorithm and utility function in heterogeneous wireless networks. In Proceedings of the 2017 International Symposium on Networks, Computers and Communications (ISNCC), Marrakech, Morocco, 16–18 May 2017; pp. 1–6. [Google Scholar] [CrossRef]
- Zhang, L.; Wu, S.; Lv, X.; Jiao, J. A Two-Step Handover Strategy for GEO/LEO Heterogeneous Satellite Networks Based on Multi-Attribute Decision Making. Electronics 2022, 11, 795. [Google Scholar] [CrossRef]
- Radulescu, C.Z.; Radulescu, M. A Hybrid Group Multi-Criteria Approach Based on SAW, TOPSIS, VIKOR, and COPRAS Methods for Complex IoT Selection Problems. Electronics 2024, 13, 789. [Google Scholar] [CrossRef]
- Stanic, I.; Drajic, D.; Cica, Z. Overview of Network Selection and Vertical Handover Approaches and Simulation Tools in Heterogeneous Wireless Networks. In Proceedings of the 2023 16th International Conference on Advanced Technologies, Systems and Services in Telecommunications (TELSIKS), Nis, Serbia, 25–27 October 2023; pp. 133–142. [Google Scholar] [CrossRef]
- Alhabo, M.; Zhang, L. Multi-Criteria Handover Using Modified Weighted TOPSIS Methods for Heterogeneous Networks. IEEE Access 2018, 6, 40547–40558. [Google Scholar] [CrossRef]
- Laniewski, D.; Lanfer, E.; Beginn, S.; Dunker, J.; Dückers, M.; Aschenbruck, N. Starlink on the Road: A First Look at Mobile Starlink Performance in Central Europe. In Proceedings of the 2024 8th Network Traffic Measurement and Analysis Conference (TMA), Dresden, Germany, 21–24 May 2024; IEEE: Piscataway, NJ, USA, 2024; pp. 1–8. [Google Scholar] [CrossRef]
- Lahby, M.; Attioui, A.; Sekkaki, A. An Optimized Vertical Handover Approach Based on M-ANP and TOPSIS in Heterogeneous Wireless Networks; Springer: Singapore, 2017; Volume 397, pp. 15–29. [Google Scholar] [CrossRef]
- Liu, J.; Xie, M.; Chen, S.; Xu, G.; Wu, T.; Li, W. TS-REPLICA: A novel replica placement algorithm based on the entropy weight TOPSIS method in spark for multimedia data analysis. Inf. Sci. 2023, 626, 133–148. [Google Scholar] [CrossRef]
- Miao, J.; Wang, P.; Yin, H.; Chen, N.; Wang, X. A Multi-attribute Decision Handover Scheme for LEO Mobile Satellite Networks. In Proceedings of the 2019 IEEE 5th International Conference on Computer and Communications (ICCC), Chengdu, China, 6–9 December 2019; pp. 938–942. [Google Scholar] [CrossRef]
- Goutam, S.; Unnikrishnan, S.; Karandikar, A. Algorithm for Vertical Handover using Multi Attribute Decision Making Techniques. In Proceedings of the 2020 IEEE International Conference on Communication, Networks and Satellite (Comnetsat), Batam, Indonesia, 17–18 December 2020; pp. 306–313. [Google Scholar] [CrossRef]
- Adiat, K.A.N.; Kolawole, A.O.; Adeyemo, I.A.; Akinlalu, A.A.; Afolabi, D.O. Assessment of groundwater resources from geophysical and remote sensing data in a basement complex environment using fuzzy-topsis algorithm. Results Earth Sci. 2024, 2, 100034. [Google Scholar] [CrossRef]
- Tabatabaei, S. A new model for evaluating the impact of organizational culture variables on the success of knowledge management in organizations using the TOPSIS multi-criteria algorithm: Case study. Comput. Hum. Behav. Rep. 2024, 14, 100417. [Google Scholar] [CrossRef]
- Kumar, K.; Prakash, A.; Tripathi, R. Spectrum handoff scheme with multiple attributes decision making for optimal network selection in cognitive radio networks. Digit. Commun. Netw. 2017, 3, 164–175. [Google Scholar] [CrossRef]
- Bhatia, M.; Kumar, K. Network selection in cognitive radio enabled Wireless Body Area Networks. Digit. Commun. Netw. 2020, 6, 75–85. [Google Scholar] [CrossRef]
- Ezhilarasan, N.; Vijayalakshmi, C. Optimization of Fuzzy programming with TOPSIS algorithm. Procedia Comput. Sci. 2020, 172, 473–479. [Google Scholar] [CrossRef]
- Hajduk, S.; Jelonek, D. A Decision-Making Approach Based on TOPSIS Method for Ranking Smart Cities in the Context of Urban Energy. Energies 2021, 14, 2691. [Google Scholar] [CrossRef]
- Ismail, A.; Hee Roh, B. Adaptive Handovers in heterogeneous networks using fuzzy MADM. In Proceedings of the International Conference on Mobile IT Convergence, Gumi, Republic of Korea, 26–28 September 2011; pp. 99–104. [Google Scholar]
- Mansouri, M.; Leghris, C.; Bekkhoucha, A. Towards a better combination of the MADM algorithms for the Vertical Handover optimization in a mobile network multi-access environment. In Proceedings of the 2015 10th International Conference on Intelligent Systems: Theories and Applications (SITA), Rabat, Morocco, 20–21 October 2015; pp. 1–5. [Google Scholar] [CrossRef]
- Mansouri, M.; Leghris, C. The use of MADM methods in the vertical handover decision making context. In Proceedings of the 2017 International Conference on Wireless Networks and Mobile Communications (WINCOM), Rabat, Morocco, 1–4 November 2017; pp. 1–6. [Google Scholar] [CrossRef]
- Almutairi, A.F.; Landolsi, M.A.; Al-Hawaj, A.O. Weighting Selection in GRA-based MADM for Vertical Handover in Wireless Networks. In Proceedings of the 2016 UKSim-AMSS 18th International Conference on Computer Modelling and Simulation (UKSim), Cambridge, UK, 6–8 April 2016; pp. 331–336. [Google Scholar] [CrossRef]
- Ipaye, A.A.A.; Ibrahim, A.M.A.; Ahmed, I.I.O.; Nagar, S.A.; Mitropoulos, D.N.G. Mathematical Model Implementation of Vertical Handover Network Decision Algorithms in Heterogeneous Network Based On QoS Parameters. In Proceedings of the 2018 International Conference on Computer, Control, Electrical, and Electronics Engineering (ICCCEEE), Khartoum, Sudan, 12–14 August 2018; pp. 1–6. [Google Scholar] [CrossRef]
- Madi, E.N.; Zakaria, Z.A.; Sambas, A.; Sukono. Toward Effective Uncertainty Management in Decision-Making Models Based on Type-2 Fuzzy TOPSIS. Mathematics 2023, 11, 3512. [Google Scholar] [CrossRef]
- Wang, A.; Sun, L.; Liu, J. An Innovative TOPSIS–Mahalanobis Distance Approach to Comprehensive Spatial Prioritization Based on Multi-Dimensional Drought Indicators. Atmosphere 2024, 15, 1347. [Google Scholar] [CrossRef]
- Mansouri, M.; Leghris, C. A battery level aware MADM combination for the vertical handover decision making. In Proceedings of the 2017 13th International Wireless Communications and Mobile Computing Conference (IWCMC), Valencia, Spain, 26–30 June 2017; pp. 1448–1452. [Google Scholar] [CrossRef]
- Shih, H.S. TOPSIS Variants. In TOPSIS and Its Extensions: A Distance-Based MCDM Approach; Springer International Publishing: Cham, Switzerland, 2022; pp. 33–79. [Google Scholar] [CrossRef]
- Zhang, W. Handover decision using fuzzy MADM in heterogeneous networks. In Proceedings of the 2004 IEEE Wireless Communications and Networking Conference (IEEE Cat. No. 04TH8733), Atlanta, GA, USA, 21–25 March 2004; Volume 2, pp. 653–658. [Google Scholar] [CrossRef]
- Ben Zineb, A.; Ayadi, M.; Tabbane, S. Fuzzy MADM based vertical handover algorithm for enhancing network performances. In Proceedings of the 2015 23rd International Conference on Software, Telecommunications and Computer Networks (SoftCOM), Split, Croatia, 16–18 September 2015; pp. 153–159. [Google Scholar] [CrossRef]
- Rahman, S.; Alali, A.S.; Baro, N.; Ali, S.; Kakati, P. A Novel TOPSIS Framework for Multi-Criteria Decision Making with Random Hypergraphs: Enhancing Decision Processes. Symmetry 2024, 16, 1602. [Google Scholar] [CrossRef]
- Nilashi, M.; Mardani, A.; Liao, H.; Ahmadi, H.; Manaf, A.A.; Almukadi, W. A Hybrid Method with TOPSIS and Machine Learning Techniques for Sustainable Development of Green Hotels Considering Online Reviews. Sustainability 2019, 11, 6013. [Google Scholar] [CrossRef]
- Corrente, S.; Tasiou, M. A robust TOPSIS method for decision making problems with hierarchical and non-monotonic criteria. Expert Syst. Appl. 2023, 214, 119045. [Google Scholar] [CrossRef]
- Bazrafkan, A.; Pakravan, M.R. An MADM network selection approach for next generation heterogeneous networks. In Proceedings of the 2017 Iranian Conference on Electrical Engineering (ICEE), Tehran, Iran, 2–4 May 2017; pp. 1884–1890. [Google Scholar] [CrossRef]
- Alinezhad, A.; Amini, A. Sensitivity Analysis of TOPSIS Technique: The Results of Change in the Weight of One Attribute on the Final Ranking of Alternatives. J. Optim. Ind. Eng. 2011, 4, 23–28. [Google Scholar]
- Jiří, M. The Robustness of TOPSIS Results Using Sensitivity Analysis Based on Weight Tuning. In Proceedings of the World Congress on Medical Physics and Biomedical Engineering 2018, Prague, Czech Republic, 3–8 June 2018; Lhotska, L., Sukupova, L., Lacković, I., Ibbott, G.S., Eds.; Springer: Singapore, 2019; pp. 83–86. [Google Scholar]
- Alinezhad, A.; Sarrafha, K.; Amini, A. Sensitivity Analysis of SAW Technique: The Impact of Changing the Decision Making Matrix Elements on the Final Ranking of Alternatives. Iran. J. Oper. Res. 2014, 5, 82–94. [Google Scholar]
- Simanaviciene, R.; Ustinovichius, L. Sensitivity Analysis for Multiple Criteria Decision Making Methods: TOPSIS and SAW. Procedia Soc. Behav. Sci. 2010, 2, 7743–7744. [Google Scholar] [CrossRef]
- Dewangan, S.; Gangopadhyay, S.; Biswas, C. Study of surface integrity and dimensional accuracy in EDM using Fuzzy TOPSIS and sensitivity analysis. Measurement 2015, 63, 364–376. [Google Scholar] [CrossRef]
- Hidayat, T.; Kurniawan, H.; Albar, A.V.; Istiqomah, D.A. Sensitivity Analysis of Decision Support Systems for Selection of Achievement Students Using the TOPSIS Method. In Proceedings of the 2023 6th International Conference of Computer and Informatics Engineering (IC2IE), Lombok, Indonesia, 14–15 September 2023; pp. 1–6. [Google Scholar] [CrossRef]
- Nibrad, G.M.; Khot, P. A sensitivity analysis approach for deterministic multi-criteria decision making methods. Int. J. Manag. IT Eng. 2013, 3, 140–177. [Google Scholar]
- Saltelli, A.; Ratto, M.; Andres, T.; Campolongo, F.; Cariboni, J.; Gatelli, D.; Saisana, M.; Tarantola, S. Global Sensitivity Analysis: The Primer; John Wiley & Sons: Hoboken, NJ, USA, 2008. [Google Scholar]
- Seo, M.; Ryu, N.; Min, S. Sensitivity Analysis for Multi-Objective Optimization of the Benchmark TEAM Problem. IEEE Trans. Magn. 2020, 56, 1–4. [Google Scholar] [CrossRef]
- Hidayat, T.; Kurniawan, H.; Astuti, I.A.; Pravitasari, R.; Kristyawan, Y.; Syahadiyanti, L. The Effect and Impact of the Electre Method for Sensitivity Testing Based on the Case Study Selection of Outstanding Students. In Proceedings of the 2022 5th International Conference of Computer and Informatics Engineering (IC2IE), Jakarta, Indonesia, 13–14 September 2022; pp. 118–122. [Google Scholar] [CrossRef]

| Reference | Methodology Used | Advantages | Limitations | Application Domain |
|---|---|---|---|---|
| 10 | Entropy-TOPSIS, SD-TOPSIS | Reduces handovers, improves user throughput | Limited to stable cellular networks | Heterogeneous cellular networks |
| 6 | MADM algorithms with utility functions | Reduces ping-pong effect and handoff failures | Lacks sensitivity analysis | Heterogeneous 4G cellular networks |
| 12 | M-ANP for weighting, TOPSIS for ranking | Reduces reversal and ping-pong effects | Lacks sensitivity analysis | Heterogeneous wireless networks |
| 13 | TS-REPLICA (Entropy-TOPSIS) | Improves load balancing and system performance | Not tested in dynamic LEO environments | Distributed computing (Hadoop) |
| 7 | Importance-TOPSIS for ranking LEO Satellites | Reduces handovers, decreases forced connection terminations | Needs adaptation to dynamic satellite environments | GEO/LEO heterogeneous satellite networks |
| 14 | Multi-attribute decision handover scheme | Reduces handover frequency, improves data stream stability | Does not address rapid performance fluctuations in LEO networks | LEO mobile satellite networks |
| 4 | PASMAD (SINR-based MADM) for access/handover | Enhances QoS, balances network loads, outperforms RSS-based methods | Lacks sensitivity analysis for SINR and bandwidth fluctuations | GEO/LEO heterogeneous satellite networks |
| 5 | User-centric handover scheme with data buffering | Improves throughput, delay, and latency | Does not adress bandwidth and latency fluctuations, lacks sensitivity analysis. | Ultra-dense LEO satellite networks |
| Satellite ID | Upload Speed [Mbps] | Download Speed [Mbps] | Ping [ms] | Packet Loss [%] |
|---|---|---|---|---|
| 1 | 10.45 | 188.94 | 49.50 | 0.01 |
| 2 | 12.72 | 220.21 | 62.67 | 0.16 |
| 3 | 13.37 | 213.23 | 62.34 | 2.88 |
| 4 | 16.04 | 221.39 | 64.16 | 19.46 |
| 5 | 14.65 | 218.55 | 47.31 | 0.01 |
| 6 | 13.57 | 226.767 | 57.13 | 3.52 |
| 7 | 14.24 | 174.59 | 60.84 | 1.28 |
| 8 | 13.39 | 226.22 | 53.19 | 13.28 |
| 9 | 16.85 | 179.44 | 65.85 | 0.48 |
| 10 | 15.36 | 208.83 | 68.96 | 19.04 |
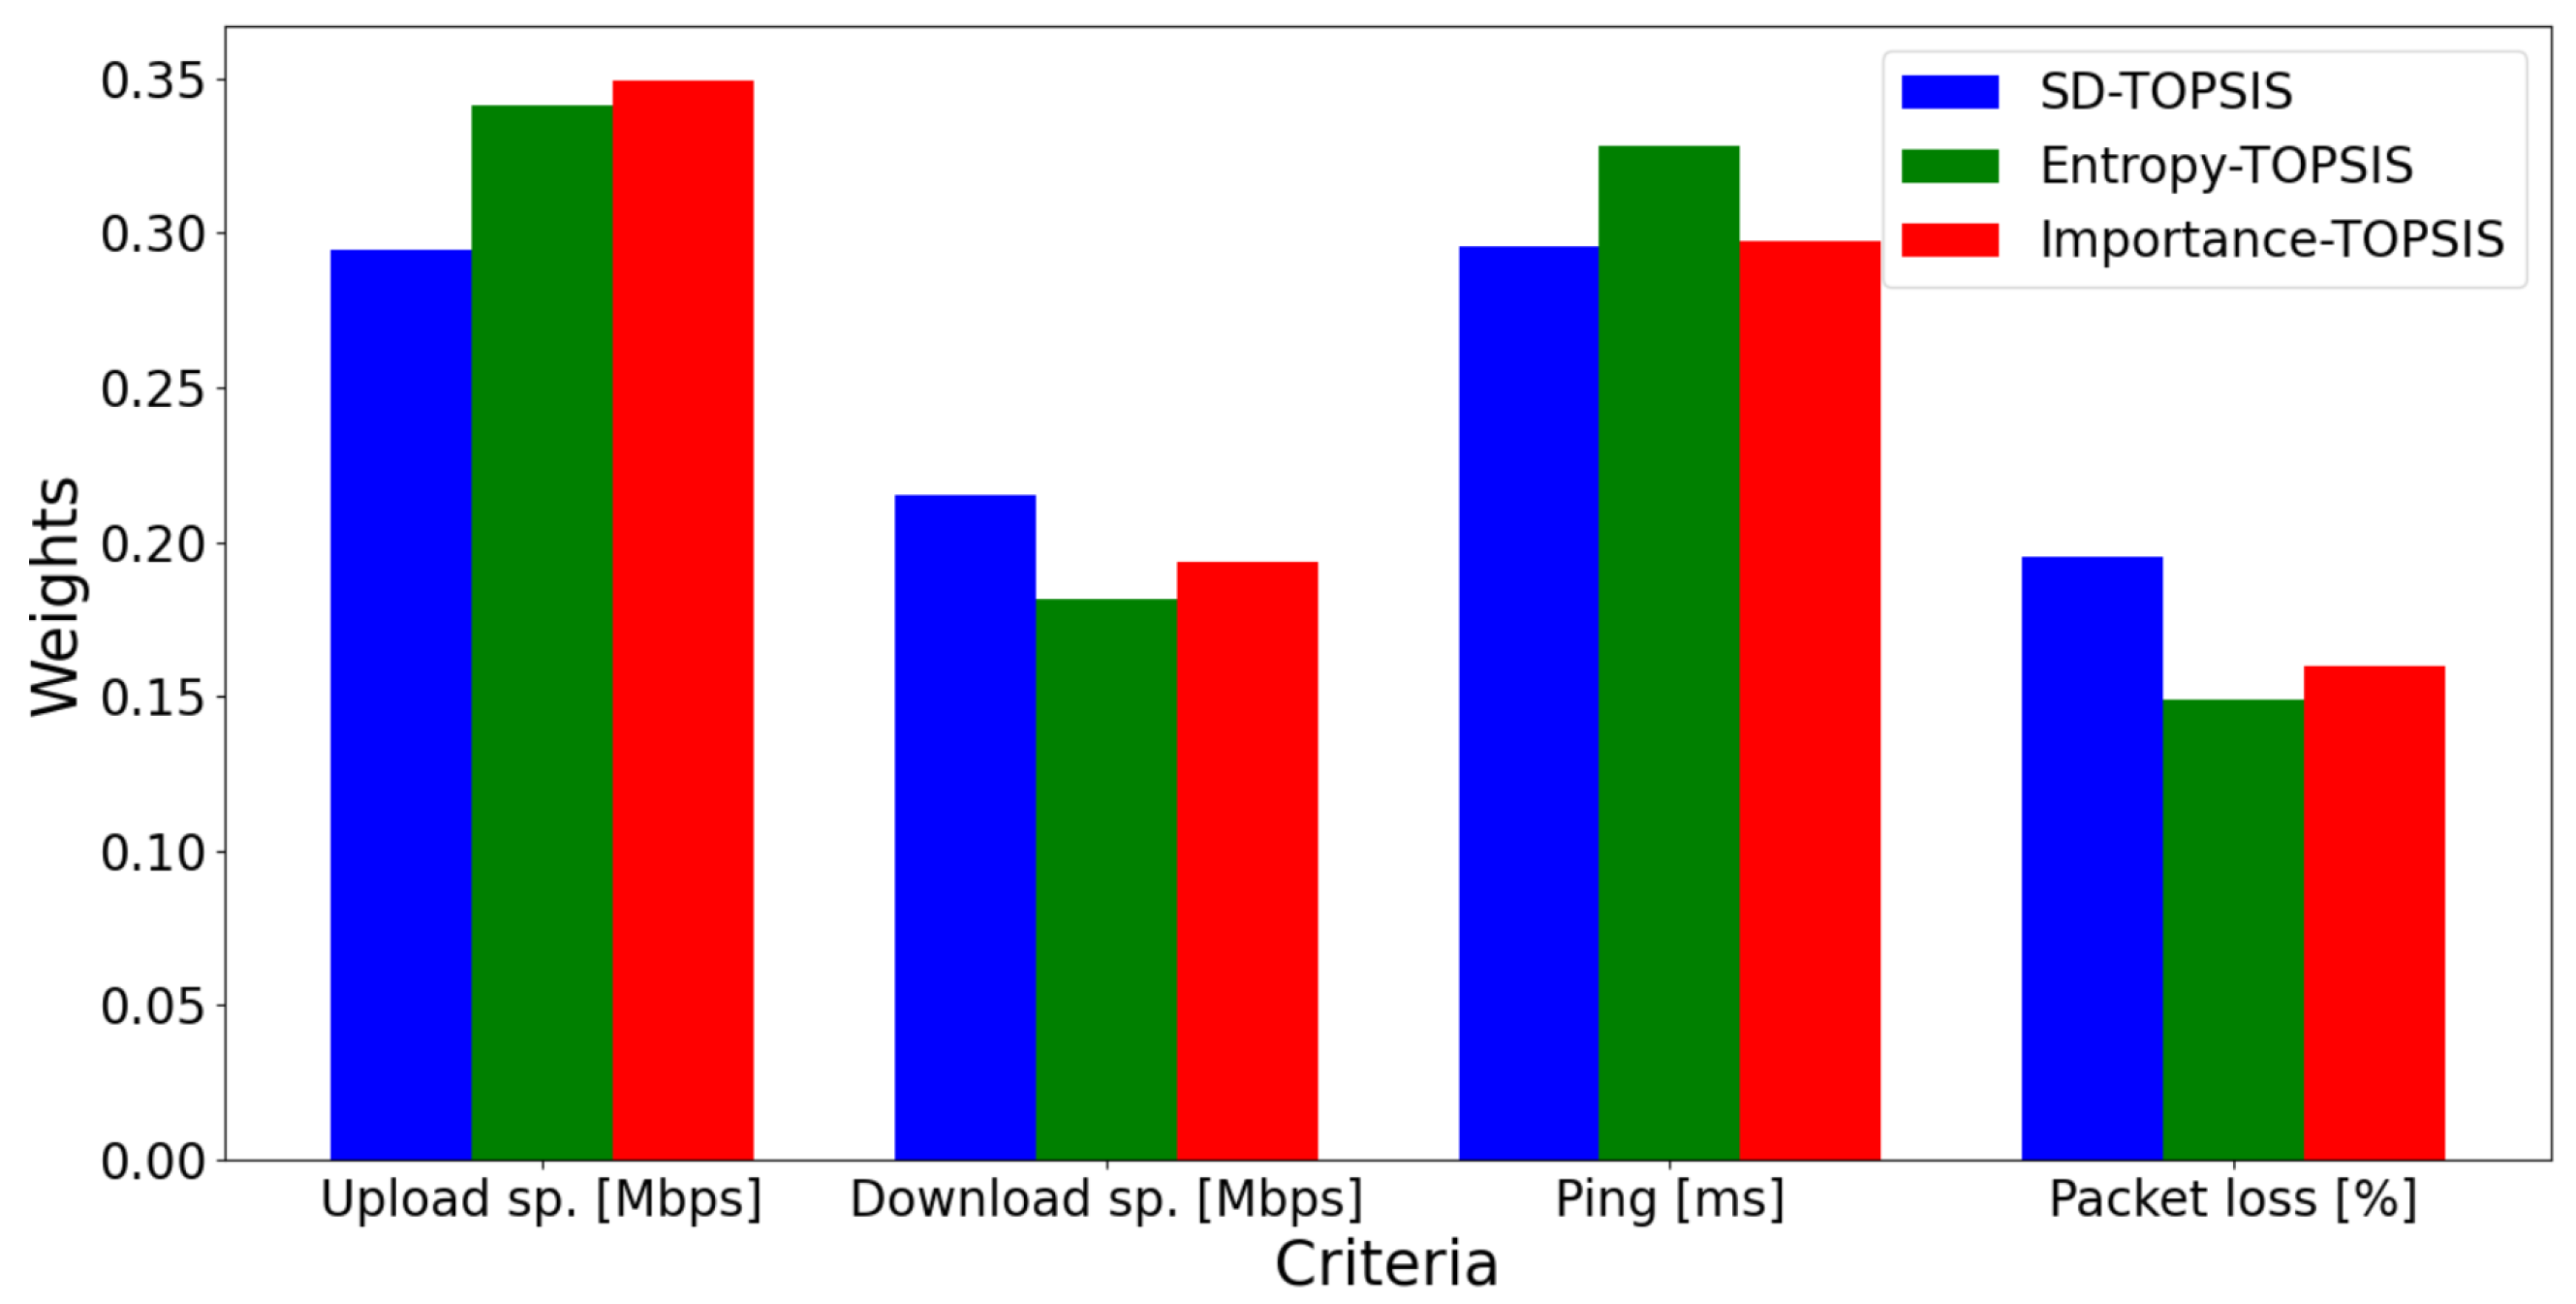
| Criteria | SD-TOPSIS | Entropy-TOPSIS | Importance-TOPSIS |
|---|---|---|---|
| Upload speed | 0.2943 | 0.3412 | 0.3493 |
| Download speed | 0.2151 | 0.1812 | 0.1935 |
| Ping | 0.2954 | 0.3282 | 0.2974 |
| Packet loss | 0.195 | 0.1492 | 0.1597 |
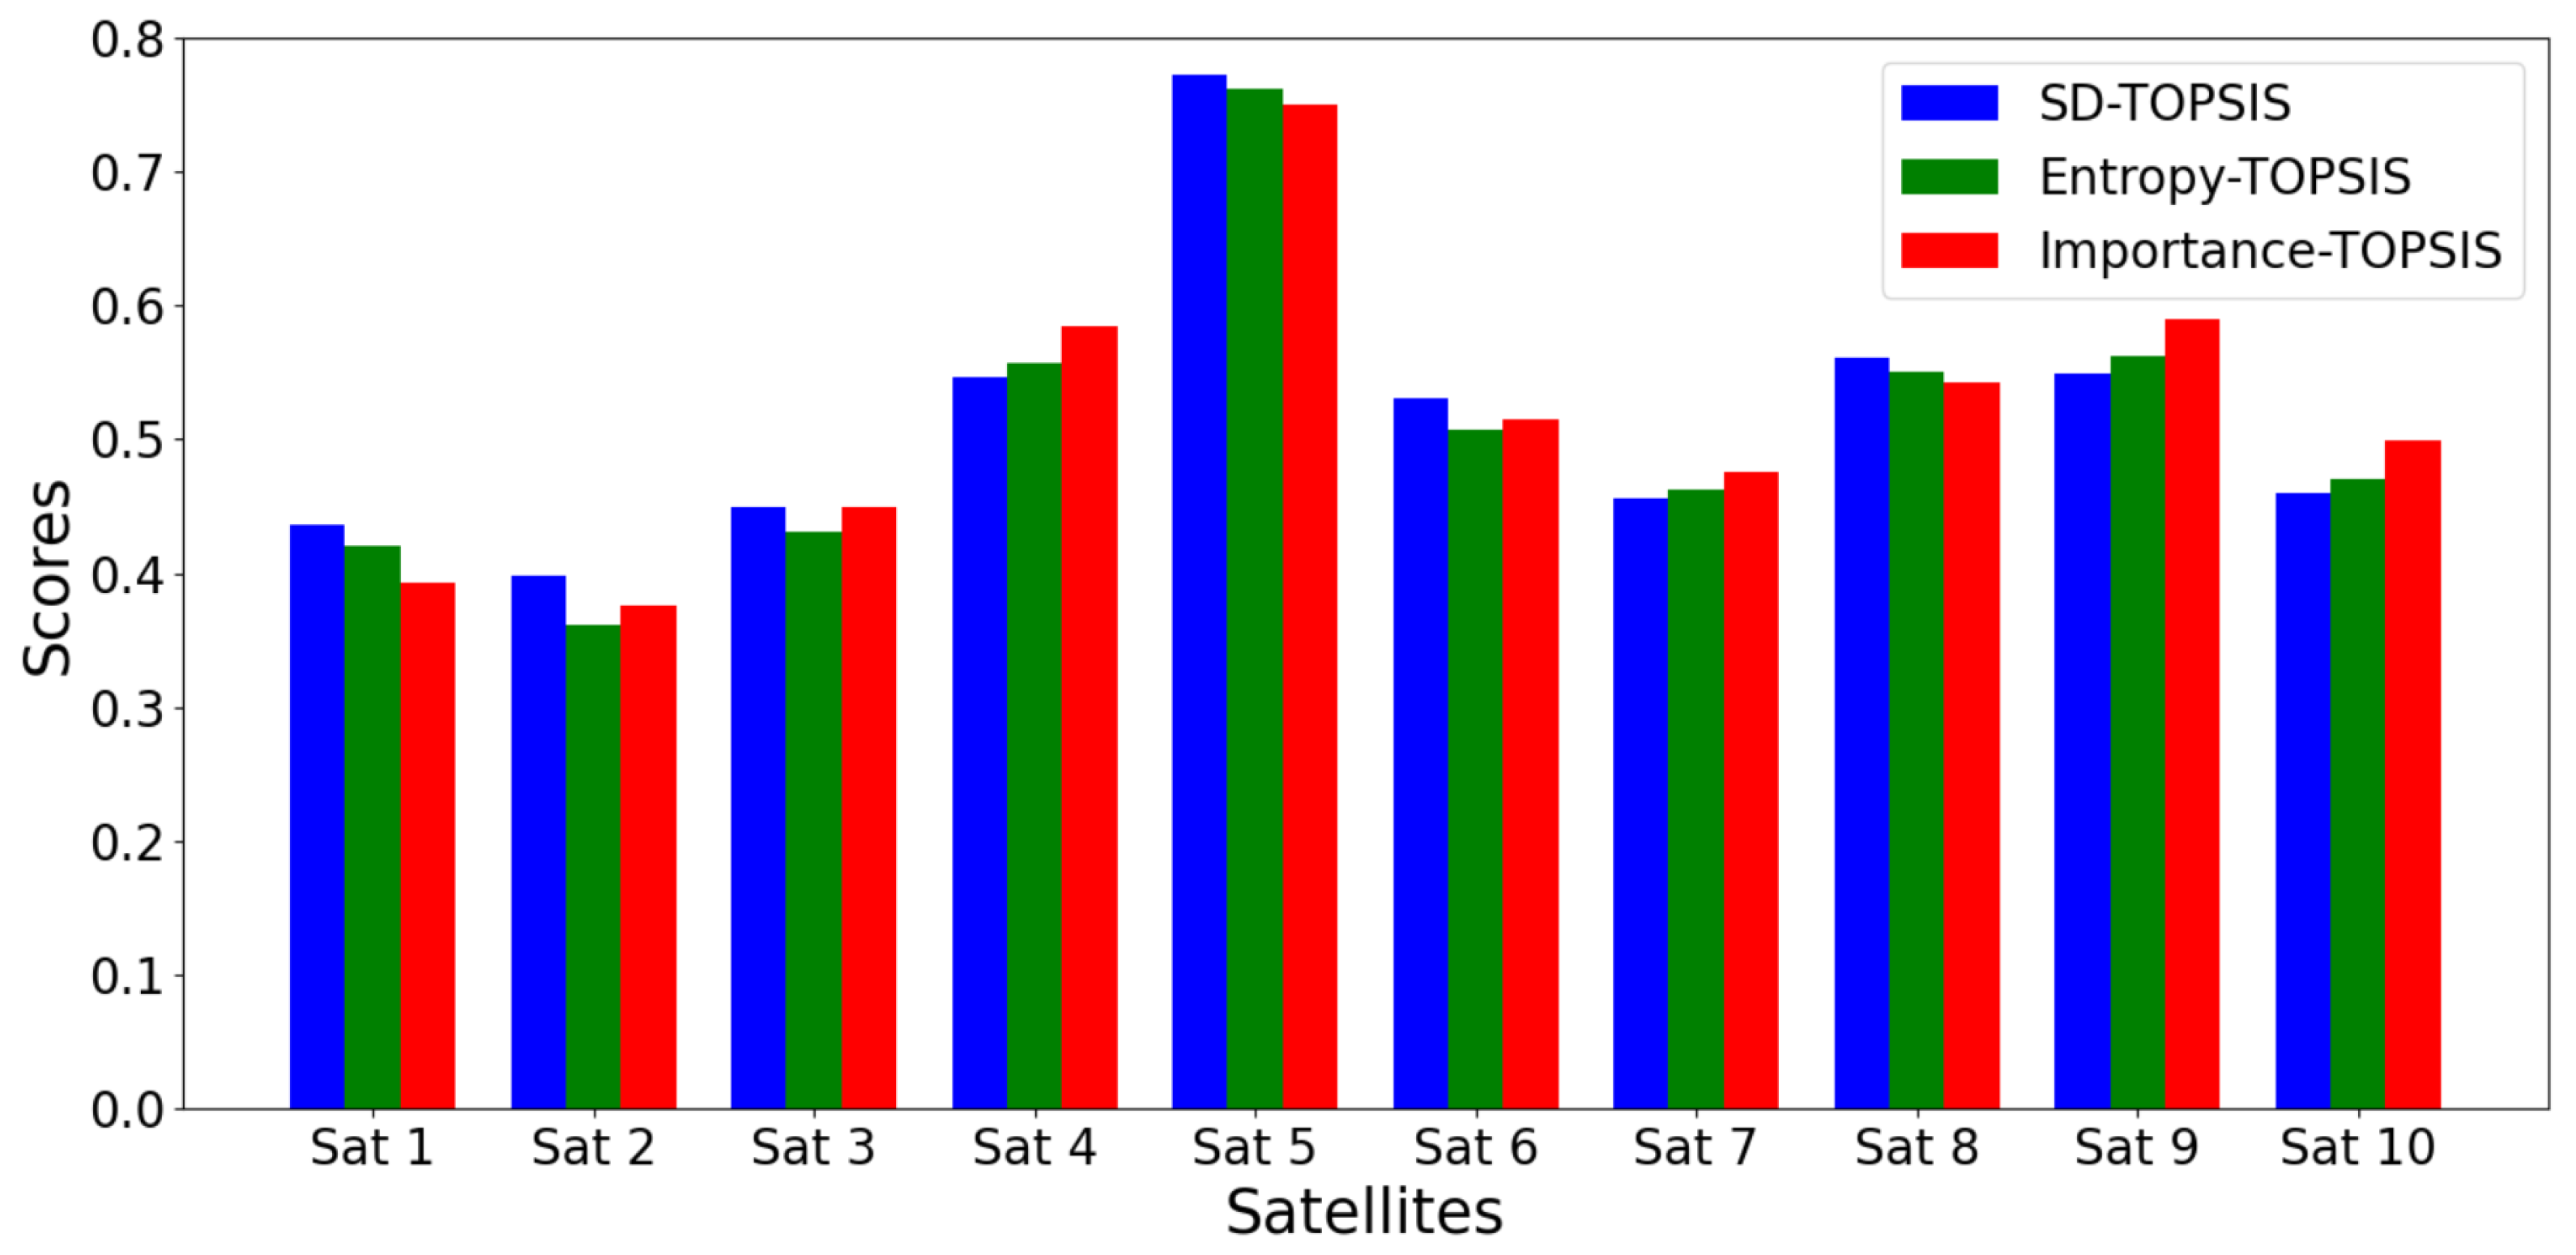
| Criteria | Sat 1 | Sat 2 | Sat 3 | Sat 4 | Sat 5 | Sat 6 | Sat 7 | Sat 8 | Sat 9 | Sat 10 |
|---|---|---|---|---|---|---|---|---|---|---|
| SD-TOPSIS | 0.43 | 0.39 | 0.42 | 0.54 | 0.77 | 0.53 | 0.45 | 0.56 | 0.55 | 0.46 |
| Entropy-TOPSIS | 0.41 | 0.36 | 0.40 | 0.56 | 0.76 | 0.50 | 0.46 | 0.54 | 0.56 | 0.47 |
| Importance-TOPSIS | 0.39 | 0.37 | 0.41 | 0.58 | 0.74 | 0.51 | 0.47 | 0.54 | 0.59 | 0.49 |
| Satellite ID | 1 | 2 | 3 | 4 | 5 | 6 | 7 | 8 | 9 | 10 |
| Variation rate (%) | 5 | −2 | −3 | −1 | 2 | 3 | 5 | −5 | 1 | 2 |
| Satellite ID | Upload Speed [Mbps] | Download Speed [Mbps] | Ping [ms] | Packet Loss [%] |
|---|---|---|---|---|
| 1 | 10.97 | 188.94 | 49.50 | 0.01 |
| 2 | 12.46 | 220.21 | 62.67 | 0.16 |
| 3 | 13.31 | 213.23 | 62.34 | 2.88 |
| 4 | 15.88 | 221.39 | 64.16 | 19.46 |
| 5 | 14.95 | 218.55 | 47.31 | 0.01 |
| 6 | 13.98 | 226.767 | 57.13 | 3.52 |
| 7 | 14.95 | 174.59 | 60.84 | 1.28 |
| 8 | 12.72 | 226.22 | 53.19 | 13.28 |
| 9 | 17.01 | 179.44 | 65.85 | 0.48 |
| 10 | 15.67 | 208.83 | 68.96 | 19.04 |
| Satellite ID | 1 | 2 | 3 | 4 | 5 | 6 | 7 | 8 | 9 | 10 |
| Variation rate (%) | 4 | −3 | −3 | −1 | 2 | 3 | 5 | −4 | 1 | 2 |
| Satellite ID | Upload Speed [Mbps] | Download Speed [Mbps] | Ping [ms] | Packet Loss [%] |
|---|---|---|---|---|
| 1 | 10.97 | 198.39 | 49.50 | 0.01 |
| 2 | 12.46 | 215.81 | 62.67 | 0.16 |
| 3 | 13.31 | 206.83 | 62.34 | 2.88 |
| 4 | 15.88 | 219.18 | 64.16 | 19.46 |
| 5 | 14.95 | 222.93 | 47.31 | 0.01 |
| 6 | 13.98 | 233.57 | 57.13 | 3.52 |
| 7 | 14.95 | 183.32 | 60.84 | 1.28 |
| 8 | 12.72 | 214.9 | 53.19 | 13.28 |
| 9 | 17.01 | 181.23 | 65.85 | 0.48 |
| 10 | 15.67 | 213.01 | 68.96 | 19.04 |
| Satellite ID | 1 | 2 | 3 | 4 | 5 | 6 | 7 | 8 | 9 | 10 |
| Variation rate (%) | −4 | 2 | 3 | 1 | −2 | −3 | −5 | 4 | −1 | −2 |
| Satellite ID | Upload Speed [Mbps] | Download Speed [Mbps] | Ping [ms] | Packet Loss [%] |
|---|---|---|---|---|
| 1 | 10.97 | 198.39 | 47.52 | 0.01 |
| 2 | 12.46 | 215.81 | 63.92 | 0.16 |
| 3 | 13.31 | 206.83 | 64.21 | 2.88 |
| 4 | 15.88 | 219.18 | 64.80 | 19.46 |
| 5 | 14.95 | 222.93 | 46.36 | 0.01 |
| 6 | 13.98 | 233.57 | 55.41 | 3.52 |
| 7 | 14.95 | 183.32 | 57.79 | 1.28 |
| 8 | 12.72 | 214.9 | 55.31 | 13.28 |
| 9 | 17.01 | 181.23 | 65.19 | 0.48 |
| 10 | 15.67 | 213.01 | 67.58 | 19.04 |
| Satellite ID | 1 | 2 | 3 | 4 | 5 | 6 | 7 | 8 | 9 | 10 |
| Variation rate (%) | −4 | 2 | 3 | 1 | −2 | −3 | −5 | 4 | −1 | −2 |
| Satellite ID | Upload Speed [Mbps] | Download Speed [Mbps] | Ping [ms] | Packet Loss [%] |
|---|---|---|---|---|
| 1 | 10.97 | 198.39 | 47.52 | 0.0096 |
| 2 | 12.46 | 215.81 | 63.92 | 0.1632 |
| 3 | 13.31 | 206.83 | 64.21 | 2.97 |
| 4 | 15.88 | 219.18 | 64.80 | 19.65 |
| 5 | 14.95 | 222.93 | 46.36 | 0.0098 |
| 6 | 13.98 | 233.57 | 55.41 | 3.4144 |
| 7 | 14.95 | 183.32 | 57.79 | 1.216 |
| 8 | 12.72 | 214.9 | 55.31 | 13.81 |
| 9 | 17.01 | 181.23 | 65.19 | 0.4752 |
| 10 | 15.67 | 213.01 | 67.58 | 18.66 |
| Scenarios | TOPSIS Variants | Satellites | |||||||||
|---|---|---|---|---|---|---|---|---|---|---|---|
| 1 | 2 | 3 | 4 | 5 | 6 | 7 | 8 | 9 | 10 | ||
| Scenario 1 | SD-TOPSIS | 0.44 | 0.36 | 0.39 | 0.51 | 0.77 | 0.53 | 0.47 | 0.49 | 0.53 | 0.45 |
| Entropy-TOPSIS | 0.43 | 0.31 | 0.36 | 0.52 | 0.76 | 0.51 | 0.48 | 0.47 | 0.55 | 0.46 | |
| Importance-TOPSIS | 0.42 | 0.33 | 0.37 | 0.53 | 0.76 | 0.52 | 0.49 | 0.47 | 0.56 | 0.47 | |
| Scenario 2 | SD-TOPSIS | 0.45 | 0.32 | 0.36 | 0.50 | 0.77 | 0.52 | 0.48 | 0.46 | 0.54 | 0.44 |
| Entropy-TOPSIS | 0.43 | 0.28 | 0.34 | 0.51 | 0.76 | 0.50 | 0.49 | 0.45 | 0.55 | 0.45 | |
| Importance-TOPSIS | 0.42 | 0.31 | 0.35 | 0.53 | 0.76 | 0.52 | 0.49 | 0.45 | 0.55 | 0.47 | |
| Scenario 3 | SD-TOPSIS | 0.49 | 0.29 | 0.32 | 0.46 | 0.78 | 0.53 | 0.50 | 0.39 | 0.51 | 0.42 |
| Entropy-TOPSIS | 0.50 | 0.24 | 0.29 | 0.45 | 0.78 | 0.50 | 0.50 | 0.38 | 0.50 | 0.41 | |
| Importance-TOPSIS | 0.42 | 0.31 | 0.35 | 0.53 | 0.76 | 0.52 | 0.49 | 0.45 | 0.55 | 0.47 | |
| Scenario 4 | SD-TOPSIS | 0.51 | 0.30 | 0.31 | 0.45 | 0.78 | 0.54 | 0.52 | 0.36 | 0.52 | 0.42 |
| Entropy-TOPSIS | 0.51 | 0.26 | 0.29 | 0.44 | 0.78 | 0.52 | 0.52 | 0.37 | 0.51 | 0.41 | |
| Importance-TOPSIS | 0.46 | 0.29 | 0.32 | 0.49 | 0.76 | 0.54 | 0.53 | 0.36 | 0.55 | 0.45 | |
| Satellite ID | 1 | 2 | 3 | 4 | 5 | 6 | 7 | 8 | 9 | 10 |
| Variation rate (%) | 10 | −5 | −6 | −1 | 2 | 3 | 10 | −10 | 1 | 2 |
| Satellite ID | Upload Speed [Mbps] | Download Speed [Mbps] | Ping [ms] | Packet Loss [%] |
|---|---|---|---|---|
| 1 | 11.49 | 188.94 | 49.50 | 0.01 |
| 2 | 12.08 | 220.21 | 62.67 | 0.16 |
| 3 | 12.56 | 213.23 | 62.34 | 2.88 |
| 4 | 15.88 | 221.39 | 64.16 | 19.46 |
| 5 | 14.94 | 218.55 | 47.31 | 0.01 |
| 6 | 13.97 | 226.767 | 57.13 | 3.52 |
| 7 | 15.66 | 174.59 | 60.84 | 1.28 |
| 8 | 12.05 | 226.22 | 53.19 | 13.28 |
| 9 | 17.02 | 179.44 | 65.85 | 0.48 |
| 10 | 15.66 | 208.83 | 68.96 | 19.04 |
| Satellite ID | 1 | 2 | 3 | 4 | 5 | 6 | 7 | 8 | 9 | 10 |
| Variation rate (%) | 10 | −6 | −1 | 2 | 3 | 10 | −10 | 1 | 2 |
| Satellite ID | Upload Speed [Mbps] | Download Speed [Mbps] | Ping [ms] | Packet Loss [%] |
|---|---|---|---|---|
| 1 | 11.49 | 207.84 | 49.50 | 0.01 |
| 2 | 12.08 | 209.2 | 62.67 | 0.16 |
| 3 | 12.56 | 200.44 | 62.34 | 2.88 |
| 4 | 15.88 | 219.18 | 64.16 | 19.46 |
| 5 | 14.94 | 222.93 | 47.31 | 0.01 |
| 6 | 13.97 | 233.57 | 57.13 | 3.52 |
| 7 | 15.66 | 192.05 | 60.84 | 1.28 |
| 8 | 12.05 | 203.59 | 53.19 | 13.28 |
| 9 | 17.02 | 181.23 | 65.85 | 0.48 |
| 10 | 15.66 | 213.01 | 68.96 | 19.04 |
| Satellite ID | 1 | 2 | 3 | 4 | 5 | 6 | 7 | 8 | 9 | 10 |
| Variation rate (%) | −10 | 5 | 6 | 1 | −2 | −3 | −10 | 10 | −1 | −2 |
| Satellite ID | Upload Speed [Mbps] | Download Speed [Mbps] | Ping [ms] | Packet Loss [%] |
|---|---|---|---|---|
| 1 | 11.49 | 207.84 | 44.55 | 0.01 |
| 2 | 12.08 | 209.2 | 65.80 | 0.16 |
| 3 | 12.56 | 200.44 | 66.08 | 2.88 |
| 4 | 15.88 | 219.18 | 64.80 | 19.46 |
| 5 | 14.94 | 222.93 | 46.36 | 0.01 |
| 6 | 13.97 | 233.57 | 55.41 | 3.52 |
| 7 | 15.66 | 192.05 | 54.75 | 1.28 |
| 8 | 12.05 | 203.59 | 58.51 | 13.28 |
| 9 | 17.02 | 181.23 | 65.19 | 0.48 |
| 10 | 15.66 | 213.01 | 67.58 | 19.04 |
| Satellite ID | 1 | 2 | 3 | 4 | 5 | 6 | 7 | 8 | 9 | 10 |
| Variation rate (%) | −10 | 5 | 6 | 1 | −2 | −3 | −10 | 10 | −1 | −2 |
| Satellite ID | Upload Speed [Mbps] | Download Speed [Mbps] | Ping [ms] | Packet Loss [%] |
|---|---|---|---|---|
| 1 | 11.49 | 207.84 | 44.55 | 0.009 |
| 2 | 12.08 | 209.2 | 65.80 | 0.168 |
| 3 | 12.56 | 200.44 | 66.08 | 3.0528 |
| 4 | 15.88 | 219.18 | 64.80 | 19.65 |
| 5 | 14.94 | 222.93 | 46.36 | 0.0098 |
| 6 | 13.97 | 233.57 | 55.41 | 3.4744 |
| 7 | 15.66 | 192.05 | 54.75 | 1.152 |
| 8 | 12.05 | 203.59 | 58.51 | 14.61 |
| 9 | 17.02 | 181.23 | 65.19 | 0.4752 |
| 10 | 15.66 | 213.01 | 67.58 | 18.66 |
| Scenarios | TOPSIS Variants | Satellites | |||||||||
|---|---|---|---|---|---|---|---|---|---|---|---|
| 1 | 2 | 3 | 4 | 5 | 6 | 7 | 8 | 9 | 10 | ||
| Scenario 1 | SD-TOPSIS | 0.45 | 0.32 | 0.32 | 0.50 | 0.76 | 0.51 | 0.51 | 0.43 | 0.53 | 0.44 |
| Entropy-TOPSIS | 0.42 | 0.26 | 0.27 | 0.52 | 0.74 | 0.48 | 0.53 | 0.39 | 0.56 | 0.46 | |
| Importance-TOPSIS | 0.46 | 0.30 | 0.30 | 0.49 | 0.76 | 0.50 | 0.50 | 0.44 | 0.52 | 0.43 | |
| Scenario 2 | SD-TOPSIS | 0.46 | 0.27 | 0.28 | 0.49 | 0.75 | 0.50 | 0.53 | 0.38 | 0.53 | 0.43 |
| Entropy-TOPSIS | 0.42 | 0.21 | 0.24 | 0.51 | 0.74 | 0.47 | 0.55 | 0.36 | 0.56 | 0.46 | |
| Importance-TOPSIS | 0.47 | 0.26 | 0.26 | 0.48 | 0.76 | 0.50 | 0.51 | 0.40 | 0.51 | 0.42 | |
| Scenario 3 | SD-TOPSIS | 0.56 | 0.20 | 0.20 | 0.41 | 0.77 | 0.48 | 0.55 | 0.24 | 0.46 | 0.37 |
| Entropy-TOPSIS | 0.57 | 0.14 | 0.15 | 0.38 | 0.78 | 0.45 | 0.54 | 0.23 | 0.44 | 0.35 | |
| Importance-TOPSIS | 0.55 | 0.20 | 0.19 | 0.42 | 0.77 | 0.49 | 0.55 | 0.24 | 0.46 | 0.38 | |
| Scenario 4 | SD-TOPSIS | 0.59 | 0.22 | 0.20 | 0.38 | 0.76 | 0.50 | 0.60 | 0.21 | 0.48 | 0.35 |
| Entropy-TOPSIS | 0.60 | 0.19 | 0.18 | 0.36 | 0.77 | 0.47 | 0.58 | 0.21 | 0.46 | 0.33 | |
| Importance-TOPSIS | 0.58 | 0.23 | 0.21 | 0.39 | 0.76 | 0.51 | 0.59 | 0.21 | 0.48 | 0.36 | |
Disclaimer/Publisher’s Note: The statements, opinions and data contained in all publications are solely those of the individual author(s) and contributor(s) and not of MDPI and/or the editor(s). MDPI and/or the editor(s) disclaim responsibility for any injury to people or property resulting from any ideas, methods, instructions or products referred to in the content. |
© 2025 by the authors. Licensee MDPI, Basel, Switzerland. This article is an open access article distributed under the terms and conditions of the Creative Commons Attribution (CC BY) license (https://creativecommons.org/licenses/by/4.0/).
Share and Cite
Buhinyori Ngango, P.; Lufua Binda, M.-L.; Matalatala Tamasala, M.; Sedi Nzakuna, P.; Paciello, V.; Kuti Lusala, A. Evaluation of TOPSIS Algorithm for Multi-Criteria Handover in LEO Satellite Networks: A Sensitivity Analysis. Network 2025, 5, 15. https://doi.org/10.3390/network5020015
Buhinyori Ngango P, Lufua Binda M-L, Matalatala Tamasala M, Sedi Nzakuna P, Paciello V, Kuti Lusala A. Evaluation of TOPSIS Algorithm for Multi-Criteria Handover in LEO Satellite Networks: A Sensitivity Analysis. Network. 2025; 5(2):15. https://doi.org/10.3390/network5020015
Chicago/Turabian StyleBuhinyori Ngango, Pascal, Marie-Line Lufua Binda, Michel Matalatala Tamasala, Pierre Sedi Nzakuna, Vincenzo Paciello, and Angelo Kuti Lusala. 2025. "Evaluation of TOPSIS Algorithm for Multi-Criteria Handover in LEO Satellite Networks: A Sensitivity Analysis" Network 5, no. 2: 15. https://doi.org/10.3390/network5020015
APA StyleBuhinyori Ngango, P., Lufua Binda, M.-L., Matalatala Tamasala, M., Sedi Nzakuna, P., Paciello, V., & Kuti Lusala, A. (2025). Evaluation of TOPSIS Algorithm for Multi-Criteria Handover in LEO Satellite Networks: A Sensitivity Analysis. Network, 5(2), 15. https://doi.org/10.3390/network5020015